Article

Ensuring the Safety Sustainability of Large UAS: Learning from the Maintenance Risk Dynamics of USAF MQ-1 Predator Fleet in Last Two Decades

1
Department of Automation, School of Electronic Information and Electrical Engineering, Shanghai Jiao Tong University, 800 Dongchuan Road, Shanghai 200240, China
2
Department of Information Systems, School of Management, Shanghai University, 99 Shangda Road, Shanghai 200444, China
3
School of Transportation Science and Engineering, Beihang University, 37 Xueyuan Road, Beijing 100191, China
*
Author to whom correspondence should be addressed.
Sustainability 2019, 11(4), 1129; https://doi.org/10.3390/su11041129
Submission received: 28 December 2018 / Revised: 31 January 2019 / Accepted: 15 February 2019 / Published: 21 February 2019
(This article belongs to the Special Issue Sustainability Issues in Aviation)

Abstract

:
The mishap statistics of large military unmanned aerial systems (UAS) reveal that human errors and organizational flaws pose great threats to their operation safety, especially considering the future application of derived civilian types. Moreover, maintenance accidents due to human factors have reached a significant level, but have received little attention in the existing research. To ensure the safety and sustainability of large UAS, we propose a system dynamics approach to model the maintenance risk mechanisms involving organizational, human, and technical factors, which made a breakthrough in the traditional event-chain static analysis method. Using the United States Air Force (USAF) MQ-1 Predator fleet case, the derived time-domain simulation represented the risk evolution process of the past two decades and verified the rationality of the proposed model. It was identified that the effects of maintainer human factors on the accident rate exceeded those of the technical systems in a long-term view, even though the technical reliability improvements had obvious initial effects on risk reduction. The characteristics of maintainer errors should be considered in system and maintenance procedure design to prevent them in a proactive way. It is also shown that the approach-derived SD model can be developed into a semi-quantitative decision-making support tool for improving the safety of large UAS in a risk-based view of airworthiness.

1. Introduction

The unmanned aerial system (UAS) is constructed by the unmanned aerial vehicle (UAV), ground control station, data links, and recovery and launch system [1]. It is the application representative of autonomous technologies in the field of aviation. The United States Department of Defense (DoD) and the United States Federal Aviation Administration (FAA) defined this term in 2005 according to their Unmanned Aircraft System Roadmap in that year [2]; then, the International Civil Aviation Organization (ICAO) and the British Civil Aviation Authority (CAA) adopted it later [3]. The early operation of UAS was implemented by military planners to carry out reconnaissance and/or attack missions. Thanks to UAS’s convenience and low-cost characteristics, the use of UAS was rapidly expanding to more civil domains. They now have outnumbered military UAVs vastly, with estimations of over several millions per year [4]. However, the widespread UASs threaten airspace security in numerous ways, including unintentional collisions with the population and other manned aircrafts. Indeed, in terms of quantity, most members of the civil drone family are quadcopter types or short-scale fixed-wing designs operated under a direct visual line of sight, which have relatively low impact energy and a limited remote range. In contrast, although they remain as an overarching concern for most aviation authorities worldwide, the most significant risks to public safety come from the operations of those large UASs that feature a bigger size/weight, long endurance, high speed, and large payload. The majority are military types, but there are also even derived civil types with similar configurations. For example, MQ-4C Triton, a variant of RQ-4 Global Hawk, has been under development for civilian use. It weighs more than 14000 kg (equal to a Gulfstream G150 business jet) and is able to fly 32 h at 180,000 m. The large UASs are performing tasks such as disaster relief, environmental conservation, and cargo transports. Under such application cases, when considering their potential integration with manned airspace in the future, the emphasis on UAS safety is attracting increased attention from civil aviation regulators of countries with dense commercial airlines.
According to the statistics of the United States (US) Office of the Secretary of Defense (OSD) since 2003, the average Class A mishap rate per 100,000 h of the large military UASs was an order of magnitude higher than the manned aircraft [5]. From 2004 to 2006, 20% of Class A mishaps (i.e., causing the total loss valued above $100 million or causalities) of the US Air Force (USAF) can be attributed to its large UAS fleet, the MQ-1 Predator UAS (the maximum take-off weight is about 1000 kg), which had 21 mishaps in total, and 17 vehicles that were completely destroyed. Moreover, in the single year of 2015, the MQ-1 Class A mishaps comprised about 57% percent of the total Class A mishaps of the USAF, and a growth acceleration of the scale has been seen. In this case, the current safety level of civil UASs cannot satisfy the airworthiness requirement of one Class A mishap per 100,000 h that has been proposed by some aviation authorities, which challenges the UAS safety engineering in the future. In order to ensure the safety of aviation activities, researchers have been conducting statistical analyses over aviation accident risk factors since the 1980s, realizing an overall safety trend: with the increasing of operation frequency and the accumulation of operation time, the reliability of the technical system was continuously improved, which induced the accidents caused by human and organizational factors to become more and more obvious. Facing this, theories on risk mechanisms involving non-technical factors were raised and have been applied on the high risk UAS accident analysis and safety improvement by using the event-chain model as a framework, such as the Human Factors Analysis and Classification System (HFACS), which was derived from the famous Swiss Cheese Model in the 1990s and has resulted in a decrease in the aviation accident rate [6,7]. Using the USAF MQ-1 Predator fleet as a case, after the application of the HFACS in 2001, its Class A accident rate of 10,000 cumulative flight hours changed from 43.9 (2001) to eight (2011); however, it maintained a stable level of seven to eight thereafter. Such a trend shows that although the probability-based risk theories truly have initial effects on risk reduction, their component failure-based vision still has embedded roots in static and linear safety philosophy, and can hardly address accident causality involving interactive complexity. Facing this, other researchers in this field have made efforts to develop extensive techniques to investigate human reliability factors such as Petri nets, the dynamic Bayesian network, and statecharts [8,9,10]. However, these methods can not address the dynamic processes of risk transferring, especially in human and organizational levels. With a view of systems theories, it is the development of the working environment, process, and infrastructure that enables the consideration of human factors to support the success of operations in the long term, and the sustainability of human factors is important, especially in the field of aviation [11,12].
In this paper, in order to achieve sustainable improvement in the safety of large UAS in operation, we seek to take dynamic and coupling interactions of risk factors between technical and non-technical systems over time into account. Such multi-level relationships involving organizational, human, and technical systems in terms of feedbacks were analyzed based on a system dynamics (SD) approach. Due to the maintenance errors suffering a great number of causal factors in catastrophic UAS accidents, flawed maintenance-induced safety risk was chosen as a research case to analyze the potential risk dynamic mechanism in SD view. Learning from the maintenance risk dynamics of the USAF MQ-1 Predator fleet in last two decades, a qualitative SD simulation in a time domain was implemented to generate strategy recommendations that aimed to reduce the large UAS catastrophic accident rate and guarantee the UAS airworthiness in future civil operation.

2. Materials and Methods

System dynamics (SD) was created by Jay Forrester in the 1960s, and was originally known as industrial dynamics. The purpose of SD modeling is to understand and control problematic system behaviors, as it has the ability to facilitate understanding of the relationship between a system’s behavior over time and its underlying structure, strategy, and policies [13]. System dynamics is grounded in control theory and the modern theory of non-linear dynamics. It is also designed to be a practical tool that policy makers can use to help them solve the pressing problems that they confront in their organizations [14]. The kernel of SD modeling is to construct multiple feedback loops for characterizing the interactive behaviors of complex systems, especially providing new insights into organizational risk issues such as aerospace, transportation, the chemical industry, and environmental engineering [15,16,17,18,19]. Understanding the nature and stability of such dynamics to enhance the systems thinking is often the purpose of a SD model. To deal with the dynamic complexity of organizational safety, SD provides a framework for modeling the unobviously related cause and effect, and draws on cognitive and social psychology, organization theory, and technical engineering processes [20,21,22,23,24,25].

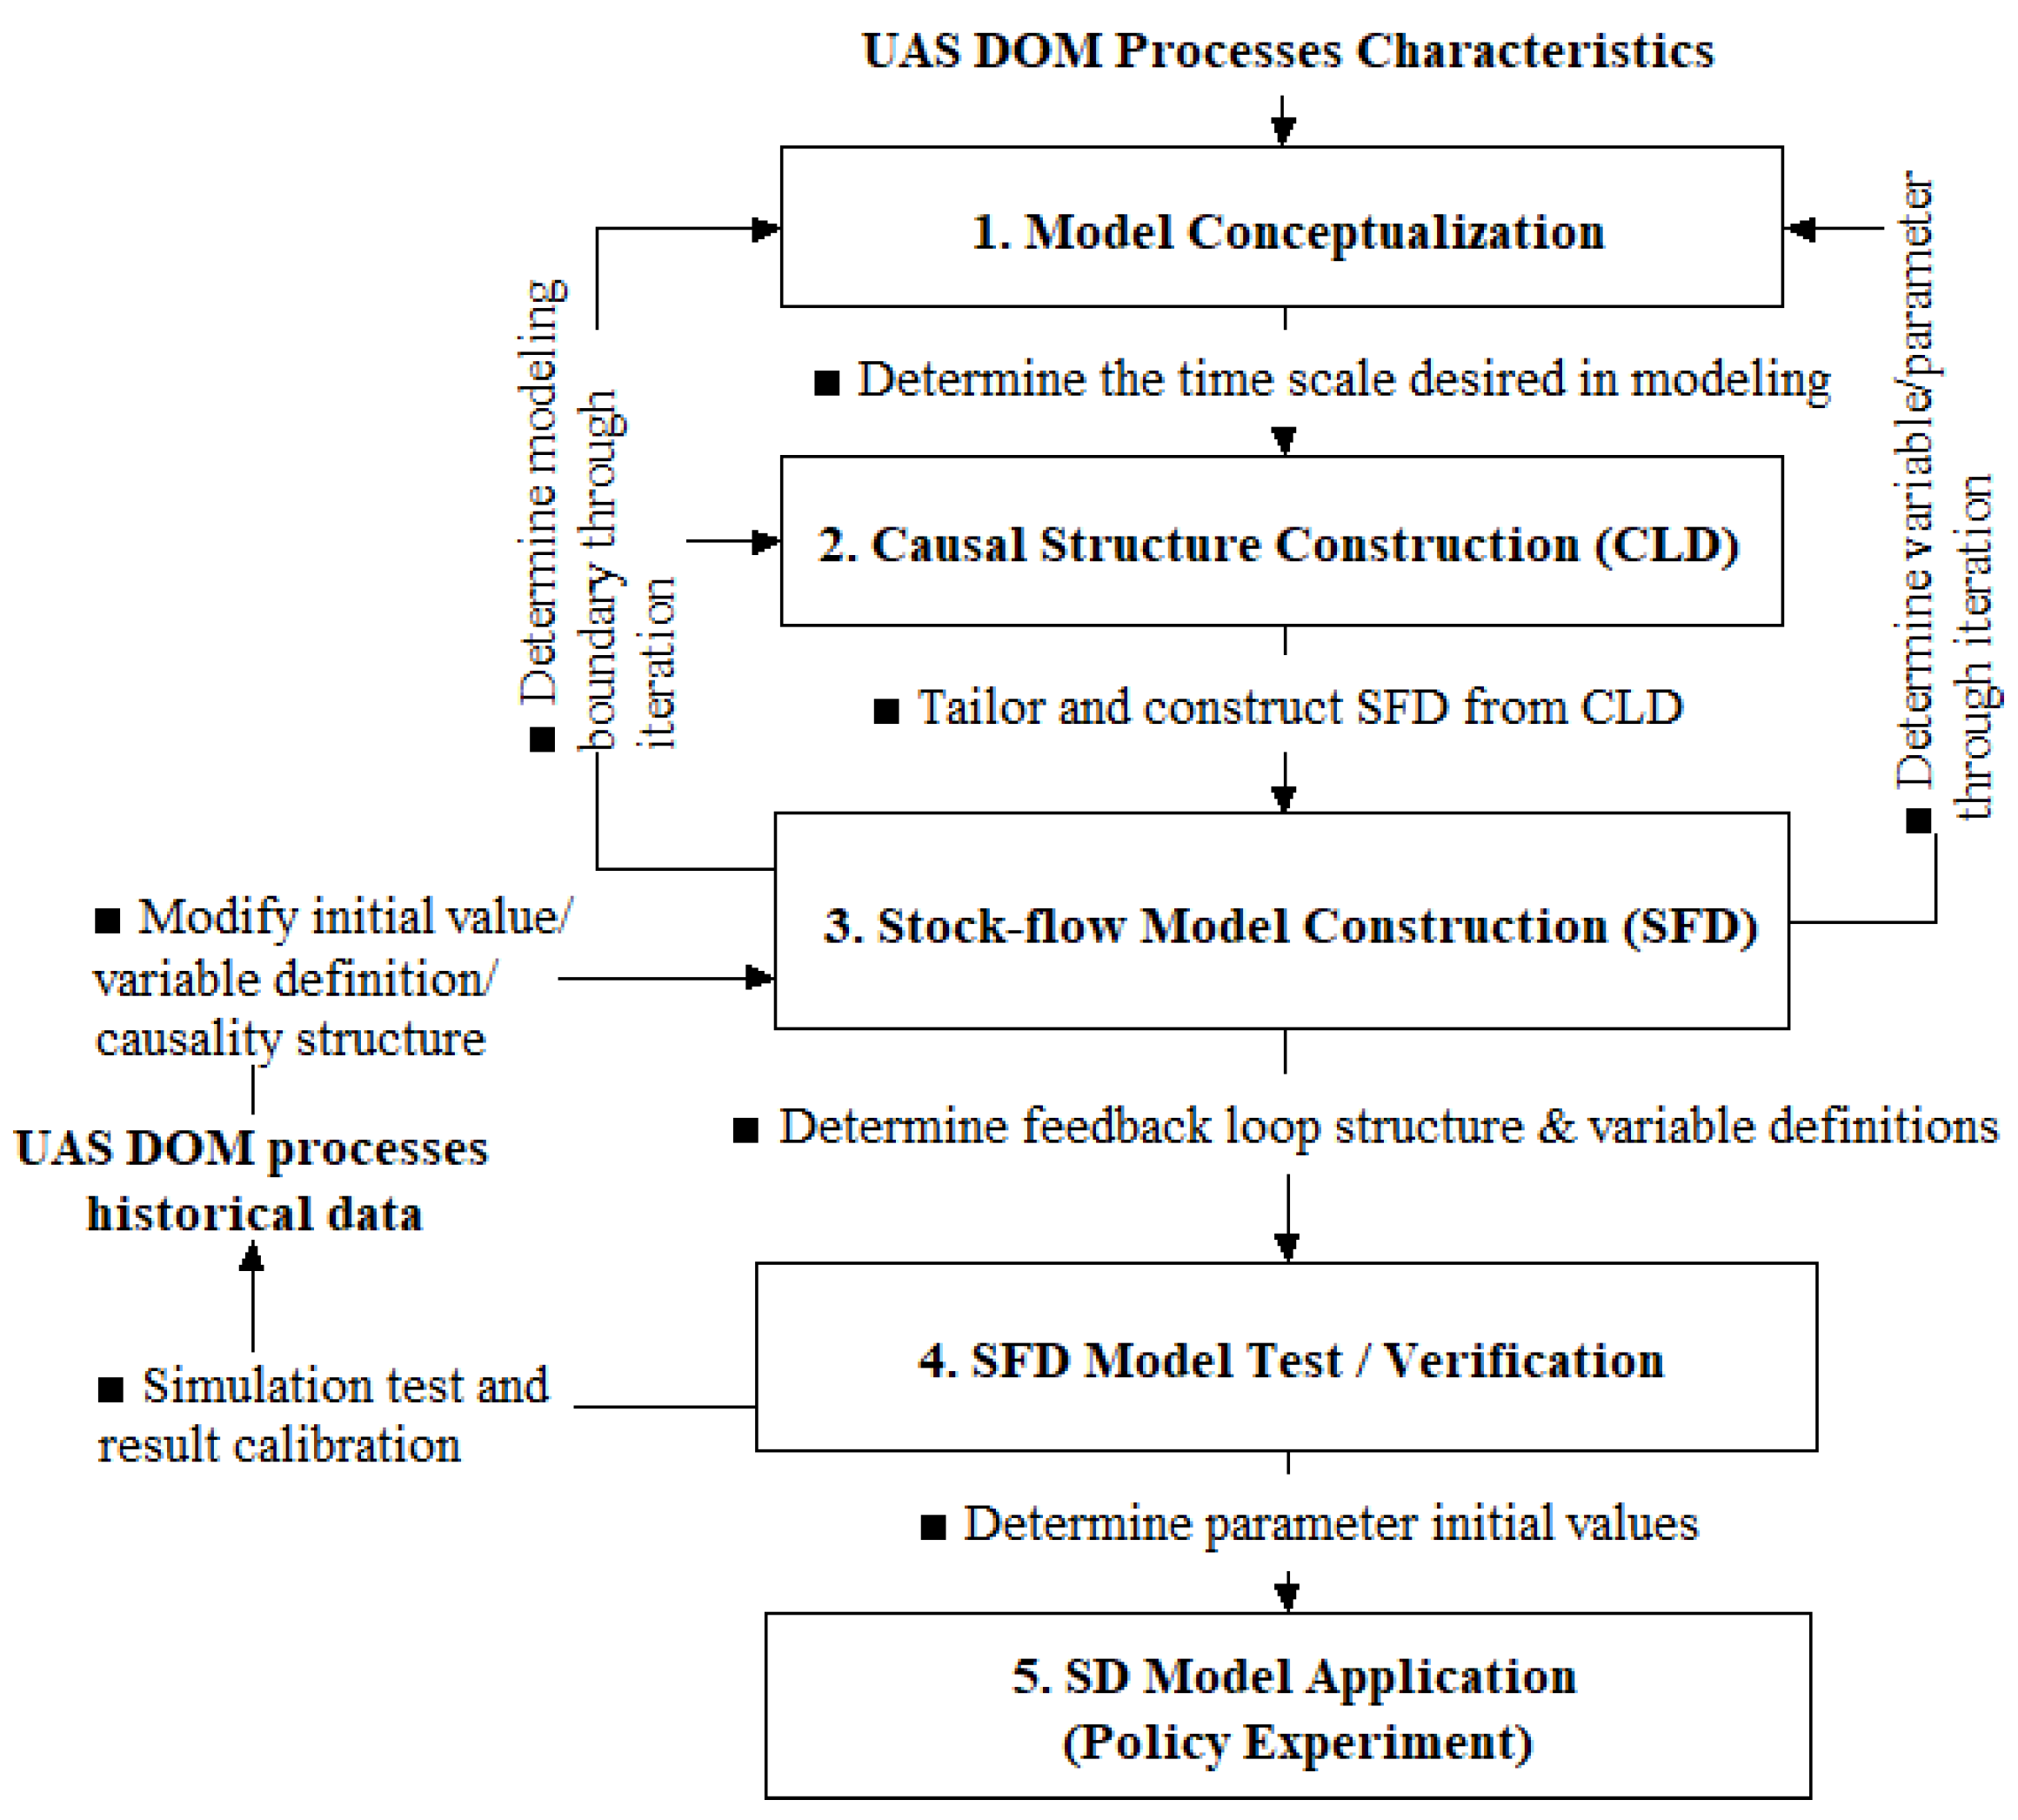
2.1. Model Conceptualization

A causal loop diagram identifies important causal relationships concerning the focal problem. It is a simplified representation of how a social–technical system works in reality. To generate behavior over time, the causal linkages form feedback loops that are the driving forces of the system behavior. Two fundamental types of feedback loops have been identified: reinforcing loops that strengthen change (loop “R” in Figure 1), and balancing loops that seek balance (loop “B” in Figure 1). As Figure 1 shows, the links with polarity denote the causal relationship between two variables, showing how the effect changes in response to the change in cause alone. A positive link (+) means that the effect and the cause change in the same direction, while a negative link (−) means that the effect and the cause change in opposite directions.

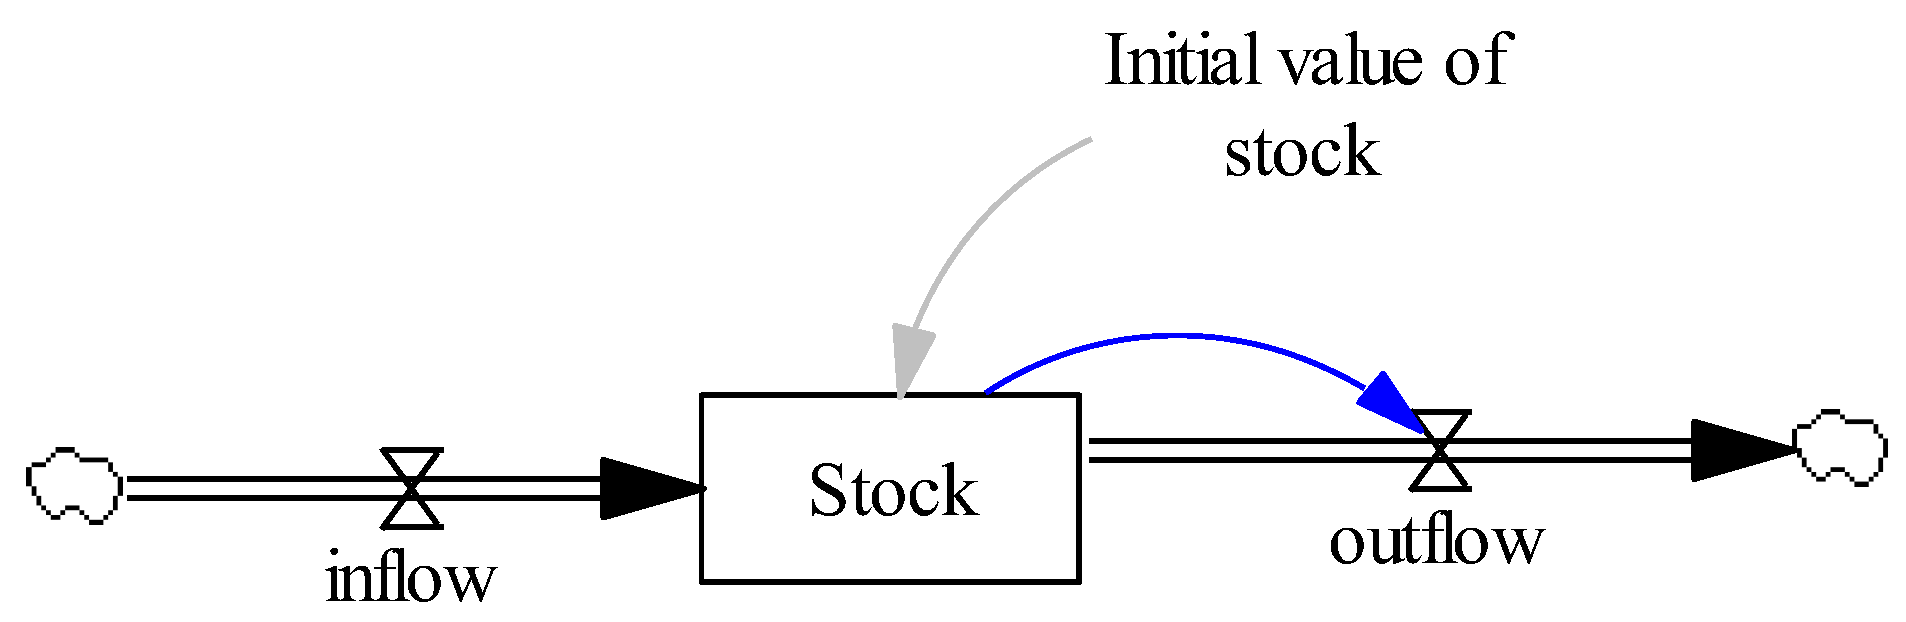
2.2. Model Formalization

Stock and flow form a model structure that captures the accumulation and delay effect in a real system. Stock variables represent the state of the system, e.g., the population of maintenance staff. Stock variables (S) change only through the accumulation of flow variables (F). Flow variables represent the changing speed of stock variables, as shown in Figure 2. For example, recruitment is the inflow to maintenance staff population; reassignment and retirement are the outflows to this stock. Maintenance staff will increase faster when more people are recruited. When more people resign or retire, the maintenance staff will decrease faster. Although stock variables change solely based on flow variables, stocks provide a basis for action, which might affect the flow variables. For instance, when there are not enough maintenance staff, managers will decide to recruit more people, thus increasing the inflow and gradually changing the stock. This is an example of a balancing feedback structure that helps the organization keep enough maintenance staff. Moreover, as stock variables cannot be changed instantly, they raise or drop gradually, thus causing the delay effect in the system, e.g., the time needed for the maintainer training. Other variables, such as auxiliary variables (A, endogenous variables that change constantly) and constants (C, exogenous variables that do not change, such as initial maintainer population) are also used in model formalization. A complex system composing multiple feedback loops with related internal stock and flow structures is bound to produce non-linear behavior, which is hard to understand. The SD approach helps explain how such behavior is generated by the underlining model structure. Regarding the modeling blocks and basic elements used in modeling, the interested reader is referred to the author’s earlier publication for more detail (for example, see [20]).
In this study, the SD modeling on the UAS maintenance safety risks: (1) adopts hierarchical causality loops to realize the method of the coding scheme on risk dynamics modeling, based on the literature and expert inputs in the systems theoretic view; (2) collects the large UAS historical operation and maintenance data for the case study and detailed model validity tests. SD modeling also considered the safety involved in UAS development–operation–maintenance (DOM) processes as a whole, and a general modeling process was characterized by five main steps, as Figure 3 shows.
Step 1: Model conceptualization. In this study, the critical risk factors with embedded roots in UAS DOM processes were identified. The sources of data mainly included: accessible accident statistics data, engineering assumptions, and proposed organization behavior modes raised by the literature.
Step 2: Causal structure construction. In this phase, the causal loop diagram (CLD) was developed to draw the critical interactions involving the underlying UAS accident causation. The reinforcing and balancing feedback loop (R/B) structure-based conceptual model was used to describe the dynamic influences of risk factors on large UAS catastrophic accidents. The detailed CLD modeling process is introduced in Section 3.2.
Step 3: Stock flow model construction. Grounded in the historic data of large UAS operations, the corresponding variable/parameter equations were defined, and the stock flow diagram (SFD) was translated from the CLD. The determination of variable types depends on whether the relevant causal factors have explicit definitions and whether the causal links can be modeled in a quantitative way. A necessary iteration in modeling between the SFD and CLD was needed when determining the model boundary and variable/parameter. The detailed SFD modeling process was introduced in Section 4.1.
Step 4: SFD model test and verification. To avoid the plausibility of the SD model lying only in its structure, the dimensional consistency, confidence interval checks of variables, extreme conditions test (ECT), and parameter sensitivity test (PST) were required to calibrate the simulation model with real large UAS data. They were often accompanied by statistical validation tests of behavior replication. The detailed SFD modeling process was introduced in Section 4.2 and Section 4.3.
Step 5: SD model application. To support the decision making and implementation under multiple factors affected by the dynamic organizational environment, SD simulation-enhanced policy analysis helps mitigate undesirable behaviors and improve organization operation [21,22,23]. In this phase, the calibrated SFD model was used to conduct safety policy experiments aiming for maintenance accident reduction.

2.3. SD Model Building Software

In this study, the simulation software that was adopted to build the SD model was Vensim (Ventana Simulation Environment), which is one of the most widely used pieces of SD simulation software. It provides an interactive environment for model development and simulation, and offers many practical functions such as model check, dimensional consistency checks, data import, etc., which facilitate model-building efforts. Similar SD modeling commercial platforms include Stella, Powersim, etc.

3. UAS Maintenance Risk Dynamic Mechanism

Based on aviation engineering conventions, the most international airworthiness authorities differentiate the types of UAS according to the maximum take-off weight (MTOW) or empty weight (EW) of the UAV, as shown as Table 1. In the UAS type spectrum, the MQ-1 Predator UAS of the General Atomics Aeronautical Systems, Inc. was a medium altitude, long-endurance vehicle, and the largest current-generation UAS in service with the US military (its MTOW is more than 1000 kg). Predators entered the US Air Force (USAF) inventory in 1996, and their flight hours increased rapidly, expanding more than 100 times in the two decades from 1996 to 2015. The cumulative flight hour (CFH) of the MQ-1 fleet reached 100,000 in 2005, and it was the first single large UAS type achieving this level in the global market. Furthermore, since 2008, it maintained the record of 10,000 flight hours per year until now, and its CFH had exceeded 2,500,000 h by 2017. Importantly, considering the public security effects, the MQ-1 Predator possess more than 800 kJ of ground impact energy, if its civil variants lost control in a densely populated area, the threat on residents and public property safety wouldbe significant. It also represents the typical mission and system safety risk mechanisms of those UASs on which the international aviation authorities highly focus. Moreover, the safety/reliability, operation, and maintenance data of the USAF MQ-1 Predator fleet were the most comprehensive and continuous in the world among current UAS types. Hence, in this study, the safety risk revolution of MQ-1 Predator was chosen as a research case, and the safety management measures that were derived can be shared to its peers with smaller gaps.

3.1. UAS Accident Data Collection

Based on the available sources, many causation analyses of MQ-1 accidents were implemented. For example, Tvarynas et al. found that the frequency of human factor mishaps of the US military UAS fleet was increasing, which was based on data on UAS mishaps during the fiscal years 1994–2003 [6]. Recurring human factor failures at the organizational, supervision, preconditional, and operator levels have contributed to more than half of MQ-1 mishaps. Nullmeyer et al. used the USAF MQ-1 Predator Class A mishaps as a case study, and derived flight crew training measures to reduce human errors [25,26]. Especially, the USAF Sustainment Center generated investigation reports for typical large UAS for every Class A mishap by fiscal year (FY) and UAS type, and provided results at varying levels of granularity. Based on such detailed statistics, the safety records of the USAF MQ-1 fleet were summarized in this study, and the Class A mishap contributors from FY 1996 to 2015 were specified, as shown in Figure 4.
Of the more than 80 Class A mishaps occurring during the FY period of 1996–2015, 60.3% involved the en-route phase, and 43 (51.9%) of mishaps involved human error factors. It can be noticed that the majority of problems related to human factors could be attributed to maintenance errors and the critical technical system-related mishaps involved propulsion system failures. In fact, with the traditional statistics method of accident causal factors, it was hard to distinguish the different root failure, such as between a flawed system design and inadequate maintenance activities.
For example, an USAF MQ-1L predator UAS deployed from the 15th Reconnaissance Squadron (57th Wing, Nellis AFB, Nevada) crashed in Iraq in March 2005. From the evidence revealed in the accident investigation report, the primary cause of this mishap was a catastrophic engine fire caused by a fuel leak on the left forward part of the engine. The accidental contributors that were found involved: 1) the flawed installation design of the O-ring seal of the engine; 2) the flawed design of the oil lines, which made them susceptible to fire; 3) no dedicated fire-detection or suppression system, and 4) inadequate technical data on the post-flight maintenance procedures for the detection of fuel line chafing. As shown by Figure 4b, this case was classified as belonging to both “propulsion system failure” and “maintenance error”. In this term, the causality revealed by the accident investigation was ignored. However, the human error causal factor often cannot be explained by single-point failure. As in this case, the maintenance errors had embedded roots in the system design of the fuel lines. According to Marais and Cooke, accident analysis based only on categorized errors and traditional safety philosophy is superficial or structured for future preventive measures [27,28]. In order to analyze the dynamic and coupling impacts of organizational risk factors, a SD approach was introduced to analyze the UAS maintenance risk mechanisms in terms of feedback in this study.

3.2. UAS Maintenance Risk Causal Loop Diagram

Based on the Systems-Theoretic Accident Model and Process (STAMP) and STAMP-based hazard analysis technique (STPA) raised by Leveson, an accident is a property emerging from the interactions within the social–technical system components rather than a sequence of events linked by static cause and effect factors [29,30]. Safety is reformulated as a control problem rather than a reliability problem. In STAMP/STPA, systems were viewed as interrelated components kept in a state of dynamic equilibrium by feedback control loops. For the large UASs examined in this study, the technical systems (which are regarded as the Technical Level) performed expected functions according with related design rationales (e.g., UAS flies border surveillance missions). The human actors implemented specified tasks following the task procedures and occupation norms in the DOM processes (the Human Level). For example, the maintainer replaced the engine components following determined maintenance intervals. Moreover, the organizations (the Organization Level) did their duties, respecting the associated responsibilities and plans (e.g., the maintaining organization ensured its oversight of the maintenance program). A hierarchical framework for a risk dynamics analysis of the UAS maintenance process is proposed in Figure 5.
In this frame, as the foundation of the system theories, the risk dynamics rest on two pairs of ideas: (1) emergence and hierarchy, and (2) communication and control [31,32]. As emergent at the lower three levels, the UAS operation safety and mission availability (the focused elements in the Emergency Level) were determined in the context of the whole structure where the components of each lower level implemented or violated the constraints. Since the safety (using the UAS accident rate as an indicator) was hard to evaluate by only examining a single element in local hierarchies, it was not possible to take a single component property in isolation and assess whether the UAS operates with an acceptable risk level (e.g., the reliability of a specified system or a single maintainer action error).
In Figure 5, the control actions and feedback channels between different levels were labeled by the solid and dashed arrows, respectively. Based on this framework for risk dynamics, some primary variables were defined as following:
  • The variables prefixed with ELi described the UAS performance and safety indicators belonging to the Emergency Level, such as EL1-Actual Total Mission Duration. This level represents the output information.
  • The variables prefixed with TLj described the risk effects of critical system design flaws and reliability belonging to the Technical Level, such as TL1-Critical System Reliability Status.
  • The variables prefixed with HLk described the maintainer-related risk factors in the Human Level, which involve two main aspects, both maintaining trainers and trainees, such as HL1-Average Mission Maintainer Experience.
  • The variables prefixed with OLl described the organizational behaviors and decisions in the Organizational Level, such as OL1-Scheduled Total Mission Duration.
Consequently, as the Step 2 shown in Figure 3, a CLD was proposed to model the UAS maintenance risk causality, as shown in Figure 6a. To highlight the interactions among risk factors in the Technical Level, the causal loops in this level were marked with red arrows. Regarding the intensity of feedback loops, four balancing loops (B1-B4) and two reinforcing loops (R1 and R2) were identified, as Figure 6b shows. According to the nodal variables indicated, those loops fell into three groups, as shown in Table 2.
With the CLD model proposed, the UAS maintenance risk dynamics can be described as below: due to the intended mission profile and low-cost constraints, which affected the system design, the UAS reliability (TL1) was low. Meanwhile, because of undetermined system behaviors and incomplete maintenance procedures, the UAS mishap number was high (HL1 + TL1 TL4 + EL2), which promoted the accident investigation for the causation of the mishaps. With the hindsight (EL2 + OL4 + ( Delay ) TL2), the staged risk interactions started:
  • In the Human Level (HL), maintainers directly learned from previous incidents/accidents, which helped reduce their task errors and then enhance the system reliability (in this stage, the dominant feedback loop was B1). When facing mission stresses, UAS-maintaining organizations trained more maintainers to satisfy the increasing mission requirements. However, due to a lack of qualified trainers, the increasing of maintainer experience encountered a delay (HL6 + ( Delay ) HL1), and stayed in a relatively low level (see the B2 loop).
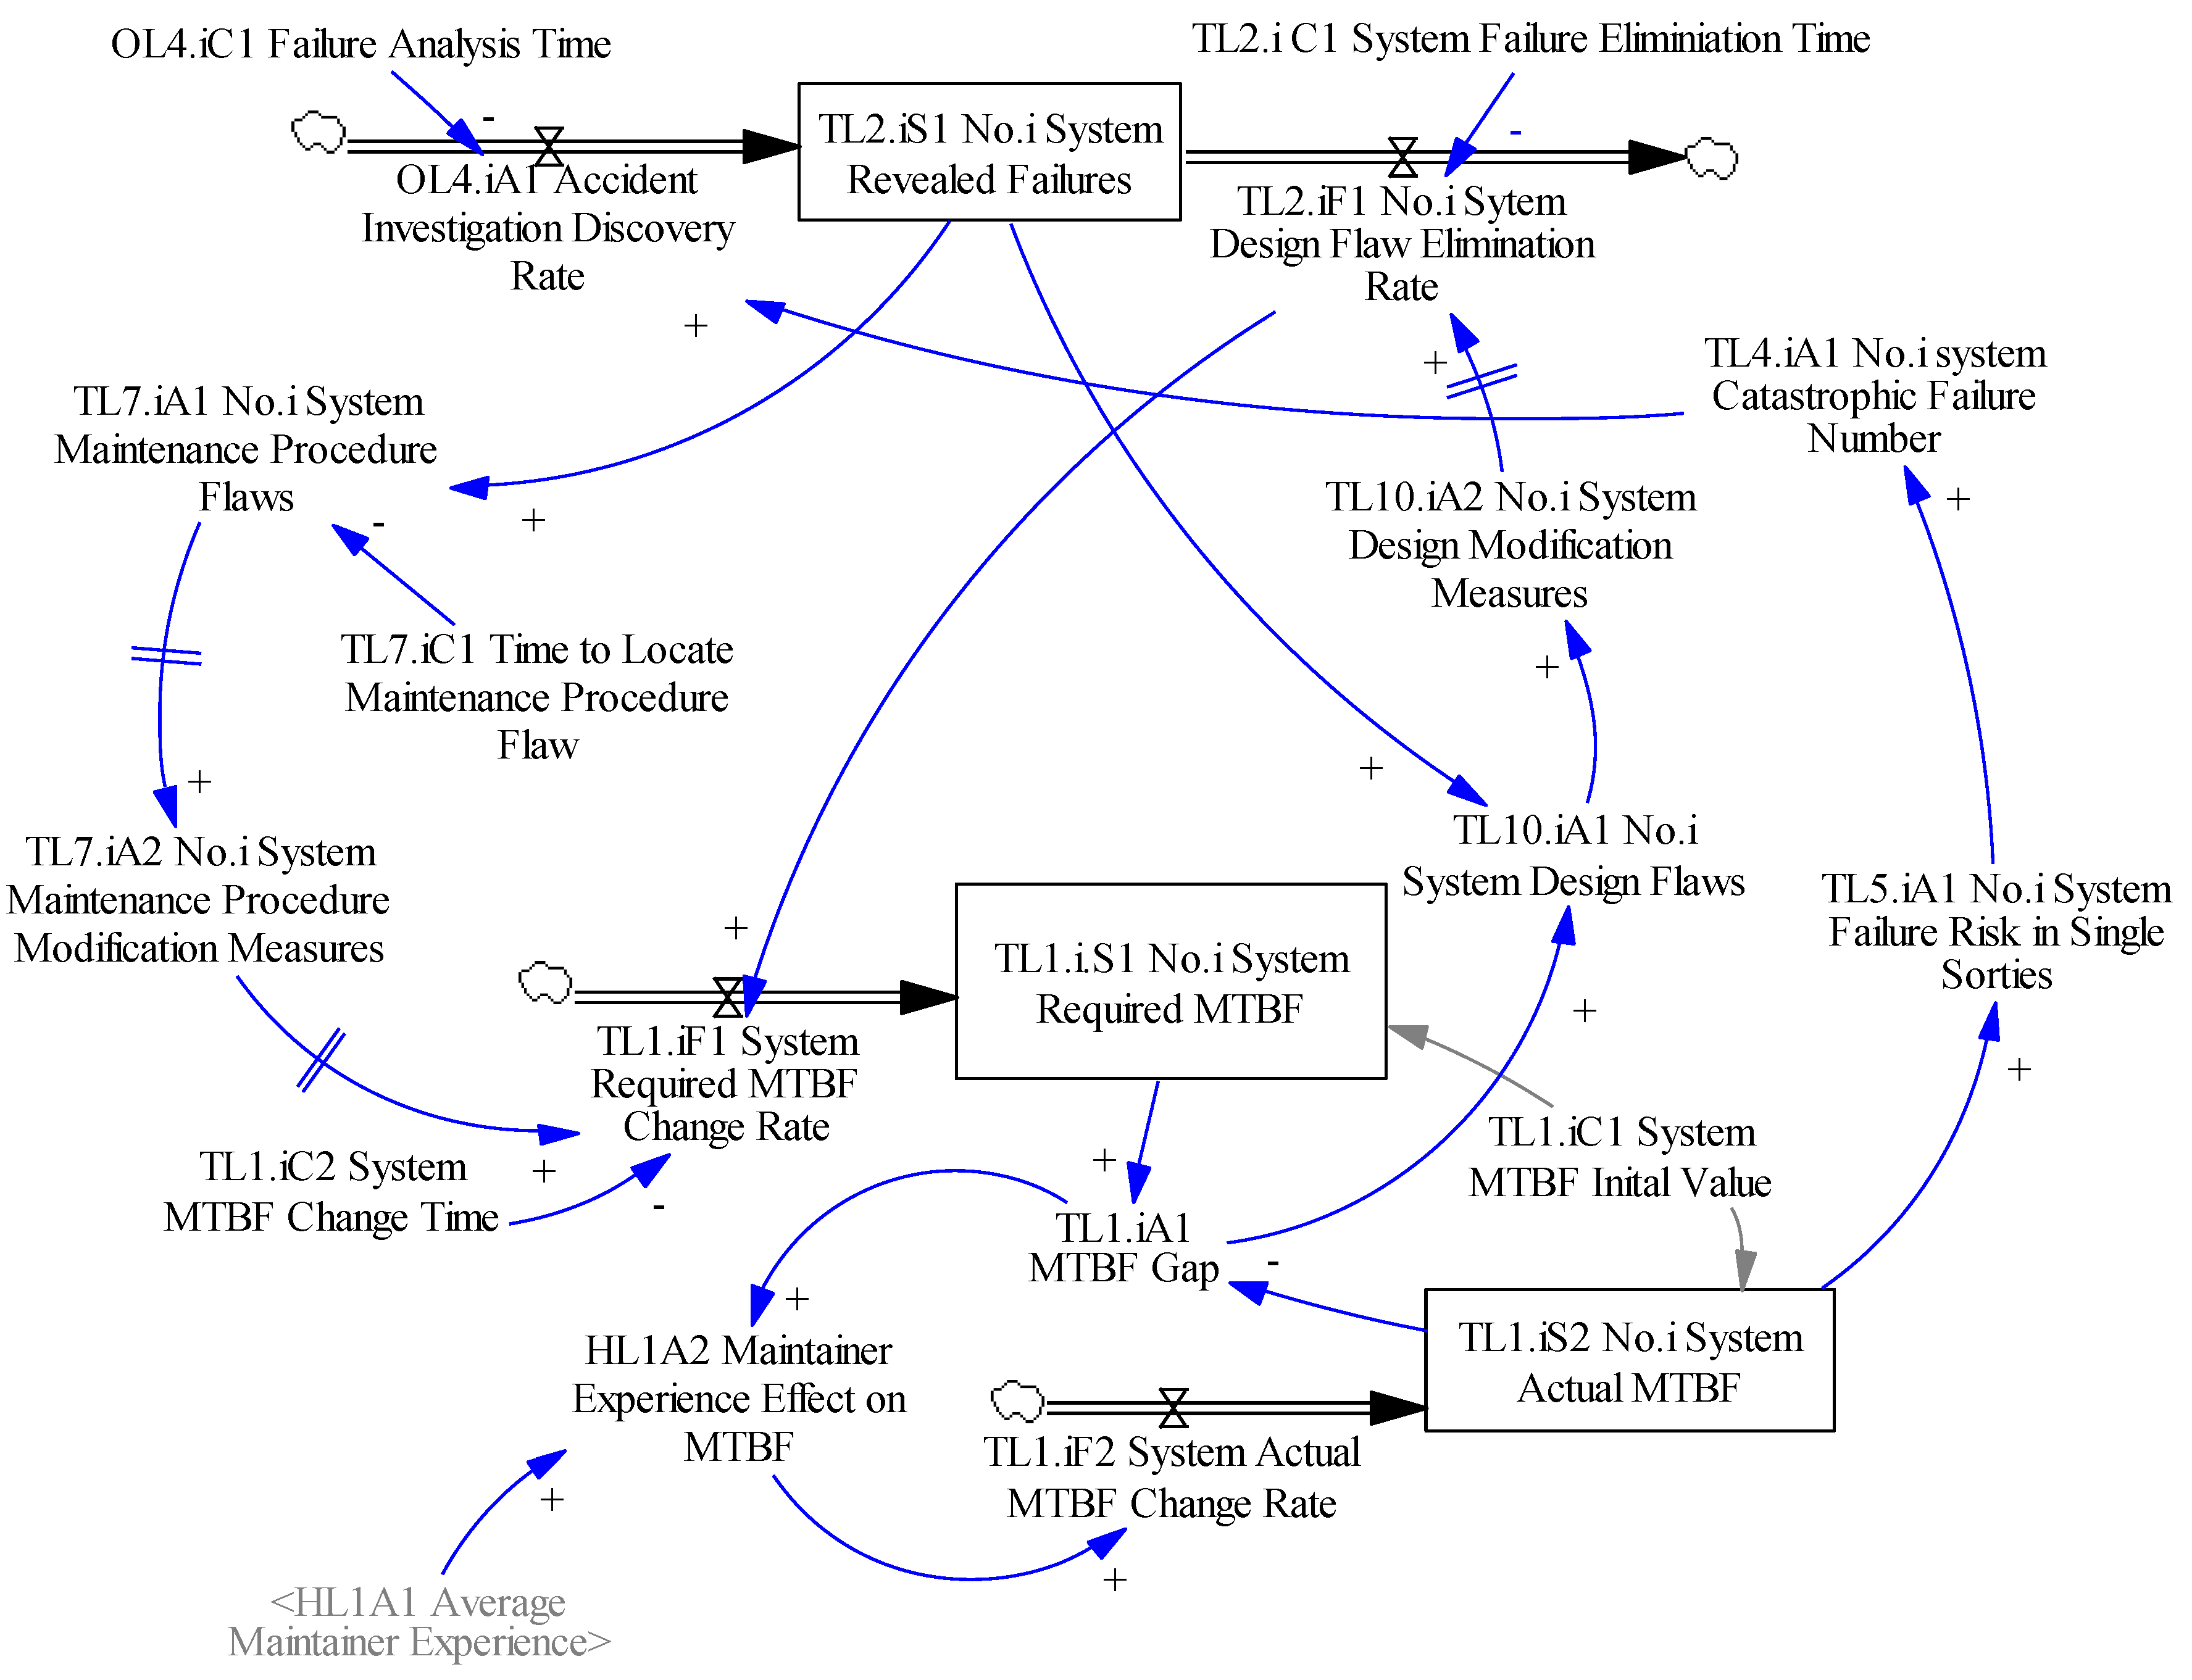
  • In the Technical Level (TL), facing the reliability gaps in UAS operation, UAS development organizations modified the system design to reduce the possibilities of undesired system failures, such as improving component qualities and/or introducing redundancy characteristics (see the B3 and B4 loops). Yet, the adverse system interaction will also induce failure, which was modeled by the R1 loop.
Regarding the interaction of the Human and Technical levels, UAS-maintaining organizations promoted maintaining procedure modifications, but such activities behaved as a kind of side effect that depressed the increasing of maintainer experience (see the R2 loop). The improved system reliability (TL1) contributed to Class A mishap rate reduction, which limited the benefit increasing from mission experience and accident learning (see the B1 loop; this phenomenon was also named blind safety confidence, see [20]). With the maintenance procedures (TL7) becoming more complete, the role of the reinforcing loop R1 had less importance as a side effect influencing UAS operation safety. Due to the improved system design, the number of visible system flaws (TL2) revealed by accident investigation and routine maintenance mission decreased continuously (i.e., the effects of the balancing loops B3 and B4 became gradually weak). An organizational risk mechanism was modeled to show that how the average maintainer experience achieved a dynamic balance along with the evolution of a UAS type over a long time scale. As a result, the reliability of UAS in operation approaches the desired level specified in the design.

4. Maintenance Risk Dynamics Model

The SFD modeling is informed by mental, written, and numerical data sources from model conceptualization, from analysis to implementation [14]. In practice, due to the limitation of available data such as complete accident causal factor statistics, details of maintainer training programs, and service length, the CLD should be tailored aiming for the construction of a feasible SFD that can be verified.

4.1. Maintenance Risk Dynamic SFD

To ensure that the model behaviors can be validated with real-world data derived from the USAF MQ-1 fleet, the CLD shown in Figure 6 was tailored for intended SFD modeling and simulation for a historical match between model and reality, which played an important role in preventing the SFD structure from being constructed in a less rigorous way. Following the identified hierarchical framework for a risk dynamics analysis of UAS maintenance processes, the variables in the Organizational Level provided the input information of the SFD modeling, such as OL3D1-Intended Number of UAS in Service. Referring to the regularly issued unmanned aerial vehicles roadmap developed by US Department of Defense (for example, see [33,34]), those sustainability data deriving from the military experience of the MQ-1 fleet in Afghanistan and Iraq supported the modeling of organizational factors. The letter D indicated the definition of the variable, based on the collected data. Most of the data in the Organizational Level were integrated into the SFD model by using of the WITH LOOKUP FUNCTION provided by the Vensim software. Meanwhile, the variables in the Emergency Level were regarded as the output results of the SFD modeling, such as the variable EL2A1-Current Number of Class A Mishaps (the letter A indicated they were the auxiliary variables). They also supported the calibration and validation of simulation results with respect to the real world data.
As the core of the SFD modeling, the variable interactions between the Human Level and Technical Level played important roles in determining the UAS maintenance risk dynamics. In this paper, due to the relatively complete USAF accident investigation and report system, more than 70% of Class A mishap investigations have been found on the website of the USAF Sustainment Center. The investigation reports involved synthetic information such as the organizational background, sequence of events, maintenance errors, technical system flaws, weather conditions, and operation supervision, which provided human factor-related assumptions and insights for the definition of model equations in both qualitative and quantitative ways [35,36,37,38,39]. For example, based on the general framework of human error called the Human Factors Analysis and Classification System (HFACS), the kernel risk factor, HL1A1-Average Maintainer Experience, was regarded as the recondition for unsafe acts of maintainers that limited their on-the-job performance under scheduled routine (i.e., more errors due to low personal readiness) and also provoked their substandard practices to violate existing rules without precognition of undesired consequences. Following the identified primary risk factors influencing large UAS reliability, a conceptual function was proposed to describe the risk dynamics involving the variables in the HL and TL levels as below.
Adverse   effects   on   critical   system   reliability   =   f ( system   design   flaws maintenance   procedure   flaws maintainer   errors )
The main view of the SFD model at the Human Level is shown as Figure 7. As the precondition of maintainer errors, the occupational experience of maintainers (HL1A1, variable scope: between 0–100%) was the primary factor that influenced the actual reliability level of technical systems in service, and then the number of mission cancellations. Simplifying the maintainers pervading in various MQ-1 Predator squadrons as a whole, the formation mechanism of average maintainer experience was modeled by a stock variable named HL5S1-Total Maintainer Experience (indicated by the letter S), which integrated the five flow variables (indicated by the letter F):
  • Increase in experience from training (HL5F1): under the task pressures, the maintaining organization took efforts to train new maintainers (see the B2 loop). For the case of the USAF MQ-1 Predator, due to the high tempos in battle field missions, the trainers also played the role of maintainer, so the trainer population was also included in the variable HL2A1-Total Maintainer Population.
  • Loss of experience from decay (HL5F2) and turnover (HL5F3): the maintainers lost experience through the deterioration process that mirrored memory loss, and skilled maintainer loss due to their turnover (i.e., attrition rate).
  • Increase in experience from mission learning (HL5F4): the maintainers gained experience by spending time on the tasks and learning from the mishaps and accident investigation reports of the past. It was often known as “self re-learning” in literatures on training [37].
  • Change in experience influenced by maintenance procedure modification (HL5F5): this factor modeled another category of maintainer mission experience change known as “training transfer”. The conceptual equation of the variable HL20F4 was defined as:
    H L 5 F 5 DELAY 1 ( i = 1 3 T L 7. i A 2 , HL 5 C 5 )
where TL7.iA2 was the amount of the maintenance procedures modification for the No.i critical system (the propulsion, flight control, and data communication systems were considered in this SFD model, and .i represented those systems, respectively), and HL5C5 was the time to master the modified procedures (the letter C indicates the constant parameters).
For the SFD modeling of the Technical Level, some literature research on the MQ-1 predator mishap revealed the accidental factors resulting in large UAS system failures. For example, the US office of the Secretary of Defense figured out that the propulsion system, flight control system. and communication (datalink) system were the three primary sources of catastrophic technical failures and provided the typical Mean Time Between Failure (MTBF) of MQ-1 Predator’s safety critical systems during 1994 and 2003 [5]. In practice, the researchers often used the MTBF as an indicator to characterize the reliability of UAS systems. In order to transfer the conceptually identified variable TL1-System Reliability into the SFD model, two stock variables—TL1.iS1-No.i System Required MTBF and TL1.iS2-No.i System Actual MTBF—were adopted to model the mechanism of the latent influences of maintainer experience on technical system reliability (i.e., HL1 + ( Delay ) TL1), as shown in Figure 8. Similar to the modeling process of the variable TL10.iA2 -No.i System Design Modification, the variable TL7.iA2-No.i System Maintenance Procedures Modification was defined as the flow rate of the variable TL1.iS1 (referring to the feedback loops B4 and R1 in Figure 6).
For the model equation transferring of the loop B1 from the CLD to the SFD model, the core process was to describe the relationship between the variable HL1A1 and the variable TL1.iS2. It modeled the dynamic risk mechanism that flawed and/or inadequate maintaining procedures behaved as organizational influences to induce the unsafe acts of maintainers and had indirect impacts on the actual MTBF of the safety critical systems. Moreover, such a dual-stock structure prevented the potential false prediction of the impacts of maintainer experience on MTBF, especially when the variable HL1A1 might reach its reasonable boundary. The conceptual equation of the variable TL1.iS2 was defined as:
T L 1 . i S 2 TL 1 . i C 1 + k t = 0 t H L 1 A 1 T L 1 . i A 1 d t
where TL1.iC1 was the initial MTBF of the No.i critical system, and TL1.iA1 was the gap between the required and actual critical system MTBF.

4.2. SFD Model Test and Calibration

In the proposed SFD model, a number of behavioral tests of the SFD model were needed to evaluate the validity of the model structure, such as the dimensional consistency test on every equation. It aimed to ensure that the variable definitions were not mathematically incorrect. Importantly, a parameter sensitivity test (PST) was conducted to identify whether the SFD model was sensitive to certain parameter changes, and the simulation result would be acceptable against both conceptual models in the literature and the assumptions from expert and/or peer experience. To identify the different sensitive parameters would help the model user rank and measure the strength of association between the sets of parameter sensitivity results [13,14]. The PST also provided a base understanding of the preliminarily constructed SFD model for further safety policy experiments. The necessary modification of feedback loops was implemented following the modeling iteration.
Moreover, an extreme condition test (ECT) was also used to determine whether the SFD model would behave reasonably when the related parameters exceeded the anticipated limits. As an example, Figure 9 shows how the validity of the SFD model was partially evaluated by setting a different initial value of the propulsion system MTBF as an example. In this test, the parameter TL1.1C1 Initial value of propulsion system MTBF was changed from 150 h (the base run indicated by pink dashed lines) to 75 h (the test run indicated by blue solid lines), and the comparison of the two runs was shown in the Figure 9 below.
From the test results, when the initial MTBF is reduced to 75 h (only half of the base runs in month zero), the actual system MTBF between the 90th and 160th months will be extremely low (TL1.1S2), which causes the propulsion system catastrophic failure risk in single sortie (TL5.1A1) up to 100%, as shown in Figure 9a. As a result, the mission cancellation number shoots up and causes the total actual flight hours (EL1A1) to approach the time–axis (0 h), as shown in Figure 9b. Such model behaviors were consistent with the dynamic mechanism beneath the causal link (TL1 TL5 + TL4 + EL3 EL1), as specified in Figure 6. Moreover, with the passage of time, the accident investigation reveals the system design flaws (TL2.1S1) and promotes design modification (TL10.1A2). Consequently, the system actual MTBF will gradually increase and the total actual flight hours will begin to accumulate and reach a relatively lower level with respect to the base run of 150 h MTBF (after the 160th month). This test result also showed its consistency with the corresponding causal link (OL4 + TL2 + TL10 + TL1) specified in Figure 6. The ECT demonstrated the rationality of the SFD model behaviors, which showed the transfer process rigidity from the conceptual CLD to numerical SFD. It also added the plausibility of the model for further real world data calibration and policy experiment simulation.

4.3. SFD Model Verification

Based on the time-series operation data and safety records of the USAF MQ-1 Predator fleet between FY 1996–2015 (a time horizon of 240 months), the SFD model proposed in Section 4.2 was applied to implement a real case study. Following the accident causal factor statistics analyzed in Section 3.1, the propulsion system, flight control system, and communication system (datalink) were selected as the safety critical systems modeled in this simulation. Meanwhile, the risk influences of flight crews were also considered in the model, but are not shown in this paper. The initial values of the level variables, delay time constants, table functions, and auxiliaries weighted by certain coefficients were all defined. After that the Variable Validity Checks (VVC) are required to assess whether the simulated system behavior fit the CLD model established in Section 3. As Table 3 shows, acceptable errors between simulation results and historical date can be observed. The reason for such error can be attributed to some simplified stock-flow equations to model the risk interactions (due to the limitation of available supporting data from the USAF Sustainment Center).
Using the MQ-1 Predator total maintainer population (HL2A1) and Class A mishaps per 105 h (EL5A1) as representatives, Figure 10 compares the simulation results (blue solid line) of the critical variables against historical data (red stars). The variable HL2A1 captures the surging trend of maintainer population after the 160th moth due to the increased employment requirement of MQ-1 fleet in Afghanistan and Iraq since FY 2008, as shown in Figure 10a. Meanwhile the variable EL5A1 also replicates a critical feature in MQ-1 fleet’s early safety history which owned a peak of mishap rate on the 30th month (MQ-1 begun to enter widespread service of USAF in 1998), as shown in Figure 10b. As achieving the close historical match between SFD model and reality, confidence on applying the proposed UAS maintenance risk dynamics model to be supporting tool for policy decision-making to improve UAS operation safety been enhanced.

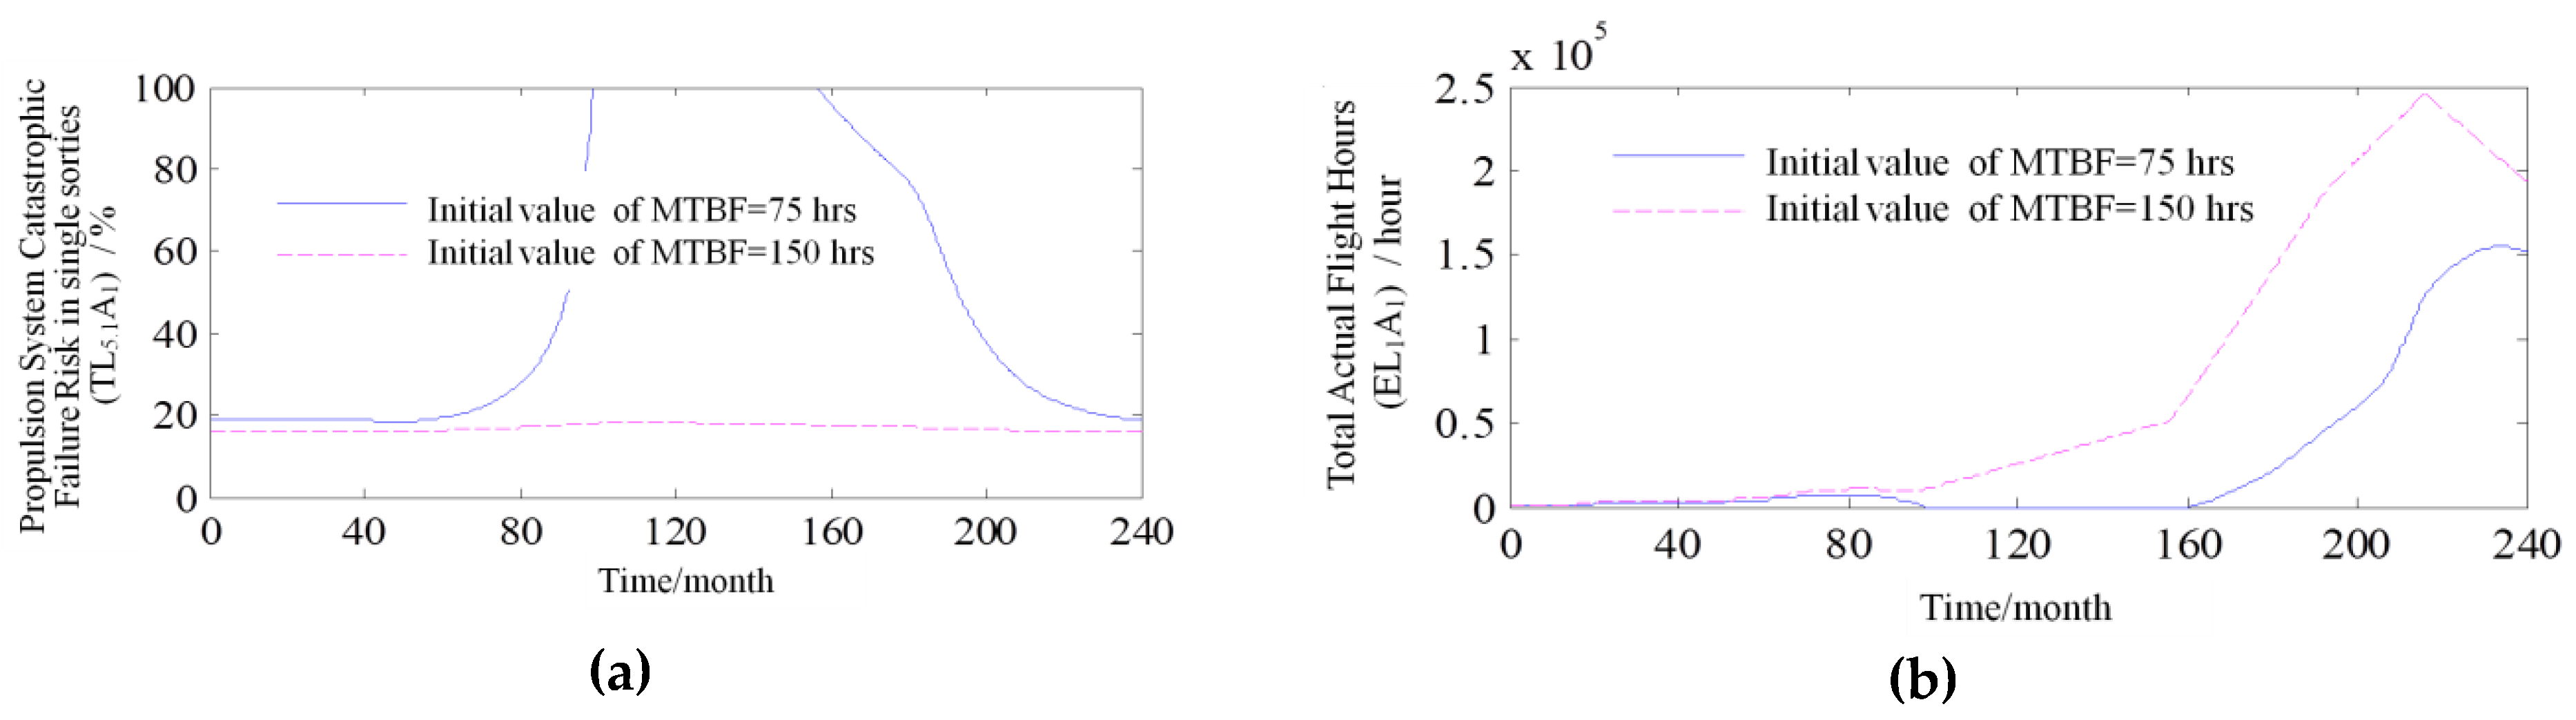
5. SFD-Based Safety Policy Experiment

To reduce the UAS accident rate, two types of policies could be used: one focuses on human improvement, and the other one focuses on technical system improvement. Using the SFD model, we tested the long-term effects of two representative safety policies: 1) maintainer training enhanced; and 2) propulsion system reliability enhanced. The related parameters were defined in Table 4, and the policy experiment results were shown in Table 5 and Table 6.
Safety Policy Experiment 1 simulated the effects of enhanced training measures on the large UAS safety. Under high mission tempos, the UAS fleet considered alternative training interventions that focused on the on-the-job performance and the improvement of the key maintainer skill sustainability, especially employing full-time trainers instead of the manufacturer company–military service–contractor company mode. Moreover, for routine tasks, self re-learning always happened due to sustainable practice. In order to avoid the adverse diminishing of overlearning with time (i.e., mastery training) and especially for some emergency or low frequency tasks, organizations should adopt refresher training to compensate the decay of maintainer experience acquired in mastery training (e.g., checking system components with long maintenance intervals). It is important for the continuously modified maintaining procedures when facing the extended scope of large UAS in the civilian field. The refresher training intervals should be specified in the training program, and corresponding supervision are also needed. Significantly, Policy Experiment 1 revealed that the safety effects of training on the maintenance risk should be judged over the medium to long term. It means the characteristics of the maintainer errors need to be considered in system design and maintenance procedure to prevent them in a proactive way. Moreover, to improve the understanding of maintenance personnel on the rationales beneath the structural procedures will reduce the experience dependency and training costs, which aids to ensure the long-term safety benefits against training investments.
In Safety Policy Experiment 2, a risk evolution trend pervading in the technical system level can be seen. The initial reliability of the critical systems attributed by the development and manufacture processes had decreasing effects on the large UAS operation safety over time. The simulated results showed that the maintainer errors behaved in a long-term manner, which induced UAS mishaps instead of a short-term manner of system failures. In the simulation, the MTBF of the propulsion system was increased from 150 h to 200 h. Such reliability-enhancing technologies always mean the introduction of high quality commercial off-the-shelf (COTS) products, such as heavy fuel engine and advanced digital avionics systems. They have the potential to address major reliability shortcomings, but also add the maintaining complexity and operation costs. In fact, the system price, size, and weight are of particular sensitivity to an UAS. Comparing to the manned counterparts, the affordability of UAS subsystems must be balanced with their reliability, and the claimed benefits should be examined more carefully. However, enhancing reliability must be weighed as a trade-off between increased upfront costs for a given UAV and reduced maintenance costs over the system’s lifetime spectrum of risk with the UAS flight phases. In the decision-making process for establishing an effective airworthiness regulatory framework for UAS, the proposed semi-qualitative risk dynamics simulation can provide suggestions for regulatory authorities and individual stakeholders (e.g., industries, military and civil services) in a novel and perhaps more lucid way.

6. Discussion

As indicated by Hobbs and Herwitz, for unmanned aviation lacking in maintenance/manufacturer-specific reporting programs, it was difficult for the UAS industry, operators, and aviation authorities to learn lessons from maintenance incidents. Due to the differences between large UAS and manned aviation maintenance, the organizations may always ignore the warning signs of precursor incidents, and fail to learn from the lessons of the past [38]. Especially, due to the awareness that there was no human on board the vehicle, the maintenance personnel may become more relaxed about maintenance tasks compared to manned aviation, particularly with regard to deviations from procedures. However, by reviewing the existing literature, we can find that how human factors affect the maintenance of UAV was an area with little prior research. With the increased high operation tempos of military UAS, most of the existing research has emphasized the flight crew errors and training benefits. In contrast, the maintenance human factors received little attention. However, as revealed by the UAS accidental causal factor statistics in this paper, the maintenance accident issues have risen to a comparable level as that of the flight crew errors. Moving the large UAS safety strategies from normal accidents to high reliability, the new risk mitigation metrics should provide insights for maintaining managers concerned with the on-the-job performance of maintenance personnel and their teamwork efficiency. For example, in this paper, it was shown that the personal population, training experience, and mission experience were three critical maintenance risk factors influencing the large UAS accident rate.
Due to the benefits in time and cost savings of long-endurance tasks such as surveillance or cargo transport in the civilian field, increasing requirements on the employment of MQ-1 Predator-sized large civil UAS can be observed for those countries taking the lead of large UAS usage, such as the US and China [40,41]. However, their unsatisfactory safety characteristics made restricted their operations to certain segregated areas. To promote the sustainable growth of such kind of UASs for their irreplaceable missions, the countries who have gained plenty of large UAS operation experience proposed the basic considerations for airworthiness management in advance. There are various differences in this rulemaking progress around the world. For example, the Civil Aviation Administration of China (CAAC) has not yet specified their basic framework regarding how to integrate their large UAS into manned airspace [24]. In contrast, some advanced aviation authorities have taken the lead in developing management guidance and technical standards for civil UAS operation accompanying with ICAO’s exploratory aspiration [3,42,43]. Reference to the UAS categories has been listed in Table 1 in Section 3.1. A safety management matrix for future civil UAS market has been proposed.
For example, considering the broad range of operations and types of UAS, the European Aviation Safety Agency (EASA) [44] uses a hierarchical structure to supervise the UAS safety according to the operation risk level. 1) The Open Operation category (MTOW <25 kg) has a low ground impact energy and should not require an authorization by an aviation authority for the flight, but stay within defined limitations for the operation (e.g., distance from aerodromes, from people, etc.). 2) The Operation category has a medium ground impact energy and requires an operations authorization by an aviation authority with specific limitations adapted to the operation, especially the operator should perform a safety risk assessment on the technical system and personnel proficiency, identifying mitigation measures, which will be reviewed and approved by the National Aviation Authority. 3) In the Certified category, high operation risks rise to a level similar to normal manned aviation operation, and the type certificate and personnel qualification will be required following the airworthiness regulation and standard issued as for manned aviation, plus some more regulations specific to UAS.
The systematic improvement of the safety of UAS, especially the large types, has attracted considerable attention from regulatory authorities, UAS developers, manufactures, operators, and the public. Some researchers have already doubted the rationality of directly using existing conventionally piloted aircraft airworthiness certification experience [41,45]. For instance, under the EASA’s framework, the boundary between the Operation and Certified categories is often subjective due to the lack of systematic UAS operation risk assessment techniques. To break such a predicament, using the dynamic causation of human factors and system reliability to describe the risk mechanism tends to be useful in improving the stakeholders’ decision-making metrics, which may help them evaluate the potential consequence of their behaviors and bridge the safety/reliability gaps between the airworthiness of large UAS and manned aircraft. The further developed SD model of the large UAS regulatory development–operation–management should provide the potential civil UAS market stakeholders and policy makers with a clearer understanding of the relationships between the economic gain and safety price.

7. Conclusions

This study introduced a system dynamics modeling approach on the safety risk mechanism of the UAS maintaining processes that contributed the largest causal factors for large UAS accidents in the past two decades. Viewing the large UAS safety sustainability as an emergency property of a social–technical system, the shifting of a dominant feedback loop over time identified by the proposed SD model explains why safety hindsight such as enhanced system reliability design and maintenance training of a new large UAS always failed to reduce its initial service period mishaps: in the early stage, the low system reliability combined with insufficient maintainer experience caused a high mishaps rate, and the increasing of maintainer experience derived from job training took a delayed effect on maintenance risk reduction due to the population gap. Compared to the limited value of system reliability improvement, the maintaining procedure modifications promoted by UAS-maintaining organizations behaved as a kind of side effect that depressed the increasing of maintainer experience. Later, the whole system safety sustainability reached the dynamic balance in a long-term vision. As a lesson learned from the USAF MQ-1 Predator fleet, the large UAS-maintaining characteristics and maintainer error reduction, especially under field conditions, should be considered adequately in the development of a technical system at the initial airworthiness stages of large UASs. Moreover, at the continuous airworthiness stages of large UASs, the time needed to obtain the required human resource under high mission pressures may induce a delayed process of maintainer experience-gathering, which has adverse impacts on the UAS operation safety. Some proactive investments, such as the setting of full-time trainer staffs against the maintainer population gap or adequate refresher training to supply the mission self-learning, can be used to ensure the sustainment of maintenance proficiency in UAS fleets.
In this study, a SD modeling-derived “Risk–Time Curve” can provide the DOM organizations of large UASs insight and less confused information regarding organization safety flaws, especially in mid-term and long-term views. It explained the general UAS maintenance risk dynamic mechanisms, which integrated the organizational, human, and technical dimensions rather than identifying static accidental factors in textual way. As a supplement on traditional textual descriptions, the semi-quantitative SD simulation-derived safety policy experiments may let the responsible organizations know their safety benefits more objectively instead of only relying on intuitions. It is also especially favorable for the accident investigation planning. However, because of the factor scope and depth of the large UAS maintenance risk spectrum, this research mainly took the failure number and the MTBF value to describe the basic reliability characteristics in a conceptual way, and simplified the failure interactions between different technical systems. Similarly, the maintainer human factor analysis also embedded its roots in experience-term metrics of a large UAS operation. This research will help a large UAS maintaining organization that is responsible for Operation and Certified categories to evaluate the safety impacts of their management decisions and provide reference for future UAS risk-based airworthiness rulemaking in maintenance fields. More detailed and broad modeling needs to be explored in our further research, especially considerations of how to improve large UAS safety to promote their most valuable civil applications in autonomous intercity/international cargo shipment or even the transportation of passengers.

Author Contributions

All four authors cooperated in the research, leading to the reported results. Y.L and Y.Q. designed the research methods and wrote the paper. H.H collected statistic data and conducted some analytical tasks. S.Z and S.F. provided valuable insights into the analysis and promoted the research activities.

Funding

This research was sponsored by the National Science Foundation of China (No. 61803263). The first author also acknowledges China Postdoctoral Science Foundation offering the Financial Grant (No. 2016M591735) to support this research.

Acknowledgments

The authors also thank Karen B Marais from Purdue University for helpful advice during the process of this research.

Conflicts of Interest

The authors declare no conflict of interest.

References

  1. International Civil Aviation Organization (ICAO). Unmanned Aircraft Systems (UAV), 1st ed.; International Civil Aviation Organization: Montreal, QC, Canada, 2011; pp. 3–5. [Google Scholar]
  2. US Department of Defense (US DoD). Unmanned Aerial Vehicles Roadmap, 2005–2203; Department of Defense, Office of the Secretary of Defense: Washington, DC, USA, 2005.
  3. Civil Aviation Authority (CAA). CAP 722 Unmanned Aircraft System Operations in UK Airspace–Guidance, 4th ed.; CAA: London, UK, 2010. [Google Scholar]
  4. Završnik, A. Drones and Unmanned Aerial Systems: Legal and Social Implications for Security and Surveillance; Springer International Publishing: Basel, Switzerland, 2016; pp. 5–8. [Google Scholar]
  5. Schaefer, R. Unmanned Aerial Vehicle Reliability Study; Office of the Secretary of Defense: Washington, DC, USA, 2003; pp. 1–57. [Google Scholar]
  6. Tvaryanas, A.; Thompson, W.; Constable, S. Human factors in remotely piloted aircraft operations: HFACS analysis of 221 mishaps over 10 years. Aviat. Space Environ. Med. 2006, 77, 724–732. [Google Scholar] [PubMed]
  7. Wiegmann, D.A.; Shappell, S.A. A Human Error Approach to Aviation Accident Analysis: The Human Factors Analysis and Classification System; Ashgate: Burlington, VT, USA, 2003; pp. 45–56. [Google Scholar]
  8. Murata, T. Petri nets: Properties, analysis and applications. Proc. IEEE 1989, 7, 541–580. [Google Scholar] [CrossRef]
  9. López-Grao, J.; Merseguer, J.; Campos, J. From UML activity diagrams to stochastic petri nets: Application to software performance engineering. In Proceedings of the WOSP’04, Redwood City, CA, USA, 14–16 January 2004; pp. 25–36. [Google Scholar]
  10. Chen, W.; Huang, S.P. Human reliability analysis for visual inspection in aviation maintenance by a Bayesian network approach. J. Transp. Res. Rec. 2014, 2499, 105–113. [Google Scholar] [CrossRef]
  11. Hubbard, S.M.; Lopp, D. An integrated framework for fostering human factor sustainability and increased safety in aviation ramp operations. J. Aviat. Technol. Eng. 2015, 5, 44–52. [Google Scholar] [CrossRef]
  12. Zhou, T.; Zhang, J.; Baasansuren, D. A hybrid HFACS-BN model for analysis of Mongolian aviation professionals’ awareness of human factors related to aviation safety. Sustainability 2018, 10, 4522. [Google Scholar] [CrossRef]
  13. Moizer, J.D. System Dynamics Modelling of Occupational Safety: A Case Study Approach. Ph.D. Thesis, University of Stirling, Stirling, UK, 1999. [Google Scholar]
  14. Sterman, J.D. Business Dynamics: Systems Thinking and Modeling for a Complex World; Irwin/Mac-Graw Hill: Boston, MA, USA, 2002; pp. 15–25. [Google Scholar]
  15. Yu, J.; Yang, P.; Zhang, K.; Wang, F.; Miao, L. Evaluating the effect of policies and the development of charging infrastructure on electric vehicle diffusion in China. Sustainability 2018, 10, 3394. [Google Scholar] [CrossRef]
  16. Bouloiz, H.; Garbolino, E.; Tkiouat, M.; Guarnieri, F. A system dynamics model of behavioral analysis of safety conditions in a chemical storage unit. Saf. Sci. 2013, 58, 32–40. [Google Scholar] [CrossRef]
  17. Bießlich, P.; Schröder, M.; Gollnick, V. A system dynamics approach to airport modeling. In Proceedings of the 14th AIAA Aviation Technology, Integration, and Operations Conference, Atlanta, GA, USA, 16–20 June 2014. [Google Scholar]
  18. Xu, J.; Xie, H.; Dai, J. Post-seismic allocation of medical staff in the Longmen Shan fault area: Case study of the Lushan earthquake. Environ. Hazards Hum. Policy Dimens. 2015, 14, 289–311. [Google Scholar] [CrossRef]
  19. Rusuli, Y.; Li, L.; Ahmad, S. Dynamics model to simulate water and salt balance of Bosten lake in Xinjiang, China. Environ. Earth Sci. 2015, 74, 2499–2510. [Google Scholar] [CrossRef]
  20. Lu, Y.; Zhang, S.; Hao, L.; Huangfu, H.; Sheng, H. System dynamics modeling of the safety evolution of blended-wing-body subscale demonstrator flight testing. Saf. Sci. 2016, 89, 219–230. [Google Scholar] [CrossRef]
  21. Roberts, N.; Andersen, D.; Deal, R.; Garet, M.; Shaffer, W. Introduction to Computer Simulation: A System Dynamic Modelling Approach; Addison-Wesley: Reading, MA, USA, 1983; pp. 25–40. [Google Scholar]
  22. Coyle, R.G. System Dynamics Modelling: A Practical Approach; Chapman and Hall: London, UK, 1996; pp. 15–35. [Google Scholar]
  23. Wolstenholme, E. The Evaluation of Management Information Systems: A Dynamic and Holistic Approach; Wiley: Chichester, UK, 1993. [Google Scholar]
  24. Civil Aviation Administration of China (CAAC). MD-TM-2009-002 Civil Unmanned Aerial Vehicle Air Traffic Management Measures; CAAC Air Traffic Management Bureau: Beijing, China, 2009. (In Chinese) [Google Scholar]
  25. Nullmeryer, R.T.; Herz, R.; Montijo, G.A. Training interventions to reduce air force Predator mishaps. In Proceedings of the 15th International Symposium on Aviation Psychology, Dayton, OH, USA, 27–30 April 2009. [Google Scholar]
  26. Nullmeryer, R.T.; Herz, R.; Montijo, G.A.; Leonik, R. Birds of prey: Training solutions to human factors issues. In Proceedings of the Interserive/Industry Training, Simulation, and Education Conference (I/ITSEC), Dayton, OH, USA, 2–6 December 2007. [Google Scholar]
  27. Marais, K.B.; Saleh, J.H.; Leveson, N.G. Archetypes for organizational safety. Saf. Sci. 2006, 44, 565–582. [Google Scholar] [CrossRef]
  28. Cooke, D.L.; Rohleder, T.R. Learning from incidents: From normal accidents to high reliability. Syst. Dyn. Rev. 2006, 22, 213–239. [Google Scholar] [CrossRef]
  29. Leveson, N.G. Engineering a Safer World; MIT Press: Cambridge, MA, USA, 2012; pp. 55–95. [Google Scholar]
  30. Leveson, N.G. A new accident model for engineering safer systems. Saf. Sci. 2004, 42, 237–270. [Google Scholar] [CrossRef] [Green Version]
  31. Checkland, P. Systems Thinking, Systems Practice; John Wiley & Sons: New York, NY, USA, 1981. [Google Scholar]
  32. Weinberg, G. An Introduction to General Systems Thinking; John Wiley & Sons: New York, NY, USA, 1975. [Google Scholar]
  33. US Department of Defense (US DoD). Report to Congress on Future Unmanned Aircraft Systems Training, Operation, and Sustainability; Department of Defense, Under Secretary of Defense for Acquisition, Technology and Logistics: Washington, DC, USA, 2012.
  34. US Department of Defense (US DoD). Unmanned Aerial Vehicles Roadmap, 2013–2035; Department of Defense, Office of the Secretary of Defense: Washington, DC, USA, 2013.
  35. Williams, K.W. A Summary of Unmanned Aircraft Accident/incident Data: Human Factors Implications; Civil Aerospace Medical Institute, FAA: Oklahoma City, OK, USA, 2004. [Google Scholar]
  36. Montijo, G.; Kaiser, D.; Spiker, V.A.; Nullmeryer, R.T. Training interventions to reduce flight mishaps. In Proceedings of the Interserive/Industry Training, Simulation, and Education Conference (I/ITSEC), Orlando, FL, USA, 1–4 December 2008. [Google Scholar]
  37. Lu, Y.; Marais, K.B.; Zhang, S. Conceptual modeling of training and organizational risk dynamics. Procedia Eng. 2014, 80, 313–328. [Google Scholar] [CrossRef]
  38. Hobbs, A.; Herwitz, S.R. Human Challenges in the Maintenance of Unmanned Aircraft Systems; NASA Research Report; NASA Research Park: Moffett Filed, CA, USA, 2006. [Google Scholar]
  39. Bella, R.L.; Quelhas, O.L.; Ferraz, F.T.; Bezerra, M.J. Workplace spirituality: Sustainable work experience from a human factors perspective. Sustainability 2018, 10, 1887. [Google Scholar] [CrossRef]
  40. Ramalingam, K.; Kalawsky, R.; Noonan, C. Integration of unmanned aircraft system (UAS) in non-segregated airspace: A complex system of systems problem. In Proceedings of the 2011 IEEE International Systems Conference, Montreal, QC, Canada, 4–7 April 2011; pp. 1–8. [Google Scholar]
  41. Li, W. Unmanned Aerial Vehicle Operation Management; Beihang University Press: Beijing, China, 2011; pp. 15–19. (In Chinese) [Google Scholar]
  42. European Aviation Safety Agency (EASA). A-NPA No 16-2005 Policy for Unmanned Aerial Vehicle (UAV) Certification; European Aviation Safety Agency: Cologne, Germany, 2005.
  43. Federal Aviation Administration (FAA). ORDER8130.34-2008 Airworthiness Certification of Unmanned Aircraft Systems; F of Transportation, FAA: Washington, DC, USA, 2008.
  44. European Aviation Safety Agency (EASA). Concept of Operations for Drones, a Risk Based Approach to Regulation of Unmanned Aircraft; European Aviation Safety Agency: Cologne, Germany, 2015.
  45. Clothier, R.A.; Palmer, J.L.; Walker, R.A.; Fulton, N.L. Definition of an airworthiness certification framework for civil unmanned aircraft systems. Saf. Sci. 2011, 49, 871–885. [Google Scholar] [CrossRef] [Green Version]
Figure 1. Causal loop diagram in a system dynamics (SD) model (causal loop diagram, CLD).
Sustainability 11 01129 g001
Figure 2. Stock and flow diagram in the SD model (stock flow diagram, SFD).
Sustainability 11 01129 g002
Figure 3. System dynamics-based unmanned aerial systems (UAS) development–operation–maintenance (DOM) processes risk SD modeling workflow.
Sustainability 11 01129 g003
Figure 4. Statistic data of United States Air force (USAF) MQ-1 Predator fleet Class A mishap contributors in percentage (fiscal year (FY) 1996-2015) by: (a) flight phases; (b) causal factors.
Sustainability 11 01129 g004
Figure 5. Modeling framework for UAS maintenance risk dynamics mechanism.
Sustainability 11 01129 g005
Figure 6. UAS maintenance risk SD model causal loop diagram (a); dominant loop relationships (b).
Sustainability 11 01129 g006
Figure 7. Maintainer experience formation process SFD.
Sustainability 11 01129 g007
Figure 8. Critical system MTBF formation process SFD at the Technical Level.
Sustainability 11 01129 g008
Figure 9. Extreme conditions test (ECT) example: different initial MTBF of propulsion system.
Sustainability 11 01129 g009
Figure 10. Simulated results vs. historical data over the period of fiscal year (FY) 1996–2015.
Sustainability 11 01129 g010
Table 1. UAS categories raised by international aviation authorities.
CAAC 1US DOD/FAACAAPublic Safety EffectsClassical Types
Micro UAV:
≤7 kg
Light UAV:
7–25 kg
Category I:
≤9 kg
Category II:
9–25 kg
(Small)
Small UAV:
≤20 kg
Light UAV:
20–25 kg
Direct VLOS 2; low ground impact energyRaven, DJI Phantom series, Penguin B
(e.g., quadcopter types or short-scale fixed wing)
Light UAV:
25–116 kg
Small UAV:
116–500 kg
Category III:
<599 kg
(Medium)
Light UAV:
25–150 kg
Large UAS:
>150 kg
RLOS 2, might access manned vehicle airspace, medium ground impact energyRQ-5 Hunter
RQ-7 Shadow
Small UAV:
500–5700 kg
Large UAV:
>5700 kg
Category IV:
>599kg
(Large)
Satellite relay data links; might be integrated in manned vehicle airspace, significant ground impact energyMQ-1B Predator MQ-9A Reaper
RQ-4 Global Hawk
1 The Civil Aviation Administration of China (CAAC) uses the empty weight of UAV [24] and the other authorities use the maximum take-off weight of UAVs [2,3]. 2 Visual line of sight (VLOS); radio line of sight (RLOS).
Table 2. Causal loop group and sub-loop definitions.
Loop GroupsCausal LoopsNodal Variables
1. Effects of self-learning and training on maintainer occupational experience (B1/B2)B1 (Mission experience and accident learning)
B2 (Maintainer population changes)
TL2-TL3-HL5-HL1 (B1)
HL4-HL2 (B2)
2. Critical system reliability, system failure risk and interactions (B3/B4/R1)B3 (System design modifications)
B4 (Reduce revealed failures)
R1 (System interaction induced failures)
TL10-TL1 (B3)
TL2-TL10 (B4)
TL4-TL6-TL5 (R1)
3. Side effects of procedure modification (R2)R2 (Maintenance procedure modifications)HL1-TL2-TL7-HL5 (R2)
Table 3. Critical Variable Validity Check (VVC) results.
Loop GroupsBasis for VVCTime horizon (month)
12th60th120th180th240th
OL5S1-Actual UAS NumberGaps between OL5S1 and the historical data (%)−1.08−5.98−4.50−2.371.16
HL6A1-Required Maintainer PopulationRelative ratios between OL6A1 and the historical maintainer population2.391.121.041.201.086
EL4A1-Maintenance-Related Mission CancellationRelative ratios between EL4A1 and the historical total mission sorties0.5680.3340.2250.1880.132
TL1.1S2-Propulsion System Actual MTBFGaps between TL1.1S2 and the historical propulsion system MTBF (%)022.97.41−9.83−2.37
Table 4. Policy experiment variable parameter definition.
CasesStrategiesParameters in Base RunParameters in Experiment Run
Policy 1200% initial maintainer experience achieved after training (enhanced training measures, unit: %)HL5C1 = 30HL5C1 = 60
Policy 2130% initial MTBF of propulsion system achieved (modified system design, unit: hours)TL1.1C1 = 150TL1.1C1 = 200
Table 5. Representative simulation results of Policy 1.
Changes over Base Run (%)Time Horizon (month)
12th60th120th180th240th
OL5S1-Actual UAS Number−1.08−5.98−4.50−2.371.16
HL6A1-Required Maintainer Population2.391.121.041.201.086
EL4A1-Maintenance Related Mission Cancellation0.5680.3340.2250.1880.132
TL1.1S2-Propulsion System Actual MTBF022.97.41−9.83−2.37
Table 6. Representative simulation results of Policy 2.
Changes over Base Run (%)Time Horizon (month)
12th60th120th180th240th
TL4.1A1 –Times of Propulsion System Catastrophic Failure−11.50−9.22−10.60−8.52−6.15
EL5A1-Class A Mishaps per 105 H−5.51−5.26−5.40−3.30−3.24

