Article

Evaluation of the Criteria for Selecting Proposed Variants of Utility Functions in the Adaptation of Historic Regional Architecture

by
Małgorzata Fedorczak-Cisak
1,*,
Alicja Kowalska-Koczwara
2,
Krzysztof Nering
3,
Filip Pachla
2,
Elżbieta Radziszewska-Zielina
4,
Grzegorz Śladowski
4,
Tadeusz Tatara
2 and
Bartłomiej Ziarko
3
1
Malopolska Laboratory of Energy Efficient Building, Faculty of Civil Engineering, Cracow University of Technology, 31-155 Cracow, Poland
2
Institute of Structural Mechanics, Faculty of Civil Engineering, Cracow University of Technology, 31-155 Cracow, Poland
3
Institute of Building Materials and Engineering Structures, Faculty of Civil Engineering, Cracow University of Technology, 31-155 Cracow, Poland
4
Institute of Construction Management, Faculty of Civil Engineering, Cracow University of Technology, 31-155 Cracow, Poland
*
Author to whom correspondence should be addressed.
Sustainability 2019, 11(4), 1094; https://doi.org/10.3390/su11041094
Submission received: 22 January 2019 / Revised: 11 February 2019 / Accepted: 14 February 2019 / Published: 19 February 2019

Abstract

:
In this article, the authors propose ways to evaluate the criteria for the considered variants of utility functions in the adaptation of historic regional architecture. The proposed set of assessment criteria (thermo-modernisation criteria, comfort of use, financial considerations, criteria of social benefits, and protection of cultural heritage) emphasises the multidimensional character of the problem of choosing a new function for a historic building. Some of the criteria are measurable while others are difficult to measure, which requires an expert approach to their assessment. The evaluation of the criteria was performed on the example of the historic building ‘Stara Polana’ located in Zakopane. The benchmark for the analysis was the existing condition of the ‘Stara Polana’ building, which is used as a hostel. The authors conducted a series of interdisciplinary studies specifying the potential of the new utility functions considered for the object in the context of the proposed criteria. The evaluation of individual criteria developed in this article is based on the multi-criteria analysis to be performed in the future and support the selection of a new function for the building in question.

Graphical Abstract

1. Introduction

One of the tasks of modern civilisation is the protection of cultural heritage by preventing the degradation of its elements and ensuring proper conservation, development and popularisation of its values. An important resource of cultural heritage are historic buildings, which in contemporary society have a chance of survival if they are recognised by the public and have a useful function. In the literature on the subject, there is the concept of the so-called adaptability of the building, i.e., a set of various features and properties determining the simplicity of the adaptation of such a building for new utility functions [1,2,3]. Many factors may have an influence over the adaptive potential of historic buildings, such as the type of architectural and structural system; the type of load-bearing structure; the technical condition of the building; the quality and the physicochemical and mechanical properties of materials used to build them; and the possibility of these materials for being re-used in the adaptation process. In order to assess the adaptive capacity of the building, it is necessary to conduct a series of specialised tests of its building material as well as and evaluation of its historic value. [1]. Objects of historic regional architecture in Poland are located in Podhale in the southern part of the country (see Figure 1a) and are usually built in the traditional brick-and-wood style (Figure 1b). These buildings are a specific type of object whose adaptive capacity for new functions is restricted due to their limited ability to meet requirements such as energy efficiency and comfort of use [4].
The technology that was applied in the construction of a historic building largely influences the choice of options relating to the scope of renovations. Thermal insulation works performed on historic buildings are subject to specific formal and legal regulations. This results from construction law [5] and the Act of 23 July 2003 on the protection and care of monuments [6]. Technical and construction conditions [7] come into force on 1 January 2021 which require buildings to have an energy demand of almost zero. This applies to both new buildings and those undergoing renovation and thermo-modernisation, while historic objects are not included in the requirements. In the case of the renovation and thermo-modernisation of used historic buildings or objects covered by conservation protection, the requirements presented in Table 1 need to be met. However, it should be remembered that achieving such requirements, means operational savings on the one hand, but, on the other hand, it involves limiting the usable space due to the need to insulate the walls from the inside. Decisions regarding the level of improvement of the thermal insulation of partitions, as well as the level of comfort of use of a historic building, should depend on the current or planned function and should be taken individually for each object. The comfort of the internal environment, as well as energy efficiency, should be determined depending on the assumed function of the historic building. Other requirements apply for buildings functioning as museums or art galleries (due to the works of art), others apply for hotel buildings, and others still for conference centres and training facilities. The choice of a new function for a historic building is, therefore, difficult and complex due to the need to take into account many interdisciplinary factors [8]. This complex multidimensional decision-making process often forces decision-makers to process and evaluate information, both measurable (e.g., technical and financial data related to a historic building) and information that is harder to quantify (e.g., the cultural heritage value of a historic building and its social benefits) related to the analysed historic building [9,10]
In the literature many multi-criteria methods can be found for supporting the decision to select new functions for a historic building. The multi-criteria approach to the selection of a new function at historic buildings was taken into account by [11], which analysed the revitalization of historic buildings in Vilnius, Lithuania.
The authors proposed a method TOPSIS (Technique for Order Preference by Similarity to an Ideal Solution) as a tool for multi-criteria analysis of proposed utility functions in the adaptation of historic buildings. The fuzzy development of the TOPSIS method for the above purposes was continued by Zavadskas and Antucheviciene [12,13]. Another method—weighted sum—was used by Fuentes [14] when assessing the possibility of re-using four historic buildings in Spain. Wang and Zeng [15] analysed variants of utility functions for the adaptation of two historic buildings in Taipei, Taiwan. As a multi-criteria analysis tool, they used one of the structural modeling methods, the ANP (Analytic Network Process) method. Breil, Giove and Rosato [16] and Giove, Rosato and Breil [17] used the “Choquet” integral for a multi-criteria analysis of the selection of a new utility function for the Venetian Arsenal building in Italy. An interesting approach to solving the discussed decision problem was proposed by Ferretti et al. [18], who examined the possibility of using the multi-attribute value theory (MAVT) in the analysis of the preferences of historical objects in Turin to perform a specific utility function. Recently, Radziszewska-Zielina and Śladowski [19] proposed a fuzzy extension of the WINGS (Weighted Influence Non-linear Gauge System) in order to model the imprecise, incomplete and uncertain character of information that experts must process as part of the selection of a new utility function for the historic Great Armory building in Gdansk. In [20], the authors of this article proposed a multicriteria hybrid model (using the DEMATEL method (Decision Making Trial and Evaluation Laboratory) and ANP to select a utility function for the purpose of adapting the building ‘Stara Polana’ located in Zakopane. This article is a continuation of work on the preparation of ways to assess individual criteria for the selection of functions for the building in question, which will be the basis for the multi-criteria analysis carried out in the future based on the hybrid model proposed in the previous work [20].
In this work, the authors propose methods of assessing the criteria (measurable and difficult-to-quantify) adopted in [20] for different variants of utility functions in the adaptation of historical regional architecture in Podhale, Poland. The assessment is based on the example of the ‘Stara Polana’ villa in Zakopane. The criteria taken into account for the ‘Stara Polana’ building are shown in Figure 3.
One should pay attention to the interdependence of some proposed criteria for the selection of the utility function of a historic building. These dependencies can be linear as well as nonlinear. It is necessary to take into account interdependencies (e.g., so-called feedback) between these criteria. This leads to the adoption of the network nature of links between them. In Figure 3, network nodes symbolize the criterion data and the potential relationships between them are determined by arrows (arcs). The size (diameter) of nodes symbolizes the significance of a given criterion in the system.

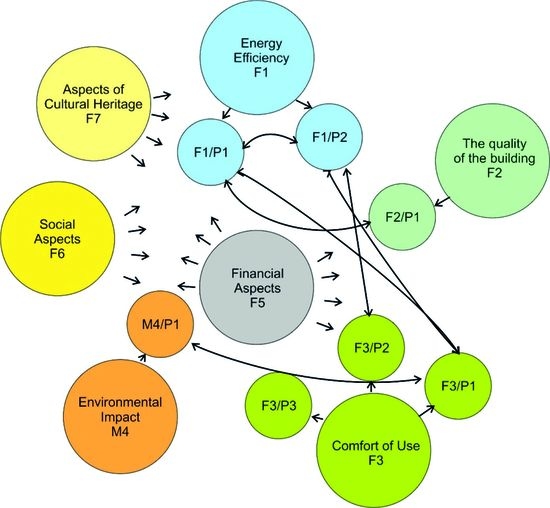
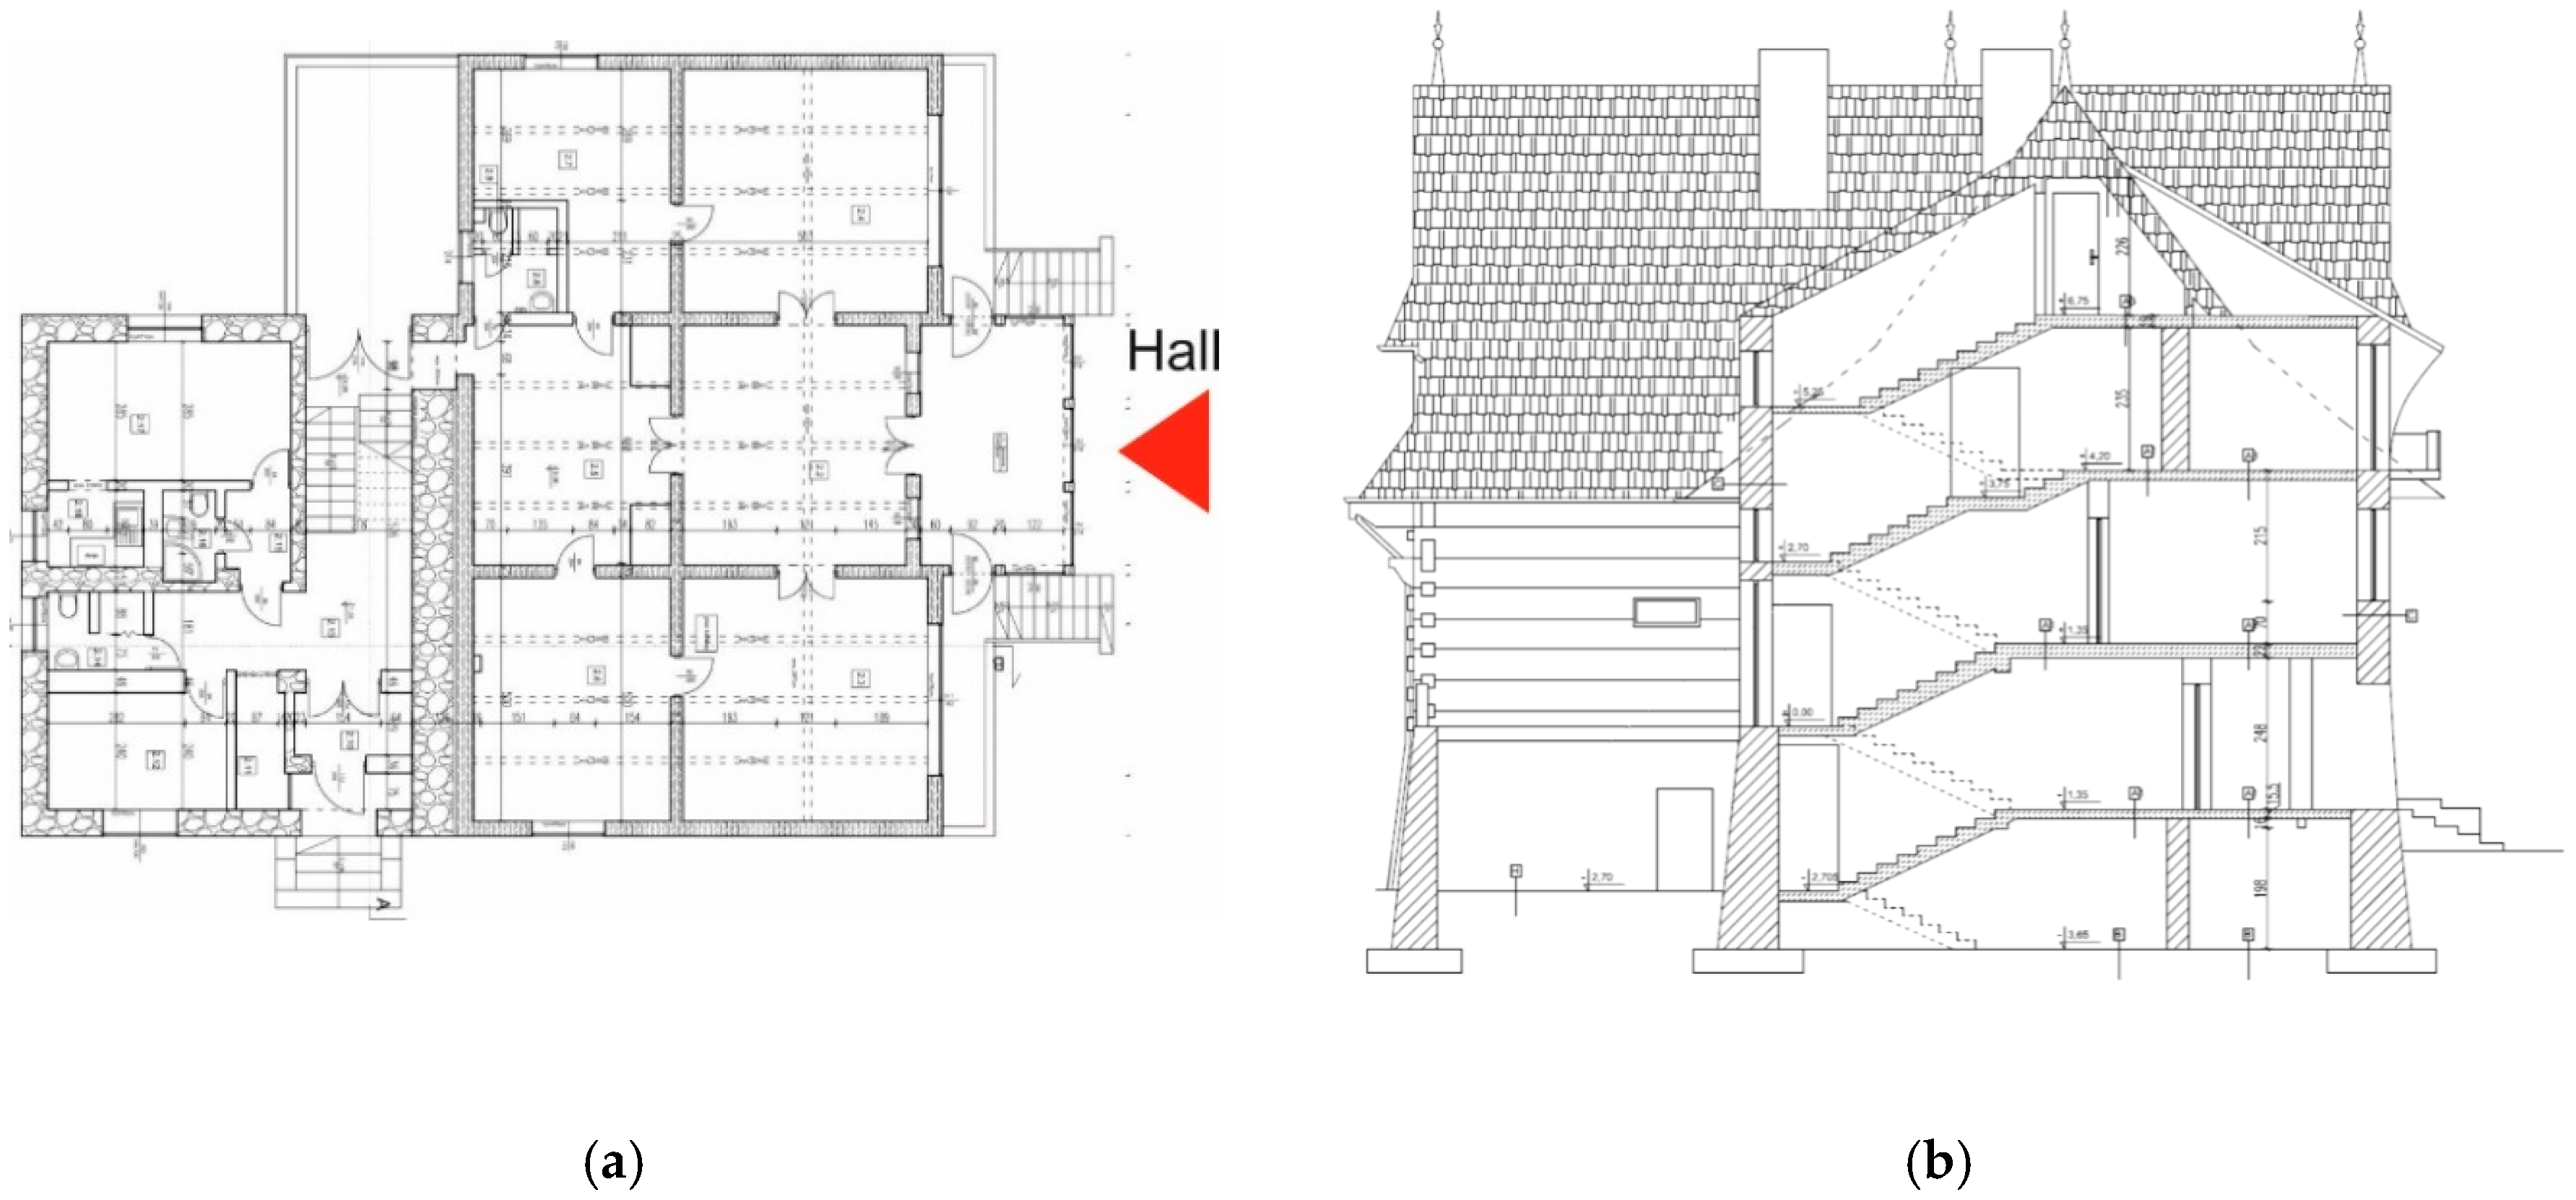
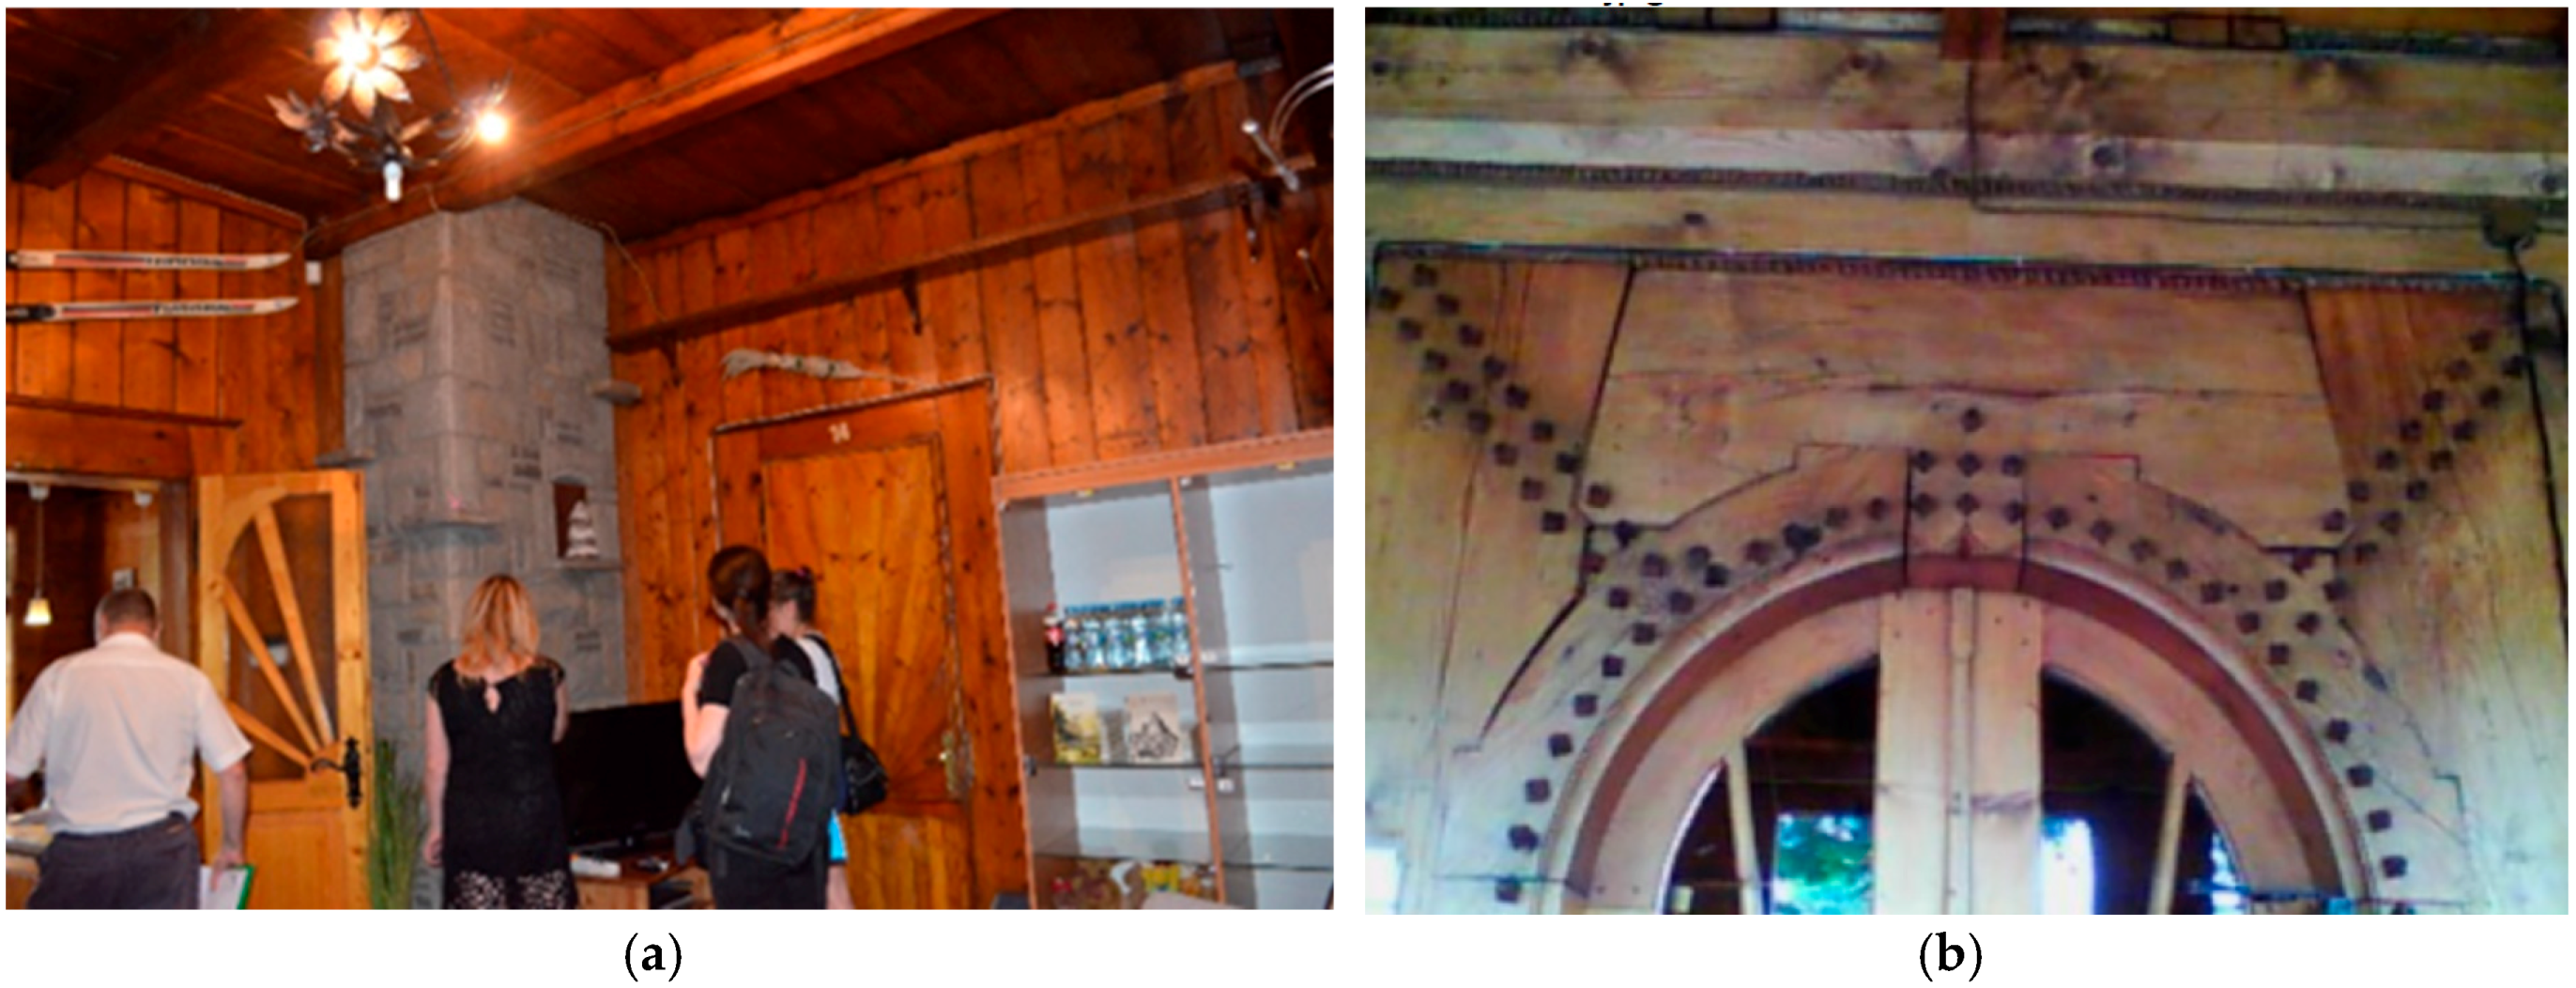
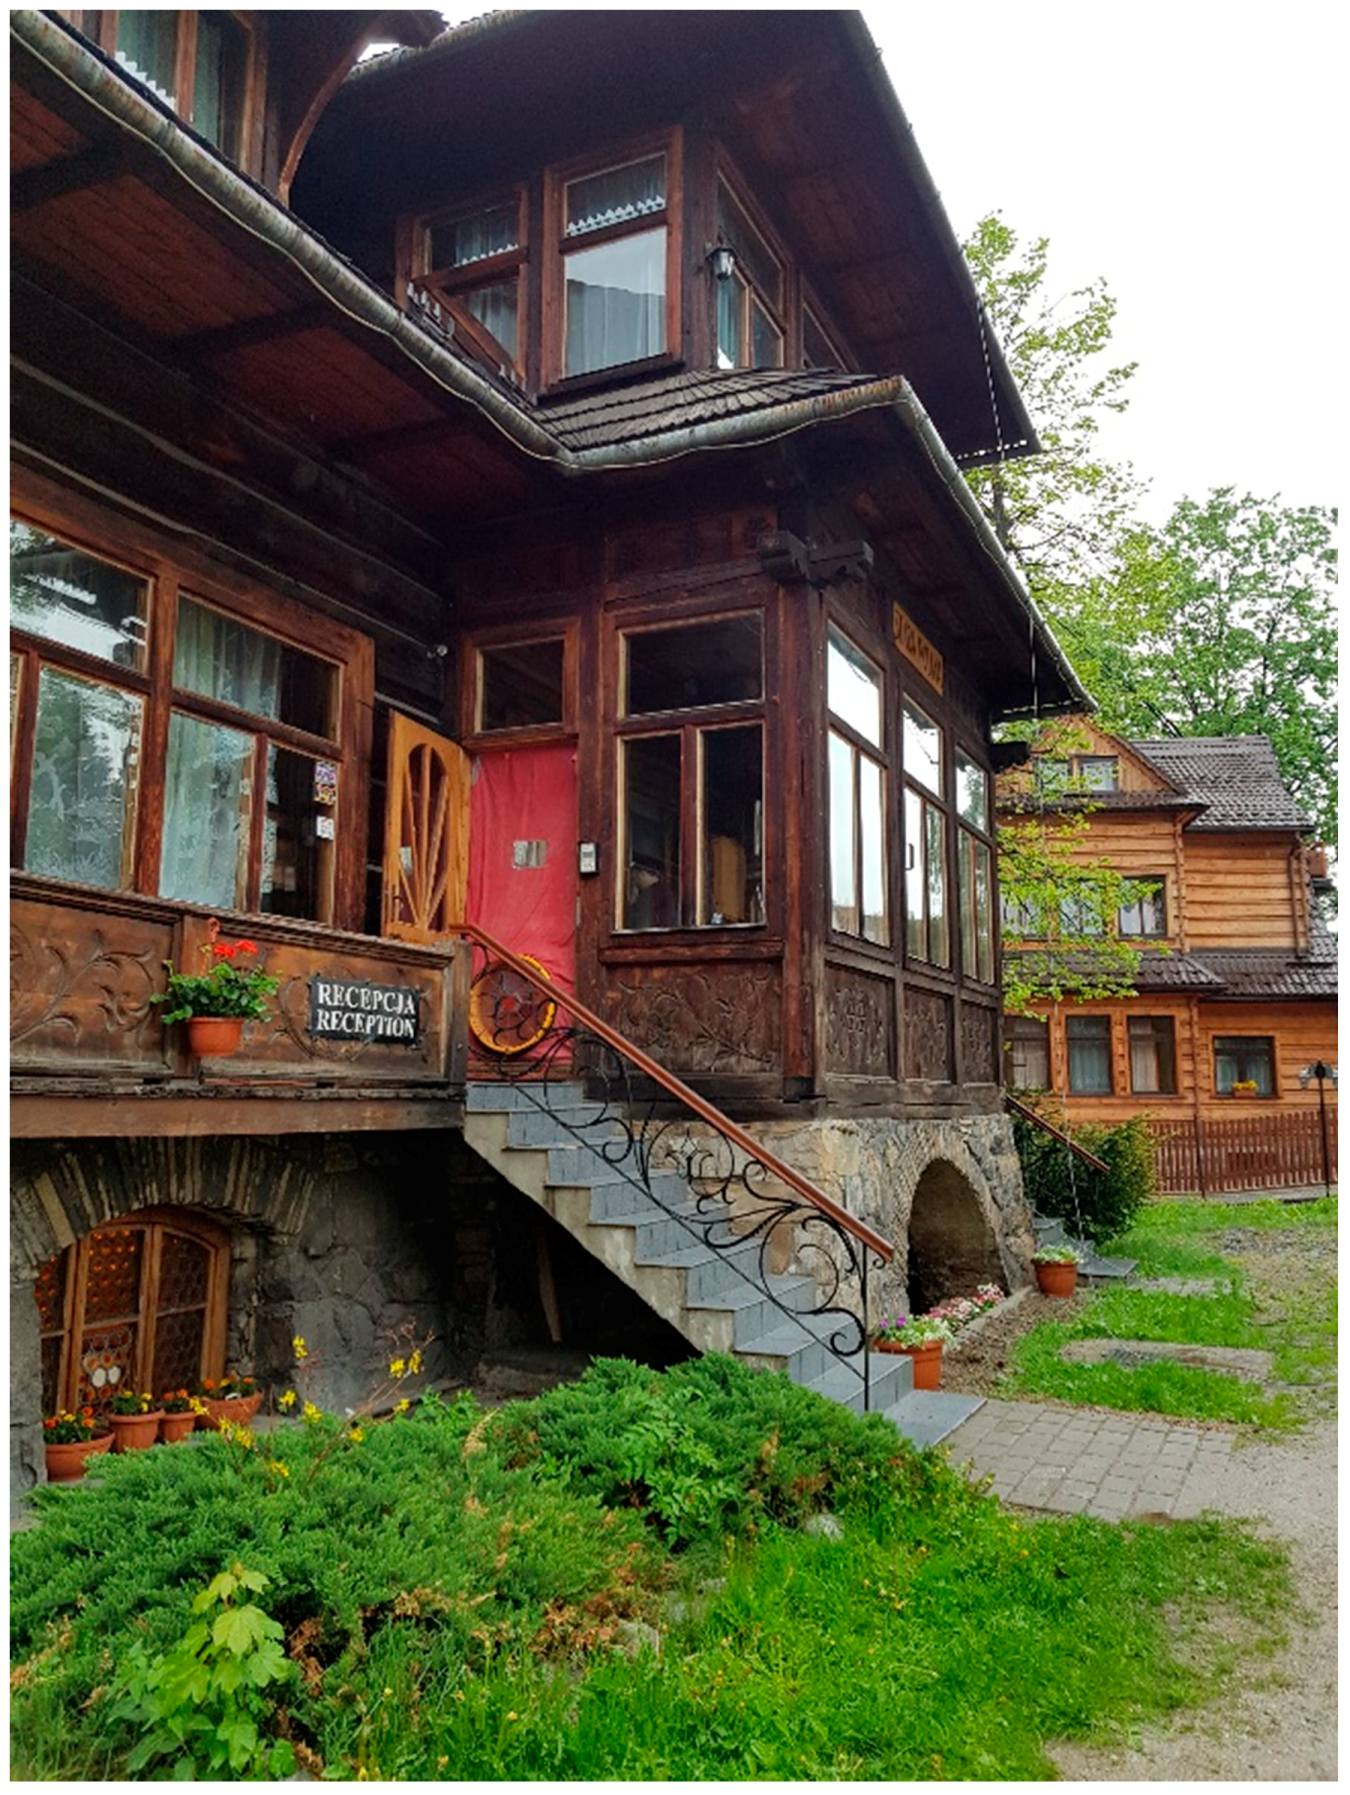
2. Representative Building and Methods of Analysis

The ‘Stara Polana’ building is located in the centre of Zakopane. The building is owned by Cracow University of Technology; it is currently being used as a hostel. The building is located among low buildings on the main road through Zakopane: Nowotarska Street. This is a historic building, a villa in the Witkiewicz style, which was built in 1905 for the Płaza family by the builder Jan Ustupski-Kubecek. The condition of the building qualifies it for thorough renovation and thermo-modernisation. A detailed description of the building is provided in work [20]. Figure 2a shows a horizontal cross-section of the building. Figure 2b shows the vertical cross-section of the building.
Figure 3a shows the interior and in Figure 3b, the detail of wooden connections. The building has a basement made in brick and aboveground floors are built in wood.
The ‘Stara Polana’ building has not been modernized. Partitions do not meet the requirements of the regulations in force in Poland. Data regarding thermal insulation parameters of the building are presented in Table 1. Data regarding energy indicators are presented in item 3.2 and item 3.7. The building must be thermo-modernized. Mould growth is present on the basement walls.
The owner of the building has not yet decided upon the future utility function.
In agreement with the investor of the object, the authors have accepted the following possible future functions of the ‘Stara Polana’ villa:
  • Public building—Hostel (existing condition (‘Reference variant’);
  • Public building—Five-star hotel (‘Variant 1’);
  • Public building—Zakopane Art Gallery (‘Variant 2’); and
  • Public building—Conference and training centre with accommodation option (‘Variant 3’)
Methods for evaluating individual criteria for the reference state and suggested variants of utility functions of the building in question are proposed later in this article.

3. Evaluation of Criteria for the Existing State and Variants of New Functions

The evaluation criteria of the reference variant and the proposed variants 1–3 are shown in Figure 4. The main criteria (Fi) are divided into sub-criteria (Fi/Pj). For the needs of the analysis, the authors propose the introduction of utility classes for each of the criteria (A–C). These classes illustrate the level of requirements for each sub-criterion (Fi/Pj). Classes for individual sub-criteria are described for each criterion.
According to the method adopted by the authors, for each type of building function, the criteria and their values are accepted by experts. In the analysed case study, the team of experts determined the assessment criteria presented in Figure 4. As an energy efficiency criterion (F1) the following was assumed to be the subcriterion F1/P1–grade of the thermal insulation of the building’s envelope. It is a criterion compatible with the standard’s methodology [21,22]. Thermal insulation of the external walls is directly connected with loss of heat between the building’s envelope. The second subcriterion in the energy efficiency area (F1/P2) is the final energy coefficient (EK), which is calculated according to methodology found in [23]. The EK coefficient points to the total energy consumption (heating/cooling of the building). Quality of the construction (criterion F2) is assigned by the airtightness of the building envelope. It is in accordance with the methodology found in [24]. The “in situ” tightness test is supported by thermography, according to the test method presented in [25]. With respect to criterion F3 (comfort of use of buildings), the authors have taken to evaluate the building, due to the fact that many buildings, thermo-modernized or newly designed, do not ensure the well-being of users. It should be admitted that the problem of providing the comfort in use is a topic mentioned in publications in the 1970s [26] by the Danish scientist Ole Fanger, but modern therrmomodernisation and construction systems are the reason why the concept of comfort should be treated in a multi-aspect manner. This approach to comfort design is presented in [27]. Currently is developed CEN standard 16798-1 [28] is based on the standard EN 15251 [29]. The multi-aspect comfort design is implemented by the F3/P1 sub-criterion, which specifies thermal comfort in accordance with the methodology given in [27,29,30]. The sub-criterion of the F3/P2 (vibrational comfort) is determined according to the methodology in [31], while the sub-criterion of acoustic comfort was determined in the "in situ" tests according to the methodology contained in [29,32]. The building’s environmental impact criterion was determined based on the non-renewable Primary Energy index, determined in accordance with the methodology in [23]. The EP indicator is an indicator determining the use of renewable heat sources in the building use, so it directly indicates the building’s environmental impact. Criteria F5, F6, and F7 are related to financial, social and cultural heritage aspects. These criteria are determined on the basis of expert knowledge and surveys of future users of the historic building in which the function will be changed.

3.1. Criterion F1/P1-Energy Efficiency; Improvement of Insulation of External Partitions

3.1.1. Methods

The thermal insulation of the building is determined by the heat transfer coefficient of the building envelope U (W/(m2K)). This terminology is discussed in [33]. Based on the architectural and construction design as well as the technical description, the actual coefficient of external partitions for the ‘Stara Polana’ building was determined. The calculations were made on the basis of standards [21,22].

3.1.2. Results

Table 1 presents the results of calculations of the heat transfer coefficient U (W/(m2K)) for the building envelope of the ‘Stara Polana’ building (reference variant). The results of calculations referring to thermal protection were made accordingly to [7]. Calculated coefficients of the external envelope of the ‘Stara Polana’ differ from the current requirements. As stated in the introduction, historic buildings undergoing renovation are exempt from the requirements of thermal protection due to their historic character. However, all other existing buildings that undergo thermal modernisation and renovation must meet the requirements of the technical conditions [7].
Table 2 presents adopted classes for the sub-criterion F1/P1 dependent upon the proposed function of the ‘Stara Polana’ building. As an example, the classes adopted for the requirements of the thermal insulation of external walls are presented. For variant 1 (five-star hotel), it was assumed that it will be a passive buildings corresponding to class ‘A’. In variant 2 (Zakopane Art Gallery), the main focus is not on energy efficiency; therefore, class ‘C’ was assigned. For variant 3 (conference and training centre), the criterion of energy efficiency is important but not a priority [34].

3.2. Criterion F1/P2-Energy Efficiency; Improvement of the Final Energy Index EK (kWh/(m2year))

3.2.1. Methods

Final energy is defined as thermal energy and auxiliary energy which must be delivered to the boundary of the heating system (building) with a given efficiency in order to cover the heat demand required for the heating and ventilation of the rooms. Final energy should fulfil requirements for living, and hygienic and economic needs. The value of the final energy is characterised by, inter alia, the quality of the thermal protection of rooms, thermal insulation, the tightness of the entire external envelope and the technical condition of the heating and cooling installations. The final energy value [kWh/(m2year)] was determined in accordance with the methodology stated in regulation [23] as an EK index which indicates the annual final energy demand per unit area of rooms with adjustable air temperature in a building or flat, expressed in kWh/(m2y). The EK indicator was determined in accordance with the Equation (1):
EK = QK/Af (kWh/(m2 · year))
where:
  • Qk—annual demand for final energy supplied to a building or part of a building for technical systems (kWh/year); and
  • Af—area of rooms with adjustable air temperature (heated or cooled surface) (m2).
Polish technical conditions [7] do not specify the minimum requirements for the EK indicator. This indicator directly refers to the energy efficiency of buildings. In German regulations regarding energy efficiency [35] on the basis of the EK indicator, energy efficiency classes of buildings are introduced. Energy demands for the heating of buildings have also been added to the energy efficiency requirements in the technical and construction regulations in Austria [36].

3.2.2. Results

The annual heat demand for heating the building (taking into account the efficiency of the heating system and heating breaks) for the reference variant of the ‘Stara Polana’ building is 244.79 kWh/(m2year). Improving the energy efficiency of buildings by reducing the EK indicator is associated both with improving the thermal insulation of the building envelope and modernising the installed technical equipment. The improvement classes for historic buildings are proposed in Table 3.
Table 3 presents adopted classes for sub-criterion F1/P2 dependent upon the proposed function of the ‘Stara Polana’ building.
Variant 1 (five-star hotel) was adopted as a passive building; therefore, for this variant, energy efficiency is a priority. The variant corresponds to class ‘A’ for the sub-criterion F1/P2. Variant 2 (Zakopane Art Gallery) due to the need to preserve as much as possible of the natural structure of the building (visible wooden beams, carpentry joints) was assigned to class ‘C’. Variant 3 (conference and training centre) should be an energy-efficient building, although this is not the main priority. Variant 3 was assigned to class ‘B’.

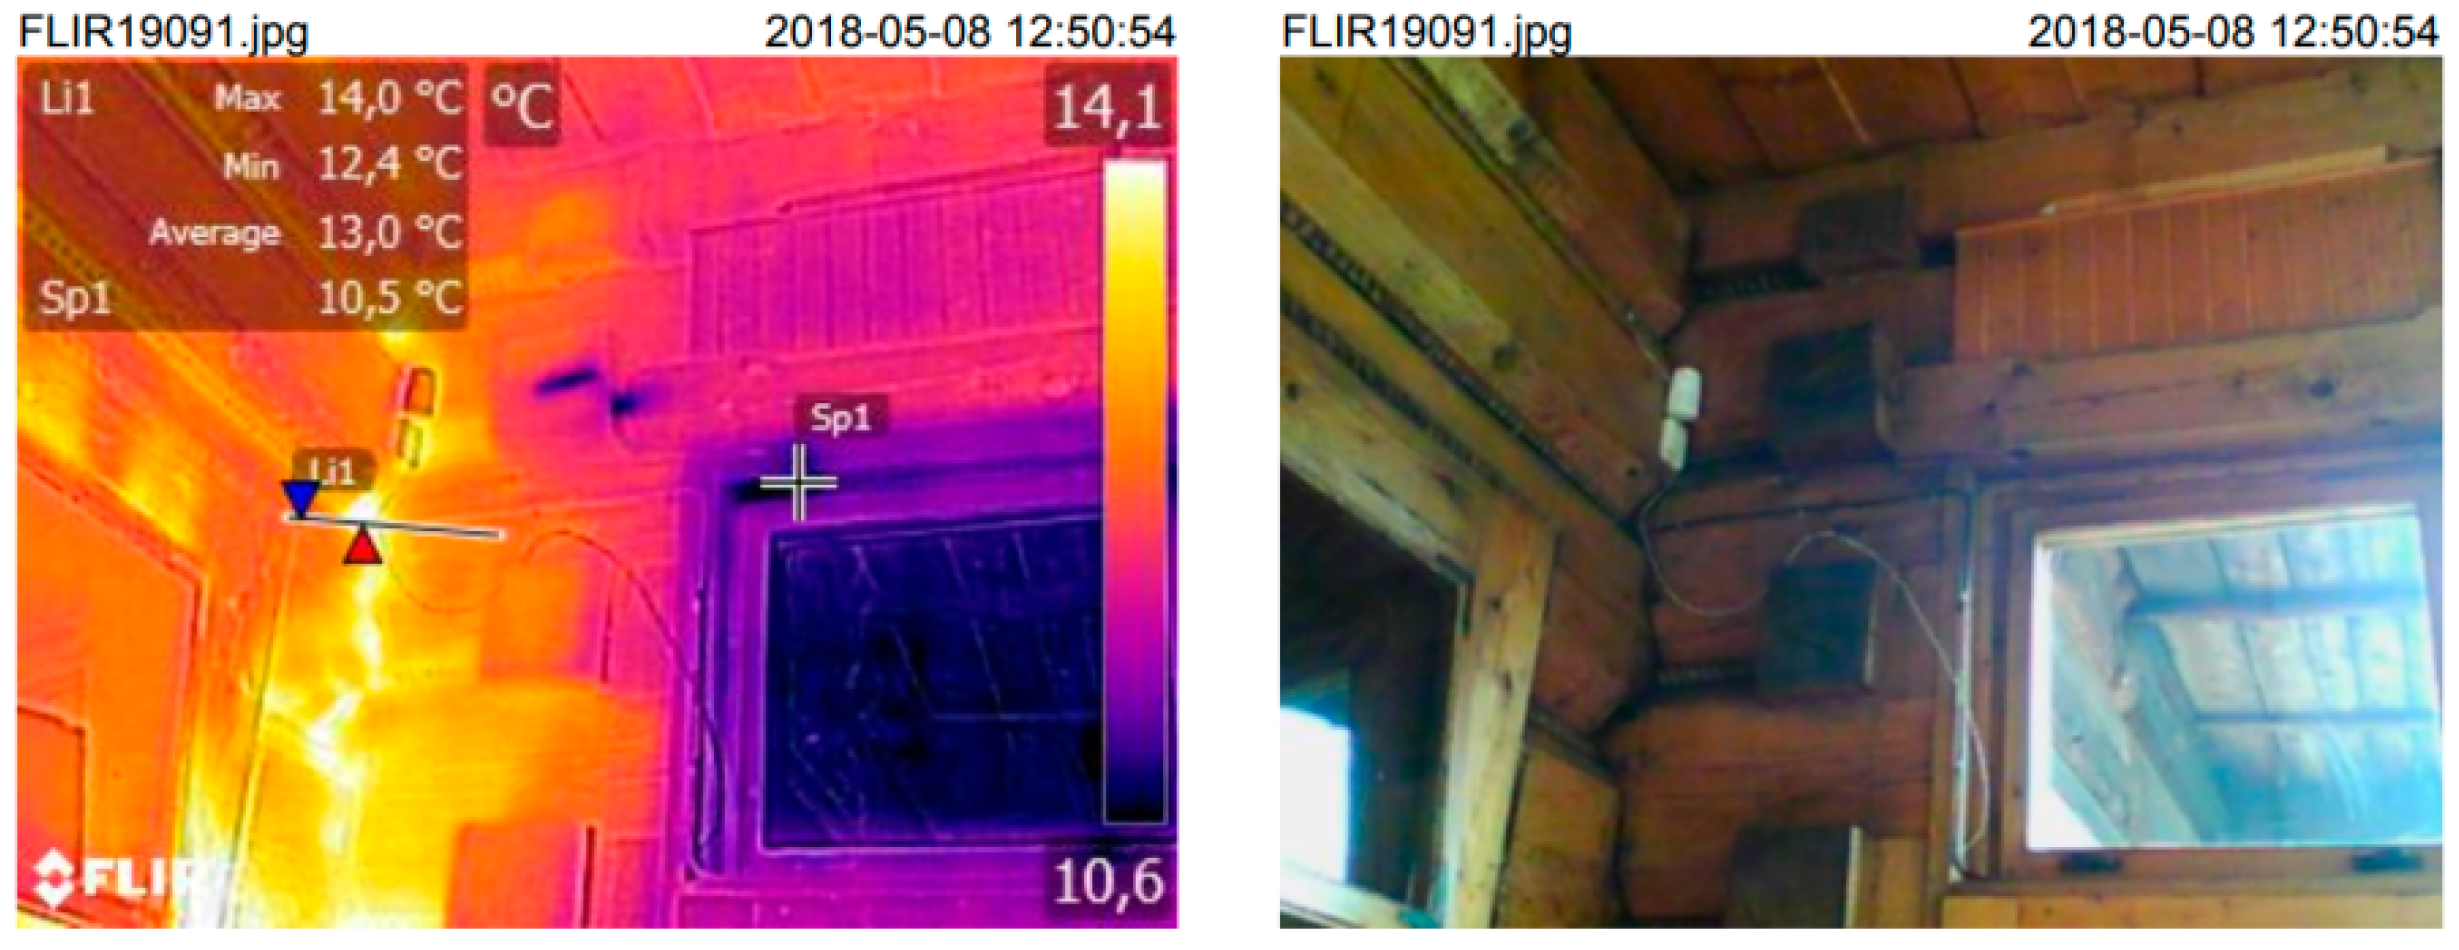
3.3. Criterion F2/P1-Quality of the Building Envelope; Improving the Tightness of the Building Envelope; Detection of Thermal Bridges through Thermography Tests

3.3.1. Methods

Tightness testing of the buildings is one of the ways to control the quality of construction works. Detection and subsequent removal of unwanted leaks can reduce the energy needed to heat the object. Polish legislation does not impose an obligation to carry out building tightness tests; they are only a recommendation. Suggestions for tightness are contained in [7]. Air tightness is determined for buildings with gravitational ventilation at the level of n50 ≤ 3, 1/h and for buildings with n50 ≤ 1.5, 1/h. Passive buildings should have a coefficient value of n50 ≤ 0.6 [1/h]. Tightness testing is obligatory for passive buildings. The measurement method is included in PN-EN 13829:2002 [24].
Figure 5 presents the results of tests for 48 buildings with mechanical ventilation. According to [7], the n50 coefficient should be n50 ≤ 1.5 [1/h].
The tightness test on the ‘Stara Polana’ building was performed according to the standard [24] using the pressure measurement method with the use of a fan; it was performed using a system for testing the air tightness of the building envelope by means of the generated Retrotec Q5E pressure system with a capacity of 14,100 m3/h at 50 Pa. The test was carried out at 1:00 p.m. on 8 May 2018 under the following weather conditions: barometric pressure: 91.95 kPa, wind force 3 (light breeze), external temperature 15 °C, internal temperature 19 °C. The building’s cubic capacity is 2119.63 m3, Figure 6 shows the method of performing the tightness test in the ‘Stara Polana’ building.
An additional examination of the construction quality of the ‘Stara Polana’ building was the implementation of the thermography measurement. Thermography is one of the methods of object diagnostics involving the measurement of radiation in the infrared band. The methodology of thermography tests is described in the PN-EN 13187 [25] standard.
The thermographic test was performed with a FLIR thermal imaging camera with a thermal sensitivity of 0.06 °C and a bolometric matrix resolution of 320 × 240.

3.3.2. Results

For the ‘Stara Polana’ building, the result of the tightness test for negative pressure n50 = 10.09 [1/h] and for overpressure n50 = 8.83 (1/h) was achieved. Figure 7 presents a thermal image taken inside the building.
The thermographic test showed very large leaks in the structure and enabled locating heat loss sites.
Table 4 presents the adopted classes for sub-criterion F2/P1 dependent upon the proposed function of the ‘Stara Polana’ building.
The result of the tightness test is significantly different from the value of the proposed classes; this is due to the unsealing of wooden walls and connections. After well-performed insulation, the values proposed in the classes can be achieved. Obtaining the tightness of the building envelope is associated with the minimisation of energy consumption for heating purposes. An example of how to properly insulate a historic building from the inside is presented in Figure 8. The Figure 8 shows the correct insulation of the walls of historic buildings. The graph shows the pressure diagram of saturated steam and the water vapour pressure diagram. These are pressure graphs, therefore, the unit is Pa. The lines do not intersect. The wall will not condense water vapor. The thermal insulation is done correctly.

3.4. Criterion F3/P1-Comfort of Using the Rooms; Thermal Comfort
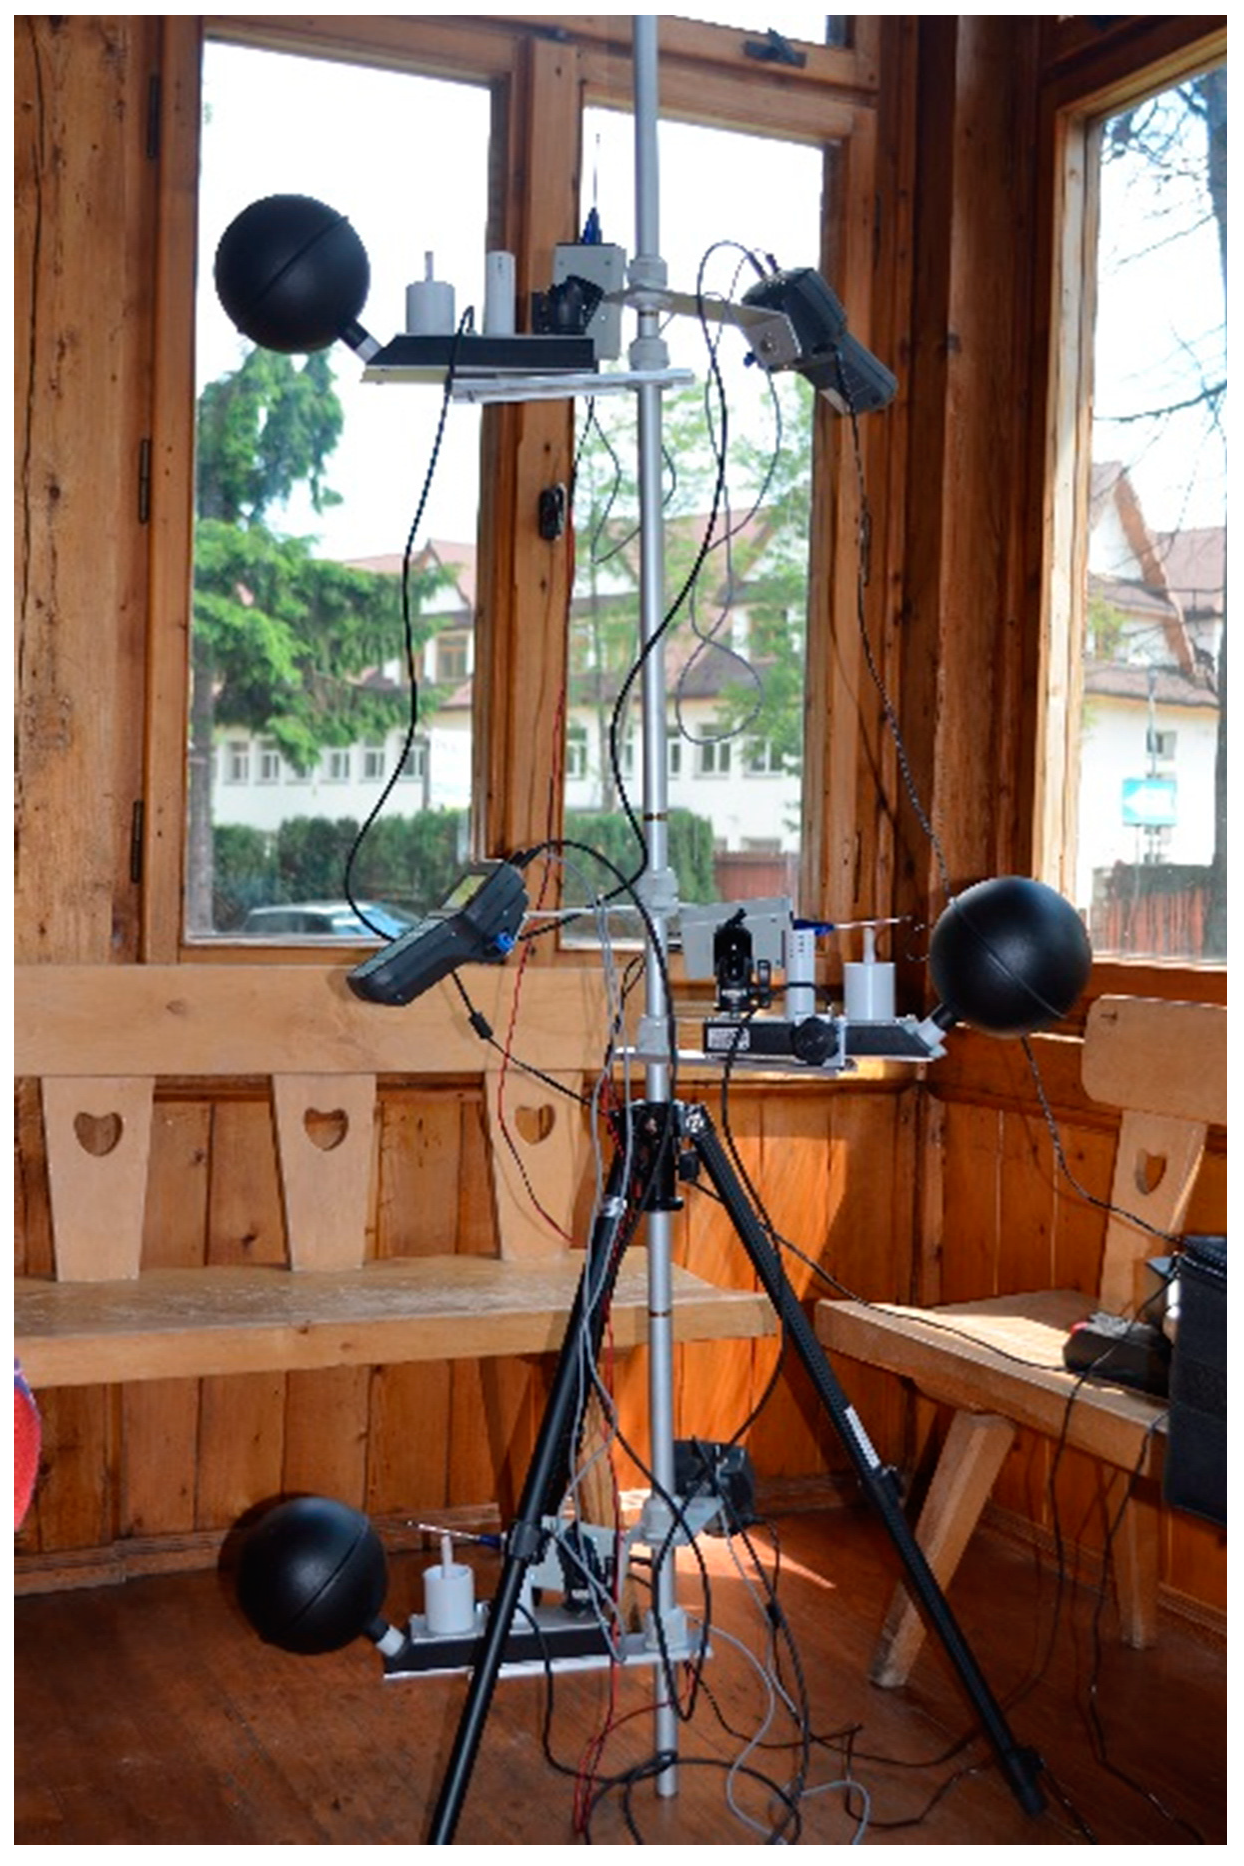
3.4.1. Methods

Providing the appropriate thermal comfort in NZEB buildings as well as those subjected to thermo-modernisation is one of the most important elements in designing and constructing buildings. Both room overheating and cooling are subjects of research and analysis performed in low-energy and passive buildings [37,38,39]. Thermal comfort is also affected by design errors, such as leaks in the building envelope, thermal bridges, and unevenly heated surfaces. The PN-EN ISO 7730 [27] standard introduces a division into room categories on the basis of the achieved PMV factor. The classes are presented in Table 5.
The methodology for determining thermal comfort is based on PN-EN ISO 7730 [27] and the measurement methodology is based on PN ISO 7726 [30]. The tests were performed using measuring equipment that meets standard [30]. The measuring device was a microclimate meter (Figure 9). The tests were conducted in the period 22 May 2018 to 31 May 2018. The measuring device was located in the guest room of the ‘Stara Polana’ hostel. Thermal insulation of clothing was determined based on the standard PN-EN ISO 9920:2009 [40]. Insulation of clothing was determined as the value for the transitional season of clothing worn at home Iclo = 0.7 (clo).
The measured parameters were:
  • ta—air temperature measurement;
  • tg—temperature of blackened sphere (heat radiation meter)—the black sphere, in agreement with the norms, should be 15 cm in diameter;
  • tnw—natural wet-bulb temperature measurement;
  • RH—measurement of relative air humidity; and
  • Va—measurement of air flow speed.
The frequency of data collection was every 1 min.
The data from the sensors is provided in Table 6.
On the basis of measurements, thermal comfort parameters were calculated from Equation (2).
The designated parameters are:
  • PMV—predicted average thermal comfort rating [27];
  • PPD—predicted percentage of dissatisfied people [27]; and
PMV= [0.303 × exp(−0.306 × M) + 0.028] × ((M − W) − 3.05 × 10⁻³ × [x5733 − 6.99 × (M − W) − pa]
−0.42 × [(M − W) − 58.15] − 1.7 × 10⁻⁵ × M × (5867 − pa) − 0.0014 × M × (34 − ta)
−3.96 × 10⁻⁸ × fcl × [(tcl + 273)4-(tr + 273)4] − fcl × hc × (tcl − ta))
tcl = 35.7 − 0.028 × (M − W) − Icl{3.96 × 10⁻⁸ × fcl × [(tcl + 273)4 − (tr + 273)4] + fcl × hc × (tcl − ta)}
where:
  • M—the amount of metabolism (W/m2);
  • W—the density of energy loss in the form of mechanical work (W/m2);
  • Icl—clothing insulation ( m2K/W);
  • fcl—surface of clothes (m2);
  • ta—air temperature (°C);
  • tr—average radiation temperature (°C); and
  • tcl—temperature of the clothes surface (°C).
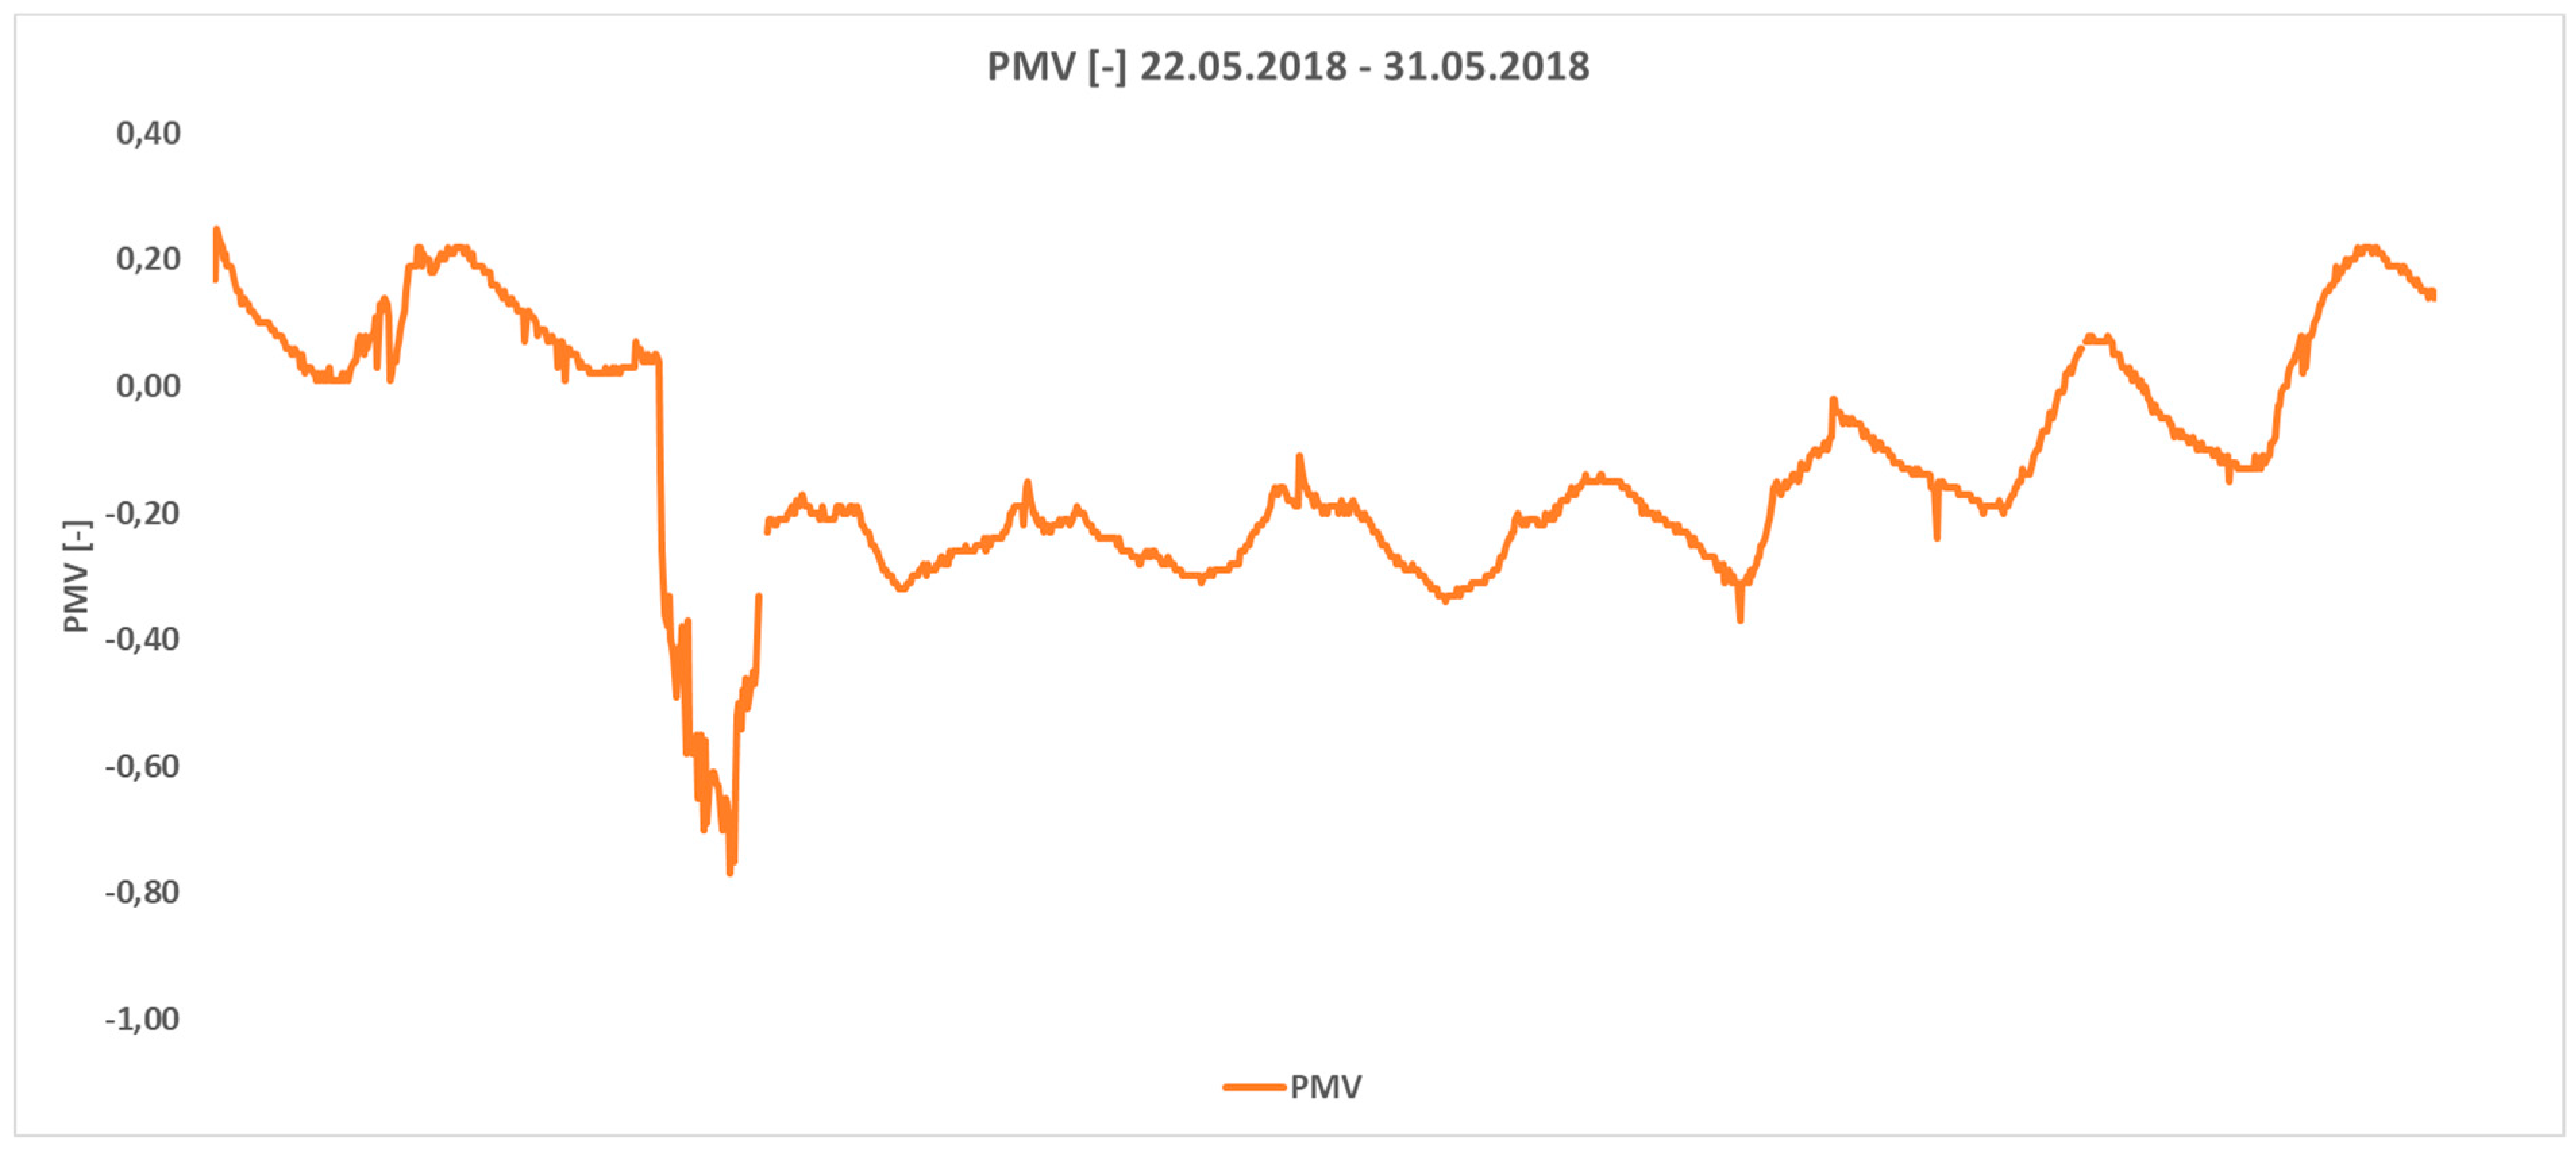
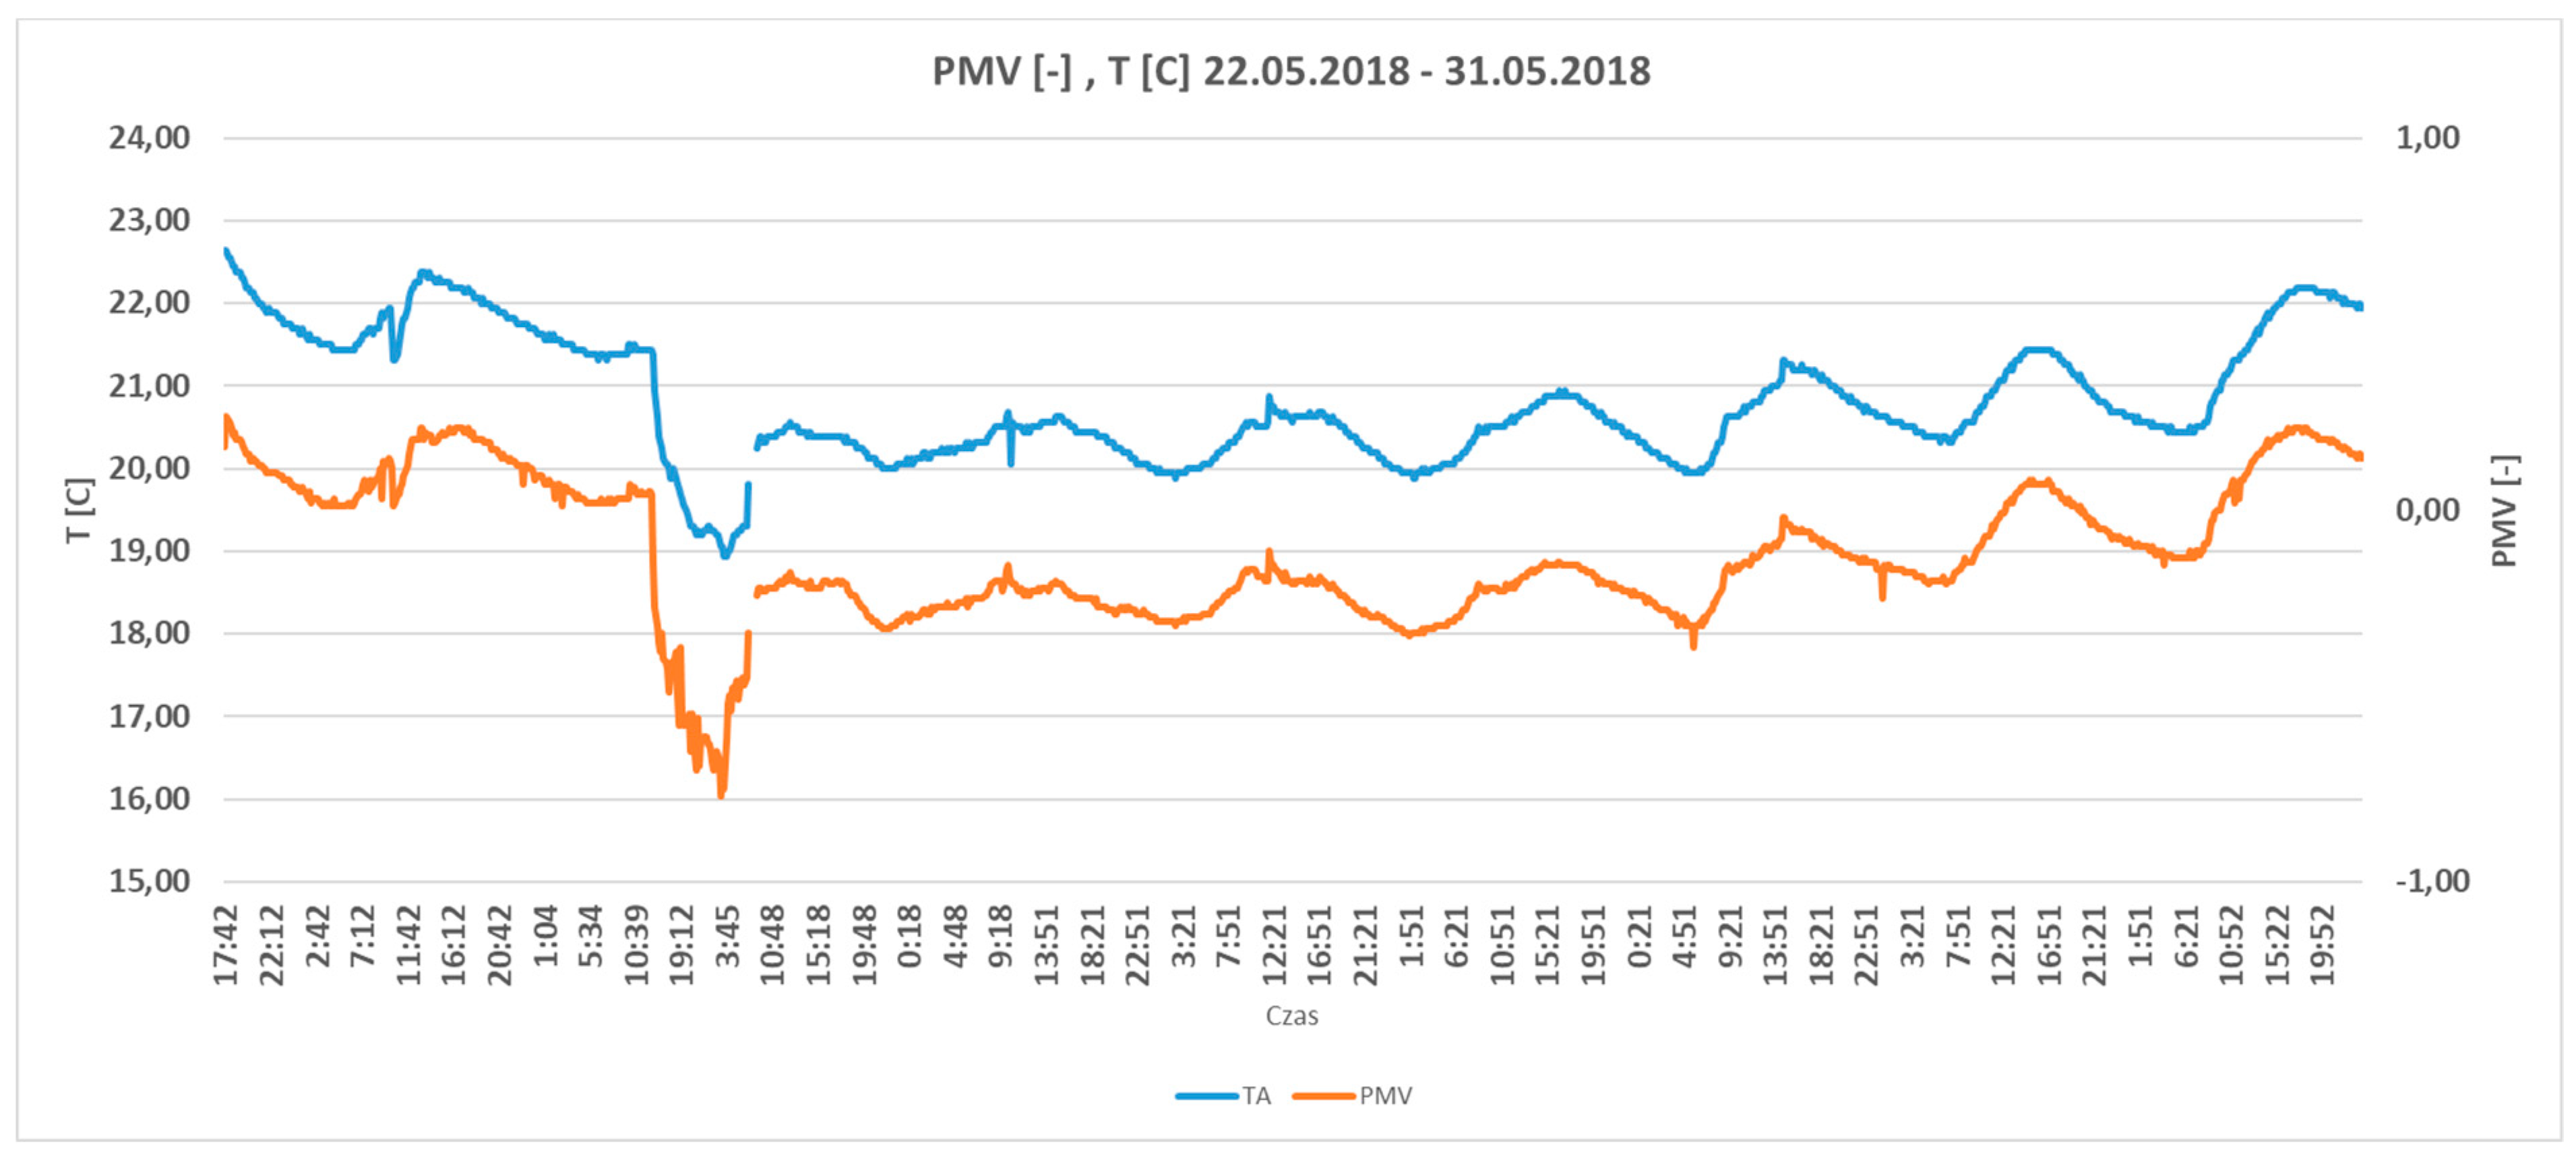
3.4.2. Results

The results of the performed tests are presented in Figure 10, Figure 11 and Figure 12. Figure 10 displays the temperature recorded on the microclimate gauge. Figure 11 presents the thermal comfort index in the analysed period. Figure 12 displays the dependence of PMV on temperature.
The results presented in Figure 10 show a stable room temperature. Maximum temperatures in the research process were over 22.5 °C and the lowest was nearly 19 °C. The thermal comfort coefficient, expressed by the PMV value, ranged from −0.7 to approx. 0.25. In Figure 12, a clear relationship between PMV and internal temperature can be observed. Thermal comfort is ensured by large expenditures incurred for heating the building. Table 7 presents adopted classes for the sub-criterion F3/P1 dependent upon the proposed function of the ‘Stara Polana’ building.
In five-star hotels, in addition to low energy consumption, priority is given to the comfort of staying hotel guests. For this variant, grade A was assigned to the gallery and the training and conference centre was assigned to class B.

3.5. Criterion F3/P2-Comfort of Using the Rooms; Vibration Comfort

Discussion about providing vibroacoustic comfort is recently present in [41,42]. The building which was chosen for analysis is located in Zakopane close to Nowotarska Street.
The external source of vibrations, which is Nowotarska Street, is located 20.6 m from the building. The building is located in the zone of dynamic influences [43] and vibrational comfort requires assessment.

3.5.1. Methods

Dynamic measurements were made on 8 May 2018. The measurements were made using accelerometers which properties related to dynamic error measurements were described in [44,45]. Thirty-seven dynamic events, mostly heavy-truck-passing events, were recorded, but only 24 recorded signals were free from internal excitations. Measurement points were located in the hall on the ground floor and in the guest room on the first floor (see Figure 1b). PCB accelerometers were placed in the middle of the floor in accordance with [31] and measured vibrations in three orthogonal directions: two horizontal ‘x’ and ‘y’ and in vertical ‘z’ (Figure 13). Accelerometers were placed on a special disc in accordance with [31] (see Figure 13).
An example of a vibration record obtained during measurements is presented in Figure 14.
Vibration records obtained from monitoring were used for human perception evaluation according to the RMS procedure available in [31,46].

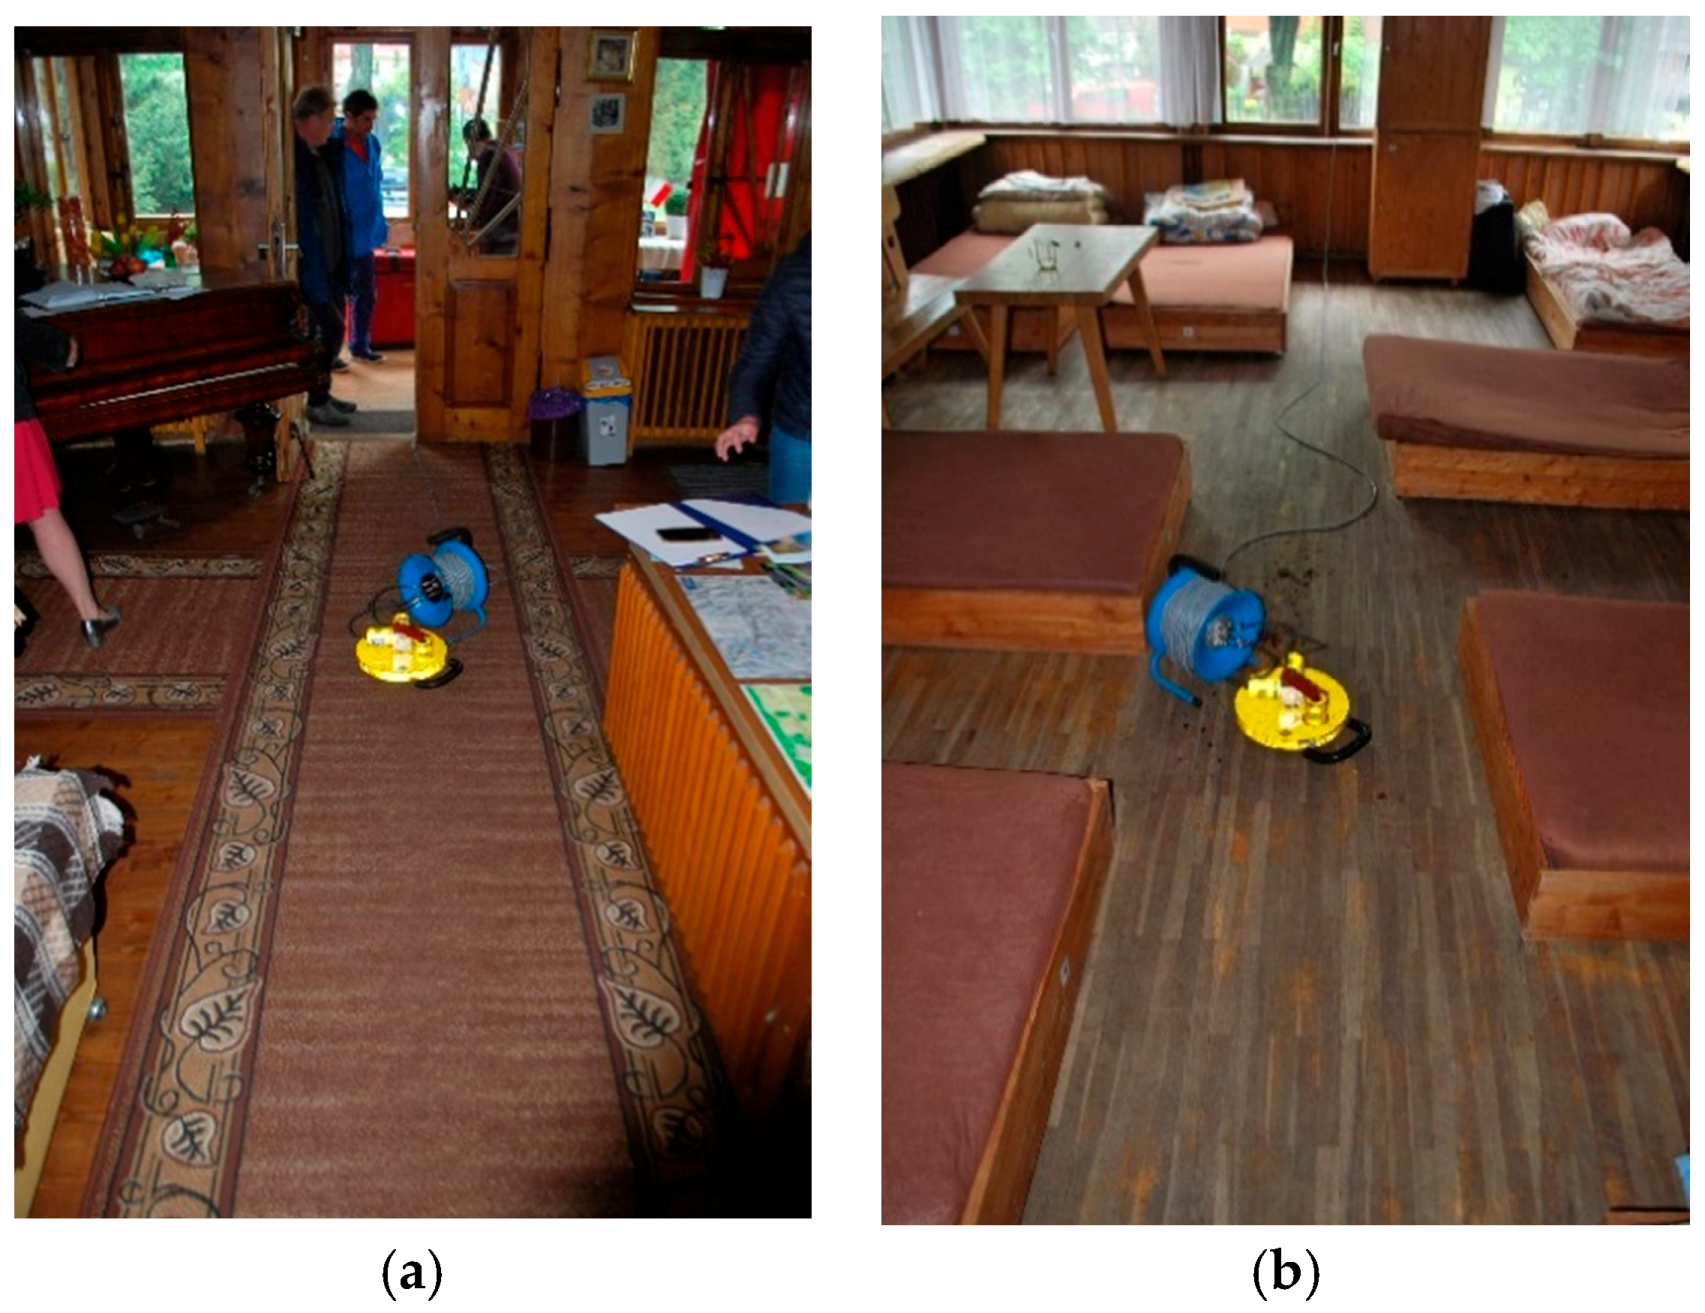
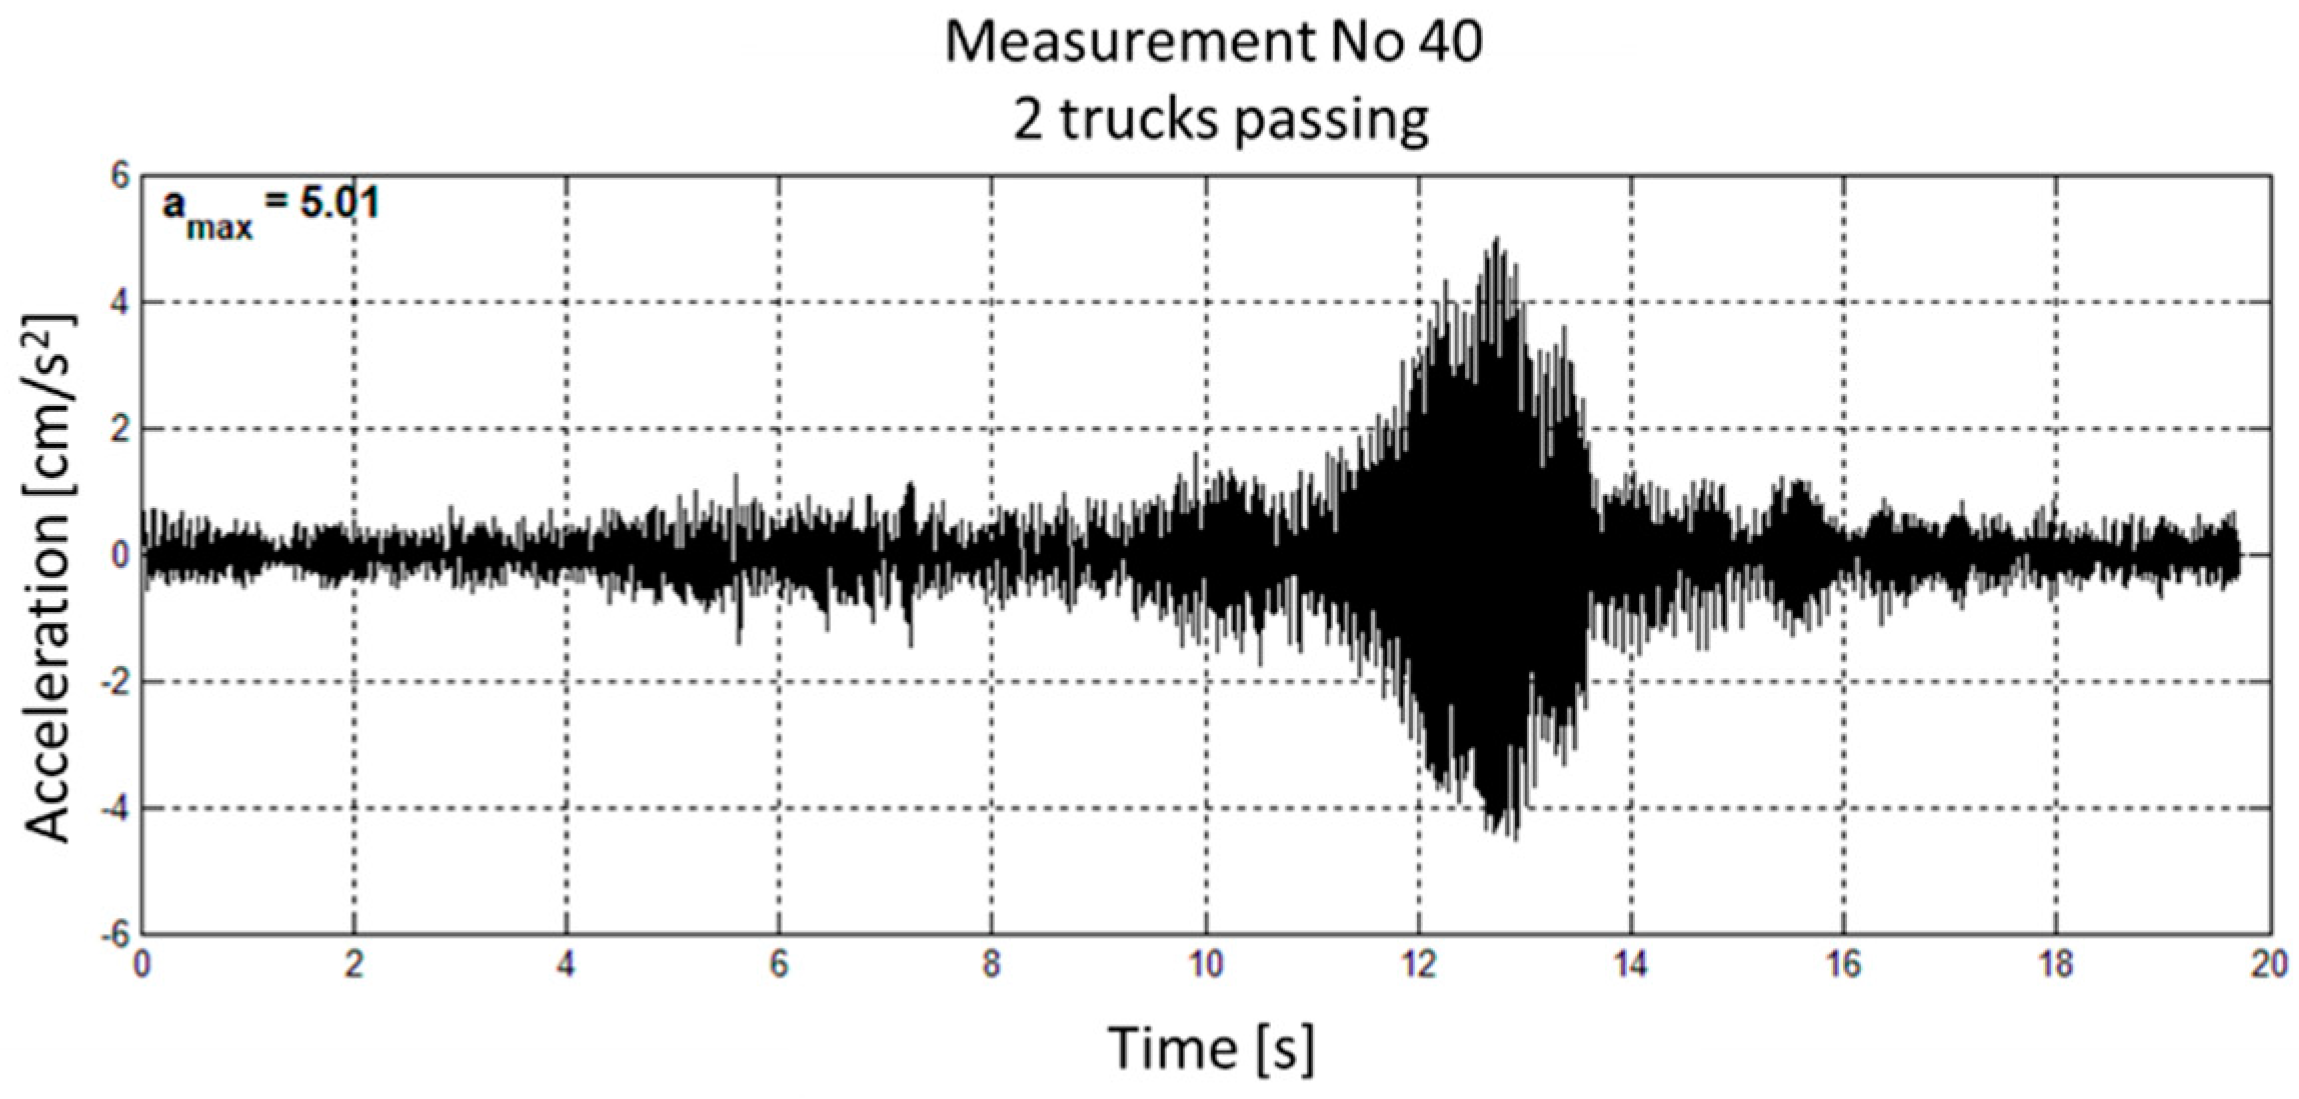
3.5.2. Results of Human Perception of Vibrations

For all analysed signals, the human perception threshold was not exceeded. An example of the RMS results for measurement no. 40 is presented in Figure 15.
HVPR (the human vibration perceptivity ratio) described in [47] never reaches a value of 1, which means that vibrations are not perceptible according to [31]. In this paper, due to the proposed modifications of the utility function, new values of HVPR are proposed (see Table 8). The proposed values of HVPR result from the experience of the authors gained from many years of monitoring the Warsaw Metro [48]. Measurements of the Warsaw Metro were the basis for changes in the requirements concerning human vibrational comfort in buildings in the vicinity of the Metro [48]. Requirements included in the Japan standard [49,50] and described in [51] were also analysed before the proposal of HPVR values.
Twenty-four recorded signals were investigated and an evaluation of the human perception of vibrations was made using the RMS method. In all recorded dynamic events, the human perception threshold of vibrations is not currently exceeded in this building. There is a strong probability that after all three modernisation variants—gallery, conference centre and five-star hotel—vibrations from Nowotarska Street remain non-perceivable. However, internal excitation sources could be annoying for residents in the future. This is especially true for clients the five-star hotel and clients of the conference centre in the hotel part who may complain about human-induced floor vibrations. One of the considered solutions could be a floating floor.

3.6. Criterion F3/P4-Comfort of Using the Rooms; Acoustic Comfort

3.6.1. Methodology

The measurement process consisted of obtaining the sound level in room. A procedure based on [52,53,54,55,56,57,58], [59] is also acceptable for a requirement check in accordance with European standards [29] and Polish standards [32]. There were three positions of sound levels located at least 1 m from the internal walls and 1.5 m from external partitions with a window. The height of microphone placement was 1.2 ± 0.1 m. The noise level measurement for each position was 4 min long; thus, the total measurement time for each room was 12 min. In addition to the noise level in the room, the traffic noise level was obtained during measurements.

3.6.2. Requirements for the Internal Noise Level

The requirements presented in Table 9 taken from standards [29] and [32] are given for the building equipment. For the purposes of this article and the evaluation of acoustical comfort in the building, it was assumed that these requirements also concern traffic noise. Requirements for the sound level may vary depending on the standard used. Requirements for sound levels in the designed rooms for different variants of the building are given in Table 9. The main difference between these two requirements is the parameter for evaluation. If room is furnished, quantities are equal to each other without any corrections. In the opposite case quantities should be calculated accordingly to Equation (3) taken from [32]:
LAeq,nT = LAeq − 10log10T/T0
where:
  • T—reverberation time in unfurnished room (s); and
  • T0—reference value of reverberation time (s).

3.6.3. Results of Measurement

In the measurement process, 28 rooms were tested for equivalent sound levels in the rooms. Tests were performed, in general, for three zones. The first zone is located in the old part of the building and is affected by traffic noise from the nearby street due to the rooms having an external wall. The second zone has no contact with the external partition. The third zone is in a newer part of the building and not directly affected by traffic as its located is in back of the building. All rooms were furnished, so there was no need to measure reverberation time. Inside the building there were no other noise sources, such as mechanical ventilation, air conditioning, pumps and pipes. Measurements were conducted at 12:00 and 18:30.
The positioning of the control point is presented in Figure 16. Table 10 presents the result of the performed measurement.
To summariseTable 10, according to [29], 21 rooms met the sound requirements and seven rooms did not; it states that 67% of rooms tested met the requirements. With regard to [32], 14 rooms met the sound requirements and 14 did not; thus, 50% of the rooms fulfilled the given conditions. Lack of requirements means fulfilling requirements by definition. The main observation is that, without any internal noise sources, the only noise relates to external sources infiltrating through external partitions and windows. The main problem of windows installed in the room was the technical condition of the window frames. The degree of tightness of the window frames varied from room to room.
In order to evaluate the given criteria in the context of the percentage of people annoyed in some level by the noise, proper limit levels have to be given. Based on literature concerning low-frequency structural noise [60] and noise exposure at night [61], limits for noise levels can be given. Describing the situation in the more demanding Polish standard [32], around 20% people were dissatisfied by traffic noise [61] in bedrooms. This situation will be used as the reference variant for setting values for 10% and 30% of dissatisfaction. Furthermore, it was assumed that 20% of people would find conference room and exhibition hall noise levels unacceptable when they are at the maximum permitted with the standard requirements [32]. The results are presented in Table 11.
Based on results obtained from measurements, the following conclusion can be made:
-
The main problem of this hotel building is the tightness of windows resulting in low airborne sound insulation.
In order to provide sufficient acoustic parameters for rooms which do not meet requirements, the following actions can be performed:
-
Installation of proper windows with a sufficiently high parameter of airborne sound insulation;
-
The possibility to increase the percentage of rooms meeting the requirements if proper seals in existing windows are provided; and
-
modernisation of the building to take into account the acoustic climate in the building and solve the problem especially relating to noise traffic in bedrooms.

3.7. Criterion F4/P1-Impact on the Environment; Coefficient EP (kWh/(m2y))

3.7.1. Methods

The energy performance of a building can be expressed by an EP index specifying the amount of annual primary energy demand necessary to meet the needs connected with the use of a building, a dwelling or a part of a building being an independent technical and utilitarian whole, expressed in (kWh/(m2year)) and related to 1 m2 of rooms with adjustable temperature. The quantitative assessment of energy consumption suggests that the lower the EP value, the higher the efficiency of energy use that protects the resources of raw materials and the natural environment. Energy consumption could refer to more than one parameter here so it is, therefore, a determinant of the environmental impact of buildings. The qualitative assessment of energy consumption leads to a comparison of the EP indicator value for the building being assessed with the calculated EP reference value for new or rebuilt buildings determined according to the requirements of the applicable technical and construction regulations (Table 12). The methodology for calculating energy performance for buildings, dwellings, or parts of buildings constituting an independent technical and utilitarian whole not equipped with a cooling system is specified in the Ordinance of the Minister of Infrastructure and Development of 27 February 2015. This document refers to the methodology for the determination the energy performance of a building or part of a building and energy performance certificate. The EP calculations for the ‘Stara Polana’ building were made in accordance with [23].

3.7.2. Results

It is indicated that the annual primary energy demand for the ‘Stara Polana’ building necessary to satisfy the needs connected with using a building amounts to 86.24 (kWh/(m2year)).
The ‘Stara Polana’ building with 604.59 m2 of the total heated building area requires 86.24, kWh/(m2year), of the annual primary energy demand. Improving the energy efficiency of buildings by reducing the EP indicator is mainly related to the change of non-renewable sources for renewable energy sources. In the case of the analysed ‘Stara Polana’ building, the energy supply for heating comes entirely from RES. The main problem of the exceeded limit value stated in [7] (Table 13) is due to the consumption of electricity supplied to the lighting system. To improve the EP index, this article recommends replacing lighting in the ‘Stara Polana’ building with LED lighting.
Variant 1 has been assigned to class ‘A’; variants 2 and 3, to class ‘C’.

3.8. Financial Criterion F5P1

The financial criterion determines the cost-effectiveness of adapting the object to a given utility function from the investor’s point of view. The evaluation of this criterion consists of examining whether the project is financially effective and therefore whether the financial benefits for the investor in the specified operation time of the adapted facility will be greater than the expenditures incurred by it.

3.8.1. Assessment Method

The PI method (profitability index) was proposed for the financial assessment, which in practice is used to select the most effective of several investment projects [62]. This ratio is expressed by dividing the sum of discounted positive cash flows to the sum of discounted negative cash flows:
P I = i = 0 n P i ( 1 + d ) i i = 0 n N i ( 1 + d ) i
If the value of utility function is greater than 1 (PI > 1) the adaptation of the object is profitable for the considered variant. The higher the value of the indicator, the more profitable the new variant option is.

3.8.2. Results

As a result of the analysis, the value of the profitability ratio for the assumed investment lifetime of n = 15 years and an interest rate of d = 4% for the considered variants of the utility functions is presented in Table 14.
Only two variants of utility functions are profitable, of which the most profitable usable function is the five-star passive hotel function. The other two options in terms of the financial criterion are not viable.

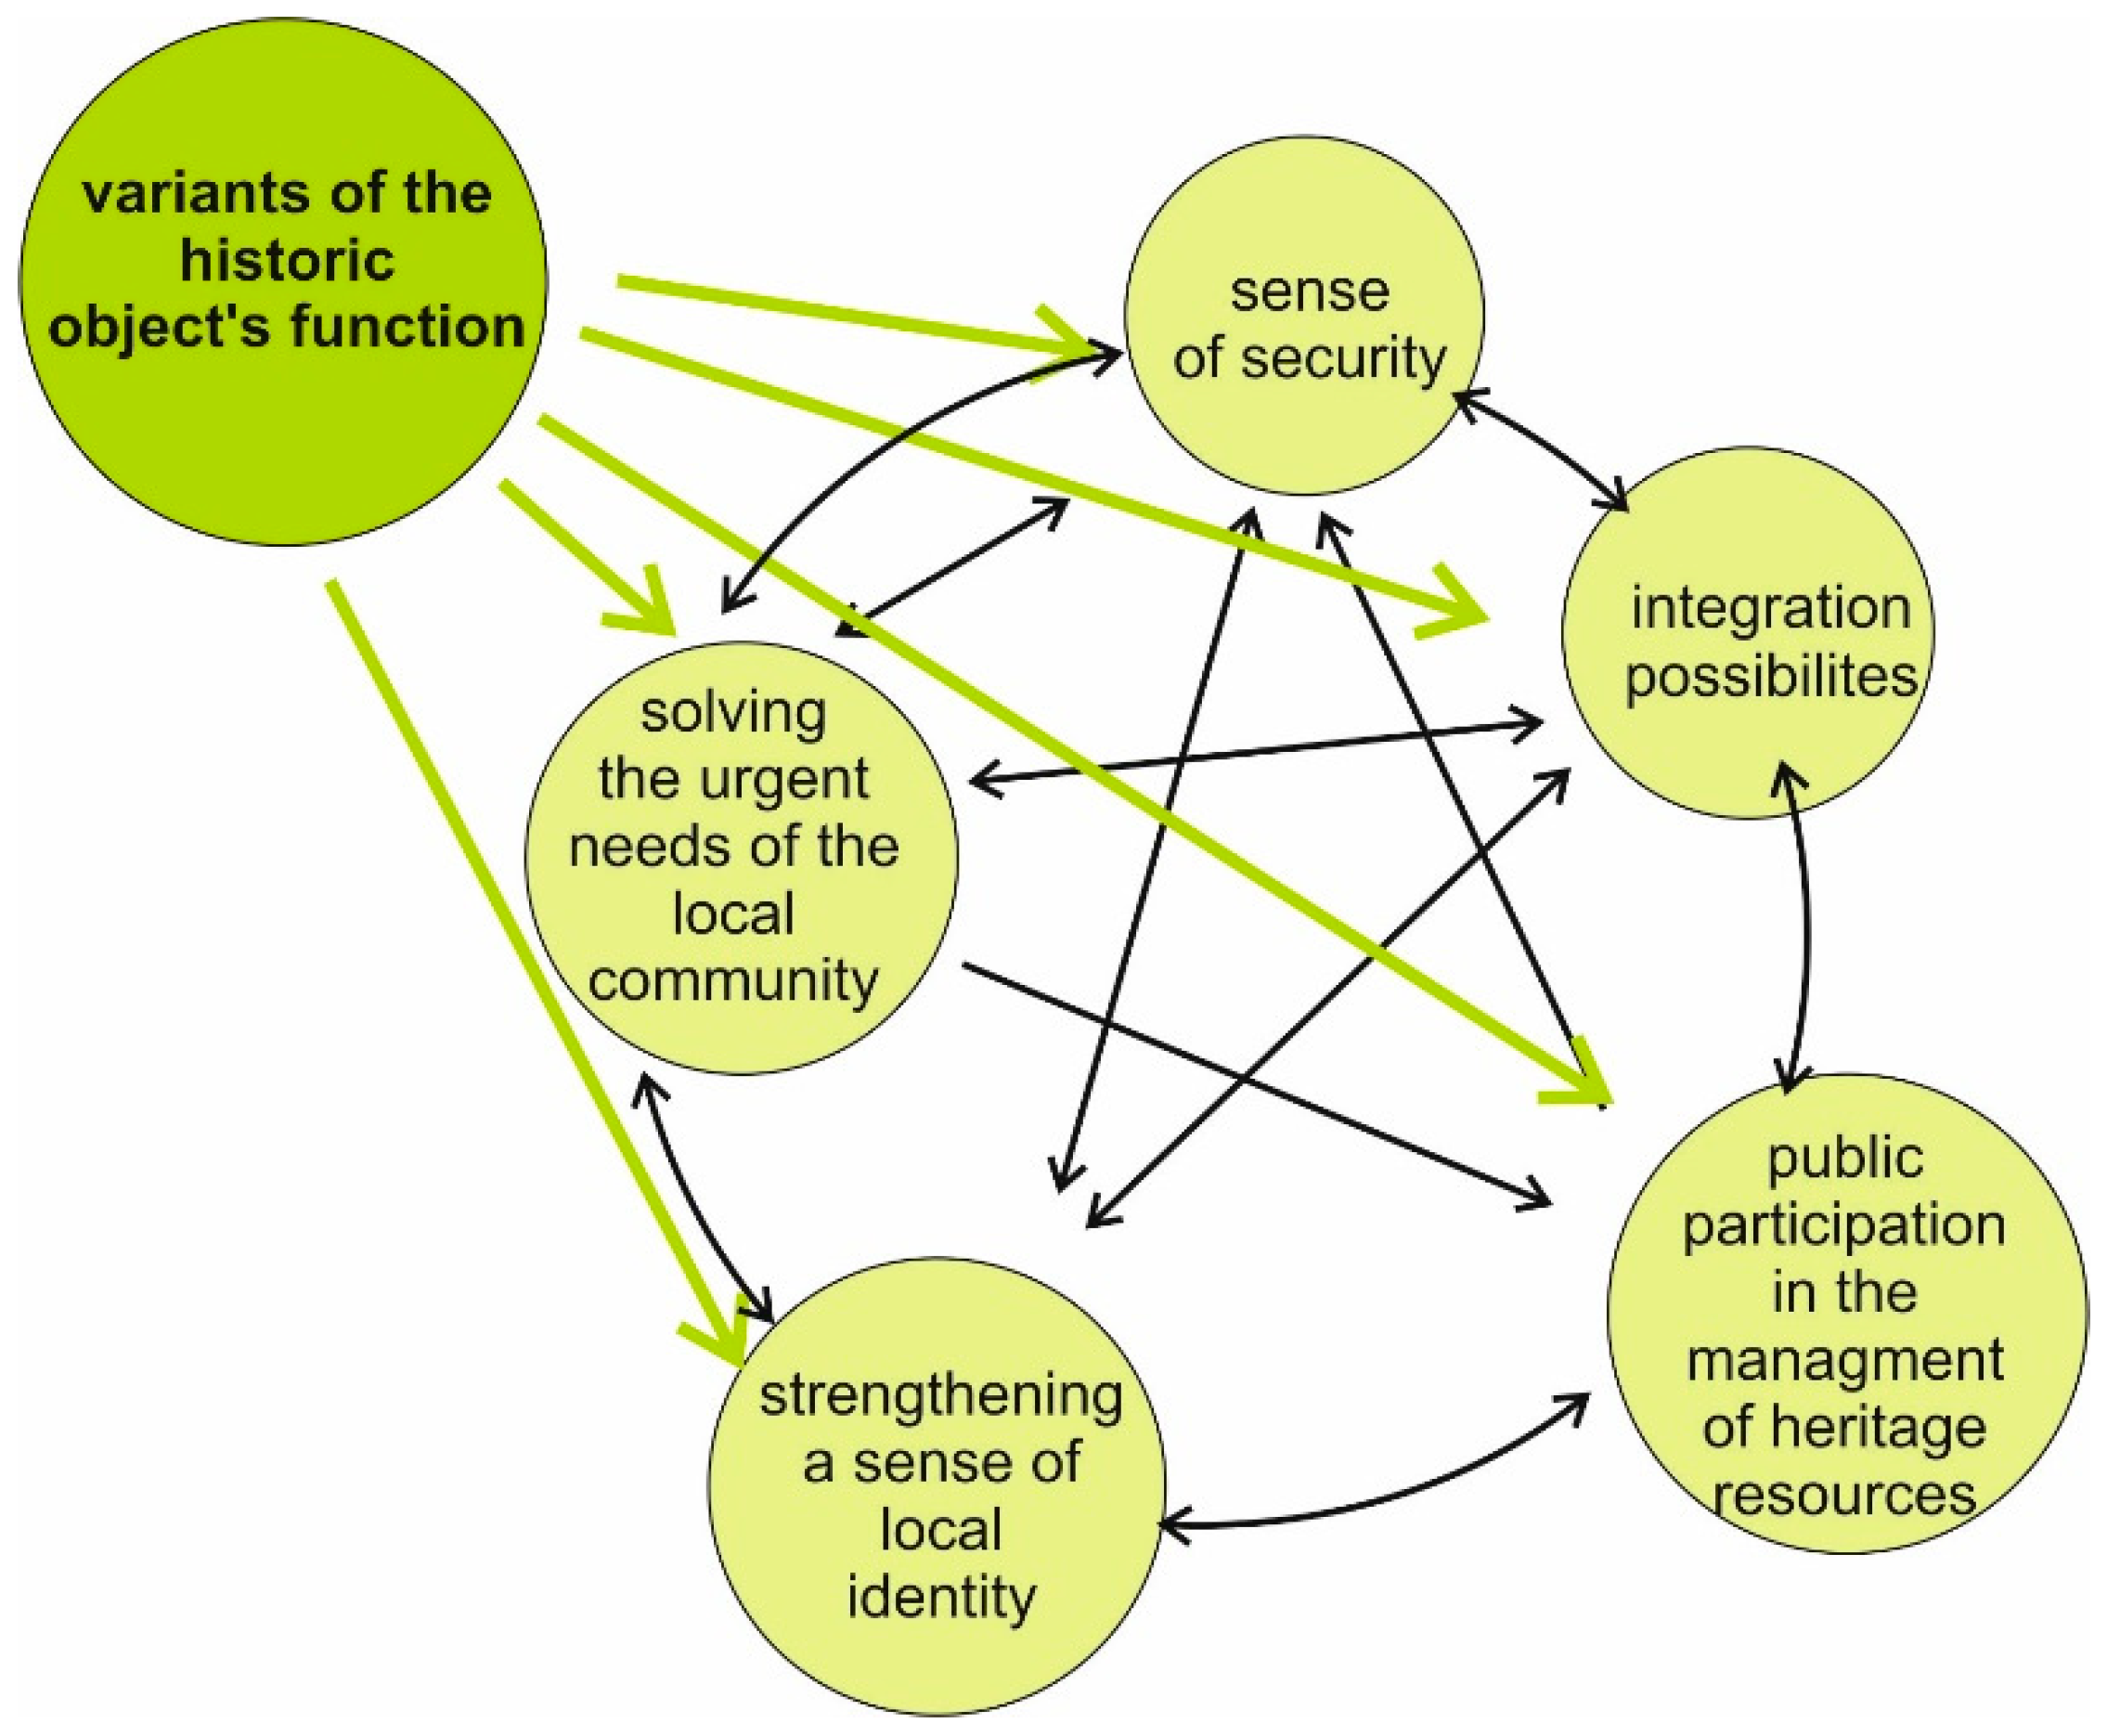
3.9. Criteria F6-Social Benefits and F7 Benefits from Preserving Cultural Heritage

Social benefits are achieved as a result of strengthening the sense of identity and national integration (emotional ties of the society with the historic object as a testimony of a bygone epoch). Designating buildings for useful social purposes ensures a sense of security (Table 15) [63,64].
Benefits from the protection of cultural heritage preserving and restoring the historic cultural features of the historic object and its popularisation. Additional beneficial factors for cultural heritage are the cognitive values accompanying the process of revalorising historic buildings, which translates into gaining a broader knowledge of the object and increasing the experience of the conservation environment (Table 16) [63,64].

3.9.1. Assessment Method

When analysing the definitions of the above criteria, it can be easily seen that there is some degree of overlap which, in the course of the analysis, justifies the need to take interdependencies into account, including the so-called feedback between these factors, leading to the adoption of a network rather than the standard hierarchical nature of links between them. The adopted network structure of interdependent links between the factors is supplemented with variants of the historic building adaptation that influence the mentioned factors. The impact of decision-making variants on the factors of a given criterion is a measure of the degree of fulfilling these goals. A schematic diagram of the proposed network structure of connections between the factors of a given criterion and variants of new utility functions for an adapted historic building are shown in Figure 17 and Figure 18. In Figure 17 and Figure 18, network nodes symbolize a given factor and the potential dependencies between the factors and a set of variants of new utility functions of a historic object are determined by arrows (arcs of the network). The size (diameter) of nodes symbolizes the significance (weight) of a given factor in the system and the thickness of the arrows determines the intensity of the influence of factors on each other and the impact of variants on these factors.
The assessment of each variant of the historic building’s adaptation was determined separately for each criterion of benefits. The assessment of the significance of the factors of a given criterion requires gathering the opinions of a small group of specialists in the specific field of the given criterion. The evaluation of experts provided a group assessment which allowed taking into account differences in the preferences of these opinions. A weighted average was used to aggregate expert opinions. In order to synthetically describe and analyse the above decision problem, it is necessary to choose the proper tool that will enable correct modelling and analysis of the considered relationships between the factors of a given criterion and decision options. At the basis of many methods of analysis lies the concept of the system as an object composed of various elements between which there are some relationships (dependencies). One of the effective strategies for mapping such a system is structural modelling and, thus, a set of various techniques enabling understanding of the properties of complex systems and decision problems [65]. In the literature on the subject, many methods of modelling and the structural analysis of a number of decision problems can be found, the most well-known and effective methods being ANP (fuzzy analytic network process) [66], DEMATEL (decision making trial and evaluation laboratory) [67] and a method recently developed by the WINGS (weighted influence non-linear gauge system) [68].
In these methods, the tool for modelling dependencies between system elements is a directed graph, the vertices of which symbolise system elements and arcs determine the relationships (interactions) between one element and another. The procedure of modelling the structure of the system and its analysis in all the aforementioned methods is based on similar algebraic mechanisms. The input values of ratings are introduced into the matrix, the sum of all powers in the limit sense returns the output values in the analysed model.

3.9.2. Results

Structural analysis results performed using the WINGS [68] determined the ranking of the proposed utility functions based on a normalised percentage of the impact on the given criterion objective fulfilment.
For the criterion of social benefits, the ranking of functional feature variants is as follows:
Variant 3—Zakopane Art Gallery (percentage indicator of the impact on meeting the criterion objective is: 0.42)
Variant 4—Conference and training centre (0.28)
Variant 2—Five-star hotel (0.18)
Variant 1—Reference variant–hostel (existing state) (0.13)
For the criterion of benefits from the cultural heritage protection, the ranking of functional feature variants is as follows:
Variant 3—Zakopane Art Gallery (percentage indicator of the impact on the fulfillment of the objective set by the criterion is: 0.38)
Variant 4—Conference and training centre (0.23)
Variant 2—Five-star hotel (0.22)
Variant 1—Reference variant–hostel (existing state) (0.16)

4. Conclusions and Discussion

In this article, the authors proposed methods to evaluate the criteria proposed in [20] and presented them from the example of the historic ‘Stara Polana’ building located in Zakopane. The starting point for the analysis was to examine the present condition of the ‘Stara Polana’ building, now used as a hostel. A series of interdisciplinary studies has determined the potential of the new utility functions considered for the object, defining the evaluation values of the proposed criteria. Table 17 presents a summary of developed criteria and subcriteria for each variant.
The evaluations of individual criteria developed in this article will be the basis for the multi-criteria analysis performed in the future and are based on the hybrid model of the utility function proposed in [20] on the adaptation of the building in question.
The process of adapting the historic building to new functions is more complicated than in the case of other existing buildings. As part of planning such a process, there is a need to thoroughly recognise the material features of the historic building. This is achieved through performing a series of diagnostic tests on the condition of the building with regard to architectural, construction, building physics and conservation aspects. An additional aspect is the recognition of intangible features of the building, such as the history of the building, its significance, symbolism and the utility functions that it used to have. An important element is the analysis of the value of such a building with regard to parameters such as: the value of authenticity, integrity, uniqueness, artistic value, historical value and social identity [63]. It is not insignificant to determine the socio-economic potential of the building in terms of the benefits of its future adaptation, i.e., prospective values. The effect of all these tests is to determine the possibilities and limitations of the building with regard to its adaptation to new utility functions.
Objects of regional architecture in Poland are erected using traditional masonry and wooden technology. They constitute a specific type of historic buildings whose potential to adapt to new functional functions is difficult due to the problem of providing the expected requirements (e.g., energy efficiency, comfort of use) for contemporary functions. Due to the multidimensional character of the adaptation problem, it is necessary to develop a multi-criteria approach to selecting the best variant of the considered options for the new function for the building in the context of the adopted selection criteria. At the initial stage of the multi-criteria analysis, after defining a set of variants and decision criteria, it is necessary to develop an appropriate approach to the assessment of individual criteria (measurable and difficult to quantify) in relation to the considered variants of the utility functions.

Author Contributions

Conceptualization: M.F.-C., A.K.-K., and T.T.; methodology: M.F.-C., A.K.-K., K.N., F.P., E.R.-Z., G.Ś., and T.T.; software: M.F.-C., A.K.-K., K.N., F.P., and G.Ś.; validation: M.F.-C., A.K.-K., F.P., and G.Ś.; formal analysis: M.F.-C., A.K.-K., F.P., and G.Ś.; investigation: M.F.-C., A.K.-K., K.N., F.P., G.Ś.; resources: M.F.-C., A.K.-K., K.N., F.P., and G.Ś.; data curation: M.F.-C., A.K.-K., K.N., B.Z., F.P., and G.Ś.; writing—original draft preparation: M.F.-C., A.K.-K., F.P., and G.Ś.; writing—review and editing: M.F.-C., A.K.-K., F.P., K.N., G.Ś., and T.T.; visualization: M.F.-C., A.K.-K., F.P., and G.Ś.; supervision: M.F.-C., A.K.-K., F.P., and G.Ś.; project administration: M.F.-C., A.K.-K., F.P., and G.Ś.

Funding

This research received no external funding.

Conflicts of Interest

The authors declare no conflicts of interest.

Nomenclature

U(W/(m2K))—Heat transfer coefficient
EK(kWh/(m2year))—The final energy value
n50Number of air changes per hour, as a result of the leak test of the building envelope
cloClothing unit, 1 clo = 0.155 (m2·K/W)
Icl Clothing insulation (m2 K/W)
METMetabolic rate (W/m2), 1 unit = 1 met = 58.2 W/m
PMVPredicted mean vote—Thermal Sensation Index (ISO 7730)
PPDPercentage of persons dissatisfied (percentage dissatisfied)
RHRelative humidity (%)
TaMeasured air temperature (°C)
TMRMean radiant temperature (°C)

References

  1. Terlikowski, W. The role of rehabilitation, modernization and adaptation of historic buildings in the revitalization process. J. Civ. Eng. Environ. Arch. 2015, 62, 519–832. [Google Scholar]
  2. Nowogońska, B. The Life Cycle of a Building as a Technical Object. Periodica Polytech. Civ. Eng. 2016, 60, 331–335. [Google Scholar] [CrossRef]
  3. Nowogońska, B. Proposal for determining the scale of renovation needs of residential buildings. Civ. Environ. Eng. Rep. 2016, 22, 137–144. [Google Scholar] [CrossRef]
  4. Collective Work, Antique Wooden Construction in Poland; Szczecin University of Technology: Szczecin, Poland, 2008; Volume 5.1, ISBN 978-83-7457-052-7.
  5. Dz, U. 1994 Nr 89 poz. 414 The Act of 7 July 1994 Construction Law. Available online: http://prawo.sejm.gov.pl/isap.nsf/DocDetails.xsp?id=wdu19940890414 (accessed on 6 February 2019).
  6. Dz, U. 2003 nr 162 poz. 1568 The Act of 23 July 2003 on the Protection of Monuments. Available online: http://prawo.sejm.gov.pl/isap.nsf/DocDetails.xsp?id=WDU20031621568 (accessed on 6 February 2019).
  7. Regulation of the Minister of Infrastructure on the Technical Conditions to Be Met by Buildings and Their Location (Journal of Laws No. 75, Item 690), Including Changes Introduced. Available online: http://prawo.sejm.gov.pl/isap.nsf/download.xsp/WDU20150001422/O/D20151422.pdf (accessed on 6 February 2019).
  8. Radziszewska-Zielina, E.; Śladowski, G. Fuzzy inference system assisting the choice of a variant of adaptation of a historical building. Inter. J. Contemp. Manag. 2015, 14, 131–148. [Google Scholar]
  9. Radziszewska-Zielina, E.; Śladowski, G.; Sibielak, M. Planning the reconstruction of a historic building by using a fuzzy stochastic network. Autom. Constr. 2017, 84, 242–257. [Google Scholar] [CrossRef]
  10. Radziszewska-Zielina, E.; Śladowski, G. Proposal of the Use of a Fuzzy Stochastic Network for the Preliminary Evaluation of the Feasibility of the Process of the Adaptation of a Historical Building to a Particular Form of Use OP Conference Series. Mater. Sci. Eng. 2017, 245, 072029. [Google Scholar] [CrossRef]
  11. Ustinovicius, L.; Jakucionis, S. Application of multicriteria decision methods in restoration of buildings in the old Town. J. Civ. Eng. Manag. 2000, 6, 227–236. [Google Scholar] [CrossRef]
  12. Zavadskas, E.; Anucheviciene, J. Development of an Indicator Model and Ranking of Sustainable Revitalization Alternatives of Derelict Property: A Lithuanian Case Study. Sustain. Dev. 2006, 14, 287–299. [Google Scholar] [CrossRef]
  13. Zavadskas, E.; Anucheviciene, J. Multiple criteria evaluation of rural building’s regeneration alternatives. Build. Environ. 2007, 42, 436–451. [Google Scholar] [CrossRef]
  14. Fuentes, J.M. Methodological bases for documenting and reusing vernacularfarm architecture. J. Cult. Herit. 2010, 11, 119–129. [Google Scholar] [CrossRef]
  15. Wang, H.; Zeng, Z. A Multi-objective decision-making process for reuse selection of historic buildings. Exp. Syst. Appl. 2010, 37, 1241–1249. [Google Scholar] [CrossRef]
  16. Breil, M.; Giove, S.; Rosato, P. A Multicriteria Approach for the Evaluation of the Sustainability of Re-Use of Historic Buildings in Venice; SSRN: Milan, Italy, 2008. [Google Scholar]
  17. Giove, S.; Rosato, P.; Breil, M. An application of multicriteria decision making to built heritage. The redevelopment of Venice Arsenale. J. Multi Criteria Dec. Anal. 2010, 17, 85–99. [Google Scholar] [CrossRef] [Green Version]
  18. Ferretti, V.; Bottero, M.; Mondini, G. Decision making and cultural heritage: An application of the Multi-Attribute Value Theory for the reuse of historical buildings. J. Cult. Herit. 2014, 15, 644–655. [Google Scholar] [CrossRef]
  19. Radziszewska-Zielina, E.; Śladowski, G. Supporting the selection of a variant of the adaptation of a historical building with the use of fuzzy modelling and structural analysis. J. Cult. Herit. 2017, 26, 53–63. [Google Scholar] [CrossRef]
  20. Fedorczak-Cisak, M.; Kowalska, A.; Radziszewska-Zielina, E.; Śladowski, G.; Pachla, F.; Tatara, T. A multicriteria approach for selecting the utility function of the historical building “Stara Polana” located in Zakopane. MATEC Web Conf. 2019, 262, 07002. [Google Scholar] [CrossRef]
  21. PN-EN ISO 6946: 2017-10. Building Components and Building Elements—Thermal Resistance and Heat Transfer Coefficient—Calculation Method; Polish Standardization Committee: Warsaw, Poland, 2017.
  22. PN-EN ISO 13370: 2017-09. Thermal Performance of Buildings—Heat Transfer via the Ground—Calculation Methods; Polish Standardization Committee: Warsaw, Poland, 2017.
  23. Regulation of the Minister of Infrastructure and Development of 27 February 2015 on the Methodology of Determining the Energy Performance of a Building or Part of a Building and Energy Performance Certificates. Available online: http://prawo.sejm.gov.pl/isap.nsf/DocDetails.xsp?id=WDU20150000376 (accessed on 6 February 2019).
  24. PN-EN ISO 9972: 2015-10. Thermal Properties of Buildings—Determination of Air Permeability Of Buildings—Pressure Measurement Method with the Use of a Fan; Polish Standardization Committee: Warsaw, Poland, 2015.
  25. PN-EN 13187: 2001. Thermal Properties of Buildings—Qualitative Detection of Thermal Defects in the Building Envelope—Infrared Method; Polish Standardization Committee: Warsaw, Poland, 2001.
  26. Fanger, P.O. Assessment of man’s thermal comfort in practice. Occup. Environ. Med. 1973, 30, 313–324. [Google Scholar] [CrossRef]
  27. PN-EN ISO 7730: 2006. Ergonomics of The thermal Environment—Analytical Determination and Interpretation of Thermal Comfort Using the Calculation of PMV and PPD Indicators and Criteria of Local Thermal Comfort; Polish Standardization Committee: Warsaw, Poland, 2006.
  28. Draft EN 16798-1. Energy Performance of Buildings—Ventilation of Buildings—Part 1: Indoor Environmental Input Parameters for Design and Assessment of Energy Performance of Buildings Addressing Indoor Air Quality, Thermal Environment, Lighting and Acoustics (Module M1–6. 2018); European Committee for Standardization: Brussels, Belgium, 2018. [Google Scholar]
  29. EN 15251: 2007. Indoor Environmental Input Parameters for Design and Assessment of Energy Performance of Buildings Addressing Indoor Air Quality, Thermal Environment, Lighting and Acoustics; European Committee for Standardization: Brussels, Belgium, 2017. [Google Scholar]
  30. PN ISO 7726: 2001. Ergonomics of the Thermal Environment. Instruments for Measuring Physical Quantities; Polish Standardization Committee: Warsaw, Poland, 2001.
  31. PN-B-02171: 2017-06. Evaluation of Human Exposure to Vibration in Buildings; Polish Standardization Committee: Warsaw, Poland, 2017.
  32. PN-B-02151-2: 2018-01. Building Acoustics—Noise Protection in Buildings—Part 2: Requirements for Acceptable Sound Level in Rooms; Polish Standardization Committee: Warsaw, Poland, 2018.
  33. Dudzik, M.; Trębacz, P.; Hudym, V. Modeling of contact wire’s de-iceing phenomena using artificial neural networks. Tech. Trans. 2018, 115, 111118. [Google Scholar] [CrossRef]
  34. Dudzik, M. Współczesne Metody Projektowania, Weryfikacji Poprawności i Modelowania Zjawisk Trakcji Elektrycznej; Monografie Politechniki Krakowskiej. Inżynieria Elektryczna i Komputerowa; Monografia, Politechnika Krakowska im. Tadeusza Kościuszki: Kraków, Poland, 2018; p. 187s. ISBN 978-83-65991-28-7. [Google Scholar]
  35. Energieeinsparverordnung—EnEV (Verordnung Über Energiesparenden Wärmeschutz und Energiesparende Anlagentechnik bei Gebäuden). Available online: www.enev-online.com (accessed on 6 February 2019).
  36. NEEAP. Erster Nationaler Energieeffizienzaktionsplan der Republik Österreich 2014 Gemäß Energieeffizienzrichtlinie 2012/27/EU; Bundesministerium für Bildung: Wissenschaft und Forschung Vienna, Austria, 2014.
  37. Kisilewicz, T. The influence of thermal insulation of walls on the microclimate in buildings in the summer. Build. Mater. 2015, 5. [Google Scholar] [CrossRef]
  38. Firląg, S.; Piasecki, M. NZEB Renovation Definition in a Heating Dominated Climate. Case Study of Poland. Appl. Sci. Basel 2018, 8, 1605. [Google Scholar] [CrossRef]
  39. Piasecki, M.; Kostyrko, K.; Pykacz, S. Indoor environmental quality assessment: Part 1: Choice of the indoor environmental quality sub-component models. J. Build. Phys. 2017, 41, 264–289. [Google Scholar] [CrossRef]
  40. PN-EN ISO 9920:2009. Ergonomics of the Thermal Environment—Estimation of Thermal Insulation and Water Vapor Resistance of Clothing Sets; Polish Standardization Committee: Warsaw, Poland, 2009.
  41. Sun, K.; Zhang, W. Combined Annoyance Assessment of Subway Train-Induced Structural Vibration and Ambient Noise. Shock Vib. 2016, 2016, 3028037. [Google Scholar] [CrossRef]
  42. Ögren, M.; Gidlöf-Gunnarsson, A.; Smith, M.; Gustavsson, S.; Persson Waye, K. Comparison of Annoyance from Railway Noise and Railway Vibration. Int. J. Environ. Res. Public Health 2017, 14, 805. [Google Scholar] [CrossRef] [PubMed]
  43. Gierke, M.E.; Coerman, R.R. The biodynamics of human response to vibration and impact. Ind. Med. Surg. 1963, 32, 30–32. [Google Scholar]
  44. Dudzik, M.; Tomczyk, K.; Sieja, M. Optimal dynamic error formula for charge output accelerometer obtained by the neural network. In Proceedings of the 2018 International Symposium on Electrical Machines (SME): SME 2018, Andrychów, Poland, 10–13 June 2018; ISBN 978-153865210-7. [Google Scholar] [CrossRef]
  45. Dudzik, M.; Tomczyk, K.; Jagiełło, A.S. Analysis of the error generated by the voltage output accelerometer using the optimal structure of an artificial neural network. In Proceedings of the 2018 19th International Conference on Research and Education in Mechatronics (REM 2018), Delft, The Netherlands, 7–8 June 2018; pp. 7–11, ISBN 978-1-5386-5413-2. [Google Scholar] [CrossRef]
  46. Marioka, M.; Griffin, M.J. Difference thresholds for intensity perception of whole-body vertical vibration: Effect of frequency and magnitude. J. Acoust. Soc. Am. 2000, 107, 620–624. [Google Scholar] [CrossRef] [Green Version]
  47. ISO 2631-2: 2003. Guide to the Evaluation of Human Exposure to Whole Body Vibration. Part 2—Vibration in Buildings; International Organization for Standardization: Geneva, Switzerland, 2003. [Google Scholar]
  48. Kowalska-Koczwara, A.; Pachla, F.; Stecz, P.; Stypuła, K.; Tatara, T.; Lejk, J.; Sokołowski, M. Vibration-based damage identification and condition monitoring of metro trains: Warsaw Metro case study. Shock Vib. 2018, 2018, 8475684. [Google Scholar] [CrossRef]
  49. Tamura, Y.; Kawana, S.; Nakamura, O.; Kanda, J.; Nakatà, S. Evaluation perception of wind-induced vibration in buildings. Struct. Build. 2006, 159, 283–293. [Google Scholar] [CrossRef]
  50. Kwok, K.C.S.; Hitchcock, P.A.; Burton, M.D. Perception of vibration and occupant comfort in wind-excited tall buildings. J. Wind Eng. Ind. Aerodyn. 2009, 97, 368–380. [Google Scholar] [CrossRef]
  51. Waddington, D.C.; Woodcock, J.; Peris, E.; Condie, J.; Sica, G.; Moorhouse, A.T.; Steele, A. Human response to vibration in residential environments. J. Acoust. Soc. Am. 2014, 135, 182–193. [Google Scholar] [CrossRef] [PubMed]
  52. Okokon, E.O.; Yli-Tuom, T.; Tiittanen, A.W.; Tiittanen, P.; Juutilainen, J.; Lanki, T. Traffic noise, noise annoyance and psychotropic medication use. Environ. Int. 2018, 119, 287–294. [Google Scholar] [CrossRef]
  53. Beranek, L.L. Acoustic Measurements; American Institute of Physics: New York, NY, USA, 1949; ISBN 088-318590-3. [Google Scholar]
  54. Bruel & Kjaer. Environmental Noise Measurement; Bruel & Kjaer: Nærum, Denmark, 2001. [Google Scholar]
  55. Makarewicz, R.; Gołębiewski, R. Estimation of the long term average sound level from hourly average. Appl. Acoust. 2016, 111, 116–120. [Google Scholar] [CrossRef]
  56. Malchaire, J. Sound Measuring Instruments; WHO: Brussels, Belgium, 1994. [Google Scholar]
  57. Costa, J.J.L.; Nascimento, E.O.D.; Oliveira, L.N.D.; Caldas, L.V.E. Pressure sound level measurements at an educational environment in Goiânia, Goiás, Brazil. J. Phys. Conf. Ser. 2017, 975, 012055. [Google Scholar] [CrossRef]
  58. Park, T.; Kim, M.; Jang, C.; Choung, T.; Sim, K.-A.; Seo, D.; Chang, S.I. The Public Health Impact of Road-Traffic Noise in a Highly-Populated City, Republic of Korea: Annoyance and Sleep Disturbance. Sustainability 2018, 10, 2947. [Google Scholar] [CrossRef]
  59. Sirin, O. State-of-the-Art Review on Sustainable Design and Construction of Quieter Pavements—Part 2: Factors Affecting Tire-Pavement Noise and Prediction Models. Sustainability 2016, 8, 692. [Google Scholar] [CrossRef]
  60. Aasvang, G.M.; Engdahl, B.; Rothschild, K. Annoyance and self-reported sleep disturbances due to structurally radiated noise from railway tunnels. Appl. Acoust. 2007, 68, 970–981. [Google Scholar] [CrossRef]
  61. Frei, P.; Mohler, E.; Roosli, M. Effect of nocturnal road traffic noise exposure and annoyance on objective and subjective sleep quality. Int. J. Hyg. Environ. Health 2014, 217, 188–195. [Google Scholar] [CrossRef] [PubMed]
  62. Bogucki, D. Feasibility Study—Guide; PRESSCOM Sp. z o.o.: Wrocław, Poland, 2016. [Google Scholar]
  63. Affelt, W. Technical Heritage as a Part of Culture, Towards a Sustainable Heritage (Part 2), Protection of Monuments; National Heritage Board of Poland: Warsaw, Poland, 2009; pp. 53–82. [Google Scholar]
  64. Radziszewska-Zielina, E.; Śladowski, G. Evaluation of historic building conversion options in the context of sustainable development. Tech. Trans. 2014, 1B, 153–164. [Google Scholar] [CrossRef]
  65. Roberts, F.S. Applications of the theory of meaningfulness to psychology. J. Math. Psychol. 1985, 29, 311–332. [Google Scholar] [CrossRef]
  66. Saaty, T.L. Decision Making with Dependence and Feedback: The Analytic Network Process; University of Pittsburgh: Pittsburgh, PA, USA; RWS Publications: Pittsburgh, PA, USA, 1996; ISBN 0-9620317-9-8. [Google Scholar]
  67. Gabus, A.; Fontela, E. World Problems an Invitation to Further Thought within the Framework of DEMATEL; Battelle Geneva Research Centre: Geneva, Switzerland, 1972. [Google Scholar]
  68. Michnik, J. Weighted Influence Non-linear Gauge System (WINGS)—An analysis method for the systems of interrelated components. Eur. J. Oper. Res. 2013, 228, 536–544. [Google Scholar] [CrossRef]
Figure 1. (a) location of Podhale on the map of Poland; (b) example of regional architecture—constructed using brick and wood technology and functioning as a hostel.
Sustainability 11 01094 g001
Figure 2. (a) Horizontal cross section of the building; and (b) cross-section of the building.
Sustainability 11 01094 g002
Figure 3. (a) Interior made from wood, with a historic stove, and (b) the detail.
Sustainability 11 01094 g003
Figure 4. Proposed criteria and their mutual relationships for the purposes of choosing a new utility function for the ‘Stara Polana’ building; based on [20].
Sustainability 11 01094 g004
Figure 5. Evaluation of meeting the requirements that ensure air tightness for a group of 48 residential buildings with mechanical ventilation (authors’ own image).
Sustainability 11 01094 g005
Figure 6. Tightness test at the ‘Stara Polana’ hostel (authors’ own image).
Sustainability 11 01094 g006
Figure 7. Leak detection in the building envelope using a thermal imaging camera (authors’ own image).
Sustainability 11 01094 g007
Figure 8. An example of a solution of how to insulate a historic building from the inside (authors’ own calculations and image).
Sustainability 11 01094 g008
Figure 9. Test device for measuring thermal comfort.
Sustainability 11 01094 g009
Figure 10. Internal temperature TA (°C) recorded on the microclimate gauge.
Sustainability 11 01094 g010
Figure 11. Calculated comfort factor PMV (–) based on the conducted tests.
Sustainability 11 01094 g011
Figure 12. Dependence of the PMV (–) comfort indicator on temperature TA (°C).
Sustainability 11 01094 g012
Figure 13. Measurement discs located in (a) the hall, and (b) the guest room.
Sustainability 11 01094 g013
Figure 14. Vertical z component of acceleration vibrations recorded in the guest room.
Sustainability 11 01094 g014
Figure 15. RMS analysis of measurement no. 40: (a) in the hall, and (b) in the guest room.
Sustainability 11 01094 g015
Figure 16. Location of measurement point in front of the building (2 m from the façade and 4 m above the ground).
Sustainability 11 01094 g016
Figure 17. Schematic diagram of the proposed network structure of connections for the analysed problem for the assessment of the social benefit criterion.
Sustainability 11 01094 g017
Figure 18. Schematic diagram of the proposed network structure of connections for the analysed problem for the assessment of the criterion of benefits arising from cultural heritage protection.
Sustainability 11 01094 g018
Table 1. Heat transfer coefficient U (W/(m2·K)) [7].
Type of PartitionExisting StateCurrent Requirements in PolandRequirements for NZEB Buildings in Poland (from 2021)Requirements for Passive BuildingsThe Difference of the Existing State from the Current Requirements in Poland
External walls0.550.230.200.15239%
Roofs and floors0.560.180.150.15311%
Floor on the ground1.750.300.300.15583%
Windows1.601.100.900.80145%
Table 2. Classes adopted for sub-criterion F1/P1 heat-transfer coefficient U of external walls (W/(m2K)).
No.Designation of the BuildingCriterion F1
F1/P1 (Coefficient U (W/m2rok]))
1Reference variant—Hostel (existing state)0.55
2Variant 1—Five-star hotel0–0.15—class A
0.16–0.22—class B
U ≥ 0.23—class C
3Variant 2—Zakopane Art Gallery0–0.15—class A
0.16–0.22—class B
U ≥ 0.23—class C
4Variant 3—Conference and training centre0–0.15—class A
0.16–0.22—class B
U ≥ 0.23—class C
Table 3. Classes adopted for sub-criterion F1/P2 of final energy coefficient (kWh/(m2year)).
No.Designation of the BuildingCriterion F1
F1/P2 (EK, kWh/m2rok)
1Reference variant—Hostel (existing state)244.79
2Variant 1—Five-star hotelEK reduction:
>60%—class A
>50%—class B
>40%—class C
3Variant 2—Zakopane Art GalleryEK reduction:
>60%—class A
>50%—class B
>40%—class C
4Variant 3—Conference and training centreEK reduction:
>60%—class A
>50%—class B
>40%—class C
Table 4. Classes adopted for sub-criterion F2/P1 tightness of the building envelope n50 (1/h).
No.Designation of the BuildingCriterion F2
F2/P1 n50, 1/h
1Reference variant—Hostel (existing state)For negative pressure n50 = 10.09 For overpressure n50 = 8.83
2Variant 1—Five-star hotel0–0.6—class A
0.6–1.5—class B
n50 ≥ 1.5—class C
3Variant 2—Zakopane Art Gallery0–0.6—class A
0.6–1.5—class B
n50 ≥ 1.5—class C
4Variant 3—Conference and training centre0–0.6—class A
0.6–1.5—class B
n50 ≥ 1.5—class C
Table 5. Room categories depending on the PMV indicator.
Room CategoryCoefficients:
PMV (–)PPD (%)
A−0.2 < PMV < +0.2<6
B−0.5 < PMV < +0.5<10
C−0.7 < PMV < +0.7<15
Table 6. Sensor data.
Type of SensorMeasurement RangeScaleAccuracy
Temperature sensors−20 °C + 50 °C (wet thermometer 0 °C + 5 °C)0.01°C± 0.4 °C
Humidity sensors0–100%0.1 RH (relative humidity)± 2% RH (relative humidity)
Air velocity sensors0–5 m/s0.01 m/sfor 0–1 m/s:
± 0.05 + 0.05 × Va m/s
for 1–5 m/s:
± 5 %
Table 7. Classes adopted for sub-criterion F3/P1 thermal comfort PMV (–).
No.Designation of the BuildingCriterion F3
F3/P1(PMV (–))
1Reference variant—Hostel (existing state)−0.7—0.25
2Variant 1—Five-star hotel−0.2–0.2—class A
−0.5–0.5—class B
−0.5 > PMV > 0.5—class C
3Variant 2—Zakopane Art Gallery−0.2–0.2—class A
−0.5–0.5—class B
−0.5 > PMV > 0.5—class C
4Variant 3—Conference and training centre−0.2–0.2—class A
−0.5–0.5—class B
−0.5 > PMV > 0.5—class C
Table 8. Vibrational requirements for different types of room F3/P2.
No.Designation of the BuildingCriterion F3
F3/P2
1Reference variant—Hostel (existing state)
2Variant 1—Five-star hotel
Vibration not perceptible0–0.79—class A
Vibration perceptible but
not harmful
0.8–1.19—class B
Harmful vibration>1.2—class C
3Variant 2—Zakopane Art GalleryVibration not perceptible0–1.19—class A
Vibration perceptible but
not harmful
1.2–3.99—class B
Harmful vibration>4.0—class C
4Variant 3—Conference and training centre-conference roomsVibration not perceptible0–1.09—class A
Vibration perceptible but
not harmful
1.1–1.99—class B
Harmful vibration>2.0—class C
5Variant 3—Conference and training centre—hotel roomsVibration not perceptible0–0.89—class A
Vibration perceptible but
not harmful
0.9–1.29—class B
Harmful vibration>1.3—class C
Table 9. Requirements for sound levels for different room types for all variants of modernisation of the considered building.
Room TypeMaximal Value of Equivalent Sound Level [29]Maximal Value of Standardized Equivalent Sound Level [32]
LAeq, dBLAeq,nT, dB
Hotel room30 *25
Conference room3535
Restaurant kitchen55-
Restaurant/bar4545
Toilets4540
Reception4040
Office3535
Spa35-
Swimming pool4550
Cloakroom45-
Note: * value for daytime, for night time value decreases by 5 dB.
Table 10. Results of equivalent sound level in tested rooms in relation to requirements given in [29] and [32].
Room #ZoneRoom TypeMeasured Equivalent Sound Level LAeq, dBMeasured Equivalent Sound Level in Control Point during Room Measurement LAeq,ext, dBMaximum Permitted Sound Level (EU), dBMaximum Permitted Sound Level (PL), dBMaximum Noise Level with a Fast Time Constant LAFmax, dB
1.11Kitchen31.458.955 (met)- (met)40.6
1.21Dining room41.058.245 (met)45 (met)52.2
1.31Wardrobe34.258.3- (met)- (met)46.0
1.41Room30.758.130 (not met)25 (not met)40.5
1.51Room25.157.530 (met)25 (not met)33.3
2.31Room27.959.330 (met)25 (not met)37.2
2.41Room28.259.130 (met)25 (not met)39.2
2.61Room21.56030 (met)25 (met)30.8
2.71Room22.659.130 (met)25 (met)34.3
3.111Bathroom33.859.945 (met)40 (met)43.5
3.41Bathroom32.960.345 (met)40 (met)43.9
3.51Room32.461.130 (not met)25 (not met)43.7
3.61Room38.56230 (not met)25 (not met)46.6
3.71Room36.860.630 (not met)25 (not met)48.3
3.81Room40.560.330 (not met)25 (not met)50.3
3.91Room33.559.630 (not met)25 (not met)42.4
2.22Reception23.758.440 (met)40 (met)35.2
2.52Corridor22.459.5- (met)- (met)31.3
3.12Corridor23.261.5- (met)- (met)31.4
1.133Wardrobe22.356.7- (met)- (met)34.0
1.143Laundry24.657.8- (met)- (met)35.8
2.123Room21.059.230 (met)25 (met)31.4
2.173Room25.16030 (met)25 (not met)34.8
3.143Room26.460.530 (met)25 (not met)38.3
3.153Room24.160.630 (met)25 (met)32.3
3.173Room25.35930 (met)25 (not met)37.0
4.43Room26.959.430 (met)25 (not met)38.0
4.83Room30.659.630 (not met)25 (not met)38.8
Table 11. Acoustic requirements based on the percentage of dissatisfaction [60,61] and standards [29,32].
Building TypeLA,eq, dBLAFmax, dBPercentage of Dissatisfied PeopleClass
museum, exhibition hall303710%A
354220%B
404630%C
five-star hotel rooms202710%A
253220%B
303630%C
conference centreconference rooms303710%A
354220%B
404630%C
hotel rooms202710%A
253220%B
303630%C
Table 12. Minimum requirements in [7] for EPH + W in Poland.
No.Type of BuildingEP H+W Indicator for Heating, Ventilation and Domestic Hot Water [kWh/(m2rok)]
Current RequirementsFor NZEB Buildings in Poland
1Single-family building9570
2Multi-family building8565
3Healthcare building290190
4Public building6045
5Commercial building, warehouse9070
Table 13. Classes adopted for the sub-criterion F4 /P1 EPH + W index.
No.Designation of the BuildingCriterion F4
F4/P1 EPH+W, kWh/m2rok
1Reference variant—Hostel (existing state)86.24
2Variant 1—Five-star hotel
0–20—class A
21–59—class B
EP ≥ 60—class C
3varIant 2—Zakopane Art Gallery0–20—class A
21–59—class B
EP ≥ 60—class C
4Variant 3—Conference and training centre—hotel rooms0–20—class A
21–59—class B
EP ≥ 60—class C
Table 14. Value of the profitability index for the considered variants of the utility functions.
No.Designation of the BuildingCriterion F5
F5/P1 PI (Profitability Index)
1Reference variant—Hostel (existing state)1.03
2Variant 1—Five-star hotel1.06
3Variant 2—Zakopane Art Gallery0.05
4Variant 3—Conference and training centre—hotel rooms0.56
Table 15. Factors describing the criterion of social benefits.
The Criterion for Social Benefits
1Sense of security
2Integration opportunities
3Strengthening the sense of local identity
4Social participation in managing heritage resources
5Solving the pressing needs of the local community
Source: own study based on [63,64].
Table 16. Factors describing the criterion of benefits from cultural heritage protection.
The Criterion for Benefits from the Protection of Cultural Heritage
1Increase in heritage resources
2Promoting the value of heritage
3Use of heritage resources
4Popularisation of local heritage resources
5Benefits of a professional environment of conservators
Source: own study based on [63,64].
Table 17. Summary table.
Criteria/
Sub-criterion No
Variant No.
Reference Variant—Hostel (Existing State)Variant 1—
Five-star Hotel
Variant 2— Zakopane Art GalleryVariant 3— Conference and Training Centre
Criterion F1
F1/P1 (coefficient U (W/m2rok))
0.550–0.15—class A
0.16–0.22—class B
U ≥ 0.23—class C
0–0.15—class A
0.16–0.22—class B
U ≥ 0.23—class C
0–0.15—class A
0.16–0.22—class B
U ≥ 0.23—class C
Criterion F1
F1/P2 (EK, kWh/(m2rok))
244.79EK reduction:
>60%—class A
>50%—class B
>40%—class C
EK reduction:
>60%—class A
>50%—class B
>40%—class C
EK reduction:
>60%—class A
>50%—class B
>40%—class C
Criterion F2
F2/P1 n50, (1/h)
For negative pressure n50 = 10.09
For overpressure n50 = 8.83
0–0.6—class A
0.6–1.5—class B
n50 ≥ 1.5—class C
0–0.6—class A
0.6–1.5—class B
n50 ≥ 1.5—class C
0–0.6—class A
0.6–1.5—class B
n50 ≥ 1.5—class C
Criterion F3
F3/P1 (PMV (-))
−0.7/0.25−0.2–0.2—class A
−0.5–0.5—class B
−0.5>PMV> 0.5—class C
–0.2–0.2—class A
–0.5–0.5—class B
–0.5 > PMV > 0.5—class C
–0.2–0.2—class A
–0.5–0.5—class B
–0.5 > PMV > 0.5—class C
Criterion F3
F3/P2 (Frequency (Hz))
0–0.79—class A
0.8–1.19—class B
>1.2—class C
0–1.19—class A
1.2–3.99—class B
>4.0—class C
0–1.09—class A *
1.1–1.99—class B *
>2.0—class C *
Criterion F3
F3/P3 LA,eq/LAF,max (dB)
40.5/50.3≤20/27—class A
≤25/32—class B
≤30/36—class C
≤30/37—class A
≤35/42—class B
≤40/46—class C
≤20/27—class A *
≤25/32—class B *
≤30/36—class C *
Criterion F4
F4/P1
EPH+W (kWh/m2rok)
86.240–20—class A
21–59—class B
EP ≥ 60—class C
0–20—class A
21–59—class B
EP ≥ 60—class C
0–20—class A
21–59—class B
EP ≥ 60—class C
Criterion F5
F5/P1 PI (Profitability Index)
1.03
1.06
0.05
0.56
Criterion F6
F6/P1 (%)
0.130.180.420.28
Criterion F7
F7/P1 (%)
0.160.220.380.23
* Conference rooms.

