Identification of Distorted Official Hospitality Statistics’ and Their Impact on DMOs’ Funding’s Sustainability: Case Notes from Slovakia

Department of Geo and Mining Tourism, Faculty of Mining, Ecology, Process Control and Geotechnologies, Technical University of Košice, Letná 9, 042 00 Košice, Slovakia
*
Author to whom correspondence should be addressed.
Sustainability 2019, 11(4), 1084; https://doi.org/10.3390/su11041084
Submission received: 29 January 2019
/
Revised: 12 February 2019
/
Accepted: 13 February 2019
/
Published: 19 February 2019
(This article belongs to the Special Issue Tourism, Governance and Sustainable Development)
Abstract
:Analyzing the usability of open machine-readable registries in the context of minimizing gaps for local occupancy tax evasions in the example of Slovakia is the main purpose of this paper. The concept uses the Registry of Financial Statements’ and Registry of Legal Entities’ application programming interfaces (APIs) for extracting public data on companies’ and entrepreneurs’ business nature, in accordance with Eurostat’s Statistical classification of economic activities in the European Community (NACE) and United Nations’ International Standard Industrial Classification of All Economic Activities (ISIC) at the level of entities’ registered address. The resulted data sets are compared with open official data that is available at the municipality level (LAU2), as gathered by the Statistical Office of the Slovak Republic’s monthly surveys and municipalities’ annual accounts. The comparison’s outcomes indicate the deviations between the official and the possible numbers of entities with occupancy tax obligations, as well as tax revenues. The results conclude with how the incorporation of used open APIs in official processes may be beneficial for public and state institutions in the matter of potential local tax evasions, as well as for state regulated public-private partnership destination management organizations. The notes also discuss solutions for the minimization of data and the industry’s official impact distortion.
1. Introduction
The European Commission identifies occupancy tax, as one of the number of taxes that are primarily focused on the tourism sector, mostly charged on a per person, per night basis, or as a percentage of room rates, and apart from Malta, the tax itself is levied at the local government level [1].
The question of occupancy taxes necessity was raised already in the early 90s. Hiemstra and Ismail, via their statistical model, estimated the actual average United States (US) levied tax rates [2]. Lee and Ki, via spatial panel estimation of random effects, identified that accommodation service providers that are competing for similar demand without the obligation of occupancy tax are they likely to have an advantage over providers with occupancy tax obligation [3]. On the other side, Lee and Ki acknowledge that the effective use of occupancy tax for tourism promotion may outweigh the disadvantage that arises from higher customer prices [3]. Hamilton et al. analyze the impact of online travel companies’ (hereinafter OTCs) impact occupancy tax collection, in particular, whether OTCs are reliable on municipalities for tax collection [4]. Kljunickov et al. raise awareness regarding the misuse of AirBnB’s concept of shared economy by accommodation service providers from the perspective of tax evasions and negative impacts on price of local housing and local hospitality industry [5]. Various recent research studies analyze the sustainability of the hospitality industry; the impact of general and special Value Added Taxes’ on the industry at the national level and specific scenarios of tourist’s and service providers’ attitudes [6,7,8,9]. Surgiu and Surgiu list a number of pros (e.g., additional resources for financing local tourism development; local economic environments’ improvement, positive effects on equity) and cons (e.g., inflation costs; distorted economic effects; and, negative change of demand toward local services) of tourism taxation, but also acknowledge that impact analysis of tourism taxation is important in supporting responsible decision making [10]. Gago et al. identify taxation’s important role among public policies affecting tourism as a sector [11]. The necessity of reliable, precise governmental and public open data has been demonstrated for use in the spatial modelling of environmental risks, modelling of administrative procedures, but also in partial tourism industries [12].
From the perspective of Slovakia’s national system of regular funding of local and regional destination management principals’ sustainable development, occupancy tax plays a crucial determinant within the funding system’s concept that was regulated by Act no. 91/2010 Coll. on Support of Tourism [13]. In accordance with § 29 of the above-mentioned Act, local and regional organizations of tourism, which mainly arise and fulfill tasks as local and regional destination management organizations (hereinafter LDMO and RDMO) by the definition of UNWTO [14], may be granted by annual state funding [13]. Among other rules, LDMOs are eligible for maximum possible funding up to the amount of collected membership fees and limited to 90 % of the annually levied occupancy tax by member local municipalities. In the case of RDMOs, the rule is same, but the limit is up to 10 % of the annually levied occupancy tax within the region’s (NUTS3) municipalities.
In terms of Slovak law and regulations, accommodation service providers collect relevant data under multiple occasions [15,16,17,18]. As Sidor et al. claim, accommodation service providers report relevant data to occupancy tax multiple times on a monthly base [19]. Data collection and aggregation with decisive impact on the upper-mentioned Act’s criteria in regards to municipalities’ levied occupancy tax achievement is processed by the Slovak Republic’s Statistical Office’s (hereinafter SUSR) monthly survey [20]. An offline pdf formula with severe time requirement carries out the survey itself [20]. The outcomes of the survey in a structured or machine-readable fashion are available annually and partially quarterly at the district level (LAU1) [21]. The results at the municipality level (LAU2) are partially accessible for only nine cities [21]. Data of other municipalities’ may be received after an evaluated written request. For comparison in other countries of the Visegrad group, such as Czechia, Hungary, and Poland, these outcomes are available at LAU2, with respect to data confidentiality (Czech Statistical Office, 2018; Hungarian Central Statistical Office, 2018; Statistics Poland, 2018). Annual data on levied occupancy tax is partially accessible via Slovak municipalities’ annual final accounts [22,23,24].
Machine-readable data concerning Slovak legal entities’ main business’s nature in accordance with Eurostat’s Statistical classification of economic activities in the European Community may be accessed by the Registry of financial statements’ (hereinafter RUZ) application programming interfaces [25,26]. Additional data regarding the nature of Slovak legal entities’ all declared business activities in accordance with United Nations’ International Standard Industrial Classification of All Economic Activities (hereinafter ISIC) might also be retrieved from the Registry of legal entities (hereinafter RPO) [27,28]. The novelty of the approach is that, the precautionary machine based methodology for identifying all potential accommodation service providers with obligation towards local occupancy tax in Slovakia, without the necessity of web scrapping or the purchase of commercial third party data. The main aim of this paper is to open the discussion about supporting the sustainability of occupancy tax collection by municipalities and related funding based on the example of Slovak LDMOs by identifying the potential vulnerability and gaps in the current system.
Since relevant data at LAU2 are available only for nine cities, the second aim of the paper is to test conceptual approach within the pilot cities from the perspective of:
- comparison of SUSR’s data on annual number of accommodation service providers with the data retrieved from RUZ and RPO databases;
- comparison of SUSR’s data on annual number of overnight stays with municipalities’ data on annual levied occupancy tax; and,
- calculation of estimated occupancy tax evasions and proposal of supplementary solutions for SUSR’s system that could lower the resulted deviations between the tested datasets.
2. Input Data Extraction, Harmonization, and Aggregation
The main technological approach within the concept was to aggregate all the obtained data in a structured and machine-readable fashion for subsequent calculations and spatial modelling. For this reason, PostgreSQL with the PostGIS extension was chosen as the base database [29,30]. Due to the availability of municipalities’ historical regulations on occupancy tax rates and the levied amounts of taxes, the observed timeline was set between the years of 2008 and 2017. Within the subsections of the chapter, only the used datasets of the input data are available. All of the input data are publicly available and the base examples of used scripts are available for replication [31].
2.1. SUSR’s Capacity and Performances of Accommodation Establishments in Selected Towns [cr1003rr]
Official data on annual number of accommodation services providers (Table 1), total bed places, visitors, and overnight stays (Table 2) for the observed timeline were separately downloaded as Excel spreadsheets from SUSR’s online, subsequently extracted and then imported via a simple script using basic Python libraries into an earlier created local PostgreSQL database (hereinafter the Database) [30,31]. Two of the cities (Piešťany, Trenčianske Teplice) without any public information on their tax rates between 2008 and 2013, respectively, 2016, were left out of the testing.
2.2. Levied Occupancy Tax and Historical Tax Rates within Tested Cities
All nine pilot cities’ available annual final accounts and historical records on occupancy tax regulations were reviewed and the amounts of planned and levied occupancy tax revenues (Table 3) and tax rates per overnight stay (Table 4) were noted in a simple spreadsheet [32,33]. Afterwards, the data was imported into the Database via the edited Python script that is used in Section 2.1 [31].
2.3. Slovensko.Digital’s Registry of Financial Statements’ Application Programming Interfaces
In recent years, the civic association Slovensko.digital has been providing machine-readable access to a variety of essential open government and public administration data through structured databases (with thorough metadata) via open-source application programming interfaces (hereinafter API), with the possibility of reuse and integration by third parties under the Creative Commons Attribution 4.0 International Public License [26].
The Registry of Financial Statements’ (hereinafter RUZ) API provides a very user friendly Structured Query Language (hereinafter SQL) based access point to gateway data of the Ministry of Finances of Slovak Republic’s Registry of financial statements’ eXtensible Markup Language API [34]. The platform also provides regular updates of data changes and a possibility of bulk dumps of the whole dataset.
Within the scope of the notes, RUZ data, amongst others, cover, for each legal entity, the date of establishment and termination, registered address, and Eurostat’s Statistical classification of economic activities in the European Community (hereinafter NACE) [25]. For the extraction of annual quantities of accommodation service providers (Table 5) within the tested municipalities, a basic PostgreSQL query has been used. The query follows relevant NACE code (55100 Hotels and similar accommodation; 55 200 Holliday accommodations; and, 55300 Camping grounds, in accordance with the relevant timestamps of establishment or termination.
2.4. Slovensko.Digital’s RPO API
The RPO API is an alternative to SUSR’s registries. The same as the RUZ API, it provides a SQL based access point, but all the identification and classification information regarding legal entities was aggregated from 47 official registries (e.g., Business Register, Registry of tradesmen, etc.) [28]. Within the scope of the paper, RPO contains information on legal entities’ registered address and all the declared subjects of business activity, partially copying the UN’s ISIC methodology’s tags’ description relevant for accommodation services. For both of the variables, the data are available with validity and suspension timestamps. In order to extract the relevant data, a basic approach of multiple queries was chosen. The first query extracted all business activities (hereinafter BA) with relevant key word combinations corresponding to commercial accommodation services [31]. Afterwards the extract was sorted by timestamps of validity and suspension, and at the same time joined with legal entities’ addresses and status, both being sorted by validity timestamps. The final extract was sorted into a simple table covering annual number of legal entities declaring the provision of accommodation services at the municipality level (Table 6).
2.5. Finalazitaion of the Base Data Set
After basic data format cleaning, all of the extracted data was joined as one dataset. Each municipality inherited RUZ’s identification code that originates in SUSR’s general databases and every variable received a logical text abbreviation identity (Figure 1).
3. Approach of Statistical Modeling
For a better understanding of the overall distortion between source databases, data extracts that were obtained by the base PostgreSQL script’s [31] modification at the national level between years 1998 to 2007 were tested via built-in Python modules OLS Regression Analysis and the ANOVA test. The basic overview of data on the annual number of accommodation service providers (hereinafter n_acc) grouped by data sources shows extreme differences mainly for the RPO data (Table 7). In comparison with RUZ and SUSR, RPO reaches, at the same size of observation (N), extremely higher values of Standard deviation (SD), Standard error (SE), 95% confidence level (95 % Conf.), and Interval (Table 7).
Even though the samples are independent and all three samples are from a normally distributed population, the ANOVA test’s obligatory assumption of groups’ equal Standard deviation cannot be fulfilled (Table 8). For this reason, the one-way ANOVA test’s associated p-value cannot to be considered to be valid (Table 8).
For this reason, the Ordinary Least Squares (OLS) fitted regression model was used, with the number of accommodation service providers as the dependent variable (Figure 2); for high values, RPO was used as the Intercept. From the perspective of OLS results, the overall model at F(Df Model: 2, Df Residuals: 2) and p-value of almost 0 (Prob(F-statistic) indicates enormous differences for the groups’ means. The p-values (p>|t|) between groups show no differences and the overall variance is significant.
Via post-hoc testing an ANOVA model was created, which also indicates enormous variance of the groups (sum_sq) (Table 9). The unsystematic variation in the data for residuals is also enormous (sum_sq) (Table 9).
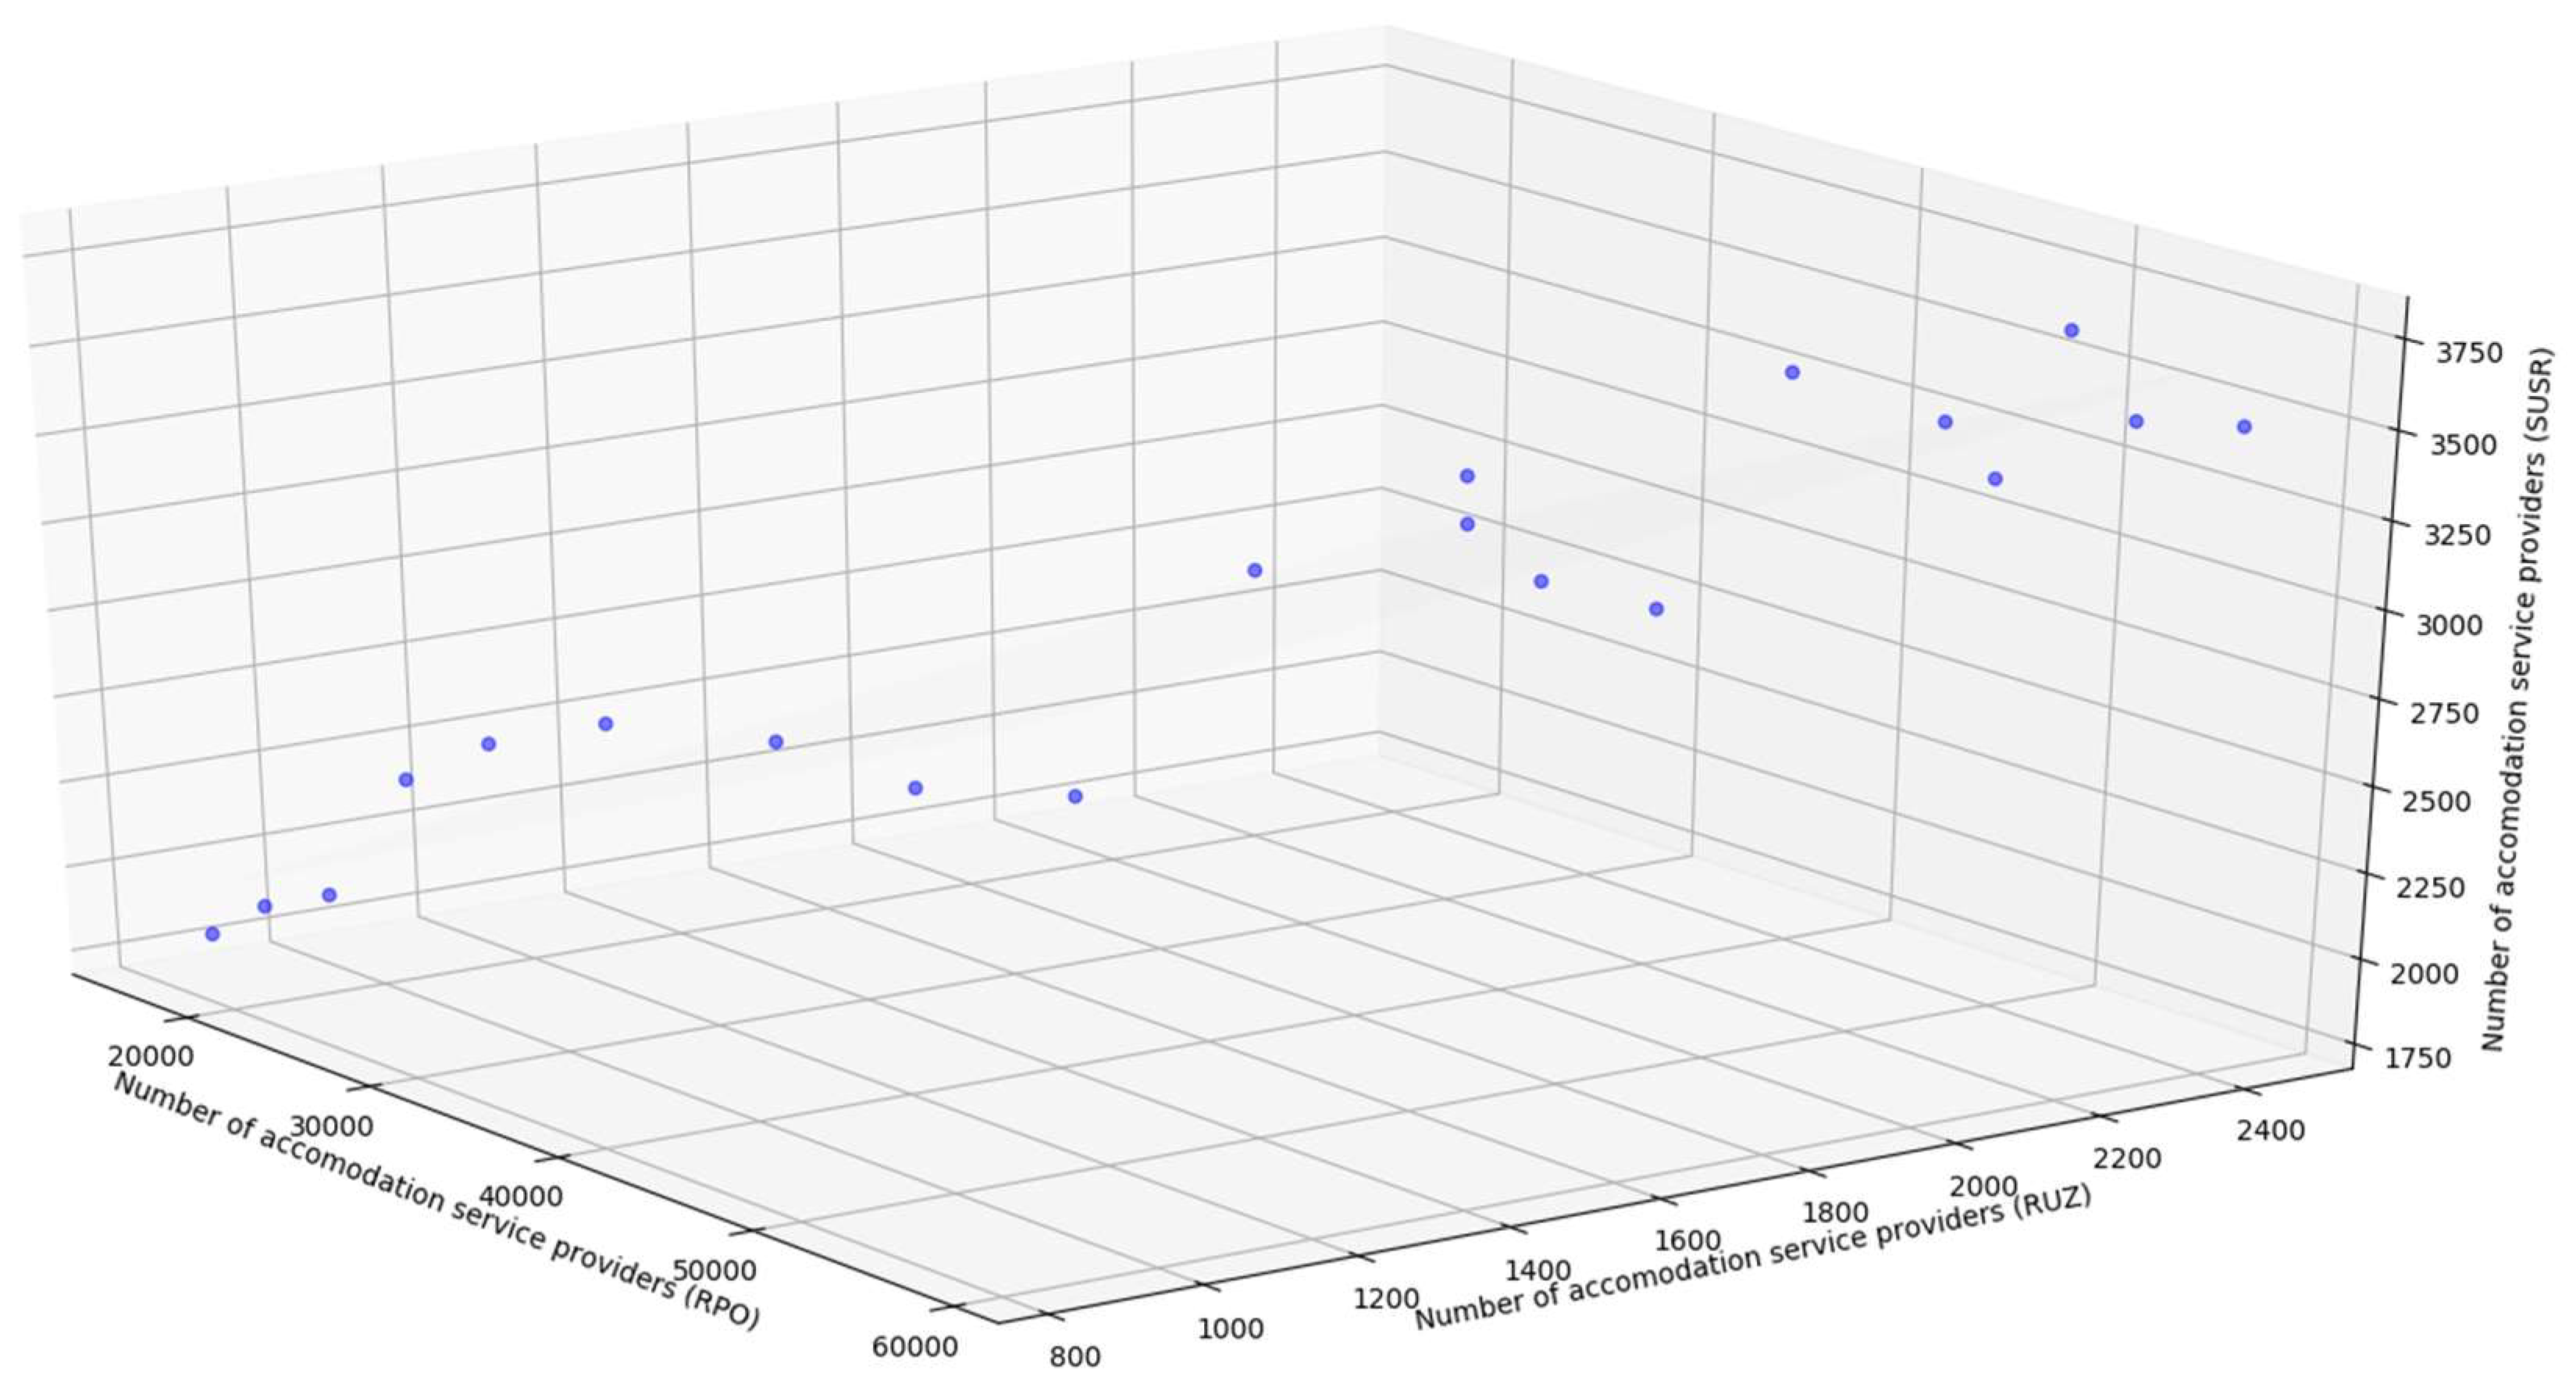
For better visualization of the distorted linear relationship between the input data sources, a Three-Dimensional (3D) Multi Linear Regression plot was elaborated in Python (Figure 3), where SUSR data was set as the response variable and RUZ and RPO data as the predictor variables. As the plot indicates, even though the number of accommodation service providers that were recorded by SUSR and in RUZ annually grow, the number of relevant entities identified in RPO grow at a much larger scale.
General observations at the national level only show a statistical distortion in the analyzed registries and they do not cause a significant problem at first sight. On the other side, these distortions at the municipality level directly affect the number of entities with obligations of reporting local occupancy tax collection. For this reason, the following section is focusing on data at the municipality levels.
In regards to attaining efficiency, all calculations were carried via SQL queries. Firstly, a basic back check on the ratio (rat_acc_ruz, rat_acc_rpo) of the officially operating accommodation service providers (n_acc_susr), registered accommodation service providers in RUZ (n_acc_susr), and legal entities declaring the provision of accommodation service providers within RPO (n_acc_rpo) (1).
Ratio of officially operating accommodation service providers and accommodation service providers identified in RUZ (rat_acc_ruz) =
Number of accommodation service providers identified in RUZ (n_acc_ruz)
Number of accommodation services providers identified by SUSR (n_acc_susr);
Ratio of officially operating accommodation service providers and accommodation service providers identified in RUZ (rat_acc_rpo) =
Number of accommodation service providers identified in RPO (n_acc_rpo)
Number of accommodation services providers identified by SUSR (n_acc_susr)
Since some of the municipalities have exceptions for occupancy tax obligation (e.g., students, pensioners, disabled persons), the input data on the levied tax (tax_real) and occupancy tax rate (tax_rate) may be used to get the number of taxable overnight stays (n_nights_real_tax_div_tax_rate) (2).
Number of taxed overnight stays (n_nights_real_tax_div_tax_rate) =
Total annual levied occupancy tax levied (real_tax)
Occupancy tax rate per overnight stays (tax_rate)
Total annual levied occupancy tax levied (real_tax)
Occupancy tax rate per overnight stays (tax_rate)
For the intention of estimating the theoretical amount of levied occupancy tax based on RUZ and RPO data, the average number overnight stays per accommodation service provider (hereinafter ASP) (avg_night_per_acc_susr) was calculated (3).
Average number of overnights per ASP for SUSR (avg_night_per_acc_susr) =
Total annual number of overnight stays in SUSR (nights_susr)
Total annual number of ASPs in SUSR (n_acc_susr)
Total annual number of overnight stays in SUSR (nights_susr)
Total annual number of ASPs in SUSR (n_acc_susr)
The results then were used to estimate the number of accommodation service providers (n_acc_tax) by the number of taxable nights (n_nights_real_tax_div_tax_rate) and the average number of overnight stays per accommodation service provider (avg_night_per_acc_susr) (4).
Estimated number of ASPs based on levied tax and average of ASPS (n_acc_tax) =
Number of taxed overnight stays (n_nights_real_tax_div_tax_rate)
Average number of overnights per ASP for SUSR (avg_night_per_acc_susr)
Number of taxed overnight stays (n_nights_real_tax_div_tax_rate)
Average number of overnights per ASP for SUSR (avg_night_per_acc_susr)
In accordance with SUSR’s monthly survey, SUSR’s data should cover all overnight stays (n_nights_susr) of all accommodation facilities, regardless the operating legal entities’ NACE code. Assuming the validity of SUSR’s data, it is possible to estimate the ratio of taxable nights (ratio_taxable_nights) (5).
Ratio of taxable overnight stays (ratio_taxable_nights) =
Number of taxed overnight stays (n_nights_real_tax_div_tax_rate)
Total annual number of overnight stays in SUSR (nights_susr);
Number of taxed overnight stays (n_nights_real_tax_div_tax_rate)
Total annual number of overnight stays in SUSR (nights_susr);
Based on the results (2), the initial approach was to calculate the annual number of overnight stays’ estimation based on RUZ (n_acc_ruz) and RPO (n_acc_rpo) data on the number of accommodation service providers (6).
Estimated number of overnight stays based on RUZ input data (n_nights_ruz) = Number of accommodation service providers identified in RUZ (n_acc_ruz)
×
Average number of overnights per ASP for SUSR (avg_night_per_acc_susr);
Estimated number of overnight stays based on RPO input data (n_nights_rpo) = Number of accommodation service providers identified in RPO (n_acc_rpo)
×
Average number of overnights per ASP for SUSR (avg_night_per_acc_susr);
×
Average number of overnights per ASP for SUSR (avg_night_per_acc_susr);
Estimated number of overnight stays based on RPO input data (n_nights_rpo) = Number of accommodation service providers identified in RPO (n_acc_rpo)
×
Average number of overnights per ASP for SUSR (avg_night_per_acc_susr);
Afterwards, the estimated number of taxable nights based on RUZ (n_nights_ruz) and RPO (n_nights_rpo) data and the ratio of taxable nights (ratio_taxable_nights) calculation was planned (7).
Estimated number of taxable overnight stays based on RUZ (taxable_nights_ruz) = Estimated number of overnight stays based on RUZ input data (n_nights_ruz)
×
Ratio of taxable overnight stays (ratio_taxable_nights);
Estimated number of taxable overnight stays based on RPO (taxable_nights_rpo) = Estimated number of overnight stays based on RUZ input data (n_nights_rpo)
×
Ratio of taxable overnight stays (ratio_taxable_nights);
×
Ratio of taxable overnight stays (ratio_taxable_nights);
Estimated number of taxable overnight stays based on RPO (taxable_nights_rpo) = Estimated number of overnight stays based on RUZ input data (n_nights_rpo)
×
Ratio of taxable overnight stays (ratio_taxable_nights);
The final planned step was to calculate the theoretical volume of levied occupancy tax (8) for the achieved RUZ and RPO data (7).
Estimated theoretical possible levied occupancy tax based on RUZ (tax_ruz) = Estimated number of taxable overnight stays based on RUZ (taxable_nights_ruz)
×
Occupancy tax rate per overnight stays (tax_rate);
Estimated theoretical possible levied occupancy tax based on RPO (tax_rpo) = Estimated number of taxable overnight stays based on RPO (taxable_nights_rpo)
×
Occupancy tax rate per overnight stays (tax_rate)
×
Occupancy tax rate per overnight stays (tax_rate);
Estimated theoretical possible levied occupancy tax based on RPO (tax_rpo) = Estimated number of taxable overnight stays based on RPO (taxable_nights_rpo)
×
Occupancy tax rate per overnight stays (tax_rate)
In the case of the RUZ dataset, the results were mixed up (Table 10) and the interim results on the ratio of number of accommodation service providers between RPO and SUSR were enormous (Table 11) as well, the initial approach (7, 8) was not carried out. Instead, the possible number of accommodation service providers (avg_acc_ruz_rpo_susr_tax) was calculated as the average between the RUZ, RPO, SUSR datasets (9) and, respectively, the number of overnight stays was calculated as well (n_nights_ruz_rpo_susr_tax) (10).
Estimated number of theoretical number of overnight stays (n_nights_ruz_rpo_susr_tax) =
Number ASPs based on the mean of input data (avg_acc_ruz_rpo_susr_tax)
×
Average number of overnights per ASP for SUSR (avg_night_per_acc_susr)
Number ASPs based on the mean of input data (avg_acc_ruz_rpo_susr_tax)
×
Average number of overnights per ASP for SUSR (avg_night_per_acc_susr)
The final estimation of number of overnight stays (n_nigths_est) was calculated (11) as the average of overnights stays extracted from SUSR (Table 2), and the calculated overnight stays from levied occupancy tax (2), RUZ (6), RPO (6), and theoretical number of overnight stays (10).
The last step was to determine the number of taxable nights from the final estimated overnight stays as was planned for RUZ and RPO (6), respectively, to calculate the estimated potential occupancy tax revenues (7).
4. Results
In terms of the ratio (1) of the number of accommodation services providers (hereinafter ASPs) in the RUZ dataset, as identified by their main NACE code, and ASPs, as identified by SUSR, shows certain deviations (Table 10). The deviations may be caused by the limits § 7 of the Slovak Business code with an impact on § 30 of the Slovak Trade Code. By the mentioned regulations, companies are not obligated to register their places of operation, only their seat and organizational sections must be registered within the Slovak Business registry. This may cause situations where companies that are registered in bigger cities (e.g., Bratislava, Košice) operate accommodation facilities outside the municipality of their seat and vice versa. Since there is no official methodology or system for municipalities as to how to effectively identify potential ASPs in bulk, and SUSR does not have the capacities to check every legal entity on site, the deviations may also be caused by ASPs ignorance towards SUSR’s monthly survey. From the perspective of sustainable funding for local tourism and the monitoring of the overall economic impact of tourism, these deviations may distort the position of tourism within the local, regional, and national economy.
The outcome ratio (1) is more disturbing in the case of the extracted RPO dataset (Table 11). The enormous deviations may be caused due to the openness of the source registries, without any systematic control. Generally, anyone can register any legal type of business activity, but without any back checks at legal entities, whether the registered business activity is being carried out may cause the same issues as the upper-mentioned in the case of the RUZ dataset.
At first sight, the calculated (2) number of taxed overnight stays (Table 12) does not bring any suspicions, but the ratio of taxable nights raises (3) a few questions. Since SUSR’s monthly surveys should record all overnight stays, which is in contrast with municipalities that only record overnight stays with occupancy tax obligation, the ratio of taxable nights should theoretically never reach a ratio that is higher than 100%.
Unfortunately, the resulted ratio of taxable nights (Table 13) indicates that municipalities record more overnight stays than SUSR. None of the cities meet the criteria of having the ratio under 100 % within the observed timeline.
The first consideration of what causes this deviation was that municipalities’ final annual accounts cover additionally collected occupancy tax debts from the year before. Since annual accounts identify accommodation service providers’ tax debts for the given year separately, summing the levied tax revenues and debts would create an even larger gap in the ratio. This partially proves the basic distortion of SUSR’s records that were obtained by the monthly survey system.
With these interim results, the calculation of taxable nights from the final estimated number of overnight stays would be distorted for years where the ratio of taxability is over 100 % (Table 13). For this reason, two modified tests were attempted to be carried oud. Firstly, the attempt to use the average annual ratio of taxability was left out of the testing. Only one of the tested cities—Bratislava—met the lesser than 100 % ratio criteria. Due to the large gap, the second calculation was carried out by the minimum ratio of taxable nights for each municipality (Table 14), which still achieved three to 11 times more than SUSR’s records. Cities Banská Bystrica and Žilina were excluded from the final calculations, due to the fact that the cities’ minimum ratio did not meet the lesser than 100 % criterion.
The final estimated possible levied occupancy tax revenues reach astronomic amounts (Table 15). To claim that these levels of revenues are exact or realistic would be a blind bold claim. However, the large gap between the ratio of the estimated and official records on occupancy tax revenues (Table 16) are a warning for the sustainability of the current system of governing data recording.
5. Discussion and Concluding Remarks
Vetro et al. clearly defined the necessity of measuring open and government data’s quality for further reuse [35]. The partial distortion of official data has been proven by the gap between SUSR’s data on overnight stays and overnight stays based levied occupancy tax revenues and tax rates. The necessity to take control measures in terms of implementing the NACE methodology and in monitoring the actual provision of declared business operations with official registries has been partially demonstrated by the mixed up and large ratio rates between SUSR’s records and the RUZ and RPO datasets.
The gaps between the data sets partially prove the unreliability of official data gathered by SUSR’s survey system. Overnight stays calculated via levied occupancy tax and tax rates are, in some cases, higher than the data that was recorded by SUSR indicates. SUSR’s data determines whether a candidate municipality or cluster is achieving the limit of 100 000 number of overnight stays for establishing a local DMO, which may then apply for annual funding. Based on the obtained results, the reliability SUSR’s data is question. Therefore, not only the upper actual upper limit for funding based on annual occupancy tax revenues for some cities may be higher, but it is also questionable as to whether smaller areas that currently do not achieve the 100 000 limit may rely on the mercy of SUSR’s official data.
At first sight, the issue is not so significant or currently devastating for the sustainability of DMO’s public funding. On the other hand, even a ten percent gap in within occupancy tax revenues means less funding for municipalities and RDMOs. Additionally, every unreported and subsequently not recorded ASP and overnight stay in the system distorts the actual impact of the industry, not to mention the theoretically possible VAT evasions. Fortunately, a few alternative preventative measures could lower the level of data distortion and, at the same time, challenge the systematic gaps for possible tax evasions.
The office of Financial Administration of the Slovak Republic (hereinafter FASR) has already taken certain measures. From July 2019, all accommodation service providers will be obligated to be connected to the FASR’s online system of cash registers. Subjectively, this step may bring partial positive effects and from a technological perspective may follow up wider solutions [36].
Sidor, within his earlier work, proposed measures that would tighten the possible space for data distortion [37]. In regards to formatting records of same business operations and missing information about the actual place of business operations, a simple preventative measure was proposed. All declared business operations, when recorded, should obligatorily copy the format and identification numbers of the ISIC methodology and each business operation should have its own address.
The second proposed measure was to link all of the relevant recording systems for faster and automatic dissemination regarding potential occupancy tax and relevant VAT taxpayers. The main idea was to connect the official RPO system with the Central Public Administration Portal (used also for reporting occupancy tax duties) and the FASR’s online system of cash registries. Each relevant recorded business operation within the RPO would be reported to municipalities and FASR, and afterwards the obligated legal entity would be informed about its duties.
The third proposed measure was aimed at easing accommodation service providers’ current obligation to report the same data multiple times (e.g., SUSR’s monthly survey, municipalities recording occupancy duties, Ministry of Interior recording data about foreigners stay). The idea was to widen the Ministry of Interior’s existing online accommodation book that was used only for reporting foreign overnight stays by the input data that was surveyed by municipalities and the SUSR, and then linking it with FASR’s cash registry.
This way, an ASP would only have the obligation to properly account each overnight stay and all of the other processes would be automated. Most distortions in official data that was not created primarily by tax evasion efforts, but by human errors rooted within the currently exhaustive system of data reporting could be minimized. Of course, the financial investments’ and positive outcomes’ ratio of these measures demand a long term public discussion, including not only the government, states institutes, public administration, and relevant associations representing ASPs, but also data scientists, and most importantly, developer communities.
Nevertheless, there are alternative options for the support of the sustainability of occupancy taxes’ and related VATs’ collection. The cases count with back checking SUSR’s and municipalities’ official records on enlisted ASP with RUZ and RPO records. ASPs that were not officially recorded will be back checked via different approaches. Firstly, geocoded RPO, RUZ records of business activities will be tested within third party APIs that primarily gather (e.g., Foursquare, Booking, Airbnb) information about ASPs. Secondly, APIs creating access to geocoded written and visual user/visitor feedback (e.g., social media platforms Facebook, Instagram, Twitter, etc.).
Partially, Google Street Maps’ (GSM) visualization of address points could also be used within the identification of surroundings’ change, but in the case of Slovakia GSMs, the latest update is from 2014. Last, but not least, another approach is to back check geocoded RPO data with mobile operators’ data. The Ministry of Transport and Construction of the Slovak Republic already purchased this kind of data at the district level, so the access to historical data at relevant RPO address points is just a question of time and effort.
Since the proposed measures eliminate double standards (between tax payers and tax evaders) and would provide a time saving automated open service, generating knowledge with added value for both ASPs and public authorities; in terms of the “Slippery slope framework” on tax compliance by Kirchler et al., the proposed measures could support the synergistic tax climate [38]. The impact of the proposed measures on public acceptance could be, among others, monitored based on the lexicographical analysis approach that was carried out by Lozza & Castiglioni [39].
Since these alternatives’ base is mainly built on open data and financially accessible samples of commercial data and commercial data that are partially already purchased by state institutions, they will be tested in the near future.
Author Contributions
Each author C.S., B.K., L.Š. has equally contributed to this publication.
Funding
This research was funded by the Slovak Research and Development Agency under contract no. APVV-14-0797.
Conflicts of Interest
The authors declare no conflict of interest. The funders had no role in the design of the study; in the collection, analyses, or interpretation of data; in the writing of the manuscript, or in the decision to publish the results.
References
- PricewaterhouseCoopers LLP. The Impact of Taxes on the Competitiveness of European Tourism: Final Report; Publications Office of the European Union: Luxembourg, 2017; p. 192. [Google Scholar] [CrossRef]
- Hiemstra, S.J.; Ismail, J.A. Impacts of Room Taxes on the Lodging Industry. J. Hosp. & Tour. Res. 1990, 14, 231–241. [Google Scholar]
- Lee, S.K. Revisiting the impact of bed tax with spatial panel approach. Int. J. Hosp. Manag. 2014, 41, 49–55. [Google Scholar] [CrossRef]
- Hamilton, A.; Brooks Marshall, S.; Hobson, H.A. Cities versus Online Travel Companies: Liability for Room Occupancy Taxes. Cornell Hosp. 2012, 53, 357–364. [Google Scholar] [CrossRef]
- Kljucnikov, A.; Krajcik, V.; Vincurova, Z. International sharing economy: The Case of AiRBnB in the Czech Republic. J. Sci. Pap. Econ. & Policy 2018, 11, 126–137. [Google Scholar] [CrossRef]
- Berinde, S.R.; Corpădean, A.G. Assessing the Sustainable Room for Growth for a Particular Romanian Tourism Area of Business: The Case of Accommodation Businesses. Sustainability 2019, 11, 243. [Google Scholar] [CrossRef]
- Durbarry, R. Tourism Taxes: Implications for Tourism Demand in the UK. Rev. Develop. Econ. 2008, 12, 21–36. [Google Scholar] [CrossRef] [Green Version]
- Song, H.; Seetaram, N.; Ye, S. The effect of tourism taxation on tourists’ budget allocation. J. Destin. Mark Manag. 2018, 11, 32–39. [Google Scholar] [CrossRef]
- Álvarez-Albelo, C.D.; Hernández-Martín, R.; Padrón, N. Air passenger duties as strategic tourism taxation. Tour. Manag. 2016, 60, 442–453. [Google Scholar] [CrossRef]
- Surugiu, C.; Surugiu, M.R. The impact of tourism taxation: Analysis for Romania. J. Tour. – Stud. Res. Tour. 2017, 24, 68–73. [Google Scholar]
- Gago, G.; Labandeira, Z.; Picos, F.; Rodríguez, M. Specific and general taxation of tourism activities: Evidence from Spain. Tour Manag. 2009, 30, 381–392. [Google Scholar] [CrossRef]
- Liu, Y.; Jing, Y.; Cai, E.; Cui, J.; Zhang, Y.; Chen, Y. How Leisure Venues Are and Why? A Geospatial Perspective in Wuhan, Central China. Sustainability 2017, 9, 1865. [Google Scholar] [CrossRef]
- National Council of the Slovak Republic. Act. No. 91/2010 Coll. on Support of Tourism. Available online: http://www.zakonypreludi.sk/zz/2010-91 (accessed on 18 December 2018).
- World Tourism Organization. Indicators of Sustainable Development for Tourism Destinations; World Tourism Organization: Madrid, Spain, 2004; p. 514. ISBN 92-844-0726-5. [Google Scholar]
- National Council of the Slovak Republic. Act No. 253/1998 about Reporting Residence of Citizens and Registry of Citizens. Zákony pre ľudí.sk. Available online: http://www.zakonypreludi.sk/zz/1998-253 (accessed on 18 December 2018).
- National Council of the Slovak Republic. Act No. 540/2001 about State Statistics. Zákony pre ľudí.sk. Available online: http://www.zakonypreludi.sk/zz/2001-540 (accessed on 18 December 2018).
- National Council of the Slovak Republic. Act No. 582/2004 about Local Taxes and Local Fees for Municipal Waste and Small Construction Waste. Zákony pre ľudí.sk. Available online: http://www.zakonypreludi.sk/zz/2004-582 (accessed on 18 December 2018).
- National Council of the Slovak Republic. Act No. 404/2011 about Reporting of Foreigners‘ Residence. Zákony pre ľudí.sk. Available online: http://www.zakonypreludi.sk/zz/2011-404 (accessed on 18 December 2018).
- Sidor, C.; Kršák, B.; Štrba, Ľ. The Role of Open Data on the Road to Destination Business Intelligence: Notes on SK NACE I55. Hotelnictví, Turismus a Vzdělávání; Institute of Hospitality Management in Prague: Prague, Czech Republic, 2017; pp. 166–172. ISBN 978-80-87411-99-5. [Google Scholar]
- Statistical Office of the Slovak Republic. Monthly Questionnaire on Activity of Accommodation Facility. statistics.sk. Available online: https://bit.ly/2sTza1y (accessed on 18 December 2018).
- Statistical Office of the Slovak Republic. Capacity and Performances of Accommodation Establishments in Selected Towns—Yearly Data [cr1003rr]. datacube.statististics.sk. Available online: https://bit.ly/2Tjy7Uf (accessed on 18 December 2018).
- Czech Statistical Office. Capacity of Accommodation Establishments by Category. db.czso.cz. Available online: https://bit.ly/2COigG6 (accessed on 18 December 2018).
- Hungarian Central Statistical Office. Accommodation Services: Annual Time Series Data. statinfo.ksh.hu. Available online: http://statinfo.ksh.hu/Statinfo/themeSelector.jsp?&lang=en (accessed on 18 December 2018).
- Statistics Poland. In Tourism; swaid.stat.gov.pl. Available online: http://swaid.stat.gov.pl/EN/AtlasRegionow/AtlasRegionowMapa.aspx (accessed on 18 December 2018).
- European Commission. NACE Rev. 2—Statistical Classification of Economic Activities in the European Community; The Publications Office of the European Union: Luxembourg, 2008; p. 369. ISSN 1977-0375. [Google Scholar]
- Slovensko.digital. Register účtovných uzávierok API. ekosystem.slovensko.digital. Available online: https://ekosystem.slovensko.digital/otvorene-data (accessed on 18 December 2018).
- United Nations Statistics Division. International Standard Industrial Classification of all Economic Activities; United Nations Publication: New York, NY, USA, 2008; p. 306. ISBN 978-92-1-161518-0. [Google Scholar]
- Slovensko.digital. Register právnických osôb API. ekosystem.slovensko.digital.. Available online: https://ekosystem.slovensko.digital/otvorene-data (accessed on 18 December 2018).
- The PostgreSQL Global Development Group. What is PostgreSQL? postgresql.org. Available online: https://www.postgresql.org/about/ (accessed on 18 December 2018).
- The Open Source Geospatial Foundation. Support-Postgis. postgis.net.. Available online: http://postgis.net/support/ (accessed on 18 December 2018).
- Sidor, C. List of Used Scripts of Queries. github.com. Available online: https://github.com/csabasidor/meta_occupancy_tax (accessed on 18 December 2018).
- Sidor, C. List of Municipality Annual Accounts. github.com. Available online: https://github.com/csabasidor/meta_occupancy_tax (accessed on 18 December 2018).
- Sidor, C. List of Municipality Regulations. github.com. Available online: https://github.com/csabasidor/meta_occupancy_tax (accessed on 18 December 2018).
- Ministry of Finance of the Slovak Republic. RÚZ Open API: verzia 2.0. registeruz.sk.. Available online: http://www.registeruz.sk/cruz-public/home/api (accessed on 18 December 2018).
- Vetró, A.; Canova, L.; Torchiano, M.; Minotas, C.O. Open data quality measurement framework: Definition and application to Open Government Data. Gov. Inf. Q. 2016, 33, 325–337. [Google Scholar] [CrossRef]
- Financial Administration Slovak Republic. E-kasa. financnasprava.sk. Available online: https://www.financnasprava.sk/sk/podnikatelia/dane/ekasa (accessed on 18 December 2018).
- Sidor, C. The impact of public data on the competitiveness of the destination management system in the Slovak Republic, exceeding the Visegrad Group. PhD Thesis, Technical University of Kosice, Kosice, Slovakia, 15 June 2018. [Google Scholar]
- Kirchler, E.; Hoelzl, E.; Wahl, I. Enforced versus voluntary tax compliance: The “slippery slope” framework. J. Econ. Psychol 2008, 29, 210–225. [Google Scholar] [CrossRef]
- Lozza, E.; Castiglioni, C. Tax Climate in the National Press: A New Tool in Tax Behaviour Research. J. Soc. Politic. Psychol. 2018, 6, 401–419. [Google Scholar] [CrossRef]
Figure 1.
The final extract datasets description.
| Columns | Type | Description |
| municipality_id | integer | Unique identification number of municipalities used by SUSR and RUZ |
| city | text | Name of the city |
| var_type | text | Abbreviation of input data’s variables following a three positional logical concept. n_acc_susr – n stands for variable type (number); acc represents category’s abbreviation (accommodation) and susr represents the source database. |
| 2008–2017 | numeric | Numerical value of the variable within the given year. |
Figure 2.
Ordinary Least Squares (OLS) regression results.
| Dep. Variable: | n_acc | R-squared: | 0.819 | |||
| Model: | OLS | Adj. R-squared | 0.812 | |||
| Method: | Least Squares | F-statistic: | 128.5 | |||
| Date: | Friday, 8 February 2019 | Prob (F-statistic): | 7.55 × 10⁻²² | |||
| Time: | 10:14:52 | Log-Likelihood: | −627.46 | |||
| No. Observations: | 60 | AIC: | 1261 | |||
| Df Residuals: | 57 | BIC: | 1267 | |||
| Df Model: | 2 | |||||
| coef | std err | t | p>|t| | [0.025 | 0.975] | |
| Intercept | 4.017 × 10⁴ | 1932.35 | 20.788 | 0.000 | 3.63 × 10⁴ | 4.4 × 10⁴ |
| C(source)[T.ruz] | −3.856 × 10⁴ | 2732.75 | −14.111 | 0.000 | −4.4 × 10⁴ | −3.31 × 10⁴ |
| C(source)[T.susr] | −3.73 × 10⁴ | 2732.75 | −13.648 | 0.000 | −4.28 × 10⁴ | −3.18 × 10⁴ |
| Omnibus: | 11.386 | Durbin-Watson: | 0.263 | |||
| Prob(Omnibus): | 0.003 | Jarque-Bera (JB): | 13.678 | |||
| Skew: | −0.762 | Prob(JB): | 0.00107 | |||
| Kurtosis: | 4.775 | Cond. No. | 3.73 | |||
Figure 3.
Multilinear regression plot between SUSR, RUZ, and RPO data.

Table 1.
Official number of accommodation facilities in tested cities (Slovak Republic’s Statistical Office’s (SUSR)) [21].
Table 1.
Official number of accommodation facilities in tested cities (Slovak Republic’s Statistical Office’s (SUSR)) [21].
| City/Year | Banská Bystrica | Bratislava | Košice | Liptovský Mikuláš | Nitra | Poprad | Žilina |
|---|---|---|---|---|---|---|---|
| 2008 | 25 | 96 | 59 | 66 | 27 | 30 | 40 |
| 2009 | 26 | 109 | 62 | 61 | 34 | 28 | 38 |
| 2010 | 28 | 113 | 63 | 57 | 33 | 27 | 35 |
| 2011 | 29 | 118 | 64 | 53 | 34 | 27 | 34 |
| 2012 | 37 | 136 | 68 | 86 | 35 | 40 | 33 |
| 2013 | 36 | 128 | 68 | 82 | 36 | 41 | 34 |
| 2014 | 32 | 123 | 67 | 76 | 35 | 39 | 33 |
| 2015 | 36 | 149 | 71 | 84 | 37 | 41 | 38 |
| 2016 | 38 | 151 | 67 | 78 | 36 | 40 | 35 |
| 2017 | 40 | 153 | 67 | 79 | 34 | 38 | 32 |
Table 2.
Official number of overnight stays in the tested cities (SUSR) [21].
Table 2.
Official number of overnight stays in the tested cities (SUSR) [21].
| City/Year | Banská Bystrica | Bratislava | Košice | Liptovský Mikuláš | Nitra | Poprad | Žilina |
|---|---|---|---|---|---|---|---|
| 2008 | 108 031 | 1 549 094 | 283 225 | 230 001 | 210 521 | 164 251 | 174 133 |
| 2009 | 90 473 | 1 331 361 | 220 178 | 163 423 | 166 039 | 117 388 | 155 423 |
| 2010 | 84 595 | 1 381 024 | 262 660 | 169 750 | 211 471 | 116 485 | 150 789 |
| 2011 | 84 719 | 1 526 549 | 254 233 | 188 577 | 187 233 | 146 004 | 169 737 |
| 2012 | 79 813 | 1 722 958 | 258 894 | 162 273 | 155 133 | 149 074 | 154 132 |
| 2013 | 78 756 | 1 919 823 | 285 736 | 184 483 | 171 019 | 162 166 | 146 429 |
| 2014 | 66 416 | 1 793 155 | 262 112 | 169 160 | 162 494 | 158 077 | 142 103 |
| 2015 | 73 773 | 2 257 218 | 305 620 | 169 807 | 166 551 | 181 139 | 204 143 |
| 2016 | 94 273 | 2 603 883 | 350 145 | 221 410 | 237 087 | 198 638 | 216 720 |
| 2017 | 98 775 | 2 719 733 | 367 725 | 238 330 | 294 735 | 194 970 | 202 630 |
Table 3.
Historical occupancy text rates in Euros in tested cities (source).
| City/Year | Banská Bystrica | Bratislava | Košice | Liptovský Mikuláš | Nitra | Poprad | Žilina |
|---|---|---|---|---|---|---|---|
| 2008 | 0.33 | 1.66 | 0.83 | 0.66 | 0.50 | 0.66 | 0.66 |
| 2009 | 0.33 | 1.65 | 1.00 | 0.66 | 0.50 | 0.66 | 0.66 |
| 2010 | 0.33 | 1.65 | 1.00 | 0.66 | 0.50 | 0.66 | 0.70 |
| 2011 | 0.33 | 1.65 | 1.00 | 0.66 | 0.50 | 0.66 | 0.70 |
| 2012 | 1.00 | 1.65 | 1.00 | 1.00 | 0.50 | 0.70 | 1.00 |
| 2013 | 1.00 | 1.65 | 1.50 | 1.00 | 0.50 | 0.70 | 1.00 |
| 2014 | 1.00 | 1.65 | 1.50 | 1.00 | 0.50 | 0.70 | 1.00 |
| 2015 | 1.00 | 1.65 | 1.50 | 1.00 | 0.50 | 0.70 | 1.00 |
| 2016 | 1.00 | 1.65 | 1.50 | 1.00 | 0.50 | 0.70 | 1.00 |
| 2017 | 1.00 | 1.70 | 1.50 | 1.00 | 0.70 | 0.70 | 1.00 |
Table 4.
Levied occupancy tax revenues in Euros in tested cities (source) [33].
Table 4.
Levied occupancy tax revenues in Euros in tested cities (source) [33].
| City/Year | Banská Bystrica | Bratislava | Košice | Liptovský Mikuláš | Nitra | Poprad | Žilina |
|---|---|---|---|---|---|---|---|
| 2008 | 59 782 | 2 844 121 | 239 594 | 149 990 | 153 124 | 128 958 | 166 434 |
| 2009 | 42 676 | 2 254 248 | 245 491 | 109 376 | 96 379 | 76 579 | 154 071 |
| 2010 | 30 990 | 2 321 883 | 248 441 | 111 690 | 110 475 | 94 553 | 148 626 |
| 2011 | 38 306 | 2 414 399 | 264 638 | 123 912 | 103 383 | 98 616 | 145 020 |
| 2012 | 88 447 | 2 488 607 | 281 015 | 158 235 | 84 279 | 114 565 | 174 711 |
| 2013 | 101 601 | 2 681 408 | 429 927 | 182 070 | 74 340 | 126 607 | 161 336 |
| 2014 | 92 049 | 2 759 078 | 413 199 | 180 984 | 74 336 | 130 290 | 167 153 |
| 2015 | 89 455 | 3 166 138 | 523 694 | 184 741 | 76 716 | 141 266 | 241 790 |
| 2016 | 121 750 | 3 562 079 | 502 130 | 208 102 | 108 462 | 152 566 | 228 108 |
| 2017 | 123 554 | 4 958 342 | 547 420 | 227 110 | 205 288 | 158 378 | 227 665 |
Table 5.
Number of accommodation facilities in tested cities within the Registry of Financial Statements’ (RUZ) database.
Table 5.
Number of accommodation facilities in tested cities within the Registry of Financial Statements’ (RUZ) database.
| City/Year | Banská Bystrica | Bratislava | Košice | Liptovský Mikuláš | Nitra | Poprad | Žilina |
|---|---|---|---|---|---|---|---|
| 2008 | 36 | 236 | 57 | 66 | 28 | 20 | 31 |
| 2009 | 37 | 249 | 57 | 62 | 28 | 22 | 30 |
| 2010 | 40 | 264 | 56 | 66 | 29 | 20 | 30 |
| 2011 | 44 | 278 | 60 | 63 | 26 | 19 | 31 |
| 2012 | 48 | 303 | 65 | 67 | 28 | 18 | 34 |
| 2013 | 51 | 333 | 75 | 74 | 28 | 19 | 37 |
| 2014 | 49 | 342 | 80 | 85 | 29 | 20 | 41 |
| 2015 | 44 | 359 | 87 | 85 | 29 | 19 | 44 |
| 2016 | 45 | 372 | 94 | 93 | 29 | 18 | 42 |
| 2017 | 46 | 388 | 102 | 93 | 32 | 19 | 42 |
Table 6.
Number of accommodation facilities in tested cities within the Registry of legal entities (RPO) database.
Table 6.
Number of accommodation facilities in tested cities within the Registry of legal entities (RPO) database.
| City/Year | Banská Bystrica | Bratislava | Košice | Liptovský Mikuláš | Nitra | Poprad | Žilina |
|---|---|---|---|---|---|---|---|
| 2008 | 935 | 3 468 | 2 238 | 1 857 | 502 | 412 | 1 431 |
| 2009 | 952 | 3 744 | 2 244 | 1 812 | 533 | 381 | 1 378 |
| 2010 | 971 | 4 067 | 2 255 | 1 825 | 549 | 378 | 1 362 |
| 2011 | 994 | 4 382 | 2 314 | 1 752 | 553 | 385 | 1 335 |
| 2012 | 1 029 | 4 909 | 2 414 | 1 741 | 587 | 386 | 1 355 |
| 2013 | 1 073 | 5 604 | 2 583 | 1 702 | 682 | 383 | 1 371 |
| 2014 | 1 099 | 6 055 | 2 702 | 1 679 | 674 | 381 | 1 333 |
| 2015 | 1 089 | 6 738 | 2 770 | 1 627 | 681 | 383 | 1 304 |
| 2016 | 1 162 | 7 663 | 2 844 | 1 622 | 703 | 382 | 1 318 |
| 2017 | 1 287 | 8 659 | 2 948 | 1 646 | 772 | 396 | 1 308 |
Table 7.
Summary statistics of source data groups’ at national level.
| Source | N | Mean | SD | SE | 95% Conf. | Interval |
|---|---|---|---|---|---|---|
| RPO | 20 | 40 170 | 14 945.2 | 3 341.849 | 33 449.82 | 46 890.18 |
| RUZ | 20 | 1 609.5 | 535.2206 | 119.679 | 1 368.835 | 1 850.165 |
| SUSR | 20 | 2 873.9 | 626.4254 | 140.073 | 2 592.225 | 3 155.575 |
Table 8.
Results of the one-way ANOVA tests of source data groups’ at the national level.
| F-Value | p-Value |
|---|---|
| 128.52776849735147 | 7.546566927916095 × 10⁻²² |
Table 9.
ANOVA model results.
| sum_sq | df | mean_sq | F | PR(>F) | eta_sq | omega_sq | |
|---|---|---|---|---|---|---|---|
| Source | 1.92 × 10¹⁰ | 2 | 9.6 × 10⁹ | 128.5278 | 7.55 × 10⁻²² | 0.818503 | 0.809557 |
| Residual | 4.26 × 10⁹ | 57 | 7.467932 × 10⁷ |
Table 10.
Percentage (%) ratio of number of accommodation service providers between RUZ and SUSR.
| City/Year | Banská Bystrica | Bratislava | Košice | Liptovský Mikuláš | Nitra | Poprad | Žilina |
|---|---|---|---|---|---|---|---|
| 2008 | 144 | 245.83 | 96.61 | 100 | 103.7 | 103.33 | 102.5 |
| 2009 | 142.31 | 228.44 | 91.94 | 101.64 | 82.35 | 107.14 | 97.37 |
| 2010 | 142.86 | 233.63 | 88.89 | 115.79 | 87.88 | 111.11 | 105.71 |
| 2011 | 151.72 | 235.59 | 93.75 | 118.87 | 76.47 | 114.81 | 120.59 |
| 2012 | 129.73 | 222.79 | 95.59 | 77.91 | 80 | 85 | 118.18 |
| 2013 | 141.67 | 260.16 | 110.29 | 90.24 | 77.78 | 90.24 | 123.53 |
| 2014 | 153.13 | 278.05 | 119.4 | 111.84 | 82.86 | 105.13 | 133.33 |
| 2015 | 122.22 | 240.94 | 122.54 | 101.19 | 78.38 | 107.32 | 118.42 |
| 2016 | 118.42 | 246.36 | 140.3 | 119.23 | 80.56 | 105 | 122.86 |
| 2017 | 115 | 253.59 | 152.24 | 117.72 | 94.12 | 110.53 | 137.5 |
Table 11.
Percentage (%) ratio of number of accommodation service providers between RPO and SUSR.
| City/Year | Banská Bystrica | Bratislava | Košice | Liptovský Mikuláš | Nitra | Poprad | Žilina |
|---|---|---|---|---|---|---|---|
| 2008 | 3 740 | 3 612.5 | 3 793.22 | 2 813.64 | 1 859.26 | 4 770 | 2 287.5 |
| 2009 | 3 661.54 | 3 434.86 | 3 619.35 | 2 970.49 | 1 567.65 | 4 921.43 | 2 471.05 |
| 2010 | 3 467.86 | 3 599.12 | 3 579.37 | 3 201.75 | 1 663.64 | 5 044.44 | 2 780 |
| 2011 | 3 427.59 | 3 713.56 | 3 615.63 | 3 305.66 | 1 626.47 | 4 944.44 | 2 932.35 |
| 2012 | 2 781.08 | 3 609.56 | 3 550 | 2 024.42 | 1 677.14 | 3 387.5 | 3 163.64 |
| 2013 | 2 980.56 | 4 378.13 | 3 798.53 | 2 075.61 | 1 894.44 | 3 343.9 | 3 502.94 |
| 2014 | 3 434.38 | 4 922.76 | 4 032.84 | 2 209.21 | 1 925.71 | 3 417.95 | 3 563.64 |
| 2015 | 3 025 | 4 522.15 | 3 901.41 | 1 936.9 | 1 840.54 | 3 180.49 | 3 150 |
| 2016 | 3 057.89 | 5 074.83 | 4 244.78 | 2 079.49 | 1 952.78 | 3 295 | 3 548.57 |
| 2017 | 3 217.5 | 5 659.48 | 4 400 | 2 083.54 | 2 270.59 | 3 442.11 | 3 965.63 |
Table 12.
Number of nights with obligatory occupancy tax within the tested cities.
| City/Year | Banská Bystrica | Bratislava | Košice | Liptovský Mikuláš | Nitra | Poprad | Žilina |
|---|---|---|---|---|---|---|---|
| 2008 | 180 100 | 1 713 640 | 288 720 | 227 258 | 307 533 | 194 250 | 250 700 |
| 2009 | 129 321 | 1 366 211 | 245 491 | 164 723 | 193 568 | 116 029 | 232 077 |
| 2010 | 93 909 | 1 407 202 | 248 441 | 169 227 | 221 878 | 143 262 | 212 322 |
| 2011 | 116 079 | 1 463 272 | 264 638 | 187 745 | 207 634 | 149 418 | 207 172 |
| 2012 | 88 447 | 1 508 247 | 281 015 | 158 235 | 169 266 | 163 664 | 174 711 |
| 2013 | 101 601 | 1 625 096 | 286 618 | 182 070 | 148 680 | 180 868 | 161 336 |
| 2014 | 92 049 | 1 672 168 | 275 466 | 180 984 | 148 672 | 186 128 | 167 153 |
| 2015 | 89 455 | 1 918 872 | 349 129 | 184 741 | 153 432 | 201 809 | 241 790 |
| 2016 | 121 750 | 2 158 836 | 334 753 | 208 102 | 216 924 | 217 951 | 228 108 |
| 2017 | 123 554 | 2 916 672 | 364 947 | 227 110 | 293 269 | 226 254 | 227 665 |
Table 13.
Ratio of taxable nights within the tested cities.
| City/Year | Banská Bystrica | Bratislava | Košice | Liptovský Mikuláš | Nitra | Poprad | Žilina |
|---|---|---|---|---|---|---|---|
| 2008 | 166.71 | 110.62 | 101.94 | 98.81 | 146.08 | 118.26 | 143.97 |
| 2009 | 142.94 | 102.62 | 111.5 | 100.8 | 116.58 | 98.84 | 149.32 |
| 2010 | 111.01 | 101.9 | 94.59 | 99.69 | 104.92 | 122.99 | 140.81 |
| 2011 | 137.02 | 95.85 | 104.09 | 99.56 | 110.9 | 102.34 | 122.05 |
| 2012 | 110.82 | 87.54 | 108.54 | 97.51 | 109.11 | 109.79 | 113.35 |
| 2013 | 129.01 | 84.65 | 100.31 | 98.69 | 86.94 | 111.53 | 110.18 |
| 2014 | 138.59 | 93.25 | 105.09 | 106.99 | 91.49 | 117.75 | 117.63 |
| 2015 | 121.26 | 85.01 | 114.24 | 108.79 | 92.12 | 111.41 | 118.44 |
| 2016 | 129.15 | 82.91 | 95.6 | 93.99 | 91.5 | 109.72 | 105.25 |
| 2017 | 125.09 | 107.24 | 99.24 | 95.29 | 99.5 | 116.05 | 112.36 |
Table 14.
Estimated taxable overnight stays based on minimum ratio of taxable nights.
| City/Year | Bratislava | Košice | Liptovský Mikuláš | Nitra | Poprad |
|---|---|---|---|---|---|
| 2008 | 10 178 595 | 2 146 853 | 1 303 151 | 755 670 | 1 617 403 |
| 2009 | 8 316 910 | 1 594 296 | 974 568 | 505 638 | 1 191 906 |
| 2010 | 9 015 489 | 1 880 472 | 1 090 616 | 681 261 | 1 212 072 |
| 2011 | 10 260 953 | 1 839 914 | 1 249 513 | 587 387 | 1 491 599 |
| 2012 | 11 247 128 | 1 842 325 | 671 906 | 501 262 | 1 054 523 |
| 2013 | 15 100 835 | 2 176 384 | 785 931 | 616 696 | 1 134 699 |
| 2014 | 15 778 071 | 2 117 606 | 770 015 | 596 215 | 1 133 926 |
| 2015 | 18 221 765 | 2 394 951 | 682 716 | 585 033 | 1 215 048 |
| 2016 | 23 432 465 | 2 983 786 | 956 975 | 880 099 | 1 376 575 |
| 2017 | 27 147 508 | 3 250 164 | 1 031 160 | 1 264 042 | 1 410 120 |
Table 15.
Estimated occupancy tax revenues in Euro based on minimum ratio of taxable nights.
| City/Year | Bratislava | Košice | Liptovský Mikuláš | Nitra | Poprad |
|---|---|---|---|---|---|
| 2008 | 16 893 373 | 1 781 562 | 860 080 | 376 255 | 1 073 759 |
| 2009 | 13 722 902 | 1 594 296 | 647 113 | 251 762 | 786 658 |
| 2010 | 14 875 557 | 1 880 472 | 719 807 | 339 206 | 799 968 |
| 2011 | 16 930 572 | 1 839 914 | 824 679 | 292 465 | 984 455 |
| 2012 | 18 557 761 | 1 842 325 | 671 906 | 249 583 | 738 166 |
| 2013 | 24 916 378 | 3 264 576 | 785 931 | 308 348 | 794 289 |
| 2014 | 26 033 817 | 3 176 409 | 770 015 | 298 108 | 793 748 |
| 2015 | 30 065 912 | 3 592 427 | 682 716 | 292 517 | 850 534 |
| 2016 | 38 663 567 | 4 475 679 | 956 975 | 440 050 | 963 603 |
| 2017 | 46 150 764 | 4 875 246 | 1 031 160 | 884 829 | 987 084 |
Table 16.
Percentage (%) ratio between estimated tax revenues and official tax revenues in Euro.
| City/Year | Bratislava | Košice | Liptovský Mikuláš | Nitra | Poprad |
|---|---|---|---|---|---|
| 2008 | 593.98 | 743.58 | 573.42 | 245.72 | 832.64 |
| 2009 | 608.76 | 649.43 | 591.64 | 261.22 | 1 027.25 |
| 2010 | 640.67 | 756.91 | 644.47 | 307.04 | 846.05 |
| 2011 | 701.23 | 695.26 | 665.54 | 282.89 | 998.27 |
| 2012 | 745.71 | 655.6 | 424.63 | 296.14 | 644.32 |
| 2013 | 929.23 | 759.33 | 431.66 | 414.78 | 627.36 |
| 2014 | 943.57 | 768.74 | 425.46 | 401.03 | 609.22 |
| 2015 | 949.61 | 685.98 | 369.55 | 381.3 | 602.08 |
| 2016 | 1085.42 | 891.34 | 459.86 | 405.72 | 631.6 |
| 2017 | 930.77 | 890.59 | 454.04 | 431.02 | 623.25 |
© 2019 by the authors. Licensee MDPI, Basel, Switzerland. This article is an open access article distributed under the terms and conditions of the Creative Commons Attribution (CC BY) license (http://creativecommons.org/licenses/by/4.0/).
Share and Cite
MDPI and ACS Style
Sidor, C.; Kršák, B.; Štrba, Ľ. Identification of Distorted Official Hospitality Statistics’ and Their Impact on DMOs’ Funding’s Sustainability: Case Notes from Slovakia. Sustainability 2019, 11, 1084. https://doi.org/10.3390/su11041084
AMA Style
Sidor C, Kršák B, Štrba Ľ. Identification of Distorted Official Hospitality Statistics’ and Their Impact on DMOs’ Funding’s Sustainability: Case Notes from Slovakia. Sustainability. 2019; 11(4):1084. https://doi.org/10.3390/su11041084
Chicago/Turabian StyleSidor, Csaba, Branislav Kršák, and Ľubomír Štrba. 2019. "Identification of Distorted Official Hospitality Statistics’ and Their Impact on DMOs’ Funding’s Sustainability: Case Notes from Slovakia" Sustainability 11, no. 4: 1084. https://doi.org/10.3390/su11041084
Note that from the first issue of 2016, this journal uses article numbers instead of page numbers. See further details here.