Article

Assessment of Indoor Environmental Quality for Retrofitting Classrooms with An Egg-Crate Shading Device in A Hot Climate

by
Carmen María Calama-González
1,*,
Rafael Suárez
1,
Ángel Luis León-Rodríguez
1 and
Simone Ferrari
2
1
Instituto Universitario de Arquitectura y Ciencias de la Construcción, Escuela Técnica Superior de Arquitectura, Universidad de Sevilla, Av. Reina Mercedes 2, 41012 Seville, Spain
2
Department of Architecture, Built Environment and Construction Engineering (ABC), Politecnico di Milano, via Ponzio 31, 20133 Milano, Italy
*
Author to whom correspondence should be addressed.
Sustainability 2019, 11(4), 1078; https://doi.org/10.3390/su11041078
Submission received: 21 January 2019 / Revised: 11 February 2019 / Accepted: 14 February 2019 / Published: 19 February 2019

Abstract

:
In the Mediterranean climate, a large number of educational buildings suffer from discomfort due mostly to energy-deficient thermal envelopes and a lack of cooling systems. Impending climate change is expected to worsen overheating in classrooms, especially during heatwave periods. Therefore, the protection of window openings to reduce incident solar radiation while maintaining adequate indoor environmental quality must be considered a necessary key focus. The main objective of this research is to assess the influence of an egg-crate shading device on the indoor environmental quality of a classroom in Southern Spain. To do so, two classrooms—with and without this shading device—were simultaneously monitored over a whole year. The implementation of an egg-crate shading device allowed for a significant reduction of the incident solar radiation, both in summer and mid-season (around 45–50%), which objectively slightly conditioned indoor operative temperatures. Given the noticeable influence of the user patterns observed, indoor illuminance was also improved, as the rolling shutters tended to be opened at higher aperture levels.

1. Introduction

The increase in outdoor temperatures and overheating due to global warming is starting to impact retrofitting strategies for existing buildings, especially educational buildings in the Mediterranean climate. This problem takes on great importance in classrooms because of the significant influence of indoor conditions derived from high internal gains from high occupancy. Retrofitting this building stock has mainly focused on energy improvements, with less consideration for indoor thermal and lighting comfort conditions [1]. Nevertheless, the issue of indoor thermal comfort assessment in educational buildings is highly relevant in the scientific literature [2,3,4], as discomfort conditions can even affect students’ activity and attention [5], especially in the case of children, considered to be more sensitive targets [6]. In addition, the effects of indoor environment quality (IEQ) in classrooms on comfort, health and learning performance can be clearly observed [2,7,8,9,10], depending on different conditions such as acoustical, thermal, indoor air and visual quality.
Several studies reveal poor indoor air quality (IAQ) conditions in classrooms [11,12,13,14,15] and evidence of links between poor environment quality and students’ reduced performance, learning ability, and attendance [16,17]. Shendell et al. [18] even found a statistically significant association between CO2 levels and absenteeism in schools. However, there is no scientific agreement on the relative importance of IEQ factors for overall satisfaction, as pointed out by Kim and de Dear [19] using Kano’s satisfaction model. Through surveys conducted in British schools, Barret et al. [20] conclude that the ambient factor, which most conditioned the design of a classroom, is natural lighting. Nonetheless, these authors also state that thermal comfort is one of the aspects that most influence IEQ and, along with air quality, is one of the key factors associated with energy efficiency and, in turn, energy and operational costs.
In the specific case of Southern Spain, most educational buildings do not usually incorporate cooling systems; as a result, comfort conditions are rather limited, with classes occasionally canceled due to high indoor temperatures in classrooms. Thus, thermal comfort analysis is a key aspect for the evaluation of the IEQ in these buildings.
At present, the suitable indoor temperature is commonly defined according to the thermal comfort theory formulated by Fanger [21], based on heat balance model studies (1970), which led to the definition of a universally recognized comfort index: the predicted mean vote (PMV). The key concept of this model is that, when exposed to constant, moderate thermal conditions and subjected to continuous physical activity, the human body tends to produce a quantity of heat that balances dissipated heat without noticeable accumulation. Therefore, the internal production of heat, minus natural losses from evaporation and transpiration (regarded as “internal”), is equal to radiative and convective thermal dissipation.
Consequently, the specific quantities taken into account to describe all the components of the heat balance equation, chosen after a sequence of empirical tests, were two values connected to the occupant (i.e., activity level, which is the metabolic rate defined as “met,” 1 met refering to 58.2 W/m2 [22], and the thermal resistance of clothing, which measures the thermal insulation of clothes and is expressed as “clo,” where 1 clo corresponds to 0.155 m2·°C/W [22]) and four values connected to the environment (i.e., air temperature, mean radiant temperature, mean air velocity, and vapor pressure).
Assuming the equivalence between comfort and sensation of thermal neutrality, studies were undertaken to build an index of thermal sensation, a quantity that could predict the occupants’ thermal response, universally valid and based upon the previously mentioned variables. In order to standardize the results, Fanger [21] used the widely deployed 7-point ASHRAE 55:2004 [23] scale: from −3, very cold, to +3, very warm, with the average value of 0 as the perfect thermal neutrality.
Fanger [21] also calculated the percentage of dissatisfied persons that corresponded statistically to a given PMV, which is important in normative terms, as it leads directly to the development of regulations related to the issues of comfort. The relation between PMV and dissatisfaction levels has been developed through the statistical evaluation of thermal votes obtained via an extensive sequence of climatic chamber tests. Considering all the votes outside the interval between −1 and +1 as unsatisfying, the PPD function (predicted percentage of dissatisfied) shows the correlation between the PMV and the percentage of dissatisfied people.
The main international standards in place regarding the determination of indoor environmental conditions—ISO 7730:2005 [22], CEN EN 15251:2007 [24] and its revision prEN 16798-1:2015 [25], and ASHRAE 55:2017 [26]—implement this approach. The Fanger [21] equation is used to determine reference temperature ranges according to conventional seasonal clothing level and standard air humidity and velocity and relating to building use, corresponding to defined activity levels.
Fanger’s work [21] is of utmost importance as it resulted in the first universally valid technique for the evaluation of thermal environments. However, its formulation was the object of some criticism, since this approach bases the definition of thermal comfort on mere physics, completely neglecting the social and psychological aspects of thermal perception. Moreover, as its formulation is completely steady-state, it determines a very narrow range of allowable temperatures throughout the year regardless of outdoor conditions.
Because of the above observations, field studies on environmental conditions and comfort determination inside actual buildings first began in the 1970s, aiming to verify the accuracy of the PMV/PPD indices in predicting the actual thermal sensation and preference expressed by the occupants. Given the important differences highlighted by the results [27], the adaptive approach was developed as an alternative approach to the definition of comfortable environmental conditions. The main assumptions of this approach concern:
  • —the ability of human beings to adapt to environmental conditions (through conscious or unconscious changes in metabolic rate or clothing level) and to interact with the environment in order to adapt it to their needs (through available environmental controls);
  • —the influence of thermal experience on the occupants’ expectations regarding indoor conditions, which can be short-term, as a result of recent weather, or long-term, related to the general climate they are used to.
The extensive data collected in these studies [28,29,30] allowed for a statistical analysis that revealed a direct correlation between the indoor comfort temperature and the outdoor one, leading to the formulation of Equation (1) as the base of the adaptive approach.
Tco = a × Text,ref + b
where
  • Tco = the indoor comfort operative temperature (°C);
  • Text,ref = the outdoor reference temperature (°C);
  • a = the slope of the function;
  • b = the y-intercept of the function (°C).
In recent decades, several specific formulations of the adaptive equation have been developed [31] according to the results of different studies and the purpose of the equations. Formulations differ based on equation formulation (a and b values); outdoor reference temperature determination; acceptability range, indicating the allowable gap from the “ideal” comfort temperature; and equation applicability, which usually depends on the season and on the availability of air conditioning or cooling devices.
Even though adaptive comfort formulations are also implemented in the current international standards EN 15251:2007 and ASHRAE 55:2017, both adaptive models can only be applied with a given outdoor temperature range. In the case of ASHRAE 55, the outdoor reference temperature must be above 10 °C and below 33.5 °C. The equation of the EN 15251 model can be used for a specific outdoor reference temperature for both the upper and lower limits. For the upper limit, the temperature must be above 10 °C and below 30 °C, while the lower limit must be between 15 and 30 °C. For these reasons, the use of these adaptive models in hot climates presents various complications.
Notwithstanding the above, Becker [32] found that people in warm climates prefer what they term a ‘‘slightly cool’’ environment, in contrast to the ‘‘slightly warm’’ preferences of people in cold climates. In South Portuguese secondary classrooms, Pereira et al. [33] found that students are prepared to accept indoor temperatures higher than 25.2 °C, as well as high CO2 levels, exceeding the limits set by the standards for both cases. Furthermore, even though some research considers adaptation actions by students to be limited (opening or closing windows, moving sun shading devices, adding or removing layers of clothing, etc. [34]), most of these confirm the relevance of the impact of user patterns on the energy performance in buildings [35,36] and the relevance of the user capacity of adaptation to indoor environments.
In Southern Spain, climate change aggravates heatwave scenarios, especially in the summer season. As recorded from 1 April to 25 June 2017 in Seville, outdoor temperatures were above 30 °C for 67% of the days, exceeding 40 °C (considered the minimum value for heatwave temperatures; with at least three consecutive days in which 10% of the weather stations recorded maximum temperatures over the 95% percentile of the daily maximum temperatures in July and August of 1971–2000) [37] for 16% of the days (Figure 1). For this reason, the thermal comfort analysis based on the Fanger [21] method established in ISO 7730:2005 was used in this study. Moreover, this method best reproduces the real metabolic rate and thermal resistance values in the case study, especially in winter and mid-season.
The main aim of this paper is to assess the impact of an egg-crate shading device, that is, one made of combined vertical and horizontal shading elements, on the IEQ for the retrofitting of an educational building, considering real user patterns. This type of device, among several other existing types [38,39], is particularly effective in regions with a hot climate as it produces highly efficient shading while allowing people to see outside [40].
The results presented in this paper complement the conclusions of previous research as part of the same case study conducted by the authors [41], where the influence of a low-cost egg-crate shading device made of methacrylate on the annual electricity consumption (kWh) of the classrooms was analyzed for three seasonal periods (winter, summer, and mid-season). Among the conclusions of the paper referenced, it should be highlighted that the use of these devices allows for significant savings in annual electricity consumption of the air-conditioning system (20%) and artificial lighting (50%), when compared to a classroom with no egg-crate shading devices.

2. Methodology

The methodology used in this paper is based on the in-situ monitoring of two classrooms in a school building in Seville (Southern Spain). An external egg-crate shading device was installed in one of the classrooms while the other was left in its original constructive configuration. The ambient and lighting variables recorded are air temperature, surface temperature of walls, aperture of windows, indoor and outdoor illuminance, rolling shutter aperture levels, and incident solar radiation on the window apertures. Monitoring was carried out during three distinct seasonal periods (winter, summer, and mid-season) under real user patterns, allowing for the simultaneous comparison of the performance of both classrooms under the same outdoor conditions.
A descriptive statistical analysis was conducted using the integrated development environment (IDE) of Matlab [42]. Unlike the earlier research [41], this paper focuses on the analysis of the influence of the egg-crate shading device on different ambient variables related to indoor comfort: incident solar radiation (W/m2), indoor operative temperature (°C) and indoor natural illuminance (lux). To assess the real impact of the device, different occupied and unoccupied periods were selected. In the unoccupied period, rolling shutters were totally open and windows fully closed. Thermal comfort in the occupied classrooms (% comfort hours and operative temperatures in °C) and indoor natural illuminance (lux) were analyzed. The aim was to assess the real influence of user patterns on two variables freely controlled by users: window aperture and rolling shutter aperture levels.
In order to facilitate comprehension, this research analysis (Section 4) is divided into several subsections. The first presents the impact of the egg-crate shading device on the solar radiation incident on the windows during the winter, summer, and mid-season periods selected. The second corresponds to the analysis carried out during the unoccupied period, where the real influence of the solar radiation on the indoor operative temperatures and indoor natural illuminance levels (rolling shutters totally open) was studied. The final subsection analyzes the egg-crate shading device from the IEQ perspective, considering occupied periods and taking the influence of users into account. Thermal comfort and natural illuminance results are reported.

2.1. Considerations for Thermal Environment Analysis

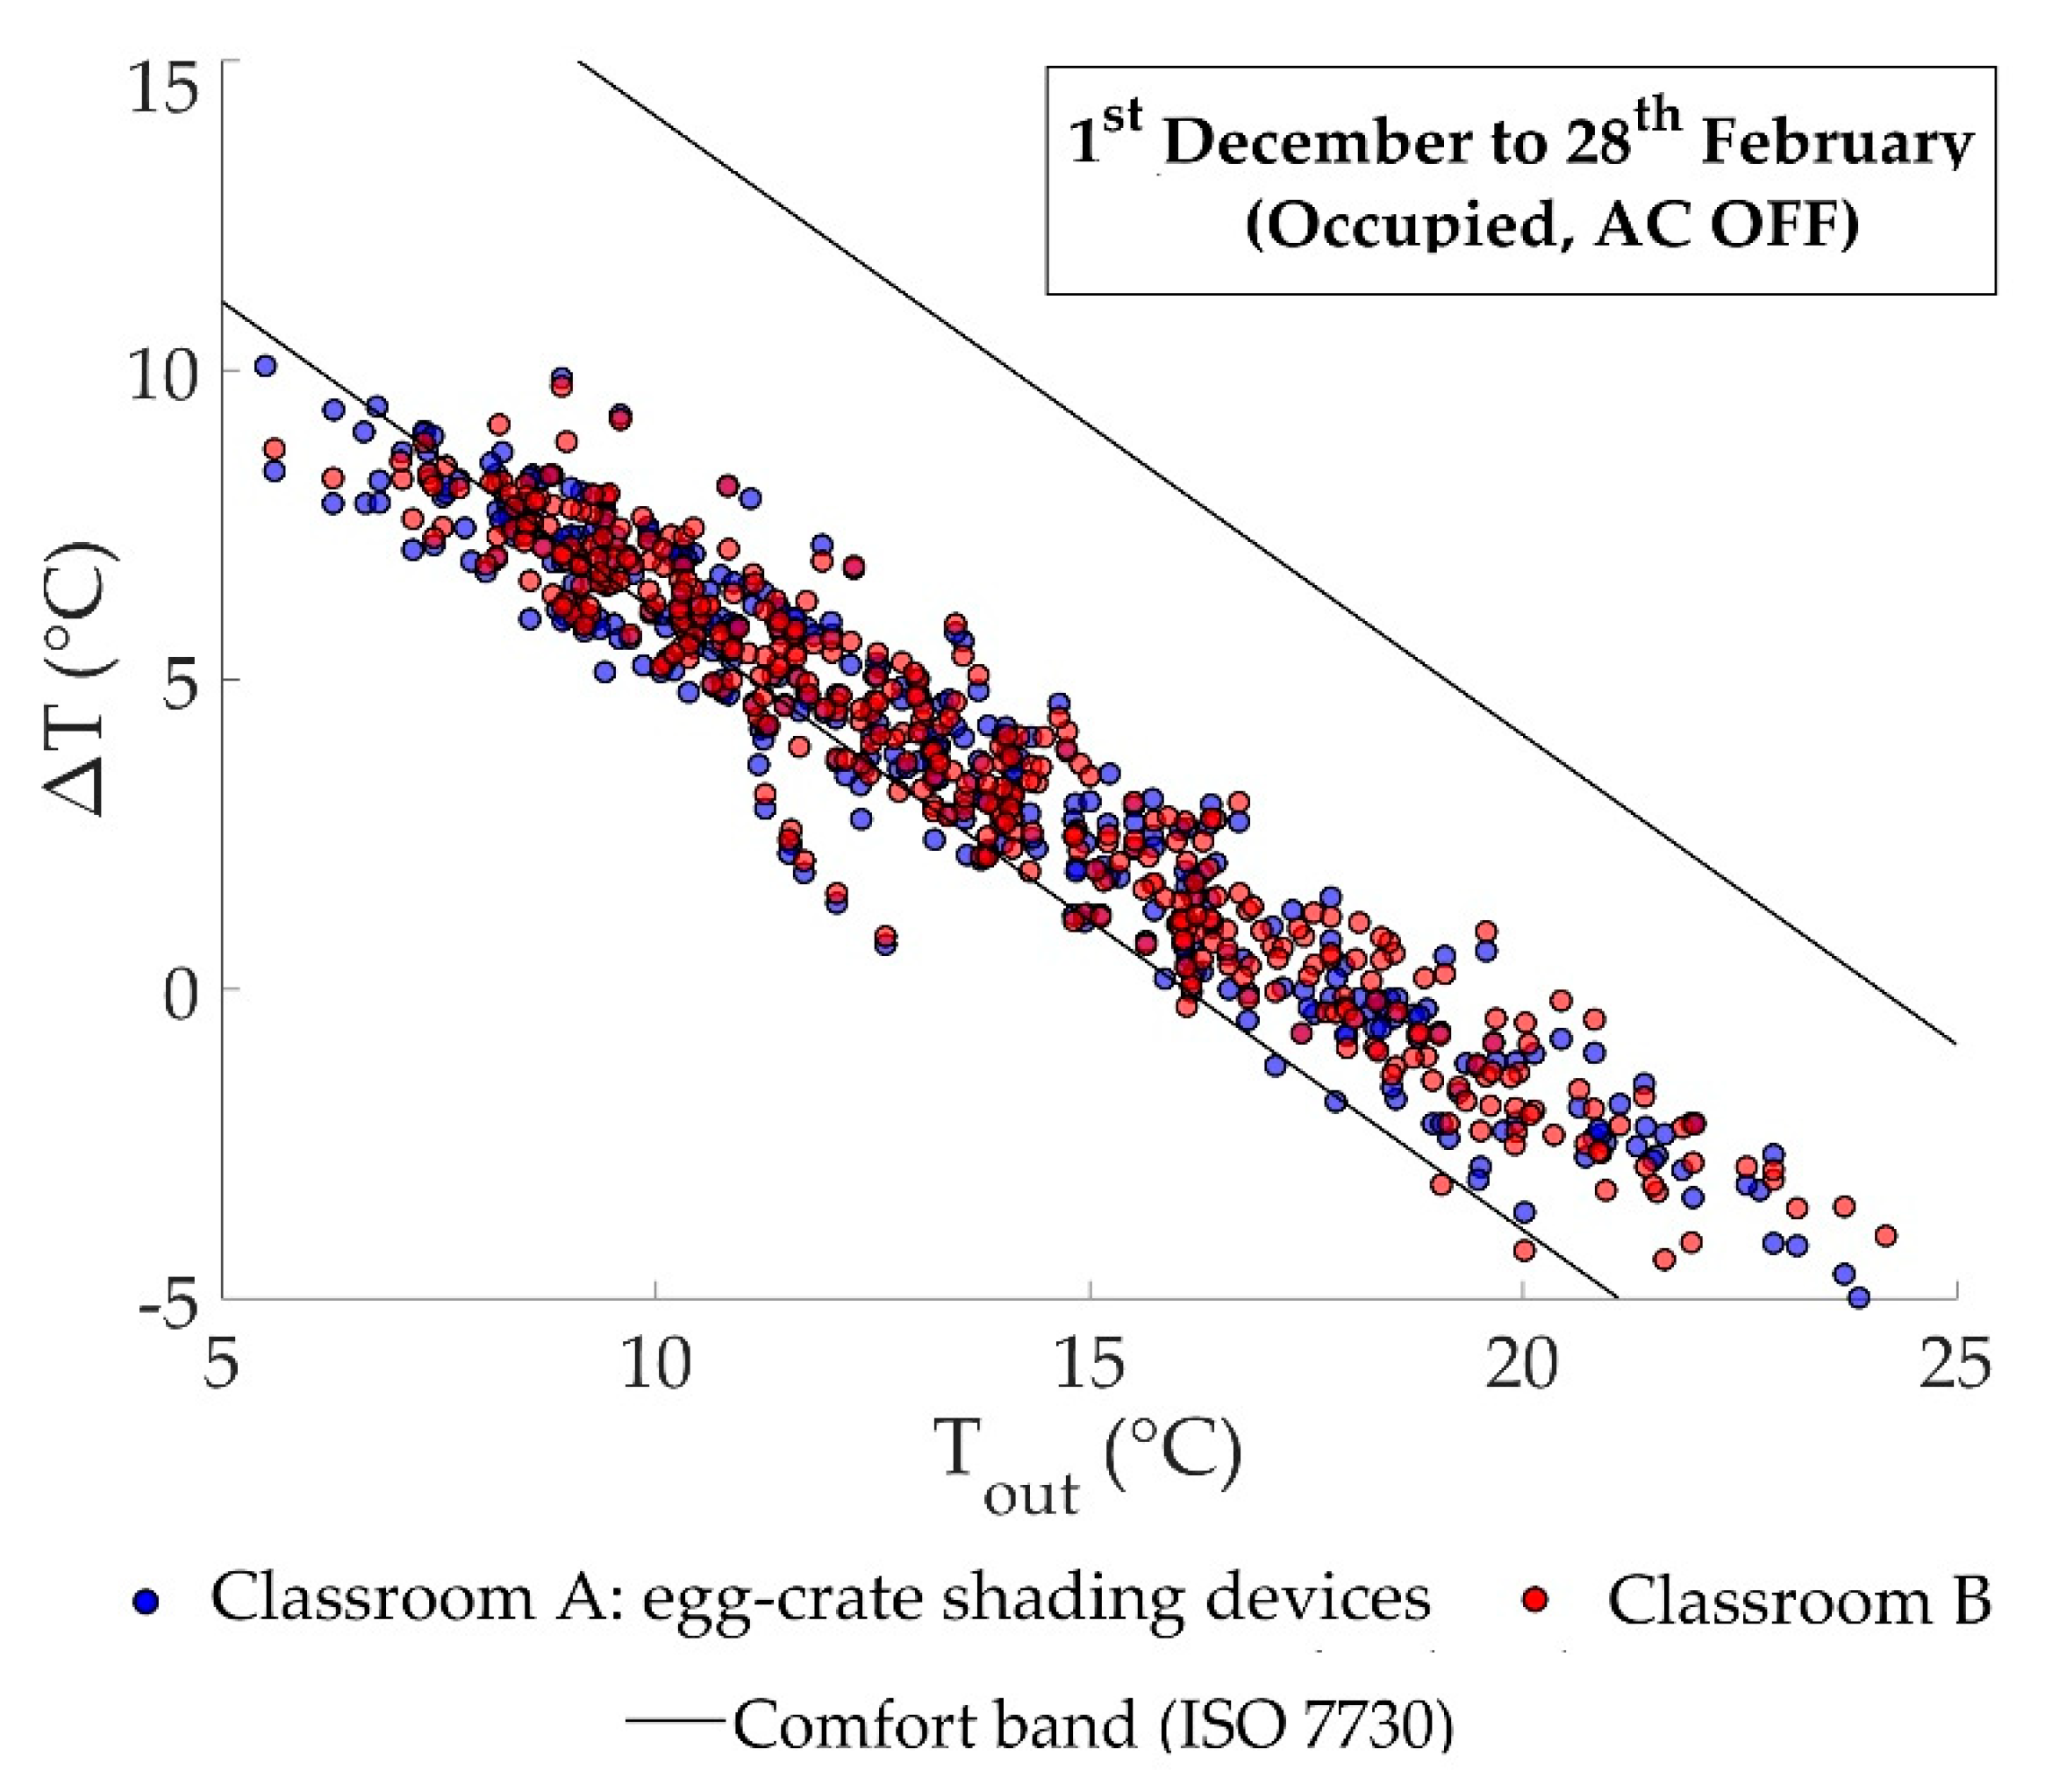
In order to determine the comfort band of the ISO 7730:2005 method, the parameters considered were an average relative humidity of 50%, an interior predicted percentage of dissatisfied (PPD) below 15%, a metabolic rate of 1.2 met, and a thermal resistance of 0.5 clo in summer and of 1.2 clo in winter and mid-season. Hence, the thermal comfort bands established were 16.1–24.1 °C for winter and mid-season and 22.8–26.8 °C for summer.

2.2. Considerations for the Daylight Environment Analysis

To guarantee adequate indoor lighting conditions, standard EN 12464-1:2012 [43] was used for the natural daylight environment analysis. This standard establishes minimum average illuminance values for the working surface to design the artificial lighting system, depending on the type of building. However, in this paper this standard is used to establish reference values for qualifying indoor lighting conditions in both classrooms. EN 12464-1:2012 recommends a minimum average illuminance level on the work surface in a classroom of between 300 (secondary school) and 500 lux (adult education). In addition, the Spanish safety code in place [44] establishes a minimum of 100 lux to facilitate circulation and the evacuation of indoor spaces.

3. Case Study

3.1. Case Study Description

In this research, a public educational building managed by the Andalusian government, Martínez Montañés Secondary School, was monitored. This building is located in Southern Spain, in a Mediterranean climate city (latitude 37.37° N and longitude −5.97° W). Two south-facing 6.95 × 6.85 m classrooms on the second floor of the building (Figure 2) were monitored.
Figure 2 also includes the position of the measurement devices described in Section 3.3.
Both classrooms preserved their original external shading protection, consisting of rolling shutters made of PVC plastic. Additionally, an external egg-crate shading device was installed in Classroom A (Figure 3). Classroom B maintained the conditions from the original construction, for use as reference in the analysis.
Each classroom has four window modules 2.40 m high by 1.40 m wide, facing south, with aluminum frames and a 4 mm single glazing (U = 5.70 W/m2·K, no thermal bridge). The window surface represents around 53% of the facade of each classroom. Each classroom has a capacity of 35 students and lessons take place both in the morning from 9:00 a.m. to 3:00 p.m. (secondary education) and in the evening from 5:00 p.m. to 8:00 p.m. (adult education).
In both classrooms, the air-conditioning consists of a direct expansion heat pump and two wall indoor units with an exterior inverter unit. Moreover, both classrooms include an artificial lighting system, with four luminaires with two 36 W fluorescent lamps each.

3.2. Shading Device Description

The solar protection system design is made of tongue-and-groove joint 3-mm-thick white methacrylate slats. The lattices are 1200 mm high, 800 mm wide, and 30 mm thick, forming small 43 × 43 mm lattices.
The egg-crate shading device was installed outside the window, 0.20 m away from the external facade line and 0.35 m from the glazing surface. An external auxiliary steel structure was assembled to create a 1640 × 2440 mm frame for the device.
This shading device was manufactured using a laser cutting machine in the Digital Fabrication Laboratory of the Higher Technical School of Architecture of the University of Seville (FabLab).

3.3. The Monitoring System

The monitoring system, installed according to EN ISO 7726:2011 [45], consisted of nine data loggers recording information at 10 min intervals. This information was stored and uploaded by mobile card every 30 min to a file transfer protocol (FTP) server.
Table 1 shows the technical characteristics of the sensors used for monitoring the classrooms.
There were two monitoring panels in each classroom, with two data loggers each (four data loggers per classroom). The first stored information related to the electric consumption of the artificial lighting system. The second data logger was connected to a presence detector (indoors), four sensors to measure the rolling shutter aperture levels, four sensors to record the aperture of the windows, and four lux meters (three indoors and one outdoors). It is important to stress that, as the presence detector only registered information about classroom occupancy (occupied or yes vs. unoccupied or no), there was no information on the real number of students occupying the classroom at any time. Indoor surface temperature sensors were incorporated into the third data logger, while the fourth integrated four air temperature sensors, all inside the classroom. This data logger also recorded information from the pyrgeometer (outdoors) and pyranometer (outdoors). The pyranometer was placed vertically, between the egg-crate shading device and the rolling shutters of the windows (Classroom A). In contrast, for Classroom B, the pyranometer was placed vertically on the unobstructed facade in order to measure the incident solar radiation.
There was also a third monitoring panel outside the classrooms, with the ninth data logger. This last data logger controlled the electricity consumption of the air-conditioning system (AC), recording information on power consumption (W), voltage (V), and electric current (A).
A local weather station, located in some test cells at a distance of 450 m [46], was also used to record outdoor air temperature. The characteristics of the sensors used in the weather station were units in °C, a range between −40 and +80, and an accuracy of ±0.15 ±0.1%. The thermometer was placed facing north to avoid direct solar radiation.

3.4. Monitoring Phases

Both classrooms were monitored for a whole year: from May 2017 to April 2018. This paper presents the results of the analysis of solar radiation levels (W/m2), indoor operative temperatures (°C), and their relation with thermal comfort and indoor natural illuminance levels (lux). Data were recorded in the classrooms during three representative seasonal periods: winter, summer, and mid-season. The periods considered for the protocol selection were those with 10% or less data lost. Moreover, the selection of the summer period also took into consideration the fact that the academic year ends in mid-June. The characteristics of the periods analyzed are shown in Table 2.
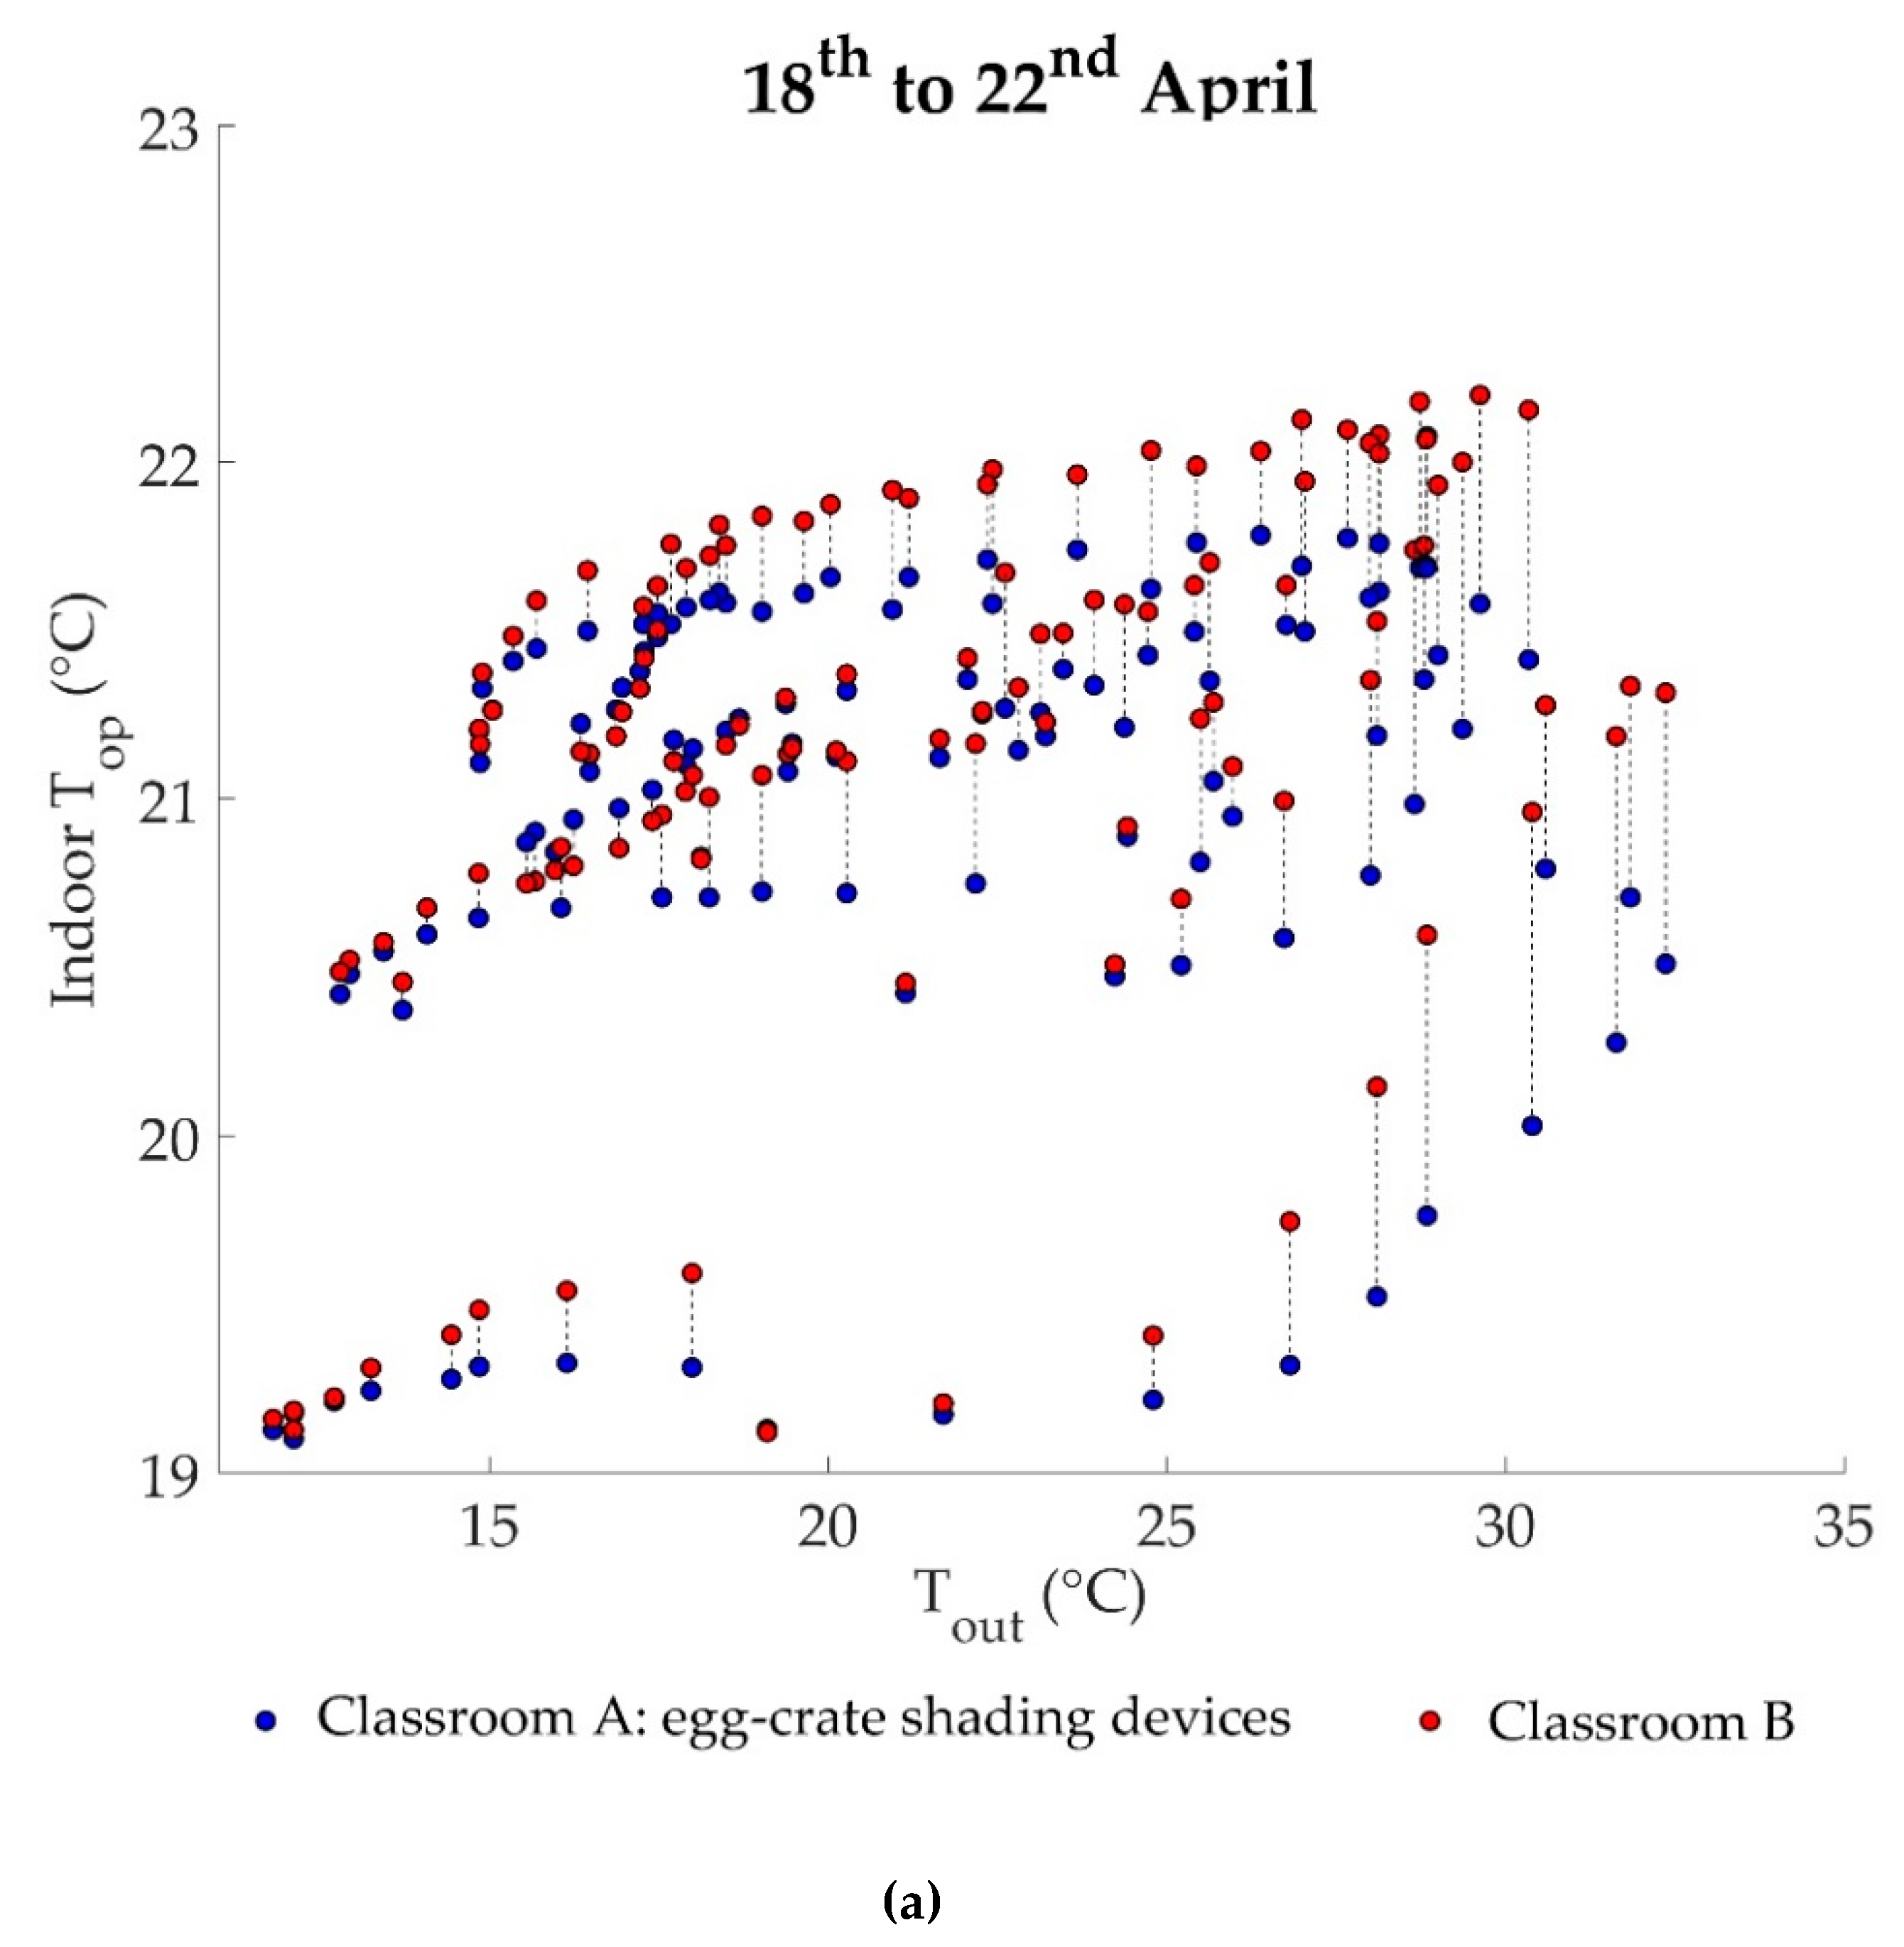
Additionally, an unoccupied period of 120 h (18–22 April) was selected for analysis to obtain objective results of the real performance of the egg-crate shading device without considering user influence. Specifically, the influence of solar radiation on the indoor operative temperatures (°C) and indoor natural illuminance (lux) was assessed, considering the rolling shutters to be fully open.

4. Analysis of Results

4.1. Impact of Egg-Crate Shading Device on Incident Solar Radiation Levels

This analysis was carried out during three different seasonal periods, shown in the previous table. The influence of the egg-crate shading device on the incident solar radiation (on the window) was assessed using two pyranometers. The first pyranometer measures direct solar radiation on the unobstructed windows, while the other sensor measures the reduction of solar radiation related to the egg-crate shading device. As these pyranometers are placed outside the shutters (Figure 3b), the rolling shutters have no influence on the measurements in either case. Thus, users do not influence the solar radiation measurements, and all hours (both occupied and unoccupied) can be analyzed. Given that the egg-crate shading device is a permanent system that cannot be operated by users, the results of this subsection are completely objective and unrelated to the user pattern. Moreover, this analysis also makes it possible to evaluate the effect of the egg-crate shading device on the use of the rolling shutters, which are controlled by the users.
Table 3 shows the percentages of hours in which a specific incident solar radiation range is registered, depending on the classroom and seasonal period analyzed. Values of solar radiation up to and over 200 W/m2 have been considered, since according to statistical analysis these values are representative of the greatest differences between the classrooms.
Moreover, the graphs of Figure 4, Figure 5 and Figure 6 represent solar radiation levels recorded in both classrooms: the color blue corresponds to the values of the classroom with egg-crate shading devices (Classroom A), while the values of the classroom with no egg-crate shading devices are indicated in red (Classroom B). For the sake of clarity, these figures only represent two weeks of each of the seasonal periods (as a sample), while a statistical analysis conducted considers all hours.
In winter (Figure 4), the implementation of an egg-crate shading device reduced incident solar radiation between 30 and 40% daily. The classroom with no egg-crate shading devices (Classroom B) recorded values above 200 W/m2 for 7.9% more hours. This led to an average rolling shutter aperture level below 25% during 89.9% of the hours. In contrast, users tended to keep the rolling shutters open at higher aperture levels (mostly up to 50%) in the classroom with egg-crate shading devices (Classroom A).
In summer (Figure 5) and mid-season (Figure 6), the reduction of the solar radiation incident on the window of the Classroom A was between 45 and 50%, when compared to the room with no egg-crate shading devices (Classroom B). In summer, Classroom A registered solar radiation levels below 200 W/m2 during all hours. This also occurred in this classroom in mid-season, but for 95.6% of the hours. In Classroom B (no egg-crate shading devices), values above 200 W/m2 were recorded for 21.5% (in summer) and 17.4% (in mid-season) of the hours. It should be borne in mind that incident solar radiation values were higher than those recorded in winter and mid-season, due to the latitude and Mediterranean climate of the case study.

4.2. Impact of Egg-Crate Shading Device on Indoor Operative Temperatures and Indoor Illuminance Levels (Unoccupied Period)

Analysis was carried out removing the factor of user influence on rolling shutters in order to determine the effect of the reduction of the solar radiation levels on operative temperatures (°C) and indoor illuminance (lux) and, ultimately, to assess the real impact of the egg-crate shading device on the ambient conditions of the classrooms.
Hence, a five-day period (120 h) in mid-season (18–22 April) was selected, meeting the following requirements: (1) the period was unoccupied (free-running conditions), (2) a constant aperture level of the rolling shutters was set at 100% (totally open for the whole period to avoid possible shading projection), and (3) windows were fully closed.
Figure 7a shows the average hourly values of outdoor temperature in relation to indoor operative temperatures of the unoccupied classrooms. Considering an outdoor temperature range of 11.8–32.7 °C, the difference between the operative temperatures of the classrooms is barely perceptible, with outdoor temperatures of up to 20 °C. The classroom with no egg-crate shading devices has a mean of 0.05 °C higher than that of the classroom with solar protections. This difference is more significant when outdoor temperatures are between 20 and 25 °C, with an average of 0.2 °C higher in the room with no egg-crate shading devices. When outdoor temperatures exceed 25 °C, the average difference is 0.50 °C. The maximum difference recorded during this period was 0.95 °C with an outdoor temperature of 32.4 °C.
Figure 7b shows a clear reduction in the incident solar radiation levels resulting from the installation of the egg-crate shading device. The temperature difference between classrooms corresponds to an average solar radiation difference of 1.10 W/m2 (with outdoor temperatures of up to 20 °C), 34.2 W/m2 (outdoor temperatures between 20 and 25 °C) and 188.4 W/m2 (outdoor temperatures over 25 °C). Maximum differences reached in these three cases are 74.6 W/m2, 265.2 W/m2, and 342.0 W/m2, respectively.
Figure 8 represents the average indoor natural illuminance levels measured in each classroom in relation to outdoor values. It should be emphasized that only outdoor values of 15 klux or higher were considered in order to analyze daily hours similar to clear sky conditions. The results obtained correspond to hourly average values, using the average indoor illuminance measurements of the three lux meters (at distances of 1.5, 3.5, and 5.5 m from the window). It can be seen that outdoor–indoor illuminance values present a statistically significant correlation with a confidence level of 95%, showing a clear direct tendency. The linear regression models used have an adequate adjustment, as the coefficient of determination (R2) is close to 1:0.97 in the classroom with egg-crate shading devices and 0.99 in the other classroom. In the equations, the variable X should be included in lux.
Table 4 shows indoor natural illuminance levels and the percentage of hours in which these values are recorded. In Classroom A (egg-crate shading devices), it can be observed that natural illuminance values lower that 300 lux were recorded for 4.1% fewer hours than in Classroom B. Meanwhile, the percentage of hours with natural illuminance between 300 and 500 lux is 4% higher in the classroom with egg-crate shading devices. However, both classrooms record illuminance values over 500 lux for a similar amount of hours.
Maximum illuminance value obtained with the egg-crate shading devices (Classroom A) was 2985 lux for a 1.5 m distance, 719 lux for a 3.5 m distance, and 510 lux for a 5.5 distance from the window, all recorded at 4:00 p.m. In Classroom B (no egg-crate shading devices), values obtained were 2575, 680, and 360 lux, respectively. Percentage differences of the global indoor natural illuminance levels during this period were 17.8% for the measurement closest to the window, 7.6% for the middle point, and 17.1% for the sensor furthest from the window (Figure 9). In the room with the egg-crate shading device, indoor illuminance was usually higher than in the room with no egg-crate during the unoccupied period analyzed. This is due to the fact that the shading protections are designed to diffuse visible radiation, increasing the values and uniformity of indoor natural illuminance levels.

4.3. Analysis of Indoor Environmental Quality (Occupied Period)

4.3.1. Thermal Comfort Analysis

Table 5 shows information of the users’ occupancy profiles in the classrooms. The table indicates, the percentages of hours in which the AC system is ON and OFF in the occupied classrooms, as well as the percentage of discomfort hours (according to ISO 7730:2005) when the classrooms are occupied in free-running conditions.
Results show that the percentages of occupancy in the classrooms are quite similar, especially in summer and winter. The percentage of occupied hours in free-running conditions in the room with egg-crate shading devices is lower than in Classroom B, with 5% and 6% fewer hours in winter and mid-season, respectively. In contrast, in the classroom with egg-crate shading devices, the air-conditioning (AC) system is active more frequently (10% more hours).
Figure 10, Figure 11 and Figure 12 represent a dispersion diagram of the indoor–outdoor temperature differences (ΔT) recorded in each classroom, depending on the outdoor temperature (Tout). The point cloud in each seasonal period corresponds to average hourly values registered in free-running conditions (when the AC system is OFF). The black lines indicate the upper and lower limits of the comfort band according to ISO 7730:2005, and no information is reported on the comfort in the classrooms during occupied hours with the AC system ON. This is because in these conditions the temperatures are controlled indoors, regardless of the effect of the egg-crate shading device.
A statistical analysis of the data indicated that higher percentages of comfort hours in free-running conditions were recorded in winter and mid-season. In these periods, there were fewer hours of discomfort in the classroom with egg-crate shading devices (5.6% less in winter and 0.9% less in mid-season). In contrast, there were 5% more comfort hours in the classroom without the egg-crate shading device in summer.

4.3.2. Natural Illuminance Analysis

Figure 13 shows average hourly indoor illuminance values in each classroom, in relation to outdoor illuminance. Cumulative distributions were used to represent the cumulative probability or statistical tendency of the data recorded when a certain variable changes. Daily hours with clear sky conditions were analyzed (minimum outdoor illuminance values of 15 klux). In order to compare natural illuminance levels in both classrooms in relation to the same outdoor illuminance, hours during which the artificial lighting system was simultaneously OFF in both rooms were considered. Indoor illuminance values were determined by the average of the measurements of the three lux meters (placed at distances of 1.5, 3.5, and 5.5 m from the window). For the sake of clarity, the Y axis in the graphs is represented in natural logarithmic scale.
In the three periods, the rolling shutter aperture was less than 50% open, during almost all the filtered hours for this analysis. In winter (Figure 13a), considering the same outdoor illuminance, the classroom with no egg-crate shading devices (Classroom B) tended to record higher indoor natural illuminance than Classroom A. This occurred mostly with outdoor illuminance up to 70 klux, a value from which Classroom A (egg-crate shading devices) usually registered slightly higher illuminance.
In summer (Figure 13b), the situation was reversed: indoor illuminance recorded in Classroom A (egg-crate shading devices) was higher than in Classroom B, regardless of outdoor illuminance.
Finally, mid-season (Figure 13c) was quite similar to winter: Classroom B (no egg-crate shading devices) tended to record higher indoor natural illuminance levels, and outdoor illuminance reached approximately 50 klux. Above this value, indoor illuminance was normally higher in the classroom with egg-crate shading devices.
In short, neither thermal comfort nor lighting results allowed for a clear or defining performance of the egg-crate shading device (Section 3.1) to be determined. This could be due to the users’ capability to freely operate the rolling shutters. The rolling shutter aperture level completely conditioned the results of both variables (indoor temperatures due to the effect of solar radiation and illuminance). For this reason, this analysis was completed with an evaluation of the rolling shutter aperture levels in the classrooms during the three periods (Table 6).
By analyzing rolling shutter aperture levels, it can be observed that users in Classroom B (no egg-crate shading devices) usually kept the aperture less than 25% open during 98.1% of the hours in summer. In comparison, there was a difference of 24.7% fewer hours in Classroom A (egg-crate shading devices), so the rolling shutters in this classroom were kept at higher aperture levels. These percentages explain the higher comfort hours in the classroom with no egg-crate shading devices (Classroom B), since the rolling shutters reduce solar radiation inside as they are normally open at low levels. This also explains why indoor illuminance levels are normally higher in the classroom with egg-crate shading devices (Classroom A).
A similar situation was observed in winter and mid-season periods. The aperture levels of the rolling shutters in the classroom with egg-crate shading devices (Classroom A) were normally higher compared with Classroom B. Once again, this led to lower solar radiation levels inside the classroom with no egg-crate shading devices (Classroom B), since rolling shutter aperture levels were usually low. This also had an impact on indoor natural illuminance, with higher levels in the classroom with egg-crate shading devices (Classroom A), especially when outdoor illuminance was higher than a specific value already mentioned above (when rolling shutters are normally more open than in the classroom without egg-crate shading devices).

5. Conclusions

In this paper, the use of an egg-crate shading device for retrofitting an educational building in Southern Spain was assessed, monitoring a classroom in real use conditions and comparing its performance with that of another monitored classroom without egg-crate shading devices and under the same outdoor conditions. Natural illuminance (lux) and indoor operative temperatures (°C) were evaluated during an unoccupied period. The influence of users on thermal comfort (% comfort hours) and indoor natural illuminance (lux) was also assessed during three occupied periods (winter, summer, and mid-season), during which solar radiation (W/m2) was also analyzed. The main conclusions of this research can be summarized as follows:
  • The use of an egg-crate shading device allows for a noticeable reduction of incident solar radiation, especially in summer and mid-season (around 45–50%). Even though this reduction is less significant in winter (30–40%), it is still quite remarkable.
  • During an unoccupied period in mid-season with rolling shutters totally open and windows fully closed, the following has been established:
    • The classroom with egg-crate shading devices recorded lower indoor operative temperatures than the classroom without these devices, considering outdoor temperatures above 25 °C. The temperature difference was slightly lower than 0.50 °C, and solar radiation was reduced by around 150 W/m2.
    • With the same outdoor illuminance, indoor natural illuminance in the classroom with egg-crate shading devices was higher. The largest variations between classrooms were measured closest to and furthest from the window (higher than 15%), with differences below 8% in the middle of the room. This is because the shading device designed acted as a visible solar radiation diffuser.
  • When the classroom was occupied, the solar radiation reduction related to the egg-crate shading device did not have a great influence on indoor temperatures. This is mainly due to two factors: (1) users could freely control the rolling shutter aperture levels, and (2) indoor thermal loads due to occupants were high (35 students per classroom). The percentage of thermal discomfort hours in summer was slightly higher in the classroom with egg-crate shading devices (5% more). This is because rolling shutters tended to be open at low aperture levels (less than 25%) for longer periods of time in the classroom with no egg-crate shading devices. This reduced solar radiation in the classroom and conditioned indoor temperatures. In winter and mid-season, the room with no egg-crate shading devices recorded fewer comfort hours.
  • Generally, the use of an egg-crate shading device allowed for higher rolling shutter aperture levels for longer periods, influencing indoor illuminance. In summer, illuminance levels were also higher with rolling shutters open at higher levels in the classroom with egg-crate shading devices. In the remaining periods, the classroom with no egg-crate shading devices registered higher illuminance outdoor values of up to 50 (mid-season) and 70 klux (winter). Above these values, illuminance was higher in the classroom with egg-crate shading devices, since rolling shutter aperture was also higher.
As future research, the authors are currently working on the construction of a predictive model based on the egg-crate shading device designed and the data monitored in order to assess different geometrical conditions (size of the device and cells, distance from the window, etc.) for different orientations and latitudes. The final objective will be to obtain an optimized design solution for this type of external shading devices.

Author Contributions

Á.L.L.-R. and R.S. conceived and designed the experiments; all authors performed the experiments and analyzed the data; all authors have written, reviewed, and approved the final manuscript.

Funding

This research was funded by the Ministry of Economy and Competitiveness of the Spanish Government and the European Regional Development Fund through the research and development projects “Energy Rehabilitation of Tertiary Buildings in Mediterranean Climate by Optimizing Solar Protection Systems” (ref BIA2014-53949-R) and “Parametric Optimization of Double Skin Facades in the Mediterranean Climate to Improve Energy Efficiency Uncer Climate Change Scenarios” (ref BIA2017-86383-R). C.M.C.-G. wishes to acknowledge the financial support provided by the FPU Program of the Spanish Ministry of Education, Culture and Sport (FPU17/01375).

Conflicts of Interest

The authors declare no conflict of interest. The founding sponsors had no role in the design of the study; in the collection, analyses, or interpretation of data; in the writing of the manuscript; or in the decision to publish the results.

References

  1. Erhorn, H.; Mroz, T.; Mørck, O.; Schmidt, F.; Schoff, L.; Thomsen, K.E. The Energy Concept Adviser—A tool to improve energy efficiency in educational buildings. Energy Build. 2008, 40, 419–428. [Google Scholar] [CrossRef]
  2. Buratti, C.; Ricciardi, P. Adaptive analysis of thermal comfort in university classrooms: Correlation between experimental data and mathematical models. Build. Environ. 2009, 44, 674–687. [Google Scholar] [CrossRef]
  3. Corgnati, S.P.; Ansaldi, R.; Filippi, M. Thermal comfort in Italian classrooms under free running conditions during mid seasons: Assessment through objective and subjective approaches. Build. Environ. 2009, 44, 785–792. [Google Scholar] [CrossRef]
  4. Yang, B.; Olofsson, T.; Wang, F.; Lu, W. Thermal comfort in primary school classrooms: A case study under subarctic climate area of Sweden. Build. Environ. 2018, 135, 237–245. [Google Scholar] [CrossRef]
  5. Abdallah, A.S.H. Analysis of Thermal Comfort and Energy Consumption in Long Time Large Educational Halls (Studios), Assiut University, Egypt. Procedia Eng. 2015, 121, 1674–1681. [Google Scholar] [CrossRef] [Green Version]
  6. Martinez-Molina, A.; Boarin, P.; Tort-Ausina, I.; Vivancos, J.L. Post-occupancy evaluation of a historic primary school in Spain: Comparing PMV, TSV and PD for teachers’ and pupils’ thermal comfort. Build. Environ. 2017, 117, 248–259. [Google Scholar] [CrossRef]
  7. Boerstra, A.; van Dijken, F. Indoor environment and energy efficiency of schools. REHVA J. 2010, 19, 34–38. [Google Scholar]
  8. Ricciardi, P.; Buratti, C. Environmental quality of university classrooms: Subjective and objective evaluation of the thermal, acoustic, and lighting comfort conditions. Build. Environ. 2018, 127, 23–36. [Google Scholar] [CrossRef]
  9. Leccese, F.; Salvadori, G.; Rocca, M. Visual discomfort among university students who use CAD workstations. Work 2016, 55, 171–180. [Google Scholar] [CrossRef] [PubMed]
  10. Leccese, F.; Rocca, M.; Salvadori, G. Fast estimation of Speech Transmission Index using the Reverberation Time: Comparison between predictive equations for educational rooms of different sizes. Appl. Acoust. 2018, 140, 143–149. [Google Scholar] [CrossRef]
  11. Griffiths, M.; Eftekhari, M. Control of CO2 in a naturally ventilated classroom. Energy Build. 2008, 40, 556–560. [Google Scholar] [CrossRef]
  12. Santamouris, M.; Synnefa, A.; Asssimakopoulos, M.A.; Livada, I.; Pavlou, K.; Papaglastra, M.; Gaitania, N.; Kolokotsa, D.; Assimakopoulos, V. Experimental investigation of the air flow and indoor carbon dioxide concentration in classrooms with intermittent natural ventilation. Energy Build. 2008, 40, 1833–1843. [Google Scholar] [CrossRef]
  13. Gennaro, G.; Dambruoso, P.R.; Loiotile, A.D.; Di Gilio, A.; Giungato, P.; Tutino, M.; Marzocca, A.; Mazzone, A.; Palmisani, J.; Porcelli, F. Indoor air quality in schools. Environ. Chem. Lett. 2014, 12, 467–482. [Google Scholar] [CrossRef]
  14. Hou, Y.; Liu, J.; Li, J. Investigation of indoor air quality in primary school classrooms. Procedia Eng. 2015, 121, 830–837. [Google Scholar] [CrossRef]
  15. Mihai, T.; Iordache, V. Determining the indoor environment quality for an educational building. Energy Procedia 2016, 85, 566–574. [Google Scholar] [CrossRef]
  16. Wargocki, P.; Wyon, D.P. Providing better thermal and air quality conditions in school classrooms would be cost-effective. Build. Environ. 2013, 59, 581–589. [Google Scholar] [CrossRef]
  17. De Giuli, V.; Zecchin, R.; Corain, L.; Salmaso, L. Measured and perceived environmental comfort: Field monitoring in an Italian school. Appl. Ergon. 2014, 45, 1035–1047. [Google Scholar] [CrossRef] [PubMed]
  18. Shendell, D.G.; Prill, R.; Fisk, W.J.; Apte, M.G.; Blake, D.; Faulkner, D. Associations between classroom CO2 concentrations and student attendance in Washington and Idaho. Indoor Air 2004, 14, 333–341. [Google Scholar] [CrossRef]
  19. Kim, J.; de Dear, R. Nonlinear relationships between individual IEQ factors and overall workspace satisfaction. Build. Environ. 2012, 49, 33–44. [Google Scholar] [CrossRef]
  20. Barrett, P.; Zhang, Y.; Moffat, J.; Kobbacy, K. A holistic, multi-level analysis identifying the impact of classroom design on pupils’ learning. Build. Environ. 2013, 59, 678–689. [Google Scholar] [CrossRef]
  21. Fanger, P.O. Thermal Comfort: Analysis and Applications in Environmental Engineering; Danish Technical Press: Copenhagen, Denmark, 1970. [Google Scholar]
  22. International Organization for Standardization. ISO 7730:2005 (E). Ergonomics of the Thermal Environment—Analytical Determination and Interpretation of Thermal Comfort Using Calculation of the PMV and PPD Indices and Local Thermal Comfort Criteria; ISO: Geneva, Switzerland, 2005. [Google Scholar]
  23. American Society of Heating, Refrigerating and Air Conditioning Engineers. ANSI/ASHRAE 55-2004: Thermal Environmental Conditions for Human Occupancy; ASHRAE: Atlanta, GA, USA, 2004. [Google Scholar]
  24. European Committee for Standardization. CEN 15251:2007. Indoor Environmental Input Parameters for Design and Assessment of Energy Performance of Buildings-Addressing Indoor Air Quality, Thermal Environment, Lighting and Acoustics; European Committee for Standardization: Brussels, Belgium, 2007. [Google Scholar]
  25. European Committee for Standardization. CEN/TC 156. prEN 16798-1:2015. Energy Performance of Buildings—Part 1: Indoor Environmental Input Parameters for Design and Assessment of Energy Performance of Buildings Addressing Indoor Air Quality, Thermal Environment, Lighting and Acoustics—Module M1–6; European Committee for Standardization: Brussels, Belgium, 2015. [Google Scholar]
  26. American Society of Heating, Refrigerating and Air Conditioning Engineers. ANSI/ASHRAE 55-2017: Thermal Environmental Conditions for Human Occupancy; ASHRAE: Atlanta, GA, USA, 2017. [Google Scholar]
  27. Humphreys, M.A. Field studies of thermal comfort compared and applied. Build. Serv. Eng. 1976, 44, 5–27. [Google Scholar]
  28. Brager, G.S.; de Dear, R.J. Thermal adaptation in the built environment: A literature review. Energy Build. 1998, 27, 83–96. [Google Scholar] [CrossRef]
  29. Humphreys, M.A. Thermal comfort temperature worldwide—The current position. Renew. Energy 1996, 8, 139–144. [Google Scholar] [CrossRef]
  30. Humphreys, M.; Nicol, F.; Roaf, S.; Sykes, O. Standards for Thermal Comfort: Indoor Air Temperature Standards for the 21st Century; Chapman & Hall: London, UK, 1995. [Google Scholar]
  31. Ferrari, S.; Zanotto, V. Adaptive comfort: Analysis and application of the main indices. Build. Environ. 2012, 49, 25–32. [Google Scholar] [CrossRef]
  32. Becker, R.; Goldberger, I.; Paciuk, M. Improving energy performance of school buildings while ensuring indoor air quality ventilation. Build. Environ. 2007, 42, 3261–3276. [Google Scholar] [CrossRef]
  33. Dias Pereira, L.; Raimondo, D.; Paolo Corgnati, S.; Gameiro da Silva, M. Assessment of indoor air quality and thermal comfort in Portuguese secondary classrooms: Methodology and results. Build. Environ. 2014, 81, 69–80. [Google Scholar] [CrossRef] [Green Version]
  34. Brager, G.S.; Palianga, G.; de Dear, R.J. Operable windows, personal control and occupant comfort. ASHRAE Trans. 2004, 110, 17–35. [Google Scholar]
  35. Zeiler, W.; Vissers, D.; Maaijen, R.; Boxem, G. Occupants’ behavioural impact on energy consumption: Human-in-the-loop comfort process control. Archit. Eng. Design Manag. 2014, 10, 108–130. [Google Scholar] [CrossRef]
  36. Fabi, V.; Vinther, R.; Corgnati, S.; Olesen, B.W. Occupants’ window opening behaviour: A literature review of factors influencing occupant behaviour and models. Build. Environ. 2012, 58, 188–198. [Google Scholar] [CrossRef]
  37. Spanish Meteorological Station (Agencia Estatal de Meteorología). Heatwaves in Spain since 1975 (Olas de calor en España desde 1975). Available online: http://www.aemet.es/es/conocermas/recursos_en_linea/publicaciones_y_estudios/estudios/detalles/olascalor (accessed on 29 October 2018).
  38. Carletti, C.; Sciurpi, F.; Pierangioli, L. The energy upgrading of existing buildings: Window and shading device typologies for energy efficiency refurbishment. Sustainability 2014, 6, 5354–5377. [Google Scholar] [CrossRef]
  39. Kwon, C.; Lee, K. Integrated Daylighting Design by Combining Passive Method with DaySim in a Classroom. Energies 2018, 11, 3168. [Google Scholar] [CrossRef]
  40. Freewan, A.A.Y. Impact of external shading devices on thermal and daylighting performance of offices in hot climate regions. Sol. Energy 2014, 102, 14–30. [Google Scholar] [CrossRef]
  41. Calama-González, C.M.; Suárez, R.; León-Rodríguez, Á.L. Thermal and Lighting Consumption Savings in Classrooms Retrofitted with Shading Devices in a Hot Climate. Energies 2018, 11, 2790. [Google Scholar] [CrossRef]
  42. The Mathworks Inc. Matlab R2017a Software, The Mathworks Inc.: Natick, MA, USA, 2017.
  43. European Committee for Standardization. EN 12464-1:2012. Light and Lighting. Lighting of Work Places: Part 1: Indoor Work Places; European Committee for Standardization: Brussels, Belgium, 2011. [Google Scholar]
  44. Spanish Government. Spanish Technical Building Code. Basic Document: Safety in Use and Accessibility (Código Técnico de la Edificación. Documento Básico: Seguridad de Utilización y Accesibilidad); Spanish Government: Madrid, Spain, 2010.
  45. International Organization for Standardization. ISO 7726:2002 (E). Ergonomics of the Thermal Environment—Instruments for Measuring Physical Quantities; ISO: Geneva, Switzerland, 2002. [Google Scholar]
  46. Calama-González, C.M.; Suárez, R.; León-Rodríguez, Á.L.; Domínguez-Amarillo, S. Evaluation of Thermal Comfort Conditions in Retrofitted Facades Using Test Cells and Considering Overheating Scenarios in a Mediterranean Climate. Energies 2018, 11, 788. [Google Scholar] [CrossRef]
Figure 1. Outdoor temperatures recorded from 1 April to 25 June 2017 in Seville.
Sustainability 11 01078 g001
Figure 2. Floor plan of the classrooms monitored and the position of the sensors.
Sustainability 11 01078 g002
Figure 3. (a) Monitored classroom with shading devices (Room A); (b) cross section of the window and position of pyranometers; (c) detailed photograph of the egg-crate shading device installed.
Sustainability 11 01078 g003
Figure 4. Incident solar radiation levels of the classrooms during two weeks in winter.
Sustainability 11 01078 g004
Figure 5. Incident solar radiation levels of the classrooms during two weeks in summer.
Sustainability 11 01078 g005
Figure 6. Incident solar radiation levels of the classrooms during two weeks in mid-season.
Sustainability 11 01078 g006
Figure 7. Unoccupied period, with blinds fully open, and windows closed: (a) indoor operative temperatures and (b) solar radiation levels (measured between the egg-crate shading device and the blinds in Classroom A and on the unobstructed facade in Classroom B), both in relation to outdoor temperatures.
Sustainability 11 01078 g007aSustainability 11 01078 g007b
Figure 8. Natural indoor and outdoor illuminance values during the unoccupied period, with blinds fully open and windows closed.
Sustainability 11 01078 g008
Figure 9. Natural indoor illuminance during a representative unoccupied day (blinds fully open and windows closed) in mid-season (19 April) according to the distance from the egg-crate devices.
Sustainability 11 01078 g009
Figure 10. Hourly measurements of indoor–outdoor temperature difference (ΔT) in relation to outdoor temperature (Tout) recorded in each classroom in free-running conditions during winter.
Sustainability 11 01078 g010
Figure 11. Hourly measurements of indoor–outdoor temperature difference (ΔT) in relation to outdoor temperature (Tout) recorded in each classroom in free-running conditions during summer.
Sustainability 11 01078 g011
Figure 12. Hourly measurements of indoor–outdoor temperature difference (ΔT) in relation to outdoor temperature (Tout) recorded in each classroom in free-running conditions during mid-season.
Sustainability 11 01078 g012
Figure 13. Cumulative distributions of hourly measurements of outdoor and indoor illuminance of each classroom in free-running conditions: (a) winter; (b) summer; (c) mid-season.
Sustainability 11 01078 g013
Table 1. Probes in the rooms monitored.
Device#Per class (Total)LocationUnitRangeAccuracy
Thermocouple6 (12)Walls and ceiling°C−30, +350±1, ±0.75%
Thermometer4 (8)Interior matrix°C−40, +80±0.2 °C (0–40 °C) ±0.2 °C (40–80 °C)
Lux meter4 (8)Indoor and outdoorlux0–200,000±4.0%
Presence detector2 (4)North wallsY/N4–15 m-
Window opening control4 (8)WindowsY/N--
Blind level sensor4 (8)Blindsmm200–8000±25 mm
Pyranometer1 (2)OutdoorW/m20–4000±2.0%
Pyrgeometer1OutdoorW/m2−300, +100±3.0% (−10, +40 °C)
Voltmeter1 (2)Electrical panelV--
Ammeter1 (2)Electrical panelA--
Potentiometer1 (2)Electrical panelW--
Energy1 (2)Electrical panelkWh--
Table 2. Characteristics of periods analyzed.
PeriodsDescriptionTout (°C)Hours AnalyzedOccupied Hours
Winter1 December–28 February1.9–26.22160897/964
Summer1 May–23 June9.4–46.41296328/335
Mid-season1 March–30 April5.2–36.51464336/429
Note: Occupied hours shown refer to Classroom A/Classroom B.
Table 3. Percentages of hours with a specific range of solar radiation range.
VariablesClassroom A (Egg-Crate Shading Devices)Classroom B
WinterSummerMid SeasonWinterSummerMid Season
% of hours with a certain level of incident solar radiation ≤200 W/m2 82.6100.095.674.778.578.2
>200 W/m2 17.40.04.425.321.521.8
Table 4. Percentage of hours with a specific indoor natural illuminance range during the unoccupied period, with blinds fully open and windows closed.
Classroom A (Egg-Crate Shading Devices)Classroom B
VariablesUnoccupied (Blinds 100% Open)
% of hours with a certain level of illuminance≤300 lux67.571.6
300 < lux ≤ 5008.34.3
>500 lux 24.224.1
Table 5. Statistical data of the use profile of the classrooms and assessment of discomfort hours.
Variables% Hours
Classroom A (Egg-Crate Shading Devices)Classroom B
WinterSummerMid SeasonWinterSummerMid Season
Unoccupied 157.974.367.555.474.274.0
Occupied Total occupied 142.125.732.544.625.826.0
With AC OFF 2 62.660.486.767.850.092.0
Discomfort when AC OFF 3 20.825.91.826.420.42.7
With AC ON 2 37.439.613.332.250.08.0
Notes: 1 adding up to 100% analyzed hours in total. 2 adding up to 100% occupied hours in total. 3 a percentage of the total occupied with AC OFF hours.
Table 6. Rolling shutter aperture level recorded during the periods analyzed in both rooms.
VariablesClassroom A (Egg-Crate Shading Devices)Classroom B
WinterSummerMid SeasonWinterSummerMid Season
% of hours with rolling shutters open at a certain levelShutters ≤ 25% 33.573.434.989.998.141.3
25% < Shutters ≤ 50%55.920.432.17.21.237.9
50% < Shutters ≤ 75%10.25.519.32.90.79.7
Shutters > 75%0.40.713.70.00.011.1
Note: Blind level of 100% means that blinds are fully open.

