Contingent Factors and Sustainable Performance Measurement (SPM) Practices of Malaysian Electronics and Electrical Companies


1
Department of Accounting and Finance, Faculty of Economics and Management, University Putra Malaysia, 43300 Serdang, Selangor, Malaysia
2
Faculty of Management, Multimedia University, 63100 Cyberjaya, Selangor, Malaysia
3
Faculty of Business and Finance, Universiti Tunku Abdul Rahman, 31900 Kampar, Ipoh, Malaysia
*
Author to whom correspondence should be addressed.
Sustainability 2019, 11(4), 1058; https://doi.org/10.3390/su11041058
Submission received: 6 December 2018
/
Revised: 16 January 2019
/
Accepted: 18 January 2019
/
Published: 18 February 2019
Abstract
:In the present world, there is a rapidly growing level of awareness of social and environmental activities. Consequently, a company’s profile is not substantiated purely in relation to financial issues, rather, a need for the inclusion of environmental and social perspectives arises. This is known as sustainable performance. Hence, there is a persistent need for the practice of sustainable performance measurements (SPMs). However, despite the implementation of sustainable performance in developed climes like Europe, the US and the UK, the relevance of sustainable performance is still at a low in developing societies such as Malaysia. The main purpose of this paper is to determine the critical success factors that are attributable to sustainable performance measurement practices for Malaysian electronics and electrical (E and E) companies, as their success is subject to intense scrutiny from their developed competitors, with respect to compliance with social and environmental regulations. A self-administered questionnaire survey was conducted on 217 E and E companies. The path analysis and test of the hypotheses were carried out through structural equation modelling. This study has successfully unveiled a comprehensive SPM model with unprecedented scope, stretching from factors to indicators of a SPM model for Malaysian E and E companies. The findings indicate that pressure from stakeholders and globalization are the driving forces for E and E companies to be more proactive in sustainable practices. In this context, stakeholders, especially policy makers, should play the leading political and social roles in encouraging the adoption of SPMs in developing nations. It must be noted that E and E companies are likely to transform their learning culture and technology in terms of working towards sustainable practices once they have realized the financial benefits of adopting SPMs. With these benefits, a compounding effect due to SPMs will be created among E and E companies, where excellent performance can be achieved continuously. A major limitation of this study is the adoption of the contingency theory, which is yet to have a wide application in this area of study. Meanwhile, future research can be longitudinal in nature in addition to focusing on non-profit organizations.
1. Introduction
Sustainable performance has been gaining attention throughout recent years. In a local context, a controversial project by Lynas—the rare-earth processing plant in Pahang, Malaysia, was allowed to commence after the company complied with all of the harsh environmental and social suggestions put forward by the review panel independently constituted by the International Atomic Energy Agency (IAEA) [1]. In fact, the construction of the Pahang rare-earth plant lead to the biggest ever environmental demonstration against the Australian-based Lynas Plc Ltd. Internationally, according to [2], the Australian government will impose an environmental tax amounting to 23 AUD (69 RM) per metric ton on 500 companies in Australia which have most contributed to pollution from mid-2012. Eventually, on 19 March 2012, Australia’s Senate created a 30% tax on iron ore and coal mine profits after a harrowing two-year encounter with mining companies. This alteration of the tax laws dealt a blow to about 30 companies, including global miners BHP Billiton, Rio Tinto and Xstrata, and was in effect from 1 July 2012 [3].
With this development comes a surge in awareness for social and environmental responsibilities on the part of regulators in both the local and international scenes. Companies are bound to uphold their environmental and social responsibilities, or else they may suffer from massive financial loss if they fail to comply with the environmental and social requirements. For instance, companies may be fined or taxed heavily, or they might be encouraged to terminate business operations. No doubt, the requirements for reporting key indicators of social and environmental effects in published annual reports are likely to increase in the future. A companies’ financial achievements are no longer the most important in terms of evaluation, rather, there is now the inclusion of social and environmental perspectives, presently tagged as sustainable performance. Therefore, the question of how to determine the peculiar contingency factors that influence the sustainable performance measurements of companies in Malaysia arises, especially for E and E companies, as compared to what was obtained in the literature. On the other hand, the extent of influence of SPMs may also have to be ascertained in order to provide guidance for policy makers and contribute to the existing literature in this important area of study.
The business objectives of companies with sustainability perspectives now extend further than the conventional sphere. Hence, their latter objectives are no longer limited to traditional aims such as operational and financial superiority, instead they are also entrenched with social and environmental initiatives [4]. According to the Dow Jones Sustainability Indices, corporate sustainability is “a business approach that creates long-term shareholder value by embracing opportunities and nagging risks deriving from economic, environmental and social developments” [5].
1.1. Development of Performance Measurement Practices
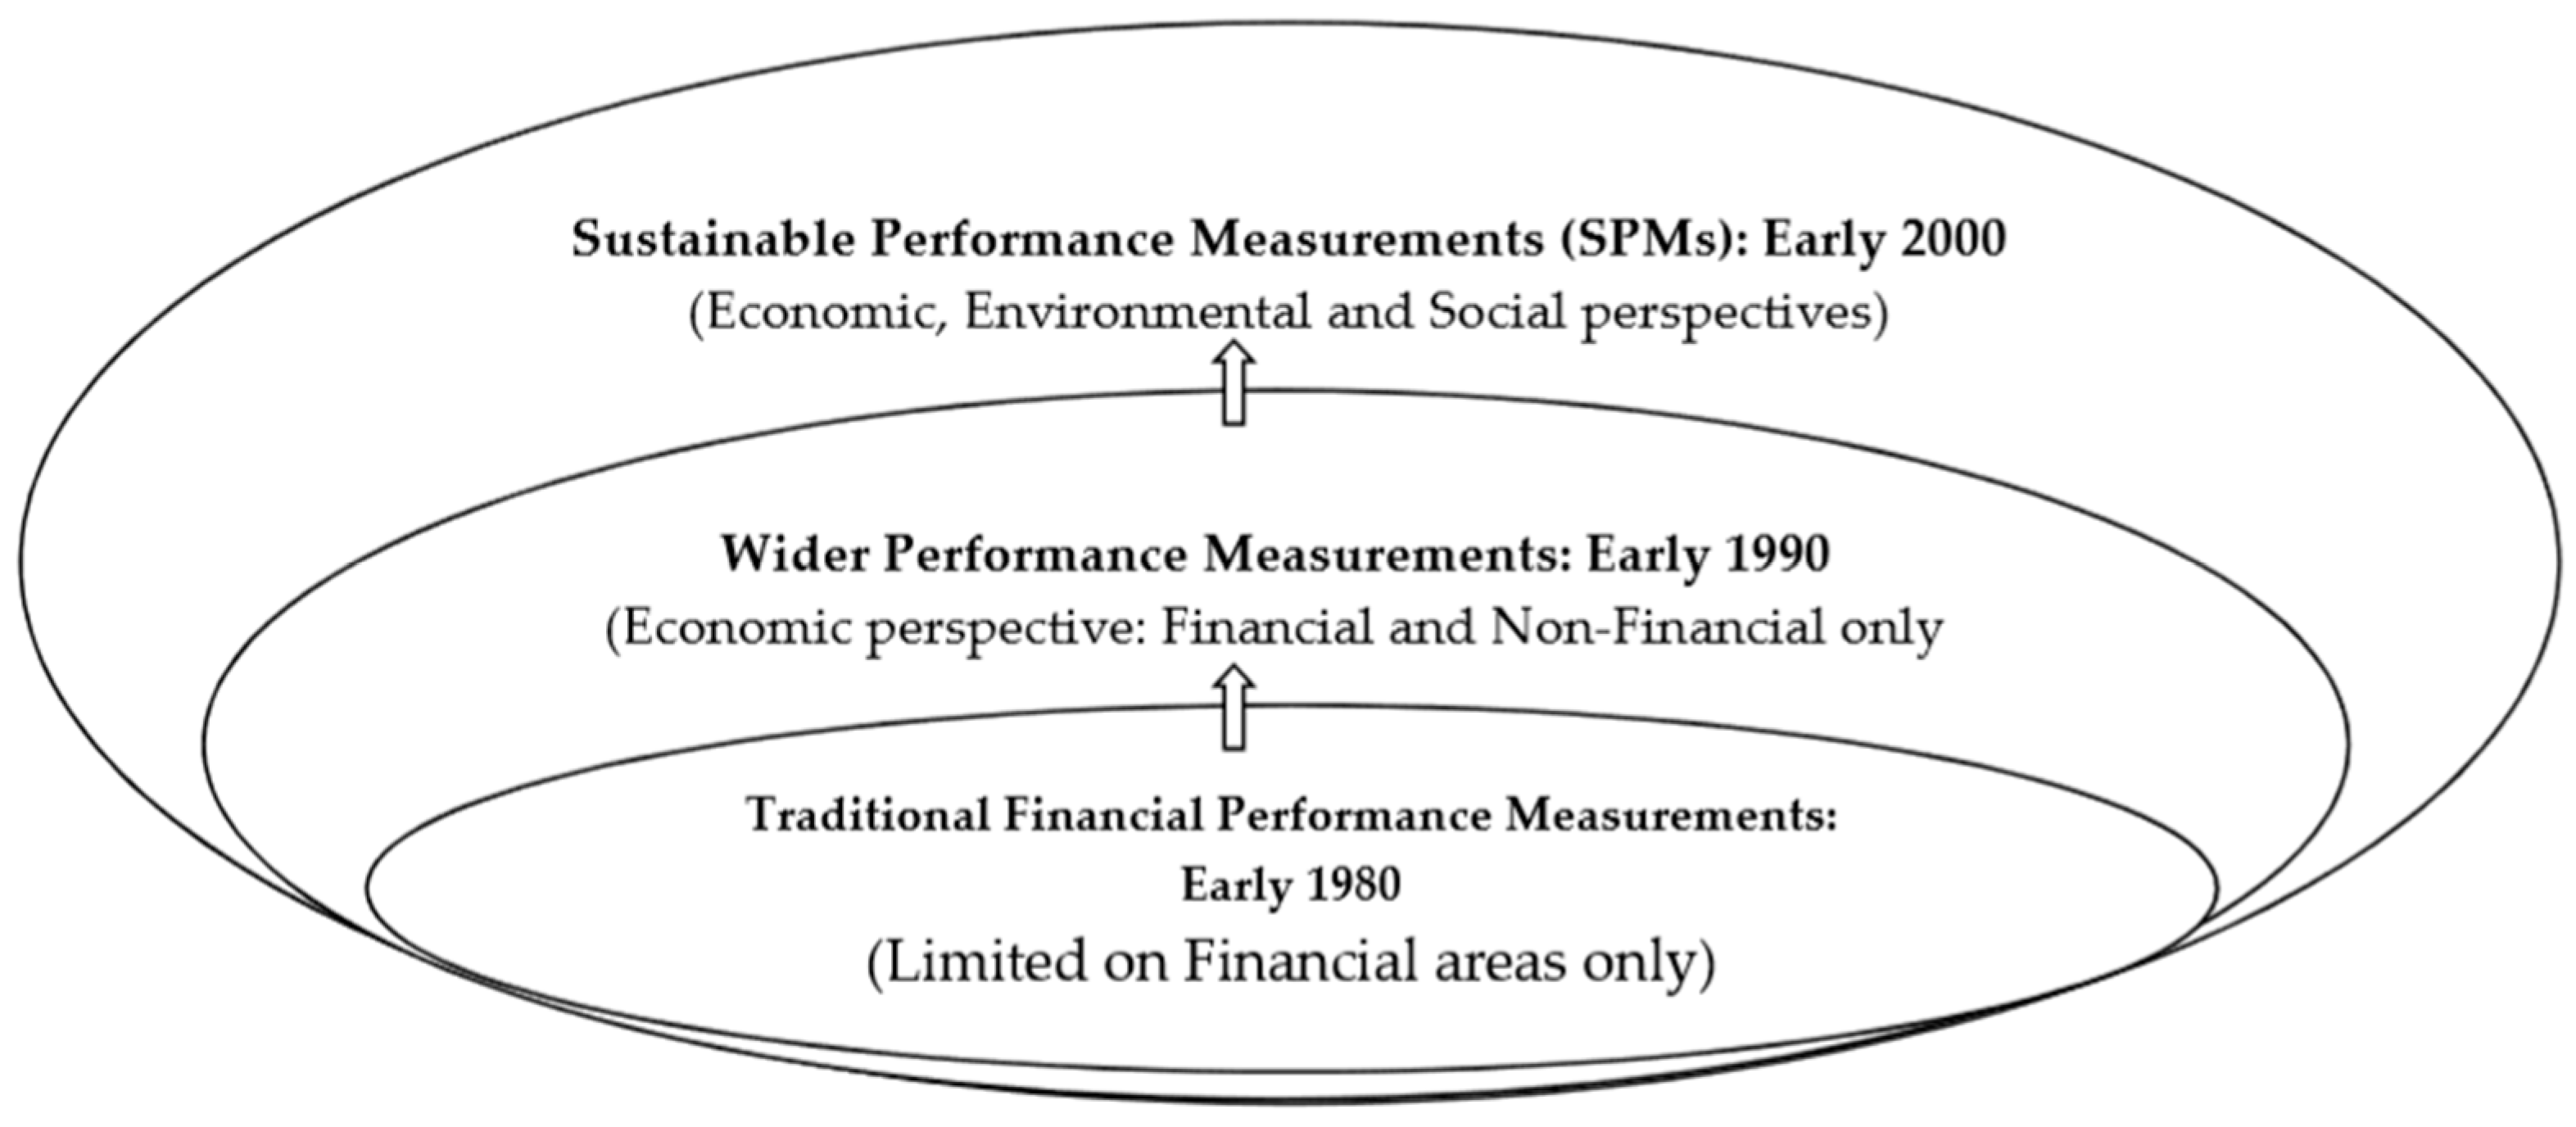
Figure 1 illustrates the summary of the development of performance measurement models. The development of performance measurement models that began in the early 1980s were limited to purely financial areas. Due to the insufficiency of purely financial measures, in the early 1990s, wider performance measurements came into being by incorporating both financial and non-financial measures. However, these wider performance measurement models were still limited to economic perspectives. With increasing pressure from various stakeholders and a demanding competitive environment due to globalization, more and more information was required to govern a company. In the early 2000s, the design of sustainable performance measurements was made to accommodate the triple bottom line, i.e., economic, environmental and social considerations.
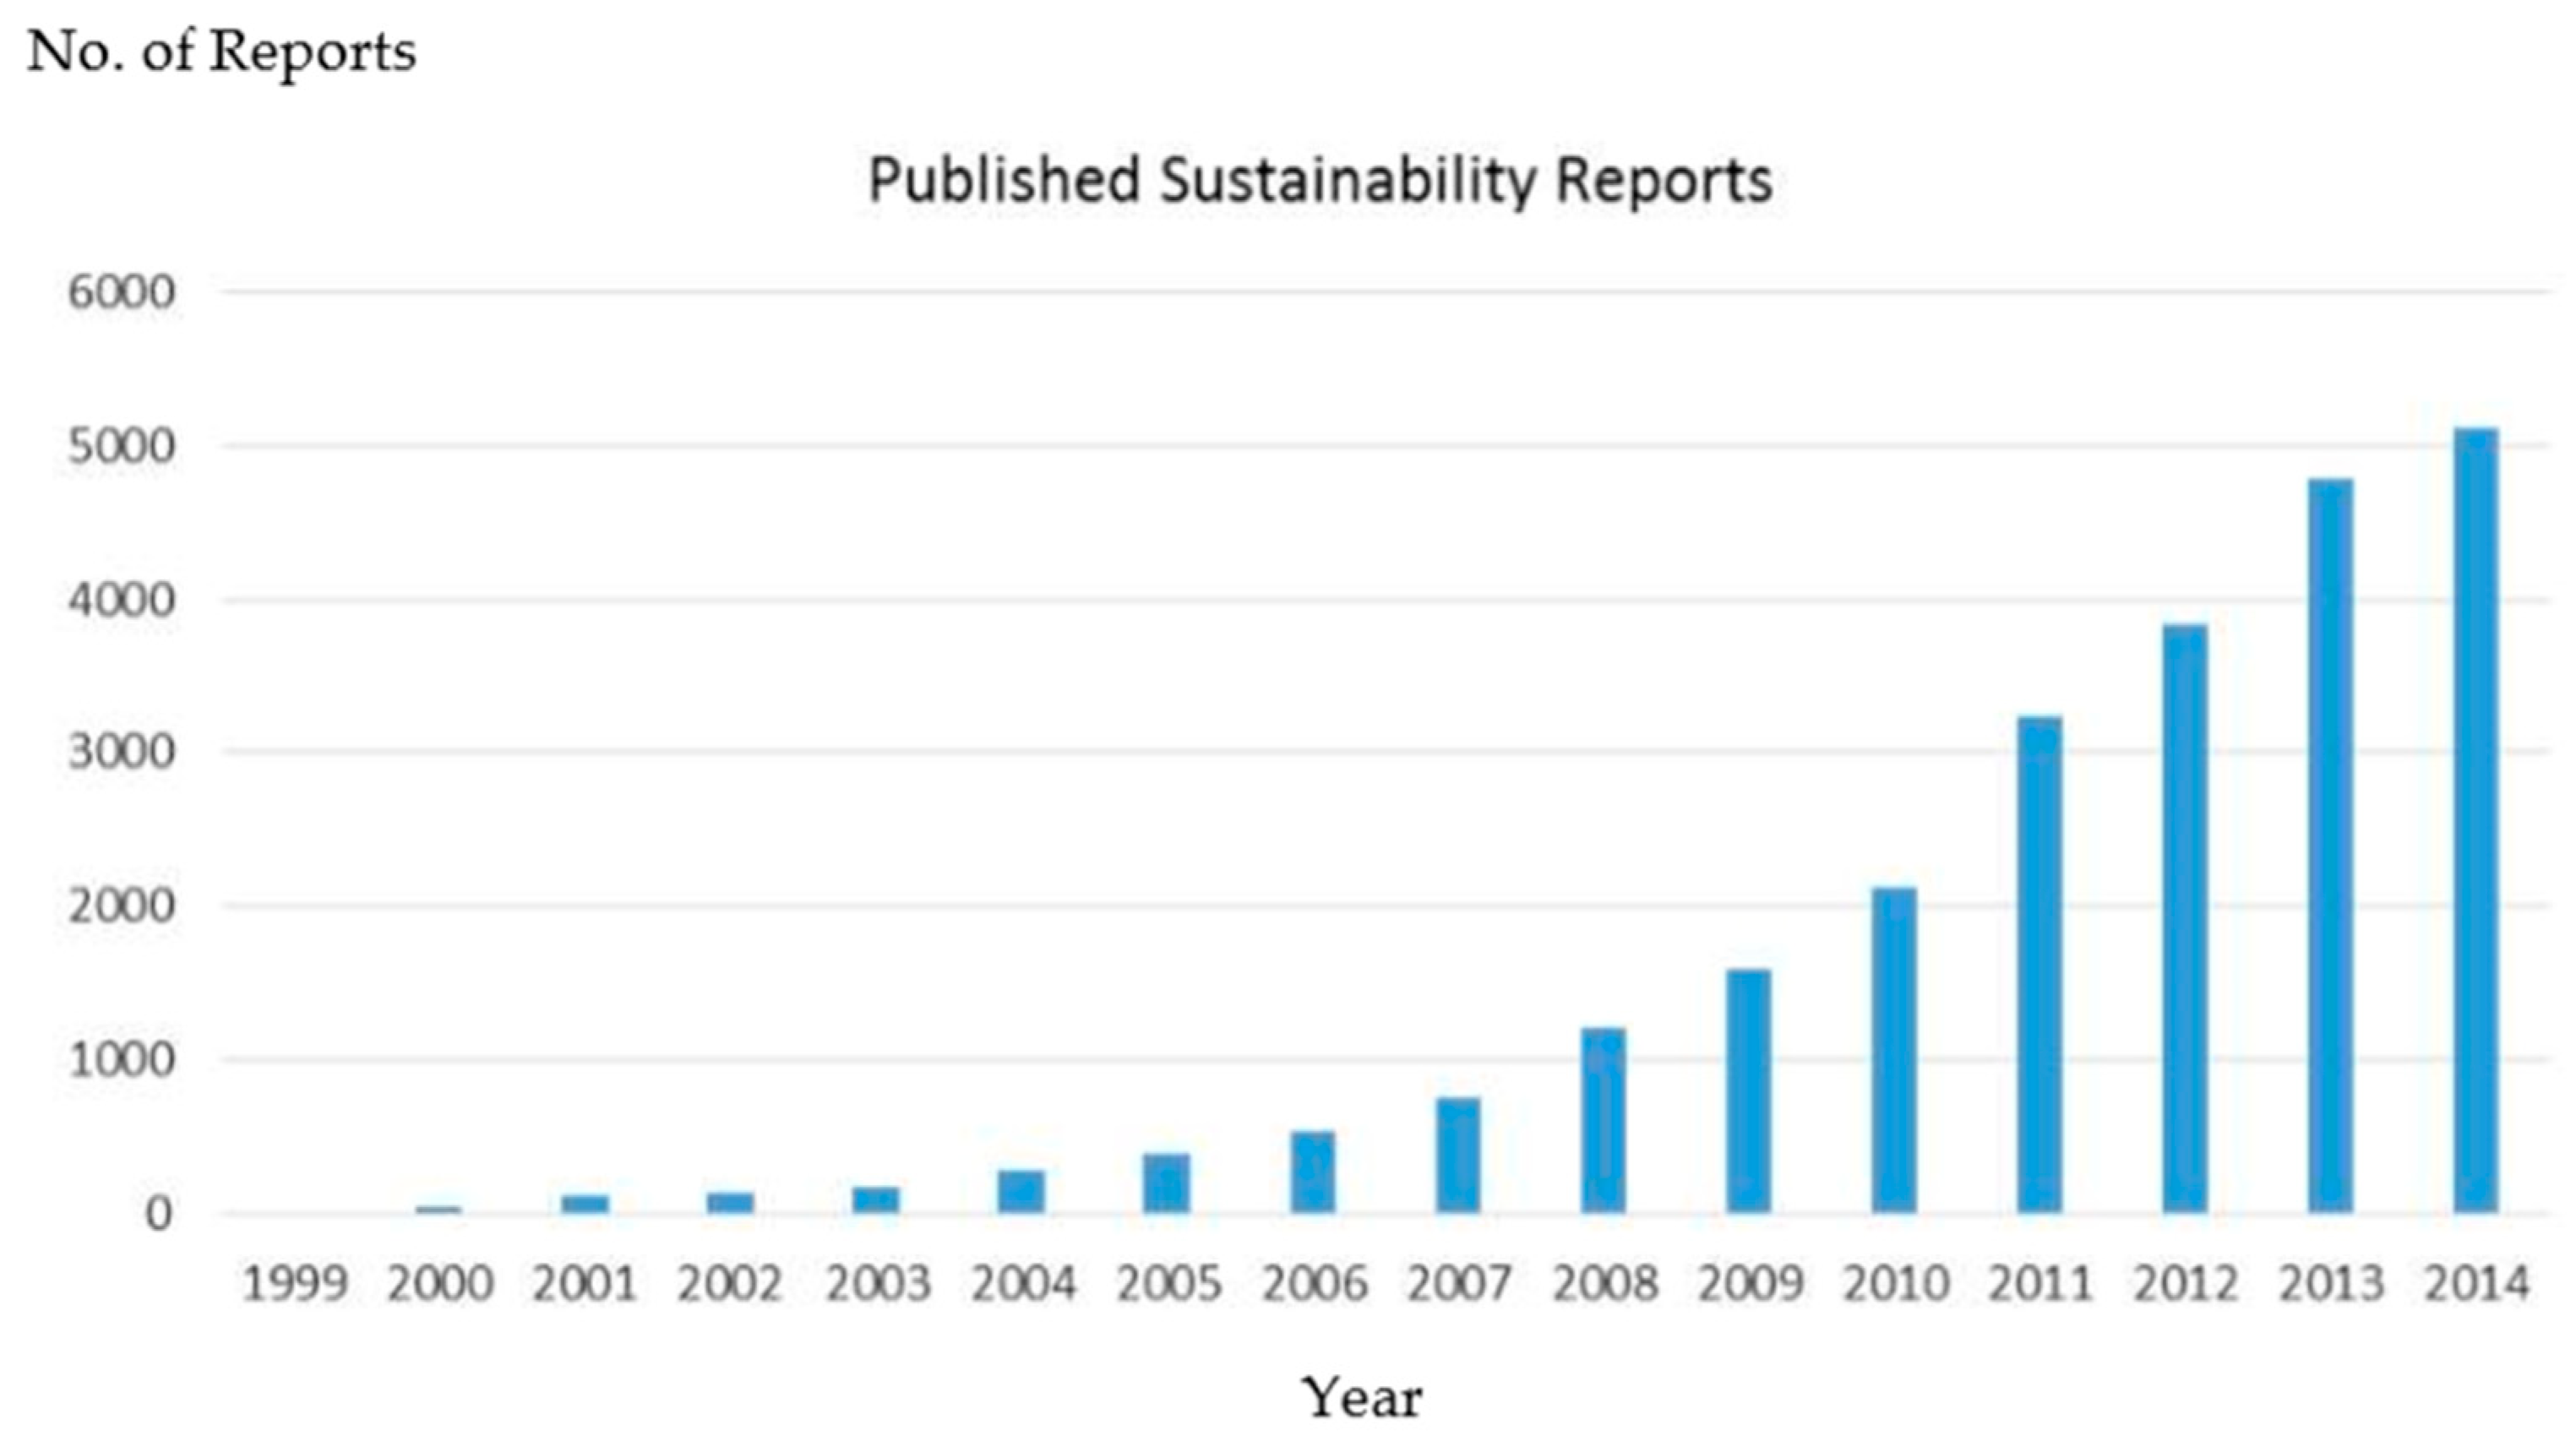
Over the past decade, the number of Global Reporting Initiative (GRI) sustainability reports has increased approximately 100-fold, reaching 5000 reports in 2014, compared to merely 50 reports in 2000 (Figure 2). Consequently, the frequency and in-depth presentation of sustainable reporting may likely be more demanding and comprehensive in the future, due to intense pressure and expectations from wide range of stakeholders, especially regulators.
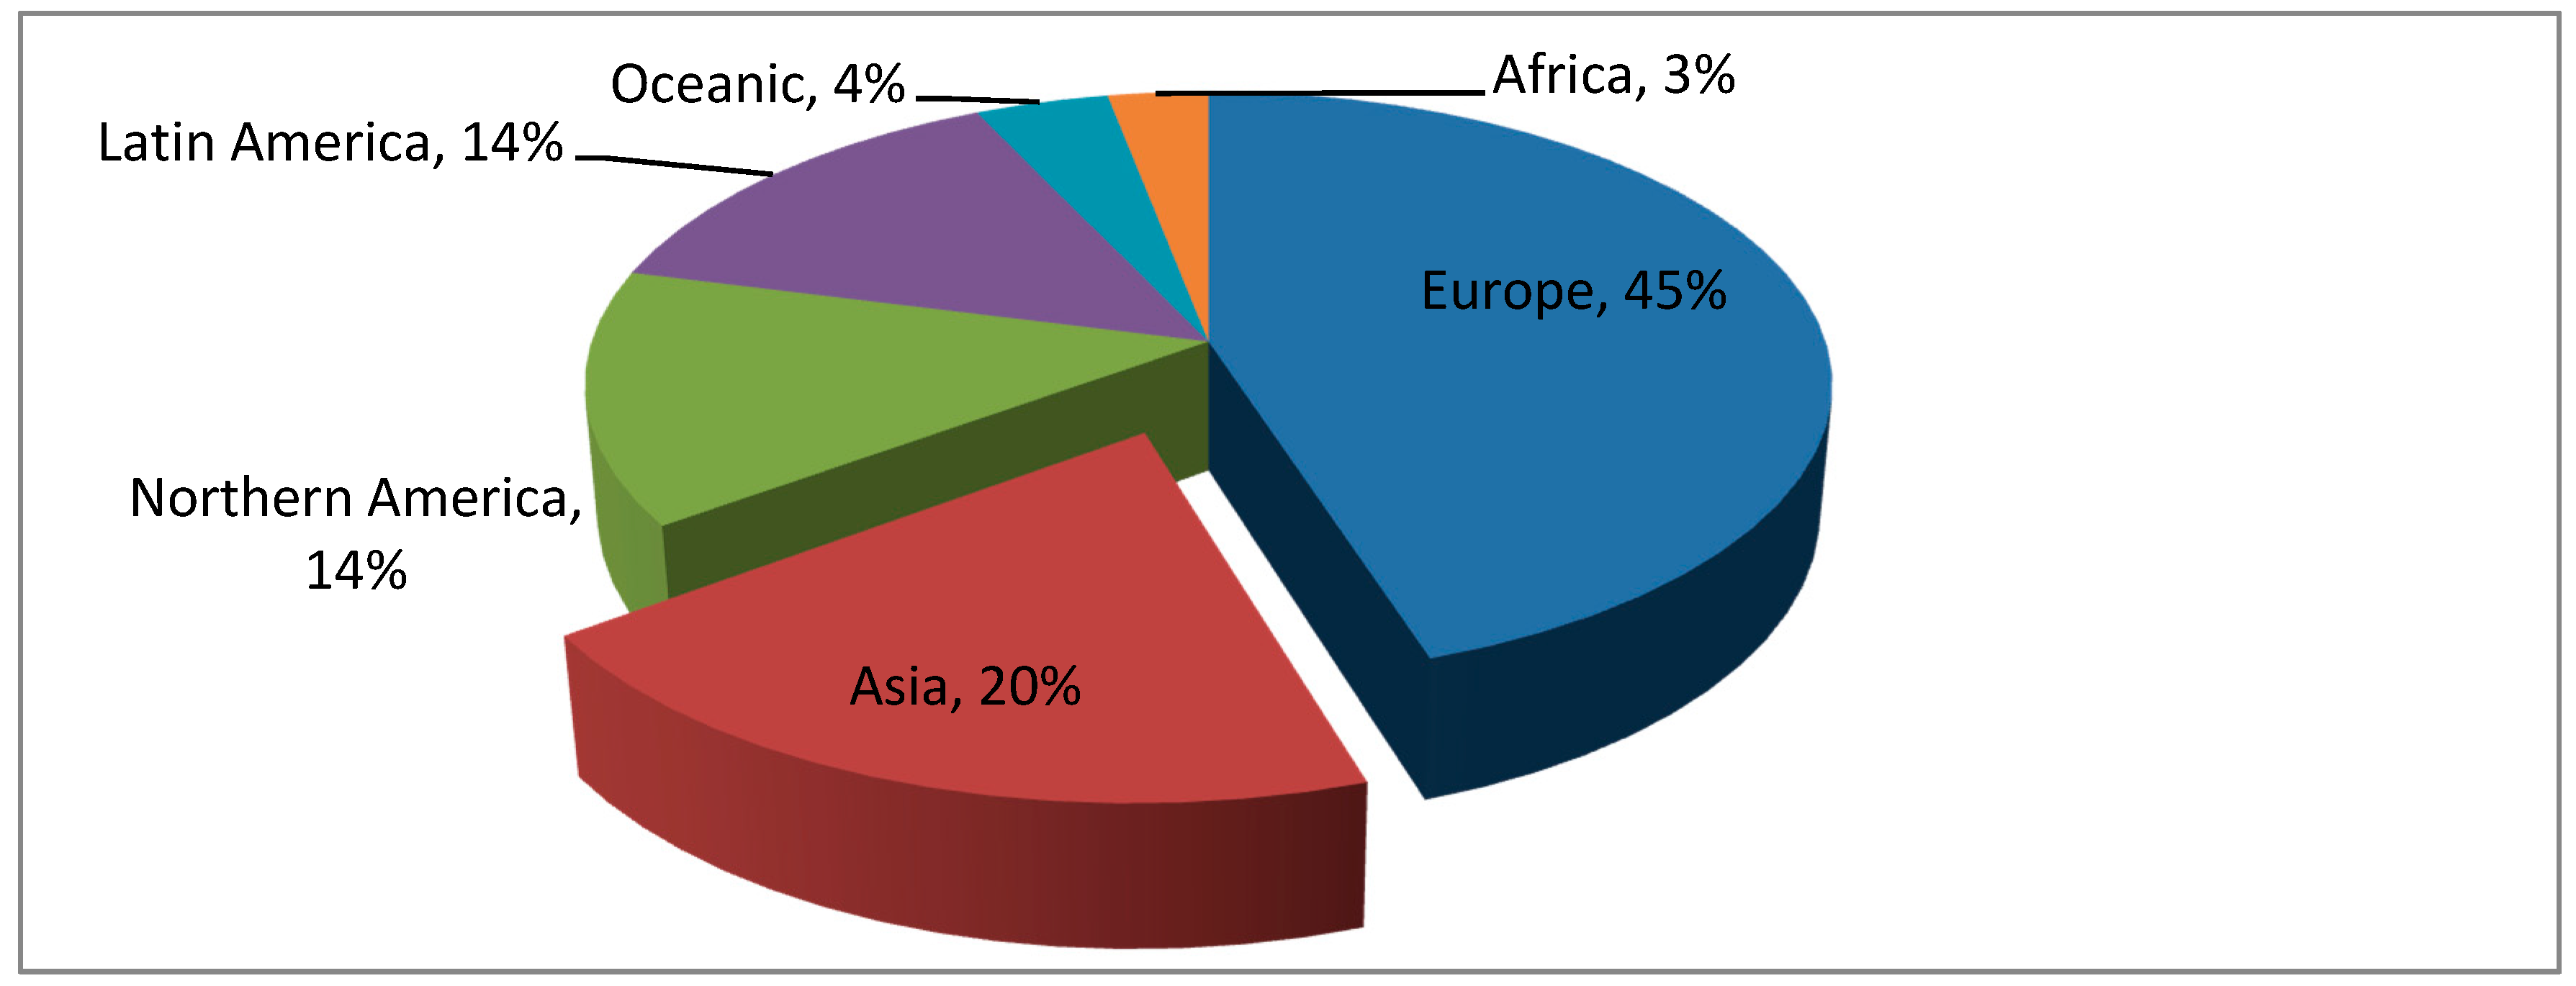
Even though there has been a remarkable boost in sustainable reporting in developed nations, reporting in developing countries, especially developing countries from Asia, is still a source of concern [6]. The Asian continent, with two thirds of the worlds’ population and the base of the second and third largest economies in the world (China and Japan), only stands as the second largest in terms of the amount of GRI sustainability reports per region (Figure 3). Again, the Asian continent, including Malaysia, is significantly lagging behind Europe, which has double the amount of GRI sustainability reports, to the Europeans credit.
According to the Asian Sustainability Rating (ASR) [7], in all Malaysian sectors, only 25% of firms provide sustainability reports, which portrays the severity of lagging behind in terms of the ASRs. However, Malaysian firms have achieved a better rating within the social category, with the leading firms diligently reporting on their stakeholder engagement with the customers, employees, suppliers and communities they interact with. To note, the latter firms are prominently related to foreign-owned firms, such as Digi Berhad and British America Tobacco Berhad. Based on [7], it is indeed relevant to study Malaysia’s sustainable reporting practices, especially for electronics and electrical (E and E) companies, since they constitute the second largest exporter sector, generating a large amount of revenue for the country [1], according to the MITI “Fact Sheet” (2012). According to [8], the E and E industry in Malaysia is categorised into four sub-sectors: Electronic components, consumer electronics, industrial electronics and electrical products.
Over the past few decades, Malaysia has experienced remarkable economic and export growth, particularly due to the massive shift from an agriculture-based nation to an industry-based nation (Table 1). Instead of being a large exporter of agricultural and mineral commodities, like in the 1970s, Malaysia now focuses mainly on manufactured goods, and particularly in the manufacturing industry, E and E products. In 1970, commodity exports (mainly tin and rubber) made up 92% of Malaysia’s exports, while manufactured exports made up the rest. By 2014, the scenario has completely reversed, where commodities accounted for 21% of total exports and manufactured exports, especially E and E products, made up the bulk of exports at 79% [9].
As the largest export product type in Malaysia, the E and E industry will always be subject to a global presence and closely scrutinised by a wide range of stakeholders, particularly the international community [10,11] from Western nations such as the United States, the Netherlands and Germany, who require high sustainable achievement. According to [4], the electronics and electrical industry is one of the largest contributors to environmental and social externality and problems, especially for electronics and electrical components related to computer equipment. This has led to interest in conducting a performance measurement study on E and E companies. In addition, the long history of this industry (since Malaysia’s independence in 1957) enables it to experience significant changes that have taken place in the industry’s development, where plenty of scope has existed for the design and redesign of corporate sustainability. Furthermore, the legal aspect was emphasised way back in 2006, when Bursa Malaysia introduced a framework that was made to aid the monitoring of publicly listed companies in complying with reporting standards on sustainability issues. Again, there was an adjustment to the listing requirements, to the extent of including an explanation of the actions taken by the listed issuer and its subsidiaries in terms of corporate social responsibility undertakings or practices. Therefore, this initiative put forward by Bursa Malaysia implies an urgent need to study and implement sustainable reporting among Malaysian companies, particularly in the electronic and electrical industry [12].
1.2. Research Objectives
Sustainability is a model that liaises with the fair allocation of resources [13]. A sustainable business is deemed as one of the models that “meets the interests of its stakeholders” at a corporate level. In business, sustainability is meeting the interests of the companies’ direct and indirect stakeholders, such as stockholders, employees, clients, communities, pressure groups and others, without reneging on the companies’ role of meeting the interests of prospective stakeholders [14,15,16,17]. SPMs are an assessment of a companies’ achievements not only in terms of economic excellence, but also in terms of social and environmental excellence [18,19,20].
For the last two decades, performance measurement models have evolved from traditional financial performance measurement models to wider performance measurement models, and eventually sustainable performance measurement models [21]. A study released by Deloitte [22], the world’s largest consulting provider, pinpoints four vital factors for motivating companies and countries to construct key performance measurements in terms of sustainability. The four vital factors are stakeholder demands, shareholder expectation, evolving regulations and the performance evaluation of sustainability.
For a country like Malaysia, sustainable performance practice reporting is still in its infancy, with exposure to several uncertain issues, especially those concerning sustainable performance measurements models (SPMs) that need to be managed, evaluated and reported on [23,24,25]. Furthermore, management and shareholders are still not financially convinced to implement sustainable practices in their companies because they are not aware that social and environmental initiatives have become an economic reality and they are not aware of what they stand to gain [26,27,28,29,30,31]. Additionally, [32] suggests that in the Indian business environment there are similar apprehensions that are held in tandem with what is happening in Western climes, in relation to issues like rising water shortages, energy costs, consumer demand and cost savings through waste recycling. Therefore, the need to arrest negative effects due to growing technological advancement, climate change, environmental pollution, social vices, organizational knowledge acquisition and global demands also make this study of high relevance, with the need to create awareness amongst academics and practitioners in emerging nations [33].
However, sustainable performance reporting is quickly becoming a “must” for firms in the future, despite the fact that the implementation of sustainable performance reporting is still not effectively implemented in business organizations and nations, particularly Asian countries like Malaysia, and especially in electronics and electrical companies [7,34]. These companies are not just the prominent drivers of economic growth but are also the largest exporters of Malaysian products [35]. They are exposed to global presence and face intense scrutiny from a wide range of stakeholders, especially major customers from Western countries, in terms of compliance with social and environmental regulations [36]. The success of E and E companies no longer relies on only the financial perspective but also on environmental and social achievements.
This paper, therefore, aims to address the above problems by determining the critical success factors that are attributable to sustainable performance measurement practices in Malaysian electronics and electrical companies.
Meanwhile, the structure of this paper is in the following order: Outside of the introduction, the next section delves into the research model based on theoretical foundations. Section 3 looks at a description of sustainable performance measurement practices and related contingent factors, and Section 4 covers the associated hypotheses. Section 5 contains the methodology and Section 6 shows the results. Finally, Section 7 contains the discussions, implications, limitations and areas for further studies, as well as our conclusions.
2. Research Model Based on Theoretical Foundations
Contingency theory of performance measurement relies on the assertion that there is no common sustainable performance measurement, which is applicable in the same manner to all companies under the same circumstances. Rather, the specific characteristics of the organization and its efficiency are influenceable by particular organizational and contextual factors. Hence, variables relating to the external environment, ownership structure, size, culture, strategy, organizational structure and technology affect the control system. According to [37], organizational value is traceable to the organizational and environmental context. Therefore, in this study, we rely on the work of [38] and [39] in relation to contingency research to determine and discuss the relationships between major contingency variables and sustainable performance measurement indicators, which form the premise for the theoretical framework. However, in the context of the sustainable practices, the stakeholder theory suggests that stakeholders play an important role in pressuring companies to adopt SPM practices, which in turn can lead to a competitive advantage [40,41].
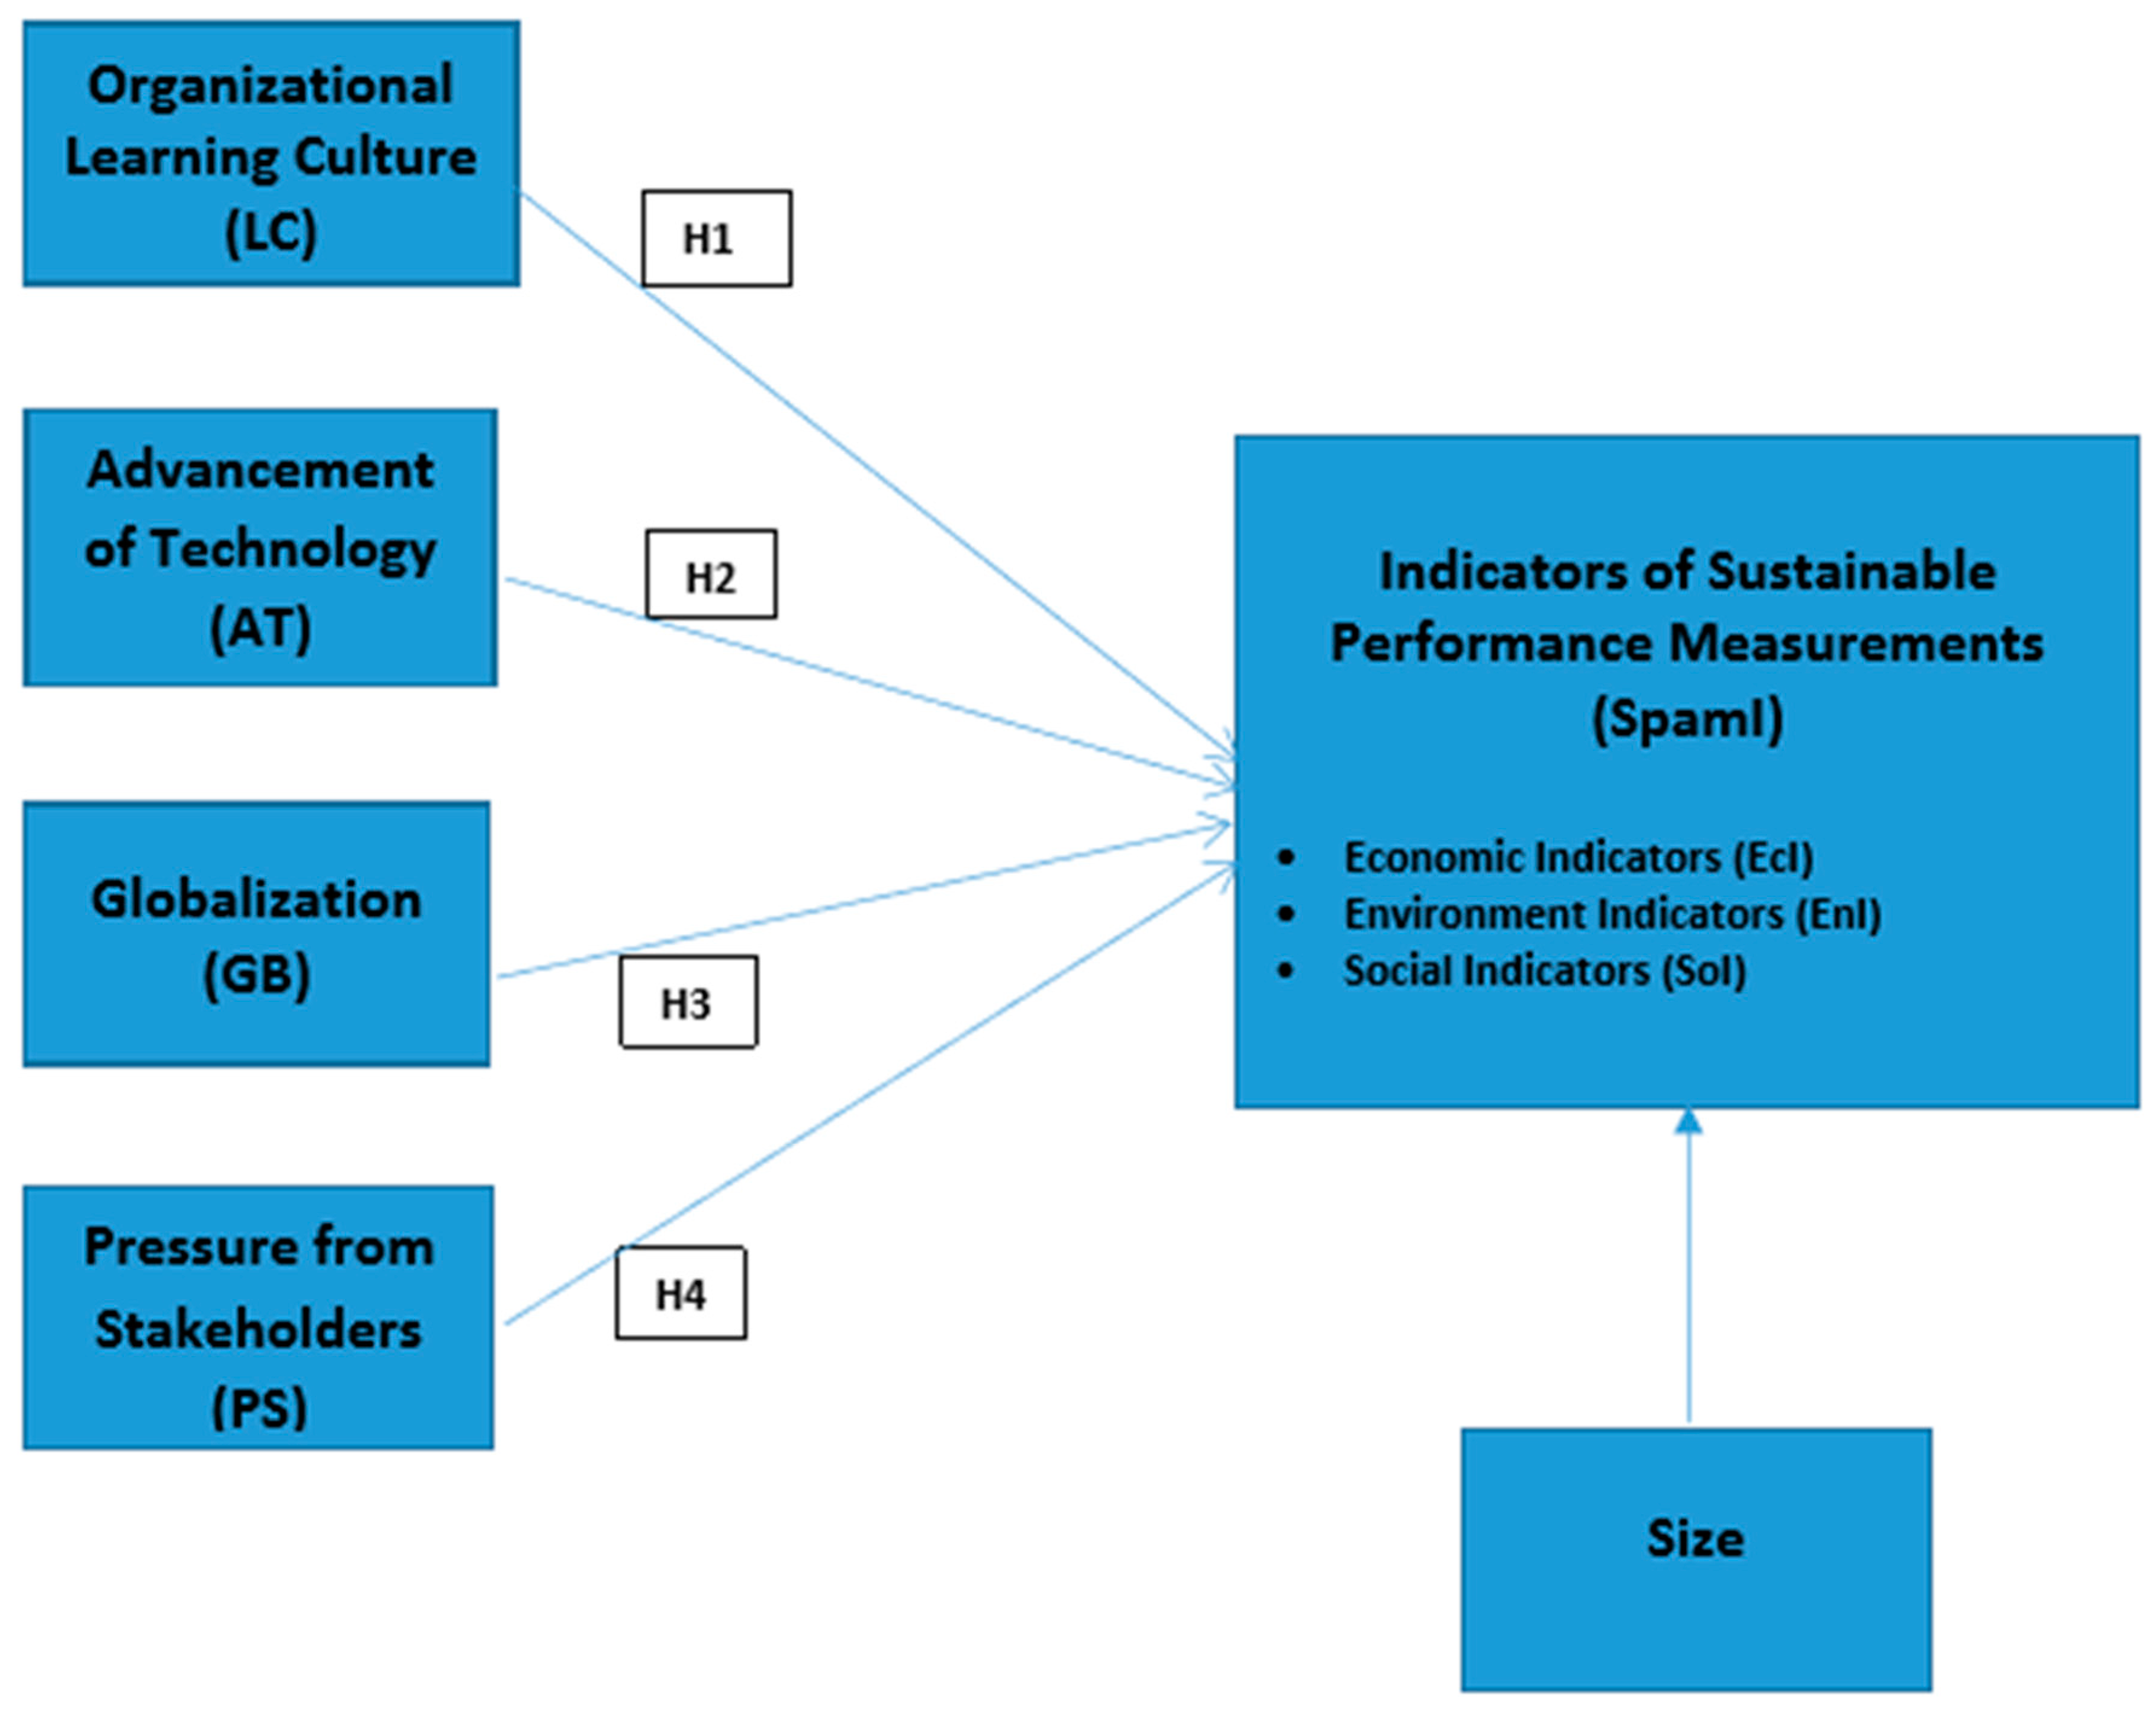
This study has unveiled a comprehensive research model for Malaysian E and E companies. This model is made up of two major components: Factors influencing SPMs and indicators of SPMs, aiming to achieve the research objectives shown in Figure 4, and the operationalization of the research variables shown in Table 2.
3. Sustainable Performance Measurement (SPM) Practices
Three indicators of SPM practice have been adopted in this research: Economic, environmental and social. The discussion is as follows.
3.1. Economic Indicators
Economic incomes have a strong connection with the degree of environmental protection in the long run of their business. A reliable manner to improve environmental protection is to become wealthy. With sound economic foundations, companies are able to expend their investments into other aspects, such as environmental and social aspects.
A company with better economic gain will provide extra funds to make investments in social performance [42]. Reference [43] also agreed that economic growth will lead to better social performance. In general, shareholder value maximization and profit maximization, in particular, can stimulate corporate social responsibility (CSR) [43]. On the other hand, if the company does not reward such behaviour, it will exhibit a reduction in social performance.
According to [42], a shift in activities may raise economic growth but harm social performance. Economic growth in electronics and electrical companies may impact employee effectiveness in terms of using resources that cause less environmental damage [44]. The company’s image can be improved compared to other competitors and better relationships with stakeholders may be formed. Lastly, better economic indicators will lead to better environmental and social outcomes in E and E companies.
3.2. Environmental Indicators
Environmental practices are relevant to evaluating economic outcomes and are used as an indicator for determining potential future economic impacts on a company [45]. According to [46] and [47], there is clear evidence that environmental performance will provide stakeholders with reliable, accurate and consistent information for the comparison of companies and can be used to inform key strategic decisions. Some companies, with a new set of environmentally-related capabilities such as waste minimization, green product design and technology co-operation are likely to benefit from sustainable competitive advantage in the future. For instance, pollution avoidance activities, which seek to mitigate wastes and emissions, could produce a sustainable competitive advantage of lower overall costs that will help reduce the environmental burden and increase economic benefits, delivering a competitive advantage [48,49].
In terms of E and E companies, which are also categorized as part of an environmentally sensitive industry, environmental performance can minimize the costs on the environment, minimize the capital cost and create a positive brand image that may result in a competitive advantage. All these benefits will lead to an increasing market share and better economic performance [45]. In addition, improving a companies’ environmental performance will improve employee performance through the reduction of environmental hazards [17]. Reference [50] reported that environmental performance will also improve social responsibility performance.
Furthermore, [51] stated that companies which implemented ISO 14001 standard will provide guidance on how better environmental management leads to better product quality. Companies that produce high-quality products will observe an increase in customer satisfaction. Companies with the best environmental performance will encourage all their employees to join environmental programs that the company organizes, which will directly lead to better performance results by the employees in the companies [52]. Furthermore, the quality of the companies’ environment will improve, which will provide a healthy and suitable working condition for employees. It can be concluded that a company without sustainable environmental practices to provide a resource foundation will have difficulty in achieving a better sustainable economic and social outcome. It is anticipated that E and E companies with environmental practices, which can be represented by environmental indicators, are more likely to have better economic and social outcomes.
3.3. Social Indicators
Reference [53] stated that social practices will lead to better economic outcomes. Activities related to social measurements are likely to promote customer confidence towards a company’s products. They will create a competitive advantage among the industry, resulting in a gain in profit and economic growth. Furthermore, managers in electronics and electrical companies should often examine the product’s practicality and the customer’s needs, leading to a radical new product strategy such that it can increase the level of customer satisfaction [48]. Customer satisfaction will increase when customers receive high levels of service without concern about post-consumer waste, and the company will benefit from higher levels of customer retention and efficient use of recycled materials, which will lead to economic growth and good environmental quality for the company.
There are many types of programs that can be devised to improve sustainability performance. Reference [19] stated that companies should always be concerned about their employees, and companies should improve social practices by providing education and training camps for employees to improve their environmental awareness. Furthermore, a standard under ISO 26000 provides direction on how companies can function in a socially responsible manner. This means acting in an ethical and transparent way which can enhance the health and welfare of society. Sustainable business for companies amounts to not only engaging in products and services that meet the customers’ needs and do not harm the environment, but also operating in a socially responsible manner.
3.4. Control Variable
Size is included in this study, functioning as a robust control variable used for explaining corporate management and business performance [24,25]. Large firms tend to invest more extensively into sustainability management due to a better availability of resources. In addition, larger size firms are more advantageous in terms of economies of scale, advertising and new product development, which could serve as sources of firm performance [35]. In this study, the number of employees would represent the measure of size [54,55,56].
4. Development of Hypotheses Based on the Research Model
Based on contingency theory, there is no “one size fits all” solution to the challenges facing companies in adopting SPM practices. Therefore, it is important to identify the internal and external factors that drive SPM practices. In the context of the sustainable practices, the stakeholder theory suggests that stakeholders play an important role in pressuring companies to adopt SPM practices, which in turn can lead to a competitive advantage [40,41,57]. As such, the four contingent factors that influence SPM practice are: (1) The organizational learning culture, (2) the advancement of technology, (3) globalization and (4) pressure from stakeholders, in line with the studies of [55,56,57,58]
4.1. Organizational Learning Culture and SPMs
An organization or company’s capacity to learn is a crucial factor in influencing sustainable performance measurement. Companies that are environmentally-conscious should encourage employees to have the freedom to make environmental improvements. Employees should be able to improve performance without the intervention of management, and management can commit to environmental endeavours through the adoption of sustainability culture [54]. One way to create a sustainable work environment is to create values, norms and behaviours to learn which support sustainability-related behaviours [59]. According to [60], the implementation of environmental source reduction is to be supported by cultural change. In a nutshell, an organization’s learning culture is expected to influence the indicators of SPMs [61,62,63,64]. Based on the discussions above, Hypothesis 1 is that:
Hypothesis 1 (H1).
The organizational learning culture influences the indicators of SPMs.
4.2. Advancement of Technology and SPMs
The study in [42] concluded that advancement in technology is reflected by an increase in the following areas: Consumption of resources in qualitative and quantitative terms, energy used, efficiency level of production and disposal of wastes to reduce the eco-cost. This study measures the advancement of technology based on the efficiency of resource consumption and disposal of waste, as highlighted by [65]. Technology complexity and efficiency affects the decision-making process as well as the measurement model, and thus, a dynamic performance measurement model is required to provide useful signals to measure the efficiency of the production environment. Technological advancement is the resource which enables a firm to generate innovations in relation to products, processes and engineering projects [66]. The general innovation literature theorizes that technology is the dominant driver of a firm’s innovative activities [67].
On the other hand, according to [68], the implementation of advanced technologies could have a great deal of influence on the work environment, as this could ensure retraining of the residual workforce (skill upgrading), and cause changes in job responsibilities due to the integration across the practical areas of business. To some extent, the peculiarity between dissimilar types of production/process techniques (e.g., unit production, small batch, large batch, mass and continuous production) is an issue that has since been recognised as having an influence on the structure of internal management control systems, such as SPMs. As a result, the expectation is that as the advancement of technology increases, the measurement becomes more complex. Additionally, manufacturing dimensions such as quality, innovativeness and flexibility need be considered, i.e., the company will adopt SPMs. Similar findings were found in the studies by [55,65,66]. In line with the discussions above, Hypothesis 2 is as stated below:
Hypothesis 2 (H2).
Advancement of technology influences SPMs.
4.3. Globalization and SPMs
According to [67,68,69], companies will change their control systems if operating under a more competitive environment, as proper performance measurement models and monitoring are vital for survival. In short, performance measurement models [70], particularly sustainable elements, will be influenced significantly by growing competition in businesses. Many companies now actively seek to confirm their superiority over their competitors in terms of environmental and social peculiarities of quality of service, reputation, branding, flexibility, customization, innovation and rapid response [71,72,73]. Clearly, products and processes which are associated with more environmental and ethical practices usually earn a better reputation, where this ultimately transforms into economic gains and puts them ahead their rivals. As such, companies with strong market positions have a greater level of awareness for internal communication, and thus are likely to place a higher emphasis on the policy of a performance measurement model to incorporate their sustainable initiatives.
Companies, predominantly those with a universal presence, are required to pledge to sustainable practices, as a company’s reputation is crucial to the company’s success [74]. In short, globalisation, which can be measured by the intensity of competition and international exposure, seems to influence the indicators of SPMs, which is supported by [75,76]. Based on the discussions above, Hypothesis 3 is formulated as below:
Hypothesis 3 (H3).
Globalisation influences the indicators of SPMs.
4.4. Pressure from Stakeholders and SPMs
According to [77], pressure from stakeholders in terms of responsibility, effectiveness and efficiency in managing the sustainable performance of companies is growing, particularly in terms of sustainable disclosure. The study in [78] recommended that Malaysian companies should earnestly embark on environmental reporting if the disclosures are mandatory and in the best interests of stakeholders. The belief is that as the concern for economic, environmental and social issues rises, the pressure from stakeholders will need to increase in order to monitor company activities, particularly for SPMs.
In fact, stakeholders (e.g., the regulators) are leading the way for sustainable reporting among Malaysian electronics and electrical companies. For instance, Bursa Malaysia introduced the corporate social responsibility (CSR) framework in 2006. The pressure from stakeholders is expected to influence the indicators of SPMs [79,80,81]. Based on the discussions above, Hypothesis 4 is as stated below:
Hypothesis 4 (H4).
Pressure from stakeholder influences the indicators of SPMs.
4.5. Malaysian Manufacturing Firms as Population of Study
This research focused on manufacturing firms as the area of analysis. Three main reasons were used to support the selection of Malaysian manufacturing firms. Firstly, the manufacturing sector in Malaysian is highly sensitive to the influence of sustainability issues arising from regulators, customers and other stakeholders. According to the Department of Statistics Malaysia, Malaysian manufacturing firms spent a relatively large amount of environmental protection costs on waste product handling, which affects their competitiveness. This is because a significant percentage of Malaysian manufactured products are being exported to overseas markets which emphasise these sustainability issues. Secondly, the practice of sustainable production by Malaysian manufacturing firms is crucial to ensuring the continuous competitiveness of the country’s economy, as well as becoming a high-income nation in 2020. Thirdly, much of the prior literature based on manufacturing firms collected samples from developed economies. There was a lack of empirical studies concerning developing countries, including Malaysia, despite the fact that manufacturing firms operating in developing economies are inevitably subject to significant sustainability pressures globally.
5. Methodologies
All the research instruments and the operationalisation of the research variables were adapted from previous studies as discussed above and a 5-point Likert scale was adopted in designing the questionnaire. The complete questionnaire is in Appendix A.
Before the actual field work, pretesting and a pilot test was conducted, where a selected sample of 1106 companies was used to carry out the field work. The various follow-ups that were made resulted in a 19.7% response rate. This study focuses on the targeted population which is comprised of respondents from both The Electrical and Electronics Association of Malaysia (TEEAM) and The Federation of Malaysian Manufacturers (FMM). Both associations are the best representatives of Malaysian E and E companies.
After cross-checking with both databases and eliminating duplicates, a single database which consisted of 2212 companies was created from the whole population of electronics and electrical companies registered in Malaysia with either TEEAM or FMM. Table 3 shows the sample size and response rate for the study.
The data collected for this study were quantitatively analysed with the aid of the Statistical Package for Social Sciences (SPSS), Amos 18. Prior to the tests, several multivariate analysis assumptions must be considered, namely missing data, sample size and normal distribution. There were two major techniques involved in this study: Confirmatory factor analysis (CFA) and path analysis.
6. The Result
6.1. Non-Response Bias
The response and non-response biases were tested in this study using t-tests to compare the similarities between the standard deviation, mean and the standard error of the mean of the late and early responses in the main variables. Based on the mentioned facts, this study has classified 130 respondents as early responses and 87 respondents as late responses. The outcome has shown no existence of a non-response bias (Table 4).
6.2. Descriptive Statistics
Table 5 indicates the profiling of the respondents based on location, ownership, operational year and size, respectively. The majority of the respondents (62.2%) were located in the Klang Valley (which includes Selangor and Kuala Lumpur). From the results, more than 68% of the manufacturing companies that responded to the survey were Malaysian owned, and most of the companies (40.1%) have been operating for more than 20 years, and the majority of them (52.1%) are categorised as small size, with less than or equal to 74 full-time employees.
Table 6 shows the values of the mean, median, mode, standard deviation, variance, range, minimum and maximum for the independent variables and dependent variables, which comprise of factors influencing SPMs and indicators of SPMs. Under factors influencing SPMs, there are four independent constructs: (1) Organizational learning culture, (2) advancement of technology, (3) globalization and (4) pressure from stakeholders. The sustainable performance measurement (SPM) indicators consist of three sub-constructs: Economic, environmental and social indicators.
The results show high mean and standard deviation values for the SPM indicators and the contingency factors were as follows: Economic (4.13; 0.81); environmental (3.73; 0.94); social (4.08; 0.82); organizational learning culture (3.71; 0.98); advancement of technology (3.63; 0.98); globalisation (3.45; 1.03); and pressure from stakeholders (3.55; 1.10), respectively.
6.3. Reliability
In addition, Table 7, shows the reliability test for factors influencing SPMs and indicators of SPMs pre- and post-fitness modification. Collectively, the reliability for all data increased and met the requirements of Cronbach Alpha (>0.70), construct reliability (>0.60) and AVE (>0.50). Collectively, the normality test for all constructs fulfilled the requirement of skewness and kurtosis, in a range of −2 to 2 [82]. Essentially, the study was free from the issue of multicollinearity as the entire construct did not exceed 0.85.
Discriminant validity was tested via correlation statistics, as shown in Table 8. All the variables showed positive correlations with each other, while LC had the highest correlation (0.635) with AT, but the least (0.242) with SPMs. All the correlations between exogenous constructs were ≤0.85, which was above the required level.
The Hausman endogeneity test was performed, which involved a two-stage least squares estimation. Firstly, residuals were created by performing first stage regression of the independent variables. Secondly, the regression was re-ran by including the residuals in the equation. The result indicated that P = 0.0687, which did not suggest an endogeneity problem.
6.4. Structural Equation Modelling
The comparison of fit statistics between the initial and modified measurement models are shown in Table 9. The modified measurement model yielded the following fit model: Chi-square (χ2) of 548.099, Root Mean Square Error of Approximation (RMSEA) of 0.072, Goodness-of-Fit Index (GFI) of 0.840, Adjusted Goodness-of-Fit Index (AGFI) of 0.799, Comparative Fit Index (CFI) of 0.903, Turker-Lewis Index (TLI) of 0.888, Normed Fit Index (NFI) of 0.833 and a Chi Square/degrees of Freedom (χ2/df) ratio of 2.116. Thus, Table 9 shows the fulfilment of all the criteria. The modification process has significantly improved the overall model fit as the model fit is now acceptable for path analysis to answer the research objectives.
Once the fit of the measurement model was acceptable, the second step was to test for the structural model via path analysis. The standard error of the mean is a technique suggested to analyse the inter-relationships or multi-regression of all the variables in a measurement model [83]. Table 10 also reveals the P value and R2 derived from the modified measurement model of SPMs.
Table 10 shows that LC had a positive effect on SPMI (β = 0.017), however there was no significant relationship between them, thus, H1 was rejected. In the case of AT and SPMI, there was a negative effect (β = −0.299) but no significant relationship, hence, the rejection of H2. Furthermore, there was a positive effect of GB on SPMI (β = 0.454) with the presence of a strong significant relationship, thus, H3 was accepted, while with respect to PS and SPMI, there was also a positive effect of the latter on the former (β = 0.580) that was supported by a strong significant relationship, thus, H4 was accepted. In terms of the control variable, our findings reported no significant association between SpmI and firm size (β = 0.003). The structural model showed that the independent variables explain 70.4% (R2 = 0.704) of the dependent variable. Therefore, the results suggest that globalisation and pressures from stakeholders are responsible for E and E companies’ focus on SPMs and economic, social and environmental indicators in Malaysia.
7. Discussion
Factor (1), organizational learning culture and Factor (2), the advancement of technology, both do not influence the SpmI of Malaysian E and E companies. One of the possible reasons is that E and E companies in Malaysia are not convinced about the financial benefits of emphasizing sustainable measurements or indicators of SPMs. As a result, policy makers of Malaysian E and E companies do not emphasize any learning cultures or technologies for the sake of sustainability. This result is inconsistent with [61,67]. However, [84] supports it. These outcomes are not in line with contingency theory. For an organization’s learning culture, the finding indicates that learning cultures are highly internalised among employees of the companies, however, the benefits of the learning cultures might not be successfully translated into anticipated achievement in terms of SpmI. This is probably due to the lack of an employee empowerment climate in a developing country like Malaysia, which limits employees’ self-directed decisions on sustainability activities. In terms of advancement in technology, the majority of the sampled firms (>68%) in this study were small and medium (mostly family-owned) in size, meaning that they might not be able to invest in advanced technology [55]. Another reason could be that these companies with limited resources are reluctant to change to radically new technologies which require huge capital investment and technical expertise. As a result, lacking in advancement of technology among Malaysian firms has not benefited them in achieving superior performance. It is important for Malaysian firms to overcome obstacles in adopting radical technologies in order to gain superior performance from their technological management.
Factor (3), globalization, does in fact influence the SpmI of Malaysian E and E companies. According to [22], business leaders truly realize how vital sustainable practices are for the survival of their companies in the face of harsh global competitions. Hence, companies aggressively seek to distinguish themselves from their rivals in terms of their environmental and social reputations, the quality of their service, their branding, flexibility, customization, innovation and rapid responses. Likewise, E and E companies, especially those with an international presence, are required to be committed to a sustainability goal as the company’s reputation is crucial to its success, particularly from the perspective of their major customers [74]. This is in line with contingency theory, suggesting that globalization will affect a firms’ resource-allocation strategies. Companies are more likely to invest in sustainability practices which could produce positive superior performance [39].
Factor (4), pressure from stakeholders, does influence the indicators of SPMs in Malaysian E and E companies. According to [82], pressure from stakeholders’ anticipation on responsibility, effectiveness and efficiency in managing the sustainable performance of companies is growing, particularly in terms of sustainable measurement and disclosure. Government agencies are the obvious factor that influence the adoption of sustainability practices. Stakeholder theory explains that the actions undertaken in the best interests of the stakeholders would lead to a positive firm performance and the survival of organizations in the long run [70,85].
This research has proved fruitful in unveiling a comprehensive SPM model with unprecedented scope, stretching from factors to indicators of a SPM model for Malaysian E and E companies. Such an unprecedented comprehensive SPM model is adequately capable of generating insight to address the problem effectively. The main challenge in promoting sustainable practices among E and E companies in Malaysia is still the mindset that focusing on sustainability may not promote financial outcomes. For example, companies in Malaysia, especially E and E companies, still do not show their own initiative to develop SPM indicators unless they receive pressure from external stakeholders or globalization. Even though E and E companies are aware of how essential indicators of SPM are upon the outcomes of SPMs, they remain unconvinced about the financial feasibility of adopting sustainable performance measurements. As a result, stakeholders, especially policy makers, must play a leading, persistent and initial role in encouraging the adoption of sustainable performance measurements among companies. The details discussing the findings for each of the components are unveiled as follows:
In terms of the factors influencing the indicators of SPMs, two factors have a strong influence on the indicators of SPMs: (1) Globalization and (2) pressure from stakeholders. Interestingly, both of these factors are classified solely and purely as external factors. In contrast, internal factors like (1) the organizational learning culture and (2) advancement of technology have no impact on the indicators of SPM. In a nutshell, the research findings portray a very interesting and explicit fact that sustainable performance measurement indicators are drivable by external factors, in the context of a developing nation like Malaysia. In short, with more stringent rules from regulators (external forces), companies will need to emphasise external factors such as globalization and pressure from stakeholders in order to survive in harsh competitive environments. Companies in Malaysia, especially E and E companies, still do not show their own initiatives to formulate indicators of SPMs unless they receive pressure from external stakeholders or are under very intense exposure from globalization, such as intense competition and internalization.
7.1. Contributions and Implications of the Study
The contributions and implications of this study are emphasised from three major perspectives: Theoretical, social and political.
From the theoretical angle, the study has shown that the activities of the profit organizations can be further justified on the grounds of the contingency theory with the applications of contingent factors such as globalisation, organisational structure, size, ownership structure, culture and technology.
In relation to the social aspect, management, policy makers and government have the responsibility of ensuring the production of goods and services that are capable of meeting up with the needs of not only local consumers but also international communities, due to the requirements of globalisation.
The political implication has to do with bills sponsored to ensure that appropriate laws are in place to protect every stakeholder in the scheme of events both locally and internationally. Again, it is in terms of upgrading the existing culture and equipping all organizations with the required learning mechanisms that we can help increase productivity with the application of the right technology by everyone.
7.2. Limitations and Areas for Future Research
One of the criticisms levelled against the contingency theory is the assumption about the causation between contingency variables and sustainable performance measurements; whereas these relationships are not in-depth enough to justify the exclusion of other factors [70]. Despite methodological and theoretical issues, like model underspecification and any measurement error that led to inconsistent results, the contingency theory has remained a sound theory for understanding the relationship between contextual variables and sustainable performance measurements in the greatly dynamic and complex sector context [85]. In future studies, we will focus our efforts on not-for-profit organizations, in addition to carrying out longitudinal research with respect to profit-oriented companies.
7.3. Conclusions
The evidence shown in this study has revealed that E and E companies are the second largest exporter in the Malaysia economy, with four major areas of concentration. The study was based on the contingency theory and stakeholder theory, with suggestions that no one factor explains the basis for the effectiveness of a company and that stakeholders can exercise force on an organization to meet their needs. However, of the four factors considered, two of them (globalisation and pressures from stakeholders) influenced the SPMs, while the other two (organizational learning culture and advancement in technology) did not have a significant influence. The contributions and implications of this research are from theoretical, social and political perspectives, while the limitation is with respect to the lesser application of the contingency theory. Meanwhile, research efforts in the future should consider longitudinal studies and the relation of this area of study to non-profit organizations.
Author Contributions
Conceptualization, B.H.T. and T.S.O.; Methodology, B.H.T.; Software, B.H.T.; Validation, B.H.T., T.S.O. and A.S.L.; Formal Analysis, B.H.T.; Investigation, B.H.T.; Resources, T.S.O.; Data Curation, T.S.O.; Writing—Original Draft Preparation, T.S.O.; Writing—Review and Editing, B.H.T., T.S.O. and A.S.L.; Visualization, B.H.T.; Supervision, T.S.O.; Project Administration, B.H.T., T.S.O. and A.S.L.; Funding Acquisition, T.S.O. and B.H.T.
Funding
The research was funded by Universiti Putra Malaysia and Multimedia University, Malaysia.
Acknowledgments
This research was supported by Fundamental Research Grant Scheme (FRGS), Higher Education Ministry of Malaysia, (Grant no: FRGS/1/2016/SS01/MMU/02/9) and Putra Grant, Universiti Putra Malaysia, (Grant no: UPM/700-2/1/GPM/2017/9590300).
Conflicts of Interest
The authors declare no conflict of interest.
Appendix A
Appendix A1. Organisation Profile
Please state clearly:
1. Name of Organisation: ………………………………………………………………………….
2. Full Address: ……………………………………………………………………………………
3. Telephone Number: …………………………
4. E-mail Address of Company: …………………………………………………….
5. Number of Years in Operation: ……………… year(s).
6. Number of Full Time Employees (40 working hours per week): …………………
7. Number of employees based on ethnic groups: Malay ………… Chinese……… India……. Others…….
8. Number of total executive level employees: ……………Number of female executives: ………………
9. Total company revenue: 2016: RM……………….. 2017: RM………………..
10. Total net income: 2016: RM…………………2017: RM………………..
11. Total of shareholders’ capital: 2016: RM………………… 2017: RM…………………
12. Total electricity consumption: 2016: RM…………………2017: RM..………………
13. Total industry waste 2016: ……………….Metric tonnes. 2017:………………. Metric tonnes.
14. Number of industrial accident reported (source: SOCSO): 2016: ………………2017:..…………….
Appendix A2. Respondent’s Profile
1. Name: ………………………………………………………………………………………..
2. Current position in the Organisation: ……………………………………………………………….
3. Number of years spent working in your organisation: ……………… years
4. Number of subordinates directly report to you: ………………………………
5. Contact information:
Phone No.: ……………………..
Fax No.: ………………………
E-mail: ………………………
Please indicate the level of your agreement with each of the following statements by ticking the relevant box. Please use SA for strongly agree, A for agree, N for neither agree nor disagree, D for disagree and SD for strongly disagree.
I am involved in:
SA A N D SD
5. Planning my organisation’s Performance Measurement Model (PMM)

6. Designing my organisation’s PMM
7. Analysing the results of the PMM
Appendix A3. Organization’s Critical Success Factors
(A) Organizational Learning Culture
SA A N D SD
1. My organisation ensures all employees understand the SPMs.
2. In my organization, employees’ understanding of the organization’s SPMs is high.
3. Employees are given the opportunity to learn about the SPM s
(e.g., courses, training and seminars in my organization).
4. Employees are given the opportunity to practise the SPMs
5. My organization does not fully utilise its expertise.
6. My organization has enough expertise to cope with changes in the environment.
7. The basic values of our Organisation include learning as a key to improvement.
8. Key personnel in my organization involved in the performance reporting.
9. Plenty of employees in my organization involved in the performance reporting process.
10. Decision making in my organizational performance reporting process is always formal.
11. Decision making in my organizational performance reporting process is always transparent.
(B) Advancement of Technology
SA A N D SD
1. My organisation’s products are complex in nature.
2. My organisation is innovative in expanding the product range.
3. My organisation produces a high number of standardised products.
4. My organization’s products are combine of number of parts or components.
5. Mass/line production.
6. Jobbing production (i.e., unique, customised products).
7. My organization’s production is capital intensive rather than Labour intensive
(C) Globalization
SA A N D SD
1. My Organisation frequently (i.e. semi-annually or quarterly) changes its marketing practices such as advertisements.
2. Products are becoming obsolete at a very high rate in the industry.
3. Our competitors’ actions are unpredictable.
4. Threat of new entrants/competitors is high
5. Customer demand change unpredictably.
6. Consumer tastes change unpredictably.
7. My organisation engages heavily on international trade
(e.g., International export and import business)
8. My organization has close collaboration with foreign company on various aspects
(e.g., product development, technology transfer)
9. The major customers of my company are from western countries particularly US, UK and EU.
(D) Pressure from Stakeholders
SA A N D SD
1. Rules and regulations in my country are business friendly.
2. Rules and regulations in my country are environmental and social friendly.
3. Increasing mandatory rules for environmental and social compliance.
4. My country is deem moderately freedom in doing business
(Easy to start business, obtain license and close business)
5. My organisation only considers shareholders’ interests.
6. My organisation considers wide range of stakeholders’ interest
(e.g., employees, government, pressure group, media)
7. Growing pressure from stakeholders’ demands upon my organizational strategies and goals.
8. Employee has influenced my organizational strategies and Goals
(e.g., employee unions)
9. Government has influenced my organizational strategies and goals
(e.g., green tax incentives, grant and subsidies)
10. Pressure groups/NGOs have influenced my organizational strategies and goals
(e.g., reputation, pressure on government’ policies)
11. Media has influenced my organizational strategies and goals
(e.g., reputation, branding)
Appendix A4. Characteristics and Outcomes of Sustainable Performance Measurements (SPMs) Model
(A) Economic Indicators
To what extent the following activities/practices/initiatives are perceived to be IMPORTANT to your company?
SA A N D SD
1. New product introduction for bigger market share
2. Cost cutting initiatives
3. Employees’ welfare investments
4. Follow governmental policy/initiatives
Economic Outcomes
To what extent the following outcomes are ACHIEVED/USED by your company?
Large Cetain Not Limited Not
extent extent Sure extent at all
1. Revenue
2. Net Profit
3. Earning-per share
4. Employee monetary remunerations
(e.g., Wage, salary, leave pay, bonus, allowance, commission)
5. Employee benefits
(e.g., Medical, dental, child-care, leave passages, accommodation, transportation, meal)
6. Taxes paid to LHDN (Inland Revenue Board)
7. Taxes breaks/relief from LHDN (Inland Revenue Board)
8. Subsidies and grants received from Government
9. Tax incentives, grant and subsidises received on environmental initiative
(e.g., renewable sources, energy conservation, green building index)
10. Tax incentives, grant and subsidises received on social initiative
(e.g., donation, employee training and participation in local communities)
Environment indicators
To what extent the following activities/practices/initiatives are perceived to be IMPORTANT to your company?
SA A N D SD
1. Resources efficiency/productivity
(e.g., energy and material consumption)
2. Renewable resources intensity
(e.g., solar, wind, biomass, hydro)
3. Resources reuse and recycle
(e.g., energy/material recycle and reuse)
4. Waste management intensity
(e.g., landfill waste and scrap)
5. Pollutions/emission intensity
(e.g., CO2)
6. Investment on awareness and protection on environmental sustainability
(e.g., training, rule and third parties verification)
Environment Outcomes
To what extent the following outcomes are ACHIEVED/USED by your company?
Large Cetain Not Limited Not
Extent Extent Sure Extent at All
1. Sales per unit of energy consumption
(e.g., high energy usage vs. low energy usage)
2. Sales per unit of primary material input
(e.g., high raw material usage vs. low raw material usage)
3. Percentage of renewable energy consumption
4. Percentage of renewable material used as input to production
5. Percentage of reused component per product
6. Percentage of recycled material used as input to production
7. Percentage of energy reuses/recycles
8. Kg industry waste per unit of sale
9. Scrap per unit of sale
10. Tons of CO2 emissions per unit of sale
11. Tons of CO2 emissions per unit of electricity
12. Training and course on environmental awareness
13. Rule and regulation on environmental protection
14. Third parties verification and certificate on environmental Protection and initiatives
Social indicators
To what extent the following activities/practices/initiatives are perceived to be IMPORTANT to your company?
SA A N D SD
1. Labour/employment issues
(e.g., health and safety, training and development, industrial relations)
2. Employee productivity
(e.g., Revenue/Operating profit per employee)
3. Employee equality
(e.g., gender, ethnic equality)
4. Customer satisfaction
(e.g., complaint from customer)
5. Community initiatives and corporate philanthropy
(e.g., donation)
Social Outcomes
To what extent the following outcomes are ACHIEVED/USED by your company?
Large Cetain Not Limited Not
Extent Extent Sure Extent at All
1. Number of industrial accident (source: SOCSO)
2. Employees participation in training and development programs
3. Commitment of in-house union in safeguarding employees’ interests
4. Average years of service
5. Revenue per employee
6. Operating profit per employee
7. Percentage of women in upper management
8. Equal staff profile according to ethnic groups
9. Size of market share
10. Compliant from customer
11. Donations and grant programs
12. Enhancing community skill and infrastructure facilities
13. Involvement and sponsoring community programs
The copyright of above questionnaires belongs to BOON HENG TEH & TZE SAN ONG
If you have any queries, kindly email or contact us
References
- MITI. Fact Sheet. 2012. Available online: http://www.miti.gov.my/index.php/pages/view/2497 (accessed on 5 January 2017).
- Bloomberg 2011. Available online: https://www.bloomberg.com/news/articles/2011-03-07/lynas-s-nick-curtis-builds-fortune-with-bet-on-rare-earths (accessed on 18 February 2017).
- Mining Weekly. 2012. Available online: http://www.miningweekly.com/article/australia-imposes-mining-tax-after-two-year-battle-2012-03-19 (accessed on 28 June 2017).
- Stede, W.A.V.D. How to become sustainable. MIA Account. Today 2010, 23, 32–34. [Google Scholar]
- Mandelbaum, D.G. Corporate Sustainability Strategies. Temple J. Sci. Technol. Environ. Law 2007, 26, 27–42. [Google Scholar]
- GRI. 2010. Available online: https://www.globalreporting.org (accessed on 19 September 2017).
- ASR (Asian Sustainability Rating). Sustainability in Asia, ESG Reporting Uncovered; Responsible Research; Asian Sustainability Rating: Singapore, 2010; p. 14. [Google Scholar]
- MIDA, Malaysian Industrial Development Authority. 2014. Available online: www.mida.gov.my/home/electrical-and-electronic/posts/ (accessed on 28 September 2017).
- Khalifah, A.N.; Jaafar, Z.; Adam, R. Processing Trade, Exporting and Efficiency of Establishments in Malaysia’s E&E Industry. In Proceedings of the 13th International Convention of the East Asian Economic Association Grand Copthorne Hotel, Singapore, 19–20 October 2012. Convention Theme. [Google Scholar]
- Hart, S. A natural-resource-based view of the firm. Acad. Manag. Rev. 1995, 20, 986–1014. [Google Scholar] [CrossRef]
- Epstein, M.J. Making Sustainability Work: Best Practices in Managing and Measuring Corporate Social, Environmental, and Economic Impacts; Greenleaf Publishing: Sheffield, UK, 2008. [Google Scholar]
- Lecy, J.D.; Schmitz, H.P.; Swenlund, H. Non-Governmental and not-for-profit organizational effectiveness: A modern synthesis. Voluntas Int. J. Volunt. Non-Profit Organ. 2012, 23, 434–457. [Google Scholar] [CrossRef]
- Bobe, C.M.; Dragomir, V.D. The sustainability policy of five leading European retailers. Account. Manag. Inf. Syst. 2010, 9, 268–283. [Google Scholar]
- Hockerts, K. Eco-efficient service innovation: Increasing business-ecological efficiency of products and services. In Charter M., Greener Marketing: A Global Perspective on Greener Marketing Practice; Greenleaf Publishing: Sheffield, UK, 1999; pp. 95–108. [Google Scholar]
- Dyllick, T.; Hockerts, K. Beyond the business case for corporate sustainability. Bus. Strategy Environ. 2002, 11, 130–141. [Google Scholar] [CrossRef]
- Owen, G. Integrated reporting: A review of developments and their implications for the accounting curriculum. Account. Educ. 2013, 22, 340–356. [Google Scholar] [CrossRef]
- Tencati, A. 24 Corporate Reporting. In A Handbook of Corporate Governance and Social Responsibility; Gower Publishing: New York, NY, USA, 2016; p. 413. [Google Scholar]
- Burritt, R.L.; Hahn, T.; Schaltegger, S. Towards a comprehensive framework for environmental management accounting: Links between business actors and environmental management accounting tools. Aust. Account. Rev. 2002, 12, 39–50. [Google Scholar] [CrossRef]
- Székely, F.; Knirsch, M. Responsible leadership and corporate social responsibility: Metrics for sustainable performance. Eur. Manag. J. 2005, 23, 628–647. [Google Scholar] [CrossRef]
- Perrini, F.; Tencati, A. Sustainability and Stakeholder Management: The Need for New Corporate Performance Evaluation and Reporting Systems. Bus. Strategy Environ. 2006, 15, 296–308. [Google Scholar] [CrossRef]
- Onyali, C.I.; Okafor, T.G.; Benjamin, O. Effectiveness of triple bottom-line disclosure practice in Nigeria-Stakeholders perspective. Eur. J. Account. Audit. Finance Res. 2015, 3, 45–61. [Google Scholar]
- Deloitte CFO Insights. Sustainability: Developing Key Performance Indicators, Measuring Sustainability Is the Bottom Line. 2009. Available online: www.deloitte.com/us/cfocenter (accessed on 14 October 2016).
- Jones, P.; Comfort, D.; Hillier, D. Corporate social responsibility and the UK’s top ten retailers. Int. J. Retail Distrib. Manag. 2005, 33, 882–892. [Google Scholar] [CrossRef]
- Fauzi, H.; Idris, K.M. The relationship between CSR and financial performance: New evidence from Indonesia Companies. Issues Soc. Environ. Account. 2009, 3, 66–87. [Google Scholar] [CrossRef]
- Erol, I.; Sencer, S.; Sari, R. A new fuzzy multi-criteria framework for measuring sustainability performance of a supply chain. Ecol. Econ. 2011, 70, 1088–1100. [Google Scholar] [CrossRef]
- Buchholz, R. Principles of Environmental Management: The Greening of Business; Prentice Hall: Englewood Cliffs, NJ, USA, 1993. [Google Scholar]
- Welford, R. Cases in Environmental Management and Business Strategy; Pitman: London, UK, 1994. [Google Scholar]
- Jaffe, A.B.; Peterson, S.R.; Portney, P.R.; Stavins, R.N. Environmental regulations and the competitiveness of U.S. manufacturing. What does the evidence tell us? J. Econom. Lit. 1995, 33, 132–163. [Google Scholar]
- Porter, M.; Van der Linde, C. Green and competitive: Ending the stalemate. Harv. Bus. Rev. 1995, 73, 120–134. [Google Scholar]
- King, A.A.; Lenox, M.J. Does it really pay to be green? An empirical study of firm environmental and financial performance. J. Ind. Ecol. 2001, 5, 105–116. [Google Scholar] [CrossRef]
- Schaltegger, S.; Synnestvedt, T. The link between ‘green’ and economic success: Environmental management as the crucial trigger between environmental and economic performance. J. Environ. Manag. 2002, 65, 339–346. [Google Scholar]
- Jayanti, R.K.; Gowda, M.R. Sustainability dilemmas in emerging economies. IIMB Manag. Rev. 2014, 26, 130–142. [Google Scholar] [CrossRef] [Green Version]
- Wyeth, G.B.; Nulkar, G. Sustainability in emerging markets: Evidence from India. Sustain. J. Record 2014, 7, 109–115. [Google Scholar] [CrossRef]
- Manrique, S.; Martí-Ballester, C.P. Analyzing the effect of corporate environmental performance on corporate financial performance in developed and developing countries. Sustainability 2017, 9, 1957. [Google Scholar] [CrossRef]
- Burgess, T.F.; Ong, T.S.; Shaw, N.E. Traditional or contemporary? The prevalence of performance measurement system types. Int. J. Product. Perform. Manag. 2007, 56, 583–602. [Google Scholar] [CrossRef]
- Saxena, R.; Khandelwal, R.K. Can Green Marketing be used as a tool for Sustainable Growth? A Study Performed on Consumers in India- An Emerging Economy. Int. J. Environ. Cult. Econ. Soc. Sustain. 2010, 6, 277–291. [Google Scholar] [CrossRef]
- Chenhall, R.H.; Langfield-Smith, K. Multiple perspectives of performance measures. Eur. Manag. J. 2007, 25, 266–282. [Google Scholar] [CrossRef]
- Rejc, A. Toward contingency theory of performance measurement. J. East Eur. Manag. Stud. 2004, 9, 243–264. [Google Scholar] [CrossRef]
- Betts, T.K.; Wiengarten, F.; Tadisina, S.K. Exploring the impact of stakeholder pressure on environmental management strategies at the plant level: What does industry have to do with it? J. Clean. Prod. 2015, 92, 282–294. [Google Scholar] [CrossRef]
- Donaldson, T.; Preston, L.E. The stakeholder theory of the corporation: Concepts, evidence, and implications. Acad. Manag. Rev. 1995, 20, 65–91. [Google Scholar] [CrossRef]
- Freeman, R. Strategic Management: A Stakeholder Approach; Pitman: Boston, MA, USA, 1984. [Google Scholar]
- Scholtens, B. A note on the interaction between corporate social responsibility (CSR) and financial performance. Ecol. Econ. 2008, 68, 46–55. [Google Scholar] [CrossRef]
- Kitzmueller, M.; Shimshack, J. Economic perspectives on corporate social responsibility. J. Econ. Lit. 2012, 50, 51–84. [Google Scholar] [CrossRef]
- Ferreira, A.; Moulang, C.; Hendro, B. Environmental management accounting and innovation: An exploratory analysis. Accounting, Audit. Account. J. 2010, 23, 920–948. [Google Scholar] [CrossRef]
- Nayha, A.; Horn, S. Environmental sustainability–aspects and criteria in forest bio-refineries. Sustain. Account. Manag. Policy J. 2012, 3, 161–185. [Google Scholar] [CrossRef]
- Ilinitch, A.Y.; Soderstrom, N.S.; Thomas, T.E. Measuring corporate environmental performance. J. Account. Public Policy 1998, 17, 383–408. [Google Scholar] [CrossRef]
- Bartolomeo, M.; Bennettl, M.; Bouma, J.J.; Heydkamp, P.; James, P.; Wolters, T. Environmental management accounting in Europe: Current practice and potential. Eur. Account. Rev. 2000, 9, 31–52. [Google Scholar] [CrossRef]
- Marc, J.E. Implementing Corporate Sustainability: Measuring and Managing Social and Environmental Impacts. Strateg. Financ. 2008, 89, 24–31. [Google Scholar]
- John, M. Environmental sustainability: A definition for environmental professionals. J. Environ. Sustain. 2011, 1, 19–27. [Google Scholar]
- IFAC. International Guidance Document of EMA, IFAC. 2005. Available online: http://www.ifac.org (accessed on 23 September 2017).
- Hanson, J.D.; Melnyk, S.A.; Calantone, R.J. Core values and environmental management. Greener Manag. Int. 2004, 46, 29–40. [Google Scholar] [CrossRef]
- Govindarajulu, N.; Daily, B.F. Motivating employees for environmental improvement. Ind. Manag. Data Syst. 2004, 104, 364–372. [Google Scholar] [CrossRef]
- Gilbert, G.R.; Veloutsou, C.; Goode, M.M.H.; Moutinho, L. Measuring customer satisfaction in the fast food industry: A cross-national approach. J. Serv. Mark. 2004, 18, 371–383. [Google Scholar] [CrossRef]
- Ramus, C. Organizational support for employees: Encouraging creative ideas for environmental sustainability. Calif. Manag. Rev. 2001, 43, 85–105. [Google Scholar] [CrossRef]
- Kuo, Y.K. Organizational commitment in an intense competition environment. Ind. Manag. Data Syst. 2012, 113, 39–56. [Google Scholar] [CrossRef]
- Gadenne, D.; Mia, L.; Sands, J.; Winata, L.; Hooi, G. The influence of sustainability performance management practices on organisational sustainability performance. J. Account. Organ. Chang. 2012, 8, 210–235. [Google Scholar] [CrossRef]
- Maletič, M.; Maletič, D.; Gomišček, B. The impact of sustainability exploration and sustainability exploitation practices on the organisational performance: A cross-country comparison. J. Clean. Prod. 2016, 138, 158–169. [Google Scholar] [CrossRef]
- Wadongo, B.; Abdel-Kader, M. Contingency theory, performance management and organisational effectiveness in the third sector: A theoretical framework. Int. J. Product. Perform. Manag. 2014, 63, 680–703. [Google Scholar] [CrossRef]
- Kitazawa, S.; Sarkis, J. The relationship between ISO 14000 and continuous source reduction. Int. J. Oper. Prod. Manag. 2000, 20, 225–248. [Google Scholar] [CrossRef]
- Sita Nirmala Kumaraswamy, K.; Chitale, C.M. Collaborative knowledge sharing strategy to enhance organizational learning. J. Manag. Dev. 2012, 31, 308–322. [Google Scholar] [CrossRef]
- Chabowski, B.R.; Mena, J.A.; Gonzalez-Padron, T.L. The structure of sustainability research in marketing, 1958–2008: A basis for future research opportunities. J. Acad. Mark. Sci. 2011, 39, 55–70. [Google Scholar] [CrossRef]
- Jabar, J.; Soosay, C.; Santa, R. Organisational learning as an antecedent of technology transfer and new product development: A study of manufacturing firms in Malaysia. J. Manuf. Technol. Manag. 2011, 22, 25–45. [Google Scholar] [CrossRef]
- Luca, N.R.; Suggs, L.S. Strategies for the social marketing mix: A systematic review. Soc. Mark. Q. 2010, 16, 122–149. [Google Scholar] [CrossRef]
- Drejer, A. Integrating Product and Technology Development. Eur. J. Innov. Manag. 2004, 3, 125–136. [Google Scholar] [CrossRef]
- Figueiredo, P.N. Does technological learning pay off? Inter-firm differences in technological capability-accumulation paths and operational performance improvement. Res. Policy 2002, 31, 73–94. [Google Scholar] [CrossRef]
- Horbach, J. Determinants of environmental innovation—New evidence from German panel data sources. Res. Policy 2008, 37, 163–173. [Google Scholar] [CrossRef] [Green Version]
- Link, A.N.; Siegel, D.S. Unions and technology adoption: A qualitative analysis of the use of real-time control systems. J. Labour Res. 2002, 23, 615–630. [Google Scholar] [CrossRef]
- Slack, N.; Chambers, S.; Johnston, R. Chapter 8: Process Technology. Pearson Education: Operation Management (4th Ed.). Available online: http://wps.pearsoned.co.uk/ema_uk_he_slack_opsman _4/17/4472/1144941.cw/index.html (accessed on 18 February 2018).
- Dedhia, P.; Doshi, H.; Rane, M. Low Powered Solar ECG with ZigBee Based Bio-Telemetry. J. Technol. Innov. Renew. Energy 2012, 1, 23. [Google Scholar] [CrossRef]
- Teh, B.H.; Jaffar, N.; Ong, T.S. Sustainable Performance Measurement (SPMs) Model: Effects of Product Technology and Process Technology. Pertan. J. Soc. Sci. Hum. 2015, 23, 35–103. [Google Scholar]
- Zachary, M.A.; McKenny, A.; Short, J.C.; Payne, G.T. Family business and market orientation construct validation and comparative analysis. Fam. Bus. Rev. 2011, 24, 233–251. [Google Scholar] [CrossRef]
- Chung, J.E.; Huang, Y.; Jin, B.; Sternquist, B. The impact of market orientation on Chinese retailers’ channel relationships. J. Bus. Ind. Mark. 2011, 26, 14–25. [Google Scholar] [CrossRef]
- Hill, Wee and Udayasankar International Business: An Asian Perspective; Mcgraw-Hill: New York, NY, USA, 2012.
- Mourdoukoutas, P.; Mourdoukoutas, P. Bundling in a semi-global economy. Eur. Bus. Rev. 2004, 16, 522–530. [Google Scholar] [CrossRef]
- Hunt, S.D.; Madhavaram, S. Teaching Marketing Strategy: Using Resource-Advantage Theory as an Integrative Theoretical Foundation. J. Mark. Educ. 2006, 28, 93–105. [Google Scholar] [CrossRef]
- Sharma, S.; Henriques, I. Stakeholder Influences on Sustainable practices in the Canadian Forest Products Industry. Strateg. Manag. J. 2005, 26, 159–180. [Google Scholar] [CrossRef]
- Ahmad, N.N.N.; Sulaiman, M. Environmental disclosure in Malaysian annual report: A legitimacy theory perspectives. Int. J. Commer. Manag. 2004, 14, 44–58. [Google Scholar] [CrossRef]
- Carlman, I. The rule of sustainability and planning adaptivity. Sustain. Coastal Zone Manag. 2013, 34, 163–168. [Google Scholar] [CrossRef]
- ACCA Professional Accountant Paper P1 BBP Learning Media; BPP Learning Media: London, UK, 2010; Chapter 1; p. 56.
- Bursa Malaysia. Media Release. 2010. Available online: http://bursa.listedcompany.com/newsroom/Media_Release_ 23Nov2010.pdf (accessed on 5 April 2017).
- Hess, D.; Warren, D.E. The meaning and meaningfulness of corporate social initiatives. Bus. Soc. Rev. 2008, 113, 163–197. [Google Scholar] [CrossRef]
- Awang, Z. Structural Equation Modeling Using AMOS Graphic; Penerbit Universiti Teknologi MARA: Selangor, Malaysia, 2012. [Google Scholar]
- Rosen, M.A.; Kashawy, H.A. Sustainable Manufacturing and Design: Concepts, practices and needs. Sustainability 2012, 4, 154–174. [Google Scholar] [CrossRef]
- Heng, T.B.; Lee, C.L.; Foong, Y.P.; Ong, T.S. A framework of a sustainable performance measurements (SPMS) model for the Malaysian electronic and electrical industry. World Appl. Sci. J. 2012, 20, 107–119. [Google Scholar] [CrossRef]
- Ferreira, A.; Otley, D. Design and Use of Management Control Systems: An Analysis of the Interaction between Design Misfit and Intensity of Use; Working Paper; Chartered Institute of Public Finance and Accountancy (CIPFA): London, UK, 2010. [Google Scholar]
Figure 1.
The development of performance measurement models. Sources: Johnson and Kaplan, 1987; Kaplan, 1990; Schaltegger and Burritt, 2005; Burgess, Ong and Shaw 2007; Hess and Warren, 2008; Ong and Teh, 2009; Stede, 2010.
Figure 1.
The development of performance measurement models. Sources: Johnson and Kaplan, 1987; Kaplan, 1990; Schaltegger and Burritt, 2005; Burgess, Ong and Shaw 2007; Hess and Warren, 2008; Ong and Teh, 2009; Stede, 2010.

Figure 2.
Numbers of corporate sustainability reports from 1999–2014. Source: GRI (2015).

Figure 3.
Sustainable reporting by region in 2010. Source: GRI (2010).

Figure 4.
The research model.


Table 1.
Percentages of merchandise exports in Malaysia.
| Year | Commodities and Others | Manufacturers |
|---|---|---|
| 1970 | 92% | 8% |
| 1979 | 82% | 18% |
| 1991 | 39% | 61% |
| 2000 | 20% | 80% |
| 2009 | 22% | 78% |
| 2014 | 21% | 79% |
| 2015 | 20% | 80% |
| Jan–Sept 2016 | 17% | 83% |
Source: Department of Statistics, Bank Negara Malaysia and Economic Planning Unit (2016).
Table 2.
Operationalization of the research variables.
| Construct/Variables | Operationalization |
|---|---|
| Contingent Factors | |
| (1) Organizational Learning Culture (LC) | (1) Ensure employees understand SPMs |
| (2) Employees’ understanding of SPMs is high | |
| (3) Employee opportunity to learn SPMs | |
| (4) Employee opportunity to practice the SPMs | |
| (5) Company does not fully utilize its expertise | |
| (6) Company has enough expertise to cope with the changes | |
| (7) Learning as a key to improvement | |
| (8) Key personnel involved in performance reporting process | |
| (9) Plenty of employees involved in the performance reporting process | |
| (10) Performance reporting process is formal | |
| (11) Transparent performance reporting | |
| (2) Advancement of Technology (AT) | (1) Product complexity |
| (2) Expansion of product range | |
| (3) Standardized products | |
| (4) Utilization of parts or components | |
| (5) Mass/line production | |
| (6) Unique and customized products | |
| (7) Capital intensity | |
| (3) Globalization (GB) | (1) Frequency of changes in marketing practices |
| (2) Obsolescence of product | |
| (3) Unpredictability of competitors’ actions | |
| (4) High entrants of competitors | |
| (5) Unpredictable change in customer demand | |
| (6) Unpredictable change in consumer taste | |
| (7) Engagement in international trade | |
| (8) Collaboration with foreign companies | |
| (9) The major customers’ group target in Western countries | |
| (4) Pressure from Stakeholders (PS) | (1) Business-friendly rules and regulations |
| (2) Environmentally and socially friendly rules and regulations | |
| (3) Increased mandatory rules for environmental and social needs | |
| (4) Freedom in doing business | |
| (5) Consideration of shareholder interest | |
| (6) Consideration of a wide range of stakeholders’ interests | |
| (7) Growing pressure from stakeholders’ demands | |
| (8) Influence of employees | |
| (9) Influence of government | |
| (10) Influence of pressure groups | |
| (11) Influence of media | |
| Indicators of SPMs (SpamI) | |
| Economic Indicators (EcI) | (1) The revenue earned by the company |
| (2) The interest of the shareholders | |
| (3) The interest of the employees | |
| (4) The interest of the government | |
| Environment Indicators (EnI) | (1) The productivity of resources |
| (2) The intensity of renewable resources | |
| (3) Reuse or recycling of resources | |
| (4) Intensity of waste management | |
| (5) Intensity of pollution or omission | |
| (6) Investment in awareness and protection on environmental sustainability | |
| Social Indicators (SoI) | (1) The issue of labour or employment |
| (2) The productivity of employees | |
| (3) The equality of employees | |
| (4) Satisfaction of customer | |
| (5) Initiative on community and corporate philanthropy | |
| Control Variable | |
| Size | No. of full-time employees |
Table 3.
Sample size and response rate.
| Item | No. of Companies |
|---|---|
| The Electrical and Electronics Association of Malaysia (TEEAM) | 1600 |
| Federation of Malaysian Manufacturers (FMM) | 2135 |
| Final list from both TEEAM and FMM | 2212 |
| Selected sample size (50% of the final list) | 1106 |
| Received questionnaire | 255 |
| Final sample after filtering | 217 |
| Response rate based on final useable responses | 19.7% |
Table 4.
Levene’s test for equality of variance on the non-response bias.
| Variable | Response | Number of Cases | Mean | Standard Deviation | Std. Error Mean | Mean Difference |
|---|---|---|---|---|---|---|
| Organizational learning culture (LC) | Early | 130 | 3.748 | 1.111 | 0.133 | 0.088 |
| Late | 87 | 3.660 | 0.931 | 0.132 | ||
| Advancement of technology (AT) | Early | 130 | 3.710 | 1.073 | 0.123 | 0.061 |
| Late | 87 | 3.649 | 0.989 | 0.140 | ||
| Globalization (GB) | Early | 130 | 3.478 | 1.032 | 0.123 | 0.037 |
| Late | 87 | 3.441 | 0.941 | 0.133 | ||
| Pressure from stakeholders (PS) | Early | 130 | 3.579 | 0.925 | 0.111 | 0.036 |
| Late | 87 | 3.543 | 0.887 | 0.125 | ||
| Indicators of SPMs (SpmI) | Early | 130 | 3.970 | 0.982 | 0.115 | 0.046 |
| Late | 87 | 3.924 | 0.956 | 0.110 |
Table 5.
Companies profile based on location, ownership, age and size.
| Frequency | Percentage (%) | ||
|---|---|---|---|
| Location | Klang Valley | 135 | 62.2 |
| Non-Klang Valley | 82 | 37.8 | |
| Total | 217 | 100.0 | |
| Ownership | Malaysian-owned | 149 | 68.6 |
| Joint-Venture | 34 | 15.7 | |
| Foreign-owned | 34 | 15.7 | |
| Total | 217 | 100.0 | |
| Age (Operational Year *) | New (≤10 years) | 63 | 29.0 |
| Middle (11 to 20 years) | 67 | 30.9 | |
| Old (>20 years) | 87 | 40.1 | |
| Total | 217 | 100.0 | |
| Size (No. of employees *) | Small (≤74 full-time employees) | 113 | 52.1 |
| Medium (75 to ≤200 full-time employees | 36 | 16.6 | |
| Large (≥200 employees) | 68 | 31.3 | |
| Total | 217 | 100.0 | |
Note: * Categorization is based on the guidelines provided by the National SME Development Council (NSDC).
Table 6.
Descriptive statistics of the research variables.
| Ref | Central Tendency | Variability | Others | ||||||
|---|---|---|---|---|---|---|---|---|---|
| Mean | Median | Mode | S.D. | Variance | Range | Minimum | Maximum | ||
| Factors Influencing SPMs # | |||||||||
| (1) Organisational Learning Culture | LC | 3.71 | 4 | 4 | 0.98 | 0.97 | 4 | 1 | 5 |
| (2) Advancement of Technology | AT | 3.63 | 4 | 4 | 0.98 | 0.96 | 4 | 1 | 5 |
| (3) Globalization | GB | 3.45 | 3 | 3 | 1.02 | 1.03 | 4 | 1 | 5 |
| (4) Pressure from stakeholders | PS | 3.55 | 4 | 4 | 1.10 | 1.20 | 4 | 1 | 5 |
| Indicators of SPMs * (SpmI) | |||||||||
| (1) Economic Indicators | EcI | 4.13 | 4 | 4 | 0.81 | 0.66 | 4 | 1 | 5 |
| (2) Environmental Indicators | EnI | 3.73 | 4 | 4 | 0.94 | 0.89 | 4 | 1 | 5 |
| (3) Social Indicators | SoI | 4.08 | 4 | 4 | 0.82 | 0.67 | 4 | 1 | 5 |
Note: S.D. refers to standard deviation; # (1 = strongly disagree, 5 = strongly agree); * (1 = not at all, 5 = large extent).
Table 7.
Reliability test.
| Construct | Pre-Fitness Adjustment | Post-Fitness Adjustment | ||||
|---|---|---|---|---|---|---|
| Cronbach Alpha | CR | AVE | Cronbach Alpha | CR | AVE | |
| Factors influencing SPMs | ||||||
| Organizational Learning Culture (LC) | 0.823 | 0.976 | 0.434 | 0.928 | 0.969 | 0.656 |
| Advancement of Technology (AT) | 0.788 | 0.973 | 0.428 | 0.840 | 0.946 | 0.706 |
| Globalization (GB) | 0.720 | 0.969 | 0.381 | 0.826 | 0.933 | 0.508 |
| Pressure form stakeholders (PS) | 0.923 | 0.989 | 0.542 | 0.929 | 0.953 | 0.648 |
| Indicators of SPMs (SpmI) | ||||||
| Indicators of SPMs (SpmI) | 0.777 | 0.976 | 0.557 | 0.865 | 0.975 | 0.567 |
| Economic (EcI) | 0.572 | 0.954 | 0.368 | 0.725 | 0.971 | 0.508 |
| Environment (EnI) | 0.785 | 0.978 | 0.467 | 0.861 | 0.974 | 0.563 |
| Social (SoI) | 0.607 | 0.938 | 0.237 | 0.703 | 0.964 | 0.531 |
Note: The accepted criteria are: Cronbach Alpha > 0.7; CR > 0.6; AVE > 0.5.
Table 8.
Correlation matrix.
| LC | AT | GB | PS | SpmI | |
|---|---|---|---|---|---|
| LC | 1.000 | ||||
| AT | 0.635 | 1.000 | |||
| GB | 0.595 | 0.556 | 1.000 | ||
| PS | 0.603 | 0.550 | 0.528 | 1.000 | |
| SpmI | 0.242 | 0.485 | 0.378 | 0.466 | 1.000 |
Table 9.
Comparison of the fit statistics between the initial and modified measurement model.
| Fit Statistics | Initial Measurement Model | Modified Measurement Model |
|---|---|---|
| Chi-square (χ2) | 4210.438 | 548.099 |
| Degree of Freedom (df) | 1363 | 259 |
| P-Value | 0.000 | 0.000 |
| RMSEA | 0.098 | 0.072 |
| GFI | 0.543 | 0.840 |
| AGFI | 0.502 | 0.799 |
| CFI | 0.622 | 0.903 |
| TLI | 0.603 | 0.888 |
| NFI | 0.530 | 0.833 |
| x2/df | 3.089 | 2.116 |
Note:P value = 0.000, RMSEA = below 0.08, GFI, AGFI, CFI, TLI, NFI = either one above 0.9, χ2/df = below 5.
Table 10.
Regression result.
| Coefficients | Standard Error | Critical Ratio (C.R.) | P Value | |||
|---|---|---|---|---|---|---|
| SpmI | <--- | LC | 0.017 | 0.193 | 0.087 | 0.930 |
| SpmI | <--- | AT | −0.299 | 0.142 | −2.104 | 0.104 |
| SpmI | <--- | GB | 0.454 | 0.112 | 4.056 | 0.000 *** |
| SpmI | <--- | PS | 0.580 | 0.166 | 3.511 | 0.000 *** |
| SpmI | <--- | Size | 0.003 | 0.073 | 1.563 | 0.118 |
Note: *** = p < 0.001; R2 = 0.704.
© 2019 by the authors. Licensee MDPI, Basel, Switzerland. This article is an open access article distributed under the terms and conditions of the Creative Commons Attribution (CC BY) license (http://creativecommons.org/licenses/by/4.0/).
Share and Cite
MDPI and ACS Style
Ong, T.S.; Teh, B.H.; Lee, A.S. Contingent Factors and Sustainable Performance Measurement (SPM) Practices of Malaysian Electronics and Electrical Companies. Sustainability 2019, 11, 1058. https://doi.org/10.3390/su11041058
AMA Style
Ong TS, Teh BH, Lee AS. Contingent Factors and Sustainable Performance Measurement (SPM) Practices of Malaysian Electronics and Electrical Companies. Sustainability. 2019; 11(4):1058. https://doi.org/10.3390/su11041058
Chicago/Turabian StyleOng, Tze San, Boon Heng Teh, and Ah Suat Lee. 2019. "Contingent Factors and Sustainable Performance Measurement (SPM) Practices of Malaysian Electronics and Electrical Companies" Sustainability 11, no. 4: 1058. https://doi.org/10.3390/su11041058
Note that from the first issue of 2016, this journal uses article numbers instead of page numbers. See further details here.