1. Introduction
With fast-growing tourism demands, tourism-related sectors have played a dominant role in the economic systems of most developed and developing countries [
1,
2]. Global tourist arrivals have increased at an average annual rate of approximately 4% during the past two decades and will grow at a 3.3% annual rate from 2010 to 2030, reaching 1.8 billion visits in 2030 [
3]. Global tourism income was 5.3 trillion dollars (with the corresponding annual growth rate of 5.5%) in 2017, which accounted for 6.7% of the global gross domestic product (GDP) [
4]. Despite their vital role in the economy, tourism sectors present an environmental concern, accounting for a massive amount of CO
2 emissions [
5]. According to a report [
6], tourism sectors were responsible for 5% of the global CO
2 emissions in 2005, with the transportation (representing 75% of tourism CO
2 emissions) and accommodation sectors (21%) the leading contributors. From 2005 to 2035, global tourism-related emissions are expected to at least double [
6,
7]. Against such a background, the economic benefit and environmental pollution of tourism should be carefully balanced for a high-income and low-emission development of the tourism industry.
As the largest global tourist source country, China’s tourism has grown exponentially and is now three times that of global international tourist arrivals [
8]. In 2017, there were 5 billion domestic tourists and 270 million international tourists in China; by contrast, the United Nations World Tourism Organization (UNWTO) recorded 1.32 billion global international arrivals in 2017 [
4,
9]. As the capital of China, Beijing is extremely rich in tourism resources, including six world heritage sites and more than 200 tourism sites [
10]. Statistics show that the total tourist arrivals in 2013 in Beijing were 252 million, of which over 98% were domestic [
11]. The tourism receipts grew to 396.32 billion yuan in 2013, which accounted for 20.02% of the GDP of Beijing, indicating that tourism has become one of the cornerstone industries supporting Beijing’s economy. However, to support the economic benefits of the tourism industry, Beijing has also consumed substantial amounts of energy, consequently resulting in high CO
2 emissions. For example, the CO
2 emissions of the tourism industry in Beijing totalled 25.91 million tons of standard coal equivalent in 2012, which accounted for 25.70% of the total CO
2 emissions in Beijing [
12]. In this context, a full understanding of Beijing’s tourism industry is an indispensable and significant task. However, research on the tourism industry in China is still insufficient, especially research on Beijing’s tourism industry. Thus, this paper first attempts to analyse the tourism industry in Beijing, particularly the balance between tourism’s economic benefit and environmental pollution.
There are numerous studies that have fully investigated tourism’s economic benefit and the environmental pollution of the tourism industry. On the one hand, the existing studies have fully observed that for the overall economic system, a growth in tourism could create prosperity, such as that experienced in Spain [
13], Turkey [
14], Malaysia [
15], Bulgaria, Romania and Slovenia [
16], Taiwan [
17], Korea [
18], OECD countries [
19] and four pacific island countries [
20]. On the other hand, previous studies have also supported that the tourism sectors may have an adverse effect on the environment in the form of CO
2 emissions [
21,
22], particularly the transportation sector [
23,
24,
25], catering and accommodation [
21,
26,
27]. Concurring with this view, the negative effect of tourism benefit, i.e., the tourist-related increase in CO
2 emissions has been reported for a number of countries, including China [
28,
29], New Zealand [
26,
30], Norway [
31], Australia [
32], Sweden [
33], and in 14 Caribbean countries [
34]. Although there are numerous studies that have explored the economic or environmental impacts of tourism, to the best of our knowledge studies regarding the relationships between the economic benefit and CO
2 emissions from tourism in Beijing are still lacking. Therefore, this paper intends to fill in this literature gap and to analyze tourism in Beijing from the two perspectives of economic and environmental impacts.
Accordingly, to investigate the tourism industry, some effective analysis methods used in prior studies have been employed. The existing research methods can be classified into top-down and bottom-up approaches [
8]. The top-down approaches for tourism include input–output (IO) models [
35,
36] and computable general equilibrium (CGE) modelling [
32]. The bottom-up approaches have included a life cycle assessment [
29,
37] and a carbon footprint approach [
8,
38]. In general, the bottom-up approach is best suited for small regions, and the top-down approach is suited to analyze tourism as a sector within a comprehensive national economic system [
36]. Regarding to the top-down approaches, the CGE model can be seen as extended IO model, however, the basis of a CGE model, i.e., creating a social accounting matrix (SAM), is cost- and time-consuming [
39]. Moreover, the indirect impacts are not calculated separately in the CGE model [
39,
40]. In comparison, the IO model is compiled based on the hybrid physical-monetary IO tables that are published by the National Statistics Bureau [
41], and it can be relatively easily to compute the cumulative economic benefit [
42] and energy inputs [
43] of sectors related to the tourism industry in a fairly accurate way regardless of the length and complexity of the production process. Besides, the IO model can be effectively used in computing carbon dioxide emissions for the tourism industry, including direct and indirect emissions [
5,
35,
36,
42]. In this context, this paper employs the IO model to investigate the economic benefit and CO
2 emissions of the tourism industry in Beijing. In regard to the IO framework, the tourism sector should be subdivided from the IO table [
35]. In particular, most scholars introduce the tourism satellite account (TSA) into the IO model [
35,
36]. As an important system boundary method, the TSA can be applied to connect the tourism industry and the tourism-related economic industries in the national economic accounting system [
44]. Therefore, to explore the balance between tourism’s economic benefit and CO
2 emissions in Beijing, we introduce this promising tool, i.e., the TSA, into IO modelling.
Generally, the main aim of this study is to probe tourism’s economic benefit and CO2 emissions in Beijing. In particular, it is to provide a comprehensive analytical framework for a regional tourism account, we finely couple the IO model and the TSA approach. Compared with existing studies, this study makes major contributions from the following three perspectives:
(1) In this study, a top-down method (IO model) with a tourism satellite account (TSA) is used to propose a comprehensive analytical framework for a regional tourism account.
(2) The proposed approach can be used to investigate tourism’s economic benefit and environmental pollution, thereby revealing the balance between these two aspects.
(3) This paper is the first attempt to analyse Beijing’s tourism industry by balancing its economic benefit and CO
2 emissions based on the latest data (e.g., China’s IO table 2007–2012 in the case of China) [
45]. Based on the empirical study, the effective policies can be provided to help promote the high-income and low-emissions development of the tourism industry.
The remainder of this paper is organized as follows.
Section 2 describes the formulation process of the proposed methodology. The empirical results are reported and discussed in
Section 3.
Section 4 concludes the paper and outlines major directions of future research.
2. Methodology
In this section, a combined TSA and IO model is formulated not only to (1) calculate the economic benefit and environmental pollution of tourism sectors in Beijing but also to (2) explore the balance between those two aspects. Accordingly, as illustrated in
Figure 1, the analytical framework includes four components: system boundary setting, economic benefit estimation, environmental pollution estimation and policy analysis.
Step 1: System boundary setting
To perform the following analysis on the tourism industry (step 2–step 4), a critical step is to define clear system boundaries for the components addressed. Currently, there is no special tourism economic accounting system in China; therefore, in order to calculate the balance between the economic benefit and environmental pollution in the tourism industry, we need to establish a TSA to separate “tourism” from traditional sectors used for independent accounting. Therefore, in the first step, we establish an independent TSA and then merge or split the traditional industries again, with each industry’s scope based on research objectives and data availability; we then use the IO tables to establish the relationship between sectors.
Step 2: Economic benefit estimation
The second step of the analysis focuses on the tourism industry’s economic benefit estimation, enabling the determination of the linkages between the sectors and the identification of the key economic sectors. Accordingly, based on the TSA and IO approach, a tourism income analysis, a sectoral multiplier analysis and an inter-sector linkage analysis are implemented to analyse the key tourism sectors in the economy and to identify whether their interaction with other sectors may enhance economic growth. First, this paper calculates the tourism income in the sample period to reveal the income trends across sectors. Second, the sectoral multiplier analysis is introduced to assess the direct effect of a variable and its total (direct and indirect) effect on the economy. Third, the inter-sector linkage analysis is employed to examine the interdependence between tourism and other economic sectors and to further assess and identify the key tourism economic sectors in the economy.
Step 3: Environmental pollution estimation
The third step of the analysis process is to calculate the direct and indirect environmental effects based on the results of economic analysis. In this step, the combined TSA and IO model is adopted. Based on the tourism income and IO data, the direct and indirect CO
2 emissions of the tourism industry can be calculated. First, the direct and total CO
2 emissions can be obtained by using the Intergovernmental Panel on Climate Change (IPCC) approach [
46]. Second, the indirect CO
2 emissions can be measured by the result of subtraction between these two parts. Then, the leading CO
2 emissions emitters that contribute to the environmental pollution in the tourism industry can be clarified.
Step 4: Policy analysis
The last step of the analysis process is to investigate the balance between economic benefit and environmental pollution in the tourism industry. Accordingly, the total CO2 emissions intensity, which indicates the total CO2 emissions caused by the final products or services by production unit, is applied to comprehensively measure the economic and environmental effect of the tourism industry. By analysing the CO2 emissions intensity change in the sample period, the key tourism sectors, which are responsible for robust economic growth and the significant decrease in CO2 emissions, can be identified. With the above valuable information, insightful suggestions can be deduced for the policymakers to design specific, targeted mitigation policies that enhance the low carbon development of the tourism industry.
For a clear understanding, the details of the system boundaries for the tourism sectors are introduced in
Section 2.1. The economic benefit estimation, including sectoral multipliers and an inter-sector linkage analysis, are described in
Section 2.2. The environmental pollution estimation, i.e., the direct and indirect CO
2 emissions assessment, is presented in
Section 2.3.
Section 2.4 contains the policy analysis in terms of the total CO
2 emissions intensity.
2.1. System Boundaries for the Tourism Sectors
System boundary setting was an important step before the specific analysis was conducted. Currently, most related studies have only considered the CO
2 emissions directly generated by tourists in their tourism activities but have ignored the indirect CO
2 emissions generated from the production, manufacturing, and the tourism management authority activities involved in the normal operations of the tourism industry. This has been mainly due to the certain difficulties in research boundaries, research methods and the data samples. Second, there is no academic standard available to include/exclude various tourism sub-sectors in calculations; rather, each study specifies sub-sectors based on its research objectives and data availability [
7]. Thus, this study adopts the system boundary complying with the existing studies [
35,
36], which used the consumption scope of the tourism satellite account (TSA) and the calculation approach of the input–output (IO) model to trace the direct and indirect CO
2 emissions. The consumption items covered in the TSA and the tourism sectors in the IO model specify the system boundaries. The corresponding relationship is as follows in
Table 1.
For the tourism consumption items in the TSA, the principle of the Kyoto Protocol specifies that geographic territory determines carbon dioxide responsibility [
46]; therefore, this study only considers tourist activities that occur within a domestic region and addresses CO
2 emissions associated with domestic tourism consumption, inbound tourism consumption, and tourism consumption incurred domestically in relation to outbound travel and airfare paid to the national carriers. In particular, consistent with the definition of tourism consumption items by the TSA [
47], the consumption categories of tourists include transportation, shopping, accommodation and food, entertainment, sightseeing, postal service and telecommunications, and other services.
The tourism sectors in the IO model, which correspond to the tourism sectors of the TSA, should be delimited to estimate the level of the CO
2 emissions effects [
35,
36,
43]. Based on data availability and consistency, the tourism industry in the IO model is divided into seven sectors, including the following: (1) transportation and warehousing; (2) wholesale and retail; (3) accommodation and the catering industry; (4) culture, sports and entertainment; (5) water resources, environment and public facilities management; (6) the postal service, information transmission, computer services and the software financial sector; and (7) the real estate industry, leasing and business services, residents’ services and other services.
2.2. Economic Benefit Estimation
With the aim of analysing the significance and impact of the tourism sector in Beijing from the economic benefit perspective, a top-down method, i.e., the IO model [
48], was adopted. Using this methodology, the economic role of the tourism sector along with its “direct effects” on the economy and its “indirect effects” on other economic sectors can be comprehensively investigated.
In the IO analysis, the total output in the economy (
) can be expressed as the sum of the output for intermediary consumption of different sectors (
) and the final demand (
). The economy’s direct consumption coefficient matrix (
) can be calculated by the ratio between the matrix of inter-industry flows (
) and the total output (
), where
can be expressed as
. The technical coefficient
can be defined as the direct consumption of sector
j by unit input of sector
j [
48].
where
is the total input of sector
j.
represents the intermediate input from sector
i to sector
j in the monetary unit.
The solution to this equation gives the total output necessary to meet the final demand:
where
is the identity matrix and
is the inverse Leontief matrix.
is the element of the inverse Leontief matrix
, which indicates the direct and indirect effects on the output of each sector from an increase in sales of one unit to the final demand by sector
j. Each element of this inverse matrix denoted by
is called an interdependence coefficient that measures the total stimulus to the gross output of sector
i when the final demand of sector
j changes by on unit. Therefore, the output multiplier for sector j is given by the column sum of
, which can be calculated by [
49]:
Furthermore, the IO model allows for other indicators, highlighting the linkages, such as the Hirschman–Rasmussen backward and forward linkage indices, between sectors and the power of each sector in the economy [
50]. Accordingly, the forward linkage index is used to identify how much of its output is demanded by other sectors, and the backward linkage index measures how much a sector demands from other sectors in the economy.
To calculate the Hirschman–Rasmussen backward and forward linkage indices,
is described as the elements of matrix
,
is defined as the average of all the elements of
, and
as the sum of a column of
. The backward linkage index (
) can be represented as [
51]:
As for the Hirschman–Rasmussen forward linkage index, it is calculated by the matrix of direct output coefficients (
), which is obtained from the intermediate consumption matrix (
). Each row of
is divided by the total output of the sector associated with that row (
), as represented in Equation (6).
Similar to the equation of inverse Leontief matrix, the Ghost matrix (
) can be described as:
Defining
as the average of all the elements of
and
as the sum of a row of
, the Hirschman–Rasmussen forward linkage index (
) can be obtained [
42]:
According to [
45], depending on the results of the indices, the sectors can be classified into the following four groups: (a) when both linkage indices are less than 1, the sectors that are independent of (or not strongly connected to) the other sectors; (b) when both linkage indices are greater than 1, the sectors that are dependent on (or strongly connected to) the other sectors; (c) when only the backward linkage is greater than 1, the sectors that are dependent on the inter-industry supply; and (d) when only the forward linkage is greater than 1, the sectors that are dependent on the inter-industry demand.
2.3. Environmental Pollution Estimation
Based on the input–output data, the environmental pollution of the tourism industry can be explored by calculating the CO
2 emissions. The total CO
2 emissions are equal to the sum of the direct CO
2 emissions and the indirect CO
2 emissions of the tourism industry. The calculation formula is as follows [
35]:
where
denotes the total CO
2 emissions of the tourism industry,
denotes the direct CO
2 emissions, and
denotes the indirect CO
2 emissions.
(a) Direct CO2 emissions of tourism industry.
The direct CO
2 emissions can be calculated by multiplying the emissions intensity of the tourism sectors with the tourism income [
35]:
where
represents the direct emissions intensity of
i sector, i.e., the CO
2 emissions per unit of output value in sector
i.
represents the tourism income of sector
i (
i=1, …, 8), where parameter
i refers to the type of tourism sector, i.e., transportation, shopping, accommodation, food, entertainment, sightseeing, post and telecommunications and other services. The direct emissions intensity of sector
i (
) can be computed as [
36]:
where
is the production-based CO
2 emissions produced by sector
i, which is calculated by the IPCC reference approach [
46].
is the total output of sector
i. Based on the latest data (e.g., China’s IO table 2007–2012), the direct CO
2 emissions intensity of the tourism industry is obtained as follows in
Table 2 [
12,
52].
(b) Indirect CO2 emissions of the tourism industry.
The tourism industry not only directly consumes energy associated with the tourism activities of tourists but also indirectly consumes energy through intermediary inputs by other sectors. Although the existing studies indicate that the indirect CO
2 emissions of tourism accounts for 50%–60% of total CO
2 emissions [
32,
36], research has neglected examining indirect CO
2 emissions that can seriously affect the carbon consumption calculation for the tourism industry.
The total CO
2 emissions intensity (
) indicates the total CO
2 emissions caused by the final products or services by production unit; thus, based on the hybrid physical-monetary energy IO model, the total CO
2 emissions intensity could be calculated by multiplying the direct CO
2 emissions intensity with the inverse Leontief matrix. The calculation formula can be described as [
35,
43]:
where
is the matrix of direct CO
2 emissions intensity of sector
i.
Accordingly, the total CO
2 emissions (
) of the tourism industry can be calculated by using the total CO
2 emissions intensity, which can be expressed as [
36]:
where the element
represents the total CO
2 emissions intensity of sector
i. Finally, the indirect CO
2 emissions (
) of the tourism industry are the difference between the total CO
2 emissions and the direct CO
2 emissions of the tourism industry. The indirect CO
2 emissions can be calculated by [
35,
36]:
2.4. The Policy Analysis
To further investigate the balance between tourism’s economic benefit and environmental pollution, a comprehensive factor, total CO2 emissions intensity, can be used to measure the dynamic nexus of economic growth and CO2 emissions.
At a sectoral level, the total CO
2 emission intensity is defined as the emissions per unit of value added in a sector [
53].
where
represents the total CO
2 emissions intensity of sector
i,
is the total CO
2 emissions of sector
i, and
is the value added of sector
i. Accordingly, the value of the total CO
2 emissions intensity
can be expressed as follows [
54]:
Accordingly, the changes of the total CO
2 emissions intensity of sector
i in Equation (15) between a reference time (as marked with subscript 1) and a base time (with subscript 0) can be defined in the form of percentage.
Similarly, the changes of the total CO
2 emissions intensity
in Equation (15) between a reference time (as marked with subscript 1) and a base time (with subscript 0) can be expressed as follows:
Through a policy analysis on the total CO2 emissions intensity, the top leading sectors that severely affect the economic growth and CO2 emissions can be identified.
3. Empirical Study
A case study on Beijing is conducted for illustration and verification. First, in
Section 3.1, the data descriptions are presented. Second, the economic benefit effect of the tourism industry in Beijing is analysed through using the combined TSA and IO model, and the results are reported in
Section 3.2. Third, to capture the corresponding environmental impact of the tourism industry (discussed in
Section 3.3), the proposed hybrid approach is employed to estimate direct and indirect CO
2 emissions. Finally, in
Section 3.4, the total CO
2 emissions intensity change of the tourism industry is further investigated to reveal the balance between the economic benefit and environmental pollution at the sectoral levels.
3.1. Data Resources
This paper investigates the economic benefit and the CO
2 emissions in Beijing’s tourism industry by using the TSA and the IO model, which uses tourism consumption and IO tables as the database. For the TSA data, the tourism consumption documents all the tourism spending within the urban boundary, including domestic tourism consumption, inbound tourism consumption, tourism consumption incurred domestically in relation to outbound travel and the airfare paid to the national carriers. In particular, the tourism consumption data is obtained from the Beijing Statistical Yearbook and the Beijing Tourism Statistics Bulletin for the two research years of 2007 and 2012. According to the TSA framework, from the traditional industries in independent accounting, the tourism industries in Beijing are separated into seven sectors: transportation, shopping, accommodation and food, entertainment, sightseeing, postal service and telecommunications and other services sectors. The transportation sector is composed of long-distance transportation and urban transportation. For a uniform measurement, the inbound income has been converted into CNY based on the average exchange rate of the USD. To avoid the potential impact of price changes, all of this tourism income is converted into 2012 constant prices (in RMB, 10,000 Yuan) by using the sectoral price indices [
55].
As for the input-output data, two pairs of hybrid physical-monetary energy IO tables for the years 2007 and 2012 are compiled, covering two types of data: time-series IO tables (in monetary units) and the corresponding emissions data (in physical units). For the monetary data, Beijing’s IO tables for 2007 and 2012 were originally developed by the Beijing Municipal Bureau of Statistics. According to China’s standard industrial classification system, the IO tables’ sectors were reclassified into 26 sectors, as listed in
Table 3. For consistency, these monetary tables are all converted into 2012 constant prices (in RMB ten thousand Yuan) by using the price indices.
For the physical data, the energy use data is taken from the energy balance table of Beijing (in standard coal equivalent) provided by the China Energy Statistical Yearbook. Moreover, the industrial final consumption data (in physical units) are derived from the Beijing Statistical Yearbook. For energy sectors in the energy input–output tables, we use the intermediate energy input and the final balance table of the Chinese Energy Statistical Yearbook. In particular, the energy balance tables refer to the summation of the final energy consumptions by all the sectors; the final energy consumptions in the energy input–output tables are divided into 7 categories, i.e., rural household consumption, urban household consumption, government consumption, fixed capital formation, changes in inventories, net exports and others. Seven main types of energy are collected: coal (covering raw coal, cleaned coal and other washed coal), natural gas, coke, finished oil (covering diesel oil, gasoline, kerosene and fuel oil), liquefied petroleum gas, and heat and electricity. To avoid double calculation, these energy types are aggregated into 5 forms, excluding the heat and electricity energy type, as the carbon emissions for this type are otherwise included in the indirect emissions from residential consumption. The energy-related CO
2 emissions (in 10,000 tons of standard coal equivalent) from both fuel combustion and industrial processes are calculated by using the IPCC reference approach [
56].
3.2. Economic Benefit Estimation of Tourism Industry
Based on the tourism consumption data (TSA data), the inbound and domestic tourism incomes for 2007–2012 are all converted into 2012 constant prices, as shown in
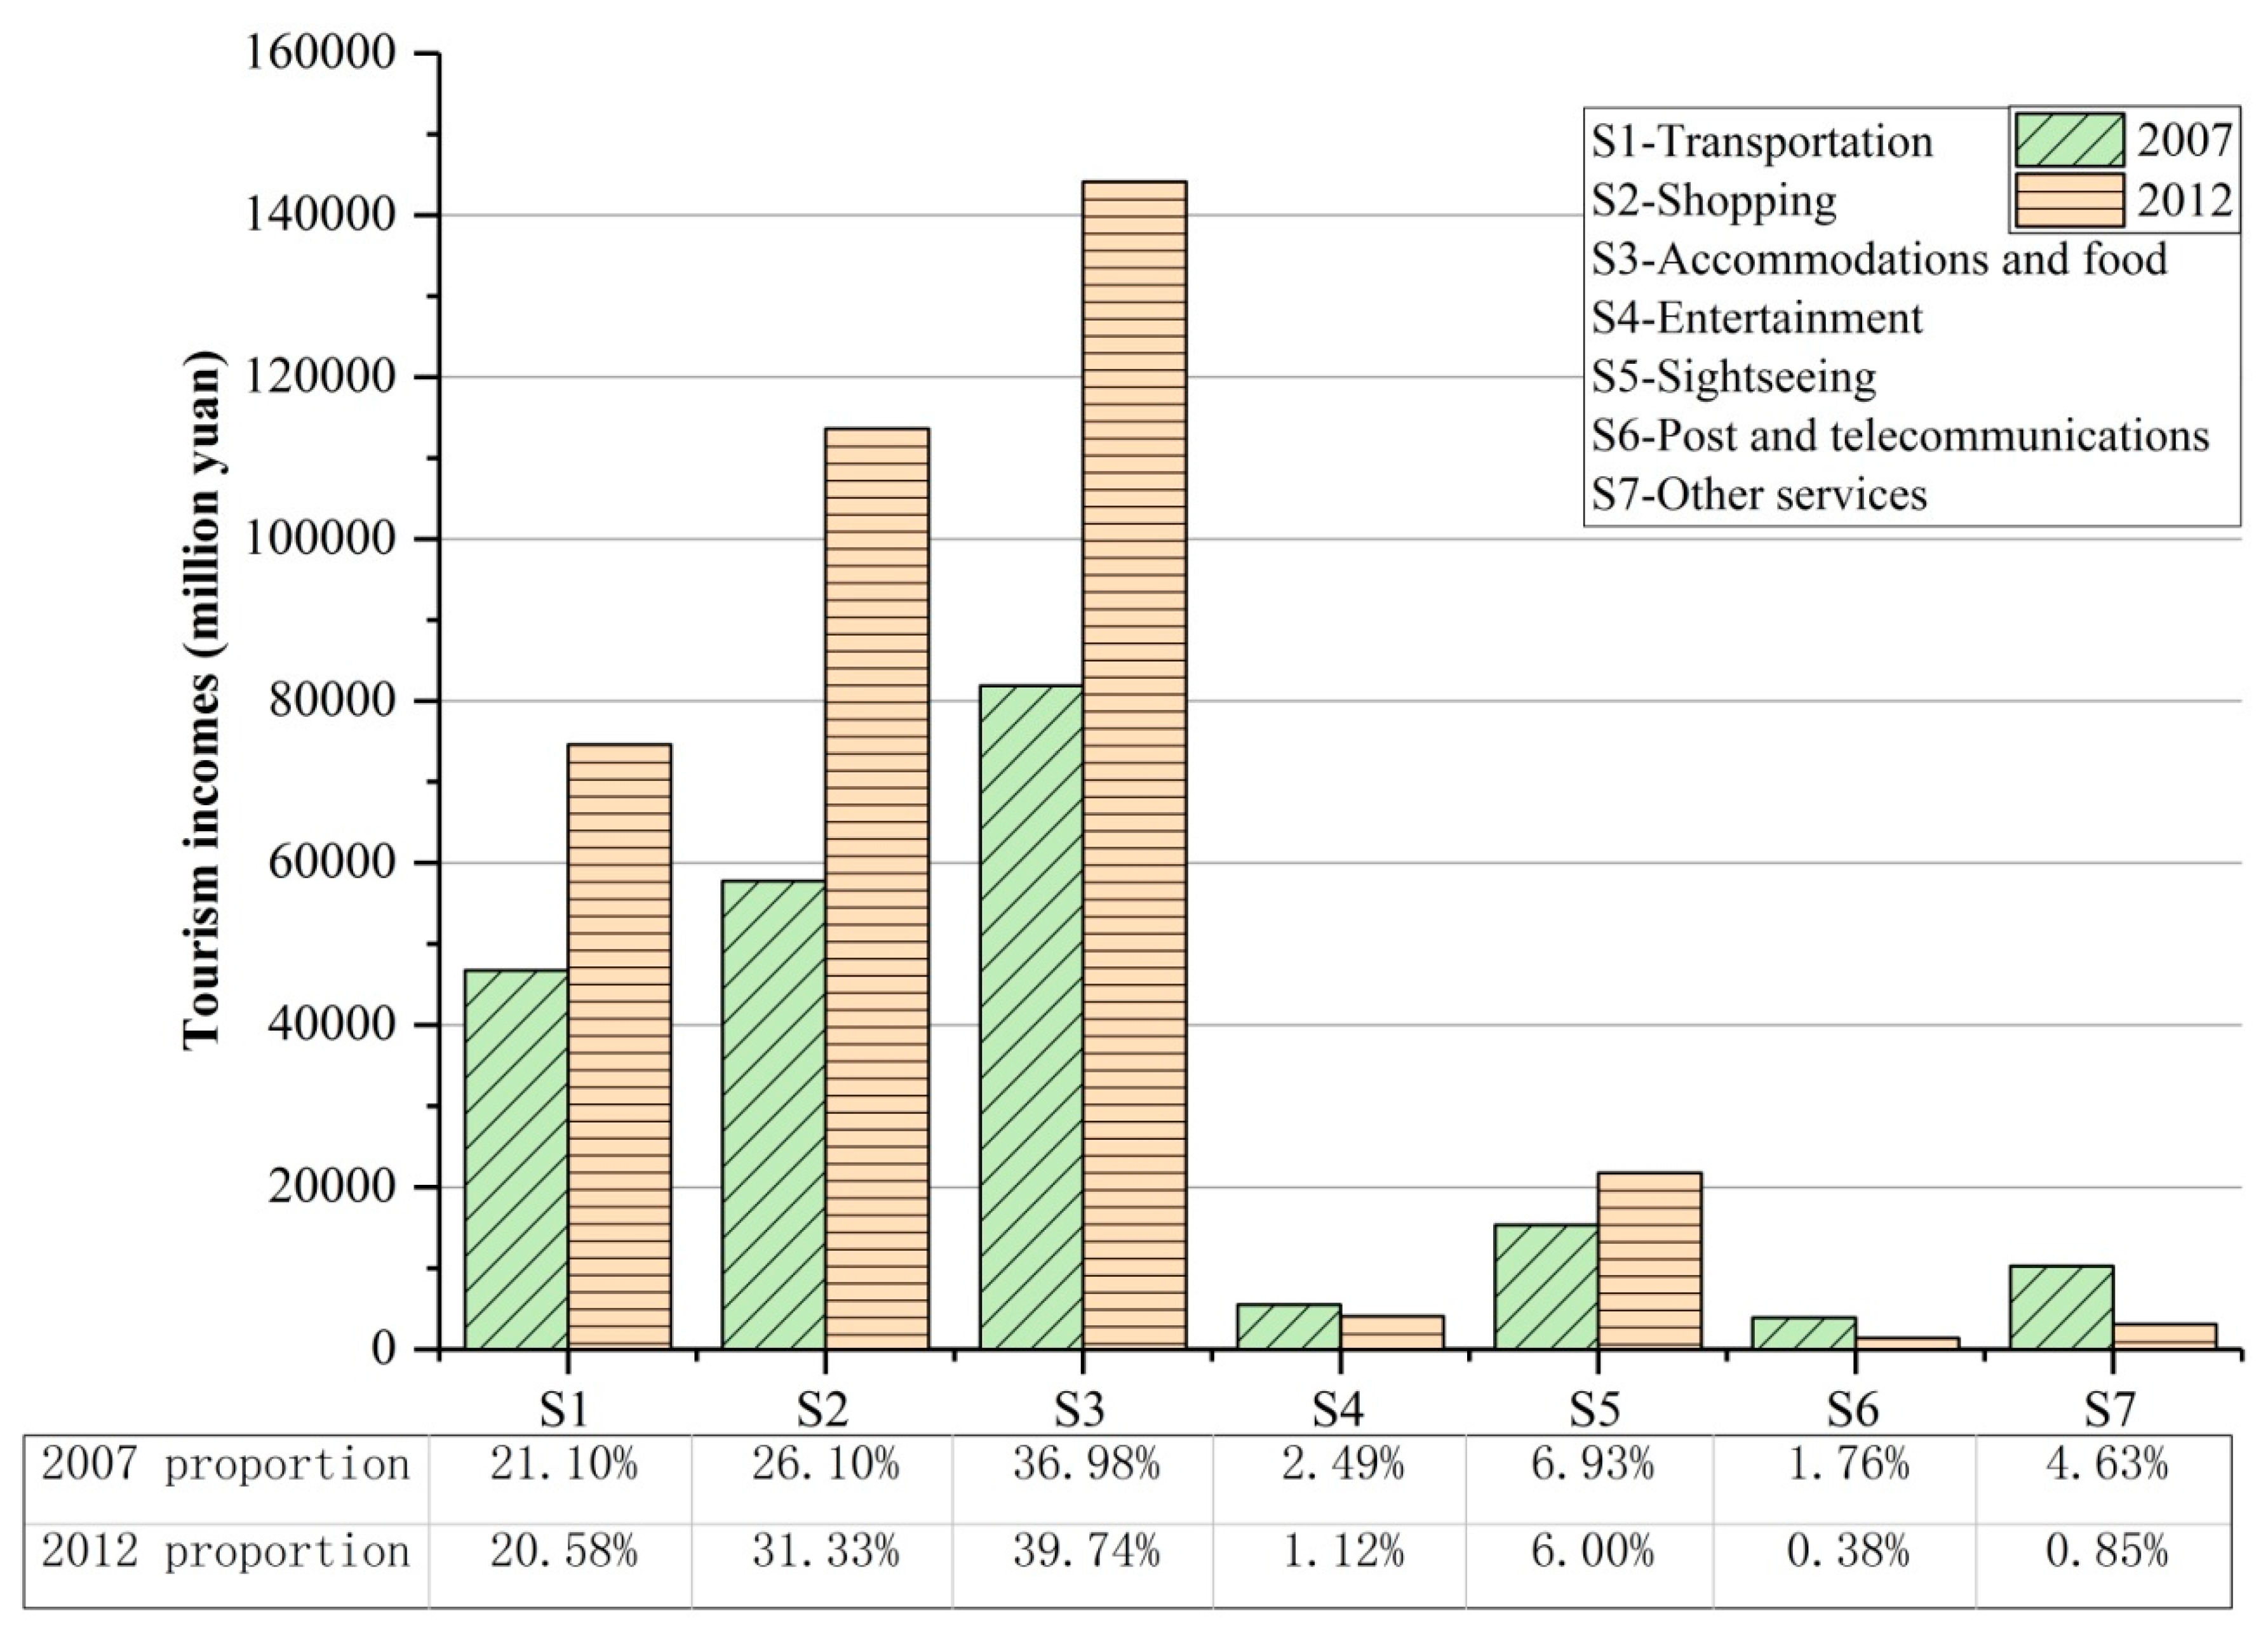
Figure 2. Generally, Beijing’s tourism income exhibited an upward trend, increasing from approximately 221,401.01 million yuan in 2007 to 362,635.63 million yuan in 2012, with a growth rate above 63%. The possible reason might lie in the optimization and adjustment of the tourism industry structure in Beijing during the period of the 11th Five-Year Plan. Expanding tourist expenditures in the tourism sectors with a large demand elasticity (such as the accommodation and foods (S3), shopping (S2), and transportation (S1) sectors) will contribute to the structural optimization and efficient economic growth of the tourism industry in Beijing.
Regarding the corresponding contribution ratios (i.e., the proportion) of tourism income, in 2007–2012, the top major tourism sectors with the highest incomes were consistently the accommodation and food (S3), shopping (S2) and transportation (S1) sectors. Note that these three sectors made up the majority of Beijing’s total tourism income. In 2007 and 2012, these three sectors accounted for approximately 84.18% and 91.65%, respectively, of the total Beijing tourism income, indicating that they may have been the leading tourism sectors driving the economic growth in Beijing. In addition, during the period of 2007–2012, the tourism sectors’ contribution ratios in the tourism income increased (declined) at different levels. On the one hand, during this period, the proportion of the shopping (S2) and the accommodation and food (S3) sectors climbed dramatically, with approximately 5% and 3% growth, respectively. The latent factors contributing to this growth might be referred to as those related to the vigorous development of tourism, as the number of tourists increased in Beijing, boosting the consumption in shopping and in the accommodation and food industry. On the other hand, the corresponding proportion of the other tourism sectors dropped moderately. Note that the contribution ratio of the other services sector (S7) was significantly reduced by approximately 4%, which might be due to imperfect urban tourism service functions, such as an incomplete urban tourism interpretation system, marking system and defects in the individual service facilities.
To further analyze the significance of the tourism industry in Beijing, a sectoral multiplier analysis and an inter-sector linkage analysis based on the IO model are conducted to identify leading tourism sectors and whether their interaction with other sectors may enhance economic growth. The output multiplier incorporates the direct and indirect effects to measure the impacts of a demand shock on the economy. Accordingly, the output multipliers for the tourism sectors in Beijing for 2007 and 2012 and the corresponding sectoral rankings in the economy are shown in
Table 4.
From the results, it can be deduced that the main tourism sectors are able to appropriately stimulate the total output (or production) for a given change in the final demand. First, the transportation and warehousing sector (S1) was identified as the tourism sector with the greatest multiplier calculated for Beijing’s economy, indicating that this sector may has deep productive linkages in the economy as a whole. Second, the results show that Beijing’s economy, despite showing an important industrial structure (i.e., industrial sectors with higher sectoral rankings), is also largely based on the performance of non-industrial sectors, particularly the tourism sectors. These tourism sectors exhibit a moderate capacity to simulate production in the economy, as the analysis results made clear, i.e., the output multiplier of the majority of the sectors ranked ahead of the 20th position in the ranking of the output multipliers of all sectors. In addition, indicating that the tourism sectors play a critical role in accelerating the economic benefit in Beijing, the added value of the tourism sectors accounted for more than 46% of the total GDP in Beijing in 2012.
In addition, as provided by the Hirschman–Rasmussen forward and backward linkages, an assessment of the degree of dependence and interconnections between sectors can complement the analysis of the output multipliers, as shown in
Figure 3. As previously mentioned, sectors could be classified as key sectors that are dependent on other sectors, dependent on inter-industry supply, dependent on inter-industry demand or as key sectors that are independent of other sectors.
Interestingly, there is no tourism sector of the Beijing economy in the group that is relatively dependent on the others (upper right quadrant) or dependent on inter-industry demand (upper left quadrant) for 2007 and 2012. In particular, in 2007 and 2012, as shown in the area of the lower left quadrant of
Figure 3, almost all the tourism sectors lie in the group generally independent of others. This result implies that there is no significant degree of dependence between the sectors or dependence on inter-industry demand in the economy. Among the sectors strongly dependent on the inter-industry supply, i.e., those situated in the lower right quadrant in 2007, note that the transportation sector (S1) presents a higher backward linkage index to the economy. This indicates this sector’s strong interconnections with the other sectors on which it is dependent and probably its strong capacity to affect other industries.
Generally, the expansion of the tourism industry, especially the development of tourism sectors with a large demand elasticity (such as accommodation and food (S3), shopping (S2), and transportation (S1)), which have significant impacts on the structural optimization and economic benefit of the tourism industry in Beijing, is considered an engine of economic development. In addition, the transportation and warehousing sector (S1), with the highest output multiplier and backward linkage index, should be highlighted as the key sector in the tourism industry that can accelerate the structural optimization and development of the tourism industry and hence economic growth in Beijing.
3.3. The CO2 Emissions of the Tourism Industry
Based on the economic analysis of the tourism industry, exploring the direct and indirect environmental effects is the indispensable task for revealing the dynamics of the nexus between tourism CO
2 emissions and economic benefits. In particular, the CO
2 emissions from tourism industry in Beijing include seven tourism sub-sectors in calculation. Besides, CO
2 emission from the tourism industry are calculated by energy consumption via IPCC. Therefore, the substantial amounts of energy consumption from the tourism industry may cause high CO
2 contribution. In this step, a combination of the TSA with the IO model is applied to investigate the direct and indirect environmental effects (i.e., the CO
2 emissions) of the tourism industry in Beijing. Based on the previously mentioned method, the direct CO
2 emissions can be calculated, as shown in
Table 5. Obviously it can be seen that the amount of direct CO
2 emissions from the tourism industry during the period from 2007 to 2012 declined from 9.28 million tons of standard coal equivalent (Mtce) to 8.01 Mtce, with a decrease rate of 13.68%. This indicates that the Beijing tourism industry has experienced rapid economic growth with an enormous amount of energy consumption; however, it has also resulted in a relatively fast decline of direct CO
2 emissions. The possible reason might lie in the improvement of carbon efficiency and the adjustment of the tourism industrial structure in Beijing. Moreover, the direct CO
2 emissions were estimated to contribute 9.06% and 7.94% to Beijing’s total CO
2 in 2007 and 2012, respectively, and from the perspective of direct carbon emissions, this implies that the tourism industry has become a pioneer in Beijing’s low-carbon and environmentally friendly economic development.
From a sector perspective, for the period of 2007–2012, the transportation (S1) sector accounted for approximately three-fifths of the direct CO
2 emissions, followed by the accommodation and food (S3) sector (above 31%) and the shopping (S2) sector (over 4.7%). This result is basically consistent with the existing literature [
32,
36]. Moreover, this is also consistent with the UNWTO conclusions that the direct CO
2 emissions of the global tourism industry are mainly generated from transportation (75%), accommodations (21%) and sightseeing activities (4%) [
6]. However, with respect to the global circumstances, there is also a certain difference between the two conclusions: in the Beijing results, shopping (S2) replaces sightseeing (S5); therefore, in Beijing, the preference of tourists for shopping was reflected in the CO
2 emissions contributions.
Apart from the direct CO
2 emissions generated by tourists’ activities, the indirect CO
2 emissions generated from the production, manufacturing, and the tourism management authorities’ activities related to the normal operations of the tourism industry also cannot be ignored. According to the calculated results, the indirect CO
2 emissions of Beijing’s tourism industry declined from 26.09 Mtce in 2007 to 17.90 Mtce in 2012, as shown in
Table 6. Compared with the contribution of the direct CO
2 emissions of the tourism industry, the contribution of the indirect CO
2 emissions exceeded that of direct CO
2 emissions: in 2007 and 2012, the indirect CO
2 emissions accounted for 25.48% and 17.75%, respectively, of the CO
2 emissions of the tourism industry. Therefore, there should be more attention placed on the indirect CO
2 emissions in the tourism industry. In terms of the indirect CO
2 emissions structure of the tourism industry, the results during the period 2007–2012 were consistent with the results of direct CO
2 emissions, reflecting the important role of the transportation (approximately 30%), shopping (approximately 15%), and the accommodation and food (above 35%) sectors in indirect CO
2 emissions.
By adding up the direct and indirect CO
2 emissions, it can be seen that in 2007 and 2012, the total CO
2 emissions caused by tourism industry were 35.38 Mtce and 25.91 Mtce, respectively, accounting for 34.54% and 25.70% of the total emissions in Beijing. On the one hand, the CO
2 emissions decrease for 2007–2012 could be attributable to the considerable effort made by Beijing, particularly in terms of reducing the use of fossil fuel. According to the calculation based on the IO table, the use of coal in Beijing declined at a rate above 23.8% from 2007 to 2012. On the other hand, this result also indicates that among all the sectors in Beijing, the tourism industry was the important emitter and, therefore, should be especially targeted in mitigation policies. Promising measures are enhancing the share of cleaner fossil fuels such as natural gas in the accommodation and food sector [
54], using biodiesel in transportation sector [
57] and adopting economic instruments such as taxes or subsidies [
58].
For the total CO2 emissions structure of the tourism industry, the transportation sector (S1) was the largest contributor (38.43%) in 2007, while the accommodations and food sector (S3) became the largest contributor (40.90%) in 2012. For the trend of changes in the tourism industry’s CO2 emissions structure, the percentages of total CO2 emissions from the three leading emitters, i.e., the transportation (S1), shopping (S2), and the accommodation and food (S3) sectors, have increased, while those of the other sectors have declined relatively.
Based on its estimated CO2 emissions, the tourism industry has exerted a significant influence on the total emissions in Beijing. Interestingly, the indirect CO2 emissions of the tourism industry in Beijing were 3 times more than the direct CO2 emissions, except for the emissions in the transportation sector (S1). Additionally, the CO2 emissions ratios of the transportation (S1), shopping (S2), and accommodation and food (S3) sectors are dramatically higher; therefore, targeted policies should be made concerning these leading emitters. For instance, bike shares and energy saving cars should be encouraged; saving daily living resources, such as electricity and water, should be advocated.
3.4. The Total CO2 Emissions Intensity Change of the Tourism Industry
In the last step of the proposed framework, to further reveal the relationship between economic benefit and environmental pollution in the tourism industry, the total CO
2 emissions intensity of Beijing’s tourism industry is explored at sectoral levels. From the initial analysis, an interesting finding arises from the empirical results—the tourism industry has experienced significant economic growth in Beijing during the period of 2007–2012; however, unexpectedly, even though the tourism activities require energy from the direct use of fossil fuels or indirectly from electricity that is often generated from coal, natural gas, or oil, the CO
2 emissions of the tourism industry exhibited a descending trend during the sample period. To explore this phenomenon properly, the total CO
2 emissions intensity, which is defined as the emissions per unit of value added, can be used to comprehensively measure the economic and environmental effect of the tourism industry.
Figure 4 represents the changes of total CO
2 emissions intensity for Beijing’s tourism industry during the period 2007–2012.
From
Figure 4, as the major factor responsible for the robust economic growth and the significant decrease in the CO
2 emissions of the tourism industry, Beijing’s total tourism emissions intensity dropped dramatically (36.8%) during the period 2007–2012. Accordingly, the CO
2 emissions intensity of all the sectors declined at a rate above 20% from 2007 to 2012, especially the shopping (S2) and sightseeing (S5) sectors, with decrement rates of approximately 68% and 49%, respectively, becoming the major sectors largely affecting the total emissions intensity of the tourism industry. This result implies that during 2007–2012, the economic growth rate of the tourism sectors in Beijing exceeded that of the CO
2 emissions. In other words, the balance of Beijing’s tourism industry is likely to favour high-speed economic growth with low-carbon emissions, particularly in the shopping (S2) and sightseeing (S5) sectors. The potential reason for this is that the dominant industries in Beijing have changed from secondary industries to the tertiary industries such as the tourism industry. In addition, in Beijing, fossil fuel consumption, such as the use of coal, one of main sources of CO
2 emissions, is dropping from 21.62 Mtce to 16.47 Mtce during the period of 2007–2012. Therefore, improving the energy consumption structure and employing energy-saving technology for the tourism industry could consistently help to shift the balance between economic benefit and environmental pollution to the side of high-income and low-emission. Moreover, the higher emissions-intensive tourism sectors, namely, the sectors with the relatively weak CO
2 emissions intensity reduction rate, should be especially targeted in mitigation policies. Promising measures are the extensive application of energy-efficient machinery and equipment in the emission-intensive sectors [
53], increasing the use of cleaner fossil fuels such as natural gas, promoting renewable energy in energy input [
54], encouraging cleaner technology innovation and adopting economic instruments such as taxes or subsidies [
58].
4. Discussion and Conclusions
In this paper, a combined IO and TSA analysis approach is applied to comprehensively measure the significance and impact of the tourism sectors on economic benefit and environmental pollution. A case study for Beijing is conducted for illustration and verification. Generally, the major contributions of this work to the literature can be summarized into the following three aspects. First, using the top-down method (IO model) in accordance with the TSA, a comprehensive analytical framework for tourism’s economic benefit and for environmental pollution is proposed in this study. Second, the combined IO and TSA approach is applied to investigate the tourism industry from the perspective of economic benefit and CO2 emissions, thereby balancing those two aspects. Third, based on the proposed framework, a case study reveals significant and interesting findings on the changes in Beijing’s tourism economy and CO2 emissions for a new period (up to 2012).
In the empirical study, the proposed method is implemented to explore the balance between economic growth and the CO
2 emissions of tourism sectors in Beijing for 2007–2012 and provides effective policies to promote high-income and low-carbon tourism development. Generally, Beijing’s tourism industry exhibits robust economic growth and experienced a significant decrease in CO
2 emissions during the period of 2007–2012. From the perspective of economic analysis, the accommodation and food (S3), shopping (S2) and transportation (S1) sectors are the top three tourism sectors with the highest incomes in Beijing for 2007–2012, accounting for 91.65% of the total tourism income in 2012; the transportation sector (S1) has the capacity to affect the other industries and to stimulate the economy. This finding provides helpful insights into the major directions for promoting economic growth for Beijing—the government could optimize and adjust the tourism industry structure by reducing the activity cost of the sectors with a large demand elasticity. For instance, the government could promote measures such as using hybrid vehicles incorporating the best available technologies (BAT) for touring buses in the transportation sector (S1) [
59] and advocating new tourist accommodations, such as Airbnb and hotel forms built around modern internet technologies [
60].
Regarding the environmental effects of the tourism industry, the indirect CO2 emissions of the tourism industry in Beijing were 3 times greater than the direct CO2 emissions. Moreover, the transportation sector (S1) and the accommodation and food sector (S3) were the largest emission emitters in 2007 and 2002, respectively. Thus, reducing the CO2 emissions of the tourism industry, especially the indirect CO2 emissions, becomes an efficient way to decrease Beijing’s total emissions. Some possible sector-specific measures include the following: (1) promoting green transport for tourists, such as sharing bicycles and using hydrogen cars in the transportation sector (S1); (2) optimizing natural ventilation and reducing air-conditioning and artificial lighting energy consumption for the entertainment sector (S4); and (3) enhancing the drainage system, the sewage treatment system and the waste disposal cycle system for the accommodation and food sector (S3).
For revealing the balance between tourism’s economic benefit and CO2 emissions, an effective metrical indicator, total CO2 emissions intensity was employed. As a result, Beijing’s total tourism emissions intensity dropped 36.8% during the period of 2007–2012, in which the CO2 emissions intensity of all the sectors declined at a rate above 20%. Therefore, the balance between economic benefit and environmental pollution leans towards the side of high-income and low-emissions. Accordingly, to achieve the reduction in the sectoral emissions intensity, the development of a series of related measures are recommended that will effectively improve the total emissions intensity of the tourism industry, thereby reducing Beijing’s CO2 emissions. This case study provides valuable new findings for designing and adjusting targeted mitigation policies for the low-carbon tourism development.
However, there are still many interesting avenues for future research. First, due to a lack of disaggregated data for other regions, the empirical study especially focuses on Beijing’s tourism industry. Future studies can apply this method to other regions, states and cities in the world to verify the study’s generalization and universality. Second, some other advanced model, such as computable general equilibrium (CGE) and life cycle assessment (LCA), can also be considered. We will consider these interesting issues in the near future.


