Examining Social Vulnerability and Inequality: A Joint Analysis through a Connectivity Lens in the Urban Agglomerations of China

1
School of the Sociology and Development, Nanjing Normal University, Nanjing 210097, China
2
School of Architecture and Urban Planning, Nanjing Tech University, Nanjing 211800, China
3
School of Transportation, Southeast University, Nanjing 210018, China
*
Author to whom correspondence should be addressed.
Sustainability 2019, 11(4), 1042; https://doi.org/10.3390/su11041042
Submission received: 3 January 2019
/
Revised: 13 February 2019
/
Accepted: 13 February 2019
/
Published: 17 February 2019
(This article belongs to the Section Sustainability in Geographic Science)
Abstract
:China is vulnerable to climate change. Developing the ability to assess social vulnerability and inequality amid climate change will be imperative to ensure that adjustment policies can be developed for various groups and build resilient livelihoods in China. This paper examines social vulnerability and inequality through a joint analysis of urban agglomerations. Based on a conceptual framework of social vulnerability from a network perspective, the social vulnerability index of individual cities is quantified with a projection pursuit cluster model, the social vulnerability index of cities in urban networks is calculated with the Baidu Index, and an inequality analysis is measured by the Theil index. We pilot this study in three urban agglomerations: the Jing-Jin-Ji region, the Yangtze River Delta region, and the Pearl River Delta. Our results show the following: (1) The indicator of “GDP” with the weight value reaching 0.42 has the most influence on social vulnerability. Three indicators, which are fully described herein—“Children”, “Illiterate”, and “Higher education graduated”—contribute much to social vulnerability index with values between 0.3 and 0.4. These three indicators should receive more attention in integrated risk management. (2) In the Jing-Jin-Ji region, the Theil indexes of two indicators, “Ethnic minorities” and “Green”, exceed 0.65 and have the most influence on inequality. In the Yangtze River Delta, three indicators of “Poor”, “GDP”, and “Green” contribute much to inequality. In the Pearl River Delta, the inequalities of “Green”, “Houses with no tap water” and “Higher education graduated” are high. These indicators give advance warning of potential problems, so adjustment is recommended for reducing inequality. (3) Though the connectivity structure of the Yangtze River Delta is more complicated and stronger than that of the other two agglomerations, its inequality of connectivity is higher than the others. (4) Connectivity is key for reducing social vulnerability, on the one hand, but can result in more inequality of social vulnerability, on the other hand. Therefore, it’s crucial for government to attach more significance and provide more support to cities with a higher social vulnerability index.
1. Introduction
This is an age of climate change and urbanization. As one of the world’s most densely populated regions with rapid urbanization, China is particularly vulnerable to climate change. China is threatened by increasing frequency and intensity of climate extremes such as coastal, riverine, and pluvial flooding, heat waves, and droughts. The Chinese government estimates that direct economic losses from extreme weather events reach USD 25 to 37.5 billion per year and cost the country 1–3% of gross domestic product [1]. This situation is currently exacerbated and complicated by urbanization in China. Urban growth has been exponential in China; its urbanization rate soared from 19.39% in 1980 to 57.35% in 2016. Crowded cities in China have faced increasing inequalities in physical and social infrastructures, such as housing quality, accessible green spaces, and medical services. Moser et al’s (1994) work summarized urban vulnerability was brought by structural adjustment: (1) urban life is more commodified than rural life; (2) the complexity of environmental risk is greater; (3) there is greater social fragmentation because of high residential mobility and the loss of supportive social networks [2]. Specifically, in China, urbanization is characterized by a large share of population and wealth being concentrated along the coast, especially in three large urban agglomerations: the Jing-Jin-Ji region, the Yangtze River Delta region and the Pearl River Delta region. These areas are threatened by multiple stresses from inequalities, environmental problems, and climate change. Research supports the idea that significant opportunities and benefits may be achieved by analyzing social vulnerability to climate change and urbanization [3]. In this context, developing the ability to assess social vulnerability and inequality amid climate change will be important to ensure that adjustment policies can be developed for various groups and resilient livelihoods can be built in China.
This paper contributes to a joint analysis of social vulnerability and inequality with reference to urban agglomerations in China. Previous research has focused only on social vulnerability. Thus, two research questions arise: (1) How to evaluate the influence of connections between cities on social vulnerability? (2) how inequality changes when social vulnerability is reduced? Because of a bidirectional relation existing between social vulnerability and inequality, it seems worthwhile evaluating social vulnerability accompanied by inequality from a network perspective. The present study is organized as follows: Section 2 reviews the literature on social vulnerability and inequality in the research of climate change and disasters. Section 3 describes the data and then sketches the methodology for evaluating urban social vulnerability and inequality from a network perspective. The Jing-Jin-Ji region, Yangtze River Delta region, and Pearl River Delta region are used as case studies. Section 4 presents the results, including profiles of urban social vulnerability and inequalities in the three urban agglomerations, displayed through geographic information system (GIS) mapping. Section 5 provides a detailed discussion about the results and closes by drawing some retrospective conclusions.
2. Literature Review: Social Vulnerability and Inequality
Vulnerability research originated in the discipline of natural hazards and then spread to other research fields, such as sociology, sustainability science, climate change, and so on. Generally, the vulnerability means the degree to which that system is unable to cope with selected adverse events [4]. In the context of climate change, the term vulnerability is particularly defined as “the degree to which a system is susceptible to, or unable to cope with, adverse effects of climate change, including climate variability and extremes” [5]. This degree is always considered as a complex structural characteristic determined by multiple processes and factors of the environment, society, economy, and politics. Vulnerability is dynamic and depends upon both biophysical and social processes [6]. From the biophysical perspective, vulnerability refers to the physical components of climate change and its direct physical impacts on the exposed system [7]; for example, the spatial distribution of extreme climate events, the human occupancy of hazard zones, and the damages and losses caused by disasters [8]. Social vulnerability indicates a pre-existing condition and inherent state of populations, organizations, and societies that impinges on their ability to prepare for, respond to, and recover from outside stressors [9]. This condition and state exist within a system before it encounters a hazard and are deeply rooted in cultural, social, economic, and political marginalization processes [10].
Besides defining what is vulnerability, it’s essential to know who or where is vulnerable. Vulnerability assessment can offer insights into this [11]. In the field of social vulnerability research, there are two principal goals: the design of models which explain the root causes creating social vulnerability, and the development of methods attempting to evaluating social vulnerability [12]. Thus, several important conceptual models have been developed to explain social vulnerability during the last decades. For example, the pressure and release model illustrates a whole progression of vulnerability from root causes to unsafe conditions [13]. The hazards of place model proposes the idea of “place” to provide convenience for spatial analysis and bridge the gap between biophysical and social vulnerability [14]. The sustainable livelihood framework emphasizes that vulnerability emerges in a specific place but is affected by human and environmental systems at regional and global levels. The Bogardi–Birkmann–Cardona framework indicates that vulnerability is in a dynamic process where it is hidden in the key environmental, social, and economic spheres [15]. On the other hand, two distinct aspects have emerged in the social vulnerability assessment: collective vulnerability assessment and individual vulnerability assessment. The former is often analyzed at community, national or regional scale, while the latter is about the household and individual scale [11].
Most social vulnerability assessments investigate collective vulnerability with top-down approaches, for example, an indicator-based approach. This approach develops a composite index of social vulnerability based on related indicators and has become prominent in social vulnerability research [16]. Many researchers have exploited the indicator-based approach in various contexts. Cutter et al. (2003) constructed the social vulnerability indexes of U.S. counties with principal components analysis (PCA). Wood et al. (2010) selected 42 variables in the original social vulnerability indicator derivation and ultimately applied 29 variables in PCA to study the community social vulnerability of tsunamis in the Northwest of America [17]. Gatto and Busato (2019) use the PCA to reduce the number of variables in latent variables and calculate the energy vulnerability index [18]. Holand and Lujala (2012) developed the social vulnerability indexes for Norwegian municipalities and compared the replicated and adapted assessment [19]. Guillard-Gonçalves et al. (2015) selected 46 variables to develop a social vulnerability index of 149 civil parishes of Great Lisbon with PCA [20]. Hou et al. (2016) applied data envelopment analysis (DEA) to calculate the social vulnerability index of China’s geological disasters and 11 variables were used [21]. Agovino et al. (2018) employed the Mazziotta–Pareto method to construct the policy index and then used the DEA to evaluate policy efficiency [22]. After reviewing the literature on Hurricane Katrina, Maharani and Lee used self-organizing maps (SOM) and social vulnerability index for data analysis in terms of 12 social vulnerability variables. They found that nearly half of all regions in the South of Korea are highly vulnerable to typhoon hazards [23].
In essence, social vulnerability is regarded as the product of social stratification, social inequalities among different groups of people, and different environmental locations [24]. When delving deeply into the research of climate change and disasters, a close connection can be found between social vulnerability and inequality. In this particular context, inequality can be generalized in four major groupings, including economic inequality, social inequality, health inequality and cultural inequality.
“Economic inequality” links more to uneven access to income, wealth, and credit. Research has already connected economic inequality with social vulnerability. For example, Douglas et al. assert that due to greater exposure and less access to housing in low-risk environments, the poor are far more often victims of climate change and disasters [25]. Ramin and Svoboda suggest that with frail physical conditions and poorer protection, homeless individuals are more vulnerable to new and resurgent disease processes resulting from climate change [26]. Cutter et al. argue that wealth enables communities to absorb and recover from losses more quickly because of more mitigation measures [14].
“Social inequality” is the condition where people have unequal access to valued resources, services, and positions in society [27]. Namely, social inequality includes “unequal access” and “unequal groups”. In a recent review of the literature of social vulnerability to climate change and disasters, social inequality is found to be largely related to disparities among education, technology, information, and social capital (e.g., social networks and connections). Frankenberg et al. prove that better educated men are more likely survive tsunamis, and that better educated individuals suffer less following tsunamis and have better psychosocial health than those with less education over the long term [28]. Land and Hummel reveal that in the West African Sahel, formal education can help reduce vulnerability to environmental stress, because persons with higher education usually depend less on environmentally sensitive activities [29]. Conversely, less education constrains individuals from attaining and understanding useful information (e.g., warnings and recovery information). Deressa et al. (2009) suggest that social connections promote group communication and information flow, and consequently enhance individuals’ adaptability to climate change [30]. However, social capital is not equal; social stratification can have an impact on the power and access of social capital [31]. The inequality of social capital will exacerbate social vulnerability and risk.
“Health inequality” refers to variations in health due to age or other factors in the field of social vulnerability to climate change and disasters. For example, a person who is frail or physically limited is constrained from easily attaining valuable resources, so his/her social vulnerability is higher than others [14]. Social vulnerability increases with age because of elderly people’s physical limitations, post-disaster psychological stress, declining cognitive abilities, and lower income [32]. Children are vulnerable to climate disasters and are likely to suffer psychological and physical damage [33,34]. Moreover, women are significantly more vulnerable to disasters comparing to men. It was clearly demonstrated during the South-East Asia tsunami in 2004, women were disproportionately impacted in various countries affected by the tsunami. In Indonesia, India and Sri Lanka, more women were killed than men [35].
“Cultural inequality” means intangible inequality stemming from beliefs, social identities, customs, and group cultures [36,37]. In the literature of social vulnerability, “race and ethnicity” are most connected to the fourth dimension of inequality. Cutter et al. point out that this inequality imposes language and cultural barriers on minorities, which further limits their access to post-disaster funding and to housing in low-risk areas. Beside language and cultural barriers, Bethel et al. suggest other reasons for the exacerbation of social vulnerability for racial and ethnic minorities; for example, distrust of warning information, lower risk perception, and more dependence on particular information sources (e.g., family and friends). During Hurricane Katrina, victims seeking safety in shelters were disproportionately black [38]. Hispanics suffered more from psychological distress after California earthquakes and the 9/11 terrorist attacks [39]. Spanish-speaking Hispanics are less likely to have an emergency evacuation plan, and racial/ethnic minorities are less likely to have medication supplies [40]. Fothergill et al. indicate that community isolation and cultural insensitivities also make racial/ethnic minorities in the US more vulnerable to natural disasters [41].
3. Materials and Methods
3.1. Profile of Study Area
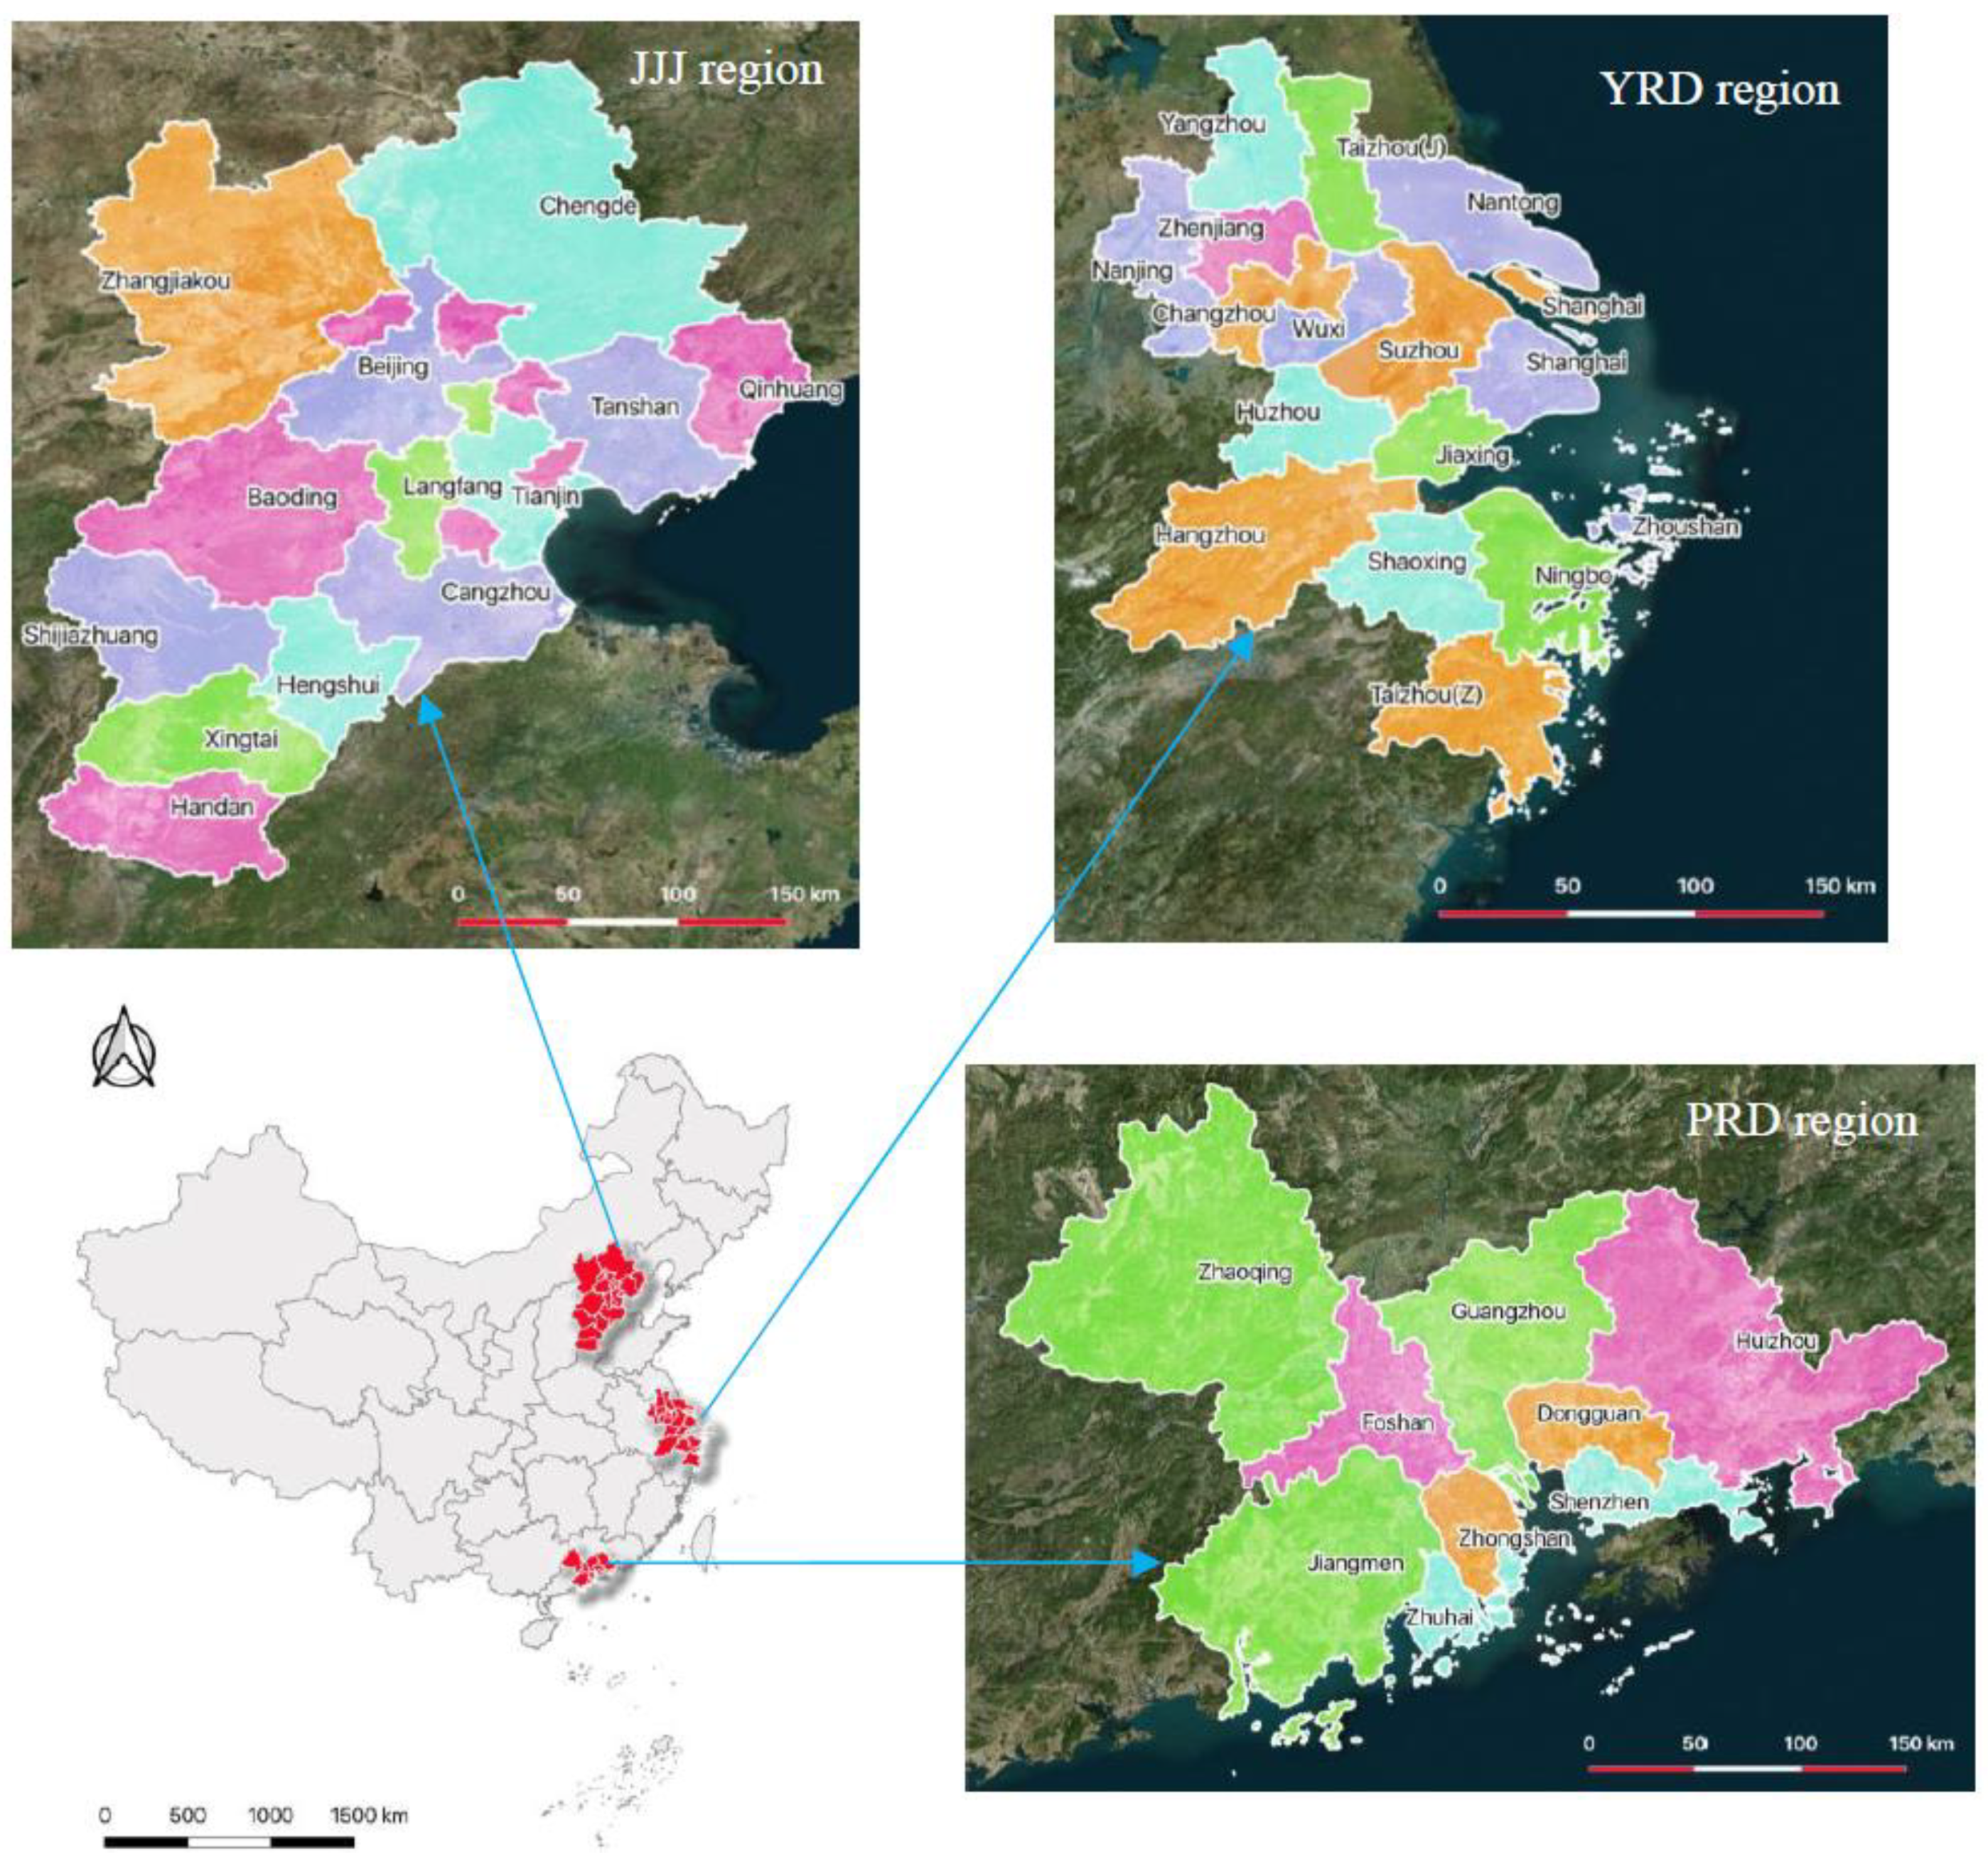
The Jing-Jin-Ji region (JJJ), the Yangtze River Delta region (YRD), and the Pearl River Delta region (PRD) (Figure 1) have been traditionally known as major coastal growth areas in China because of their relatively high levels of economy, urbanization and social integration.
The JJJ region is the national capital region of China and encompasses 13 cities along the coast of the Bohai Sea: Beijing (the capital), Tianjin, Shijiazhuang, Tangshan, Qinhuangdao, Handan, Xingtai, Baoding, Zhangjiakou, Chengde, Cangzhou, Langfang, and Hengshui. As the country’s political and cultural center, it is given priority in integrating all the cities in the Bohai Bay rim to foster economic development. During the recent decade, the JJJ region became the biggest urbanized region in Northern China, with a total population of 112 million people as of 2016. In 2017, it produced 10% of China’s gross domestic product (GDP) (USD $1.2 trillion). Due to its important economic and political status, the JJJ region has experienced massive migration and accepted 16.8 million migrants, 53.1% of them in Beijing.
The YRD region is an alluvial plain where the Yangtze River drains into the East China Sea. Generally, this region comprises three areas: the municipality of Shanghai, the central and southern parts of Jiangsu Province, and the northern parts of Zhejiang Province. As China’s largest urban cluster and the world’s sixth-largest economic center, it includes 16 cities ranked at the top level of urbanization: Yangzhou, Taizhou, Nantong, Nanjing, Zhenjiang, Changzhou, Wuxi, Suzhou, Shanghai, Huzhou, Jiaxing, Hangzhou, Shaoxing, Ningbo, Zhoushan, and Taizhou [42]. In 2013, the YRD supported 8.5% of the nation’s population (over 115 million), and 72.2% of them lived in urban areas. The region covers only 1.1% of the total land area of China, but its GDP in 2017 reached USD $1.5 trillion, accounting for 12.2% of the nation’s GDP. Economic growth and urbanization foster population mobility. In 2010, its internal and interprovincial migrants exceeded 33 million. These migrants do not have equal access to job opportunities, health and education services, social networks, and so on [43].
The PRD is the southern pillar of the Chinese coastal growth regions, located in the low-lying flood plain surrounding the Pearl River estuary. The PRD is home to nine cities of the province of Guangdong: Guangzhou, Shenzhen, Zhuhai, Foshan, Jiangmen, Zhaoqing, Huizhou, Dongguan, and Zhongshan. Since the early 1980s, the urbanization process of the PRD accelerated, and it has been one of the most densely urbanized regions in the world [44]. At the end of 2017, the PRD had a combined population of 61.5 million, accounting for 4.4% of the national population. Along with rapid urbanization, the annual GDP of the PRD increased 13.45% over three decades, and now it has become one of the most economically dynamic regions of China. As a manufacturing base of the world, this region accepts 28.71 million migrants, accounting for 51.2% of its population in 2010.
These three coastal areas are typical hotspots of climate change, with sea-level rise, flooding, storm surges, and other extreme weather events. In the YRD, climate warming and increased precipitation with strong temporal variations have been recorded since 1960. The YRD’s sea level rose quickly from 1978–2007 and is predicted to rise 210–230 mm from 2030 to 2050 [45]. An upward trend of severity and frequency of climate disasters has definitely been observed in this region. As for the JJJ region, climate change has led to an increase in temperatures during the winter months and a decrease in precipitation [46]. Accordingly, heat waves have had a tendency to increase. More daily record high temperatures occurred in Beijing from 2001 to 2008 [46]. Due to reduced precipitation in this region, extreme rainfalls have become less frequent but more intense and shorter, and extreme droughts have become more intense [47]. The PRD region is vulnerable to tidal flooding, typhoons, and saline tide intrusion for a low ground level ranging from 2.4 to −0.3 m relative to mean sea level [48]. Now, climate change exacerbates PRD’s risk of natural hazards. For example, annual mean temperatures have risen by 3.5 °C and the annual number of very hot days in summer is nearly double. The average annual rainfall increased by roughly 1% per decade and variability of rainfall increased too. Sea level rise of some magnitude is emerging and expected to continue. All of these will magnify the damage of heat waves, flooding, and storm surges [49].
3.2. Methods
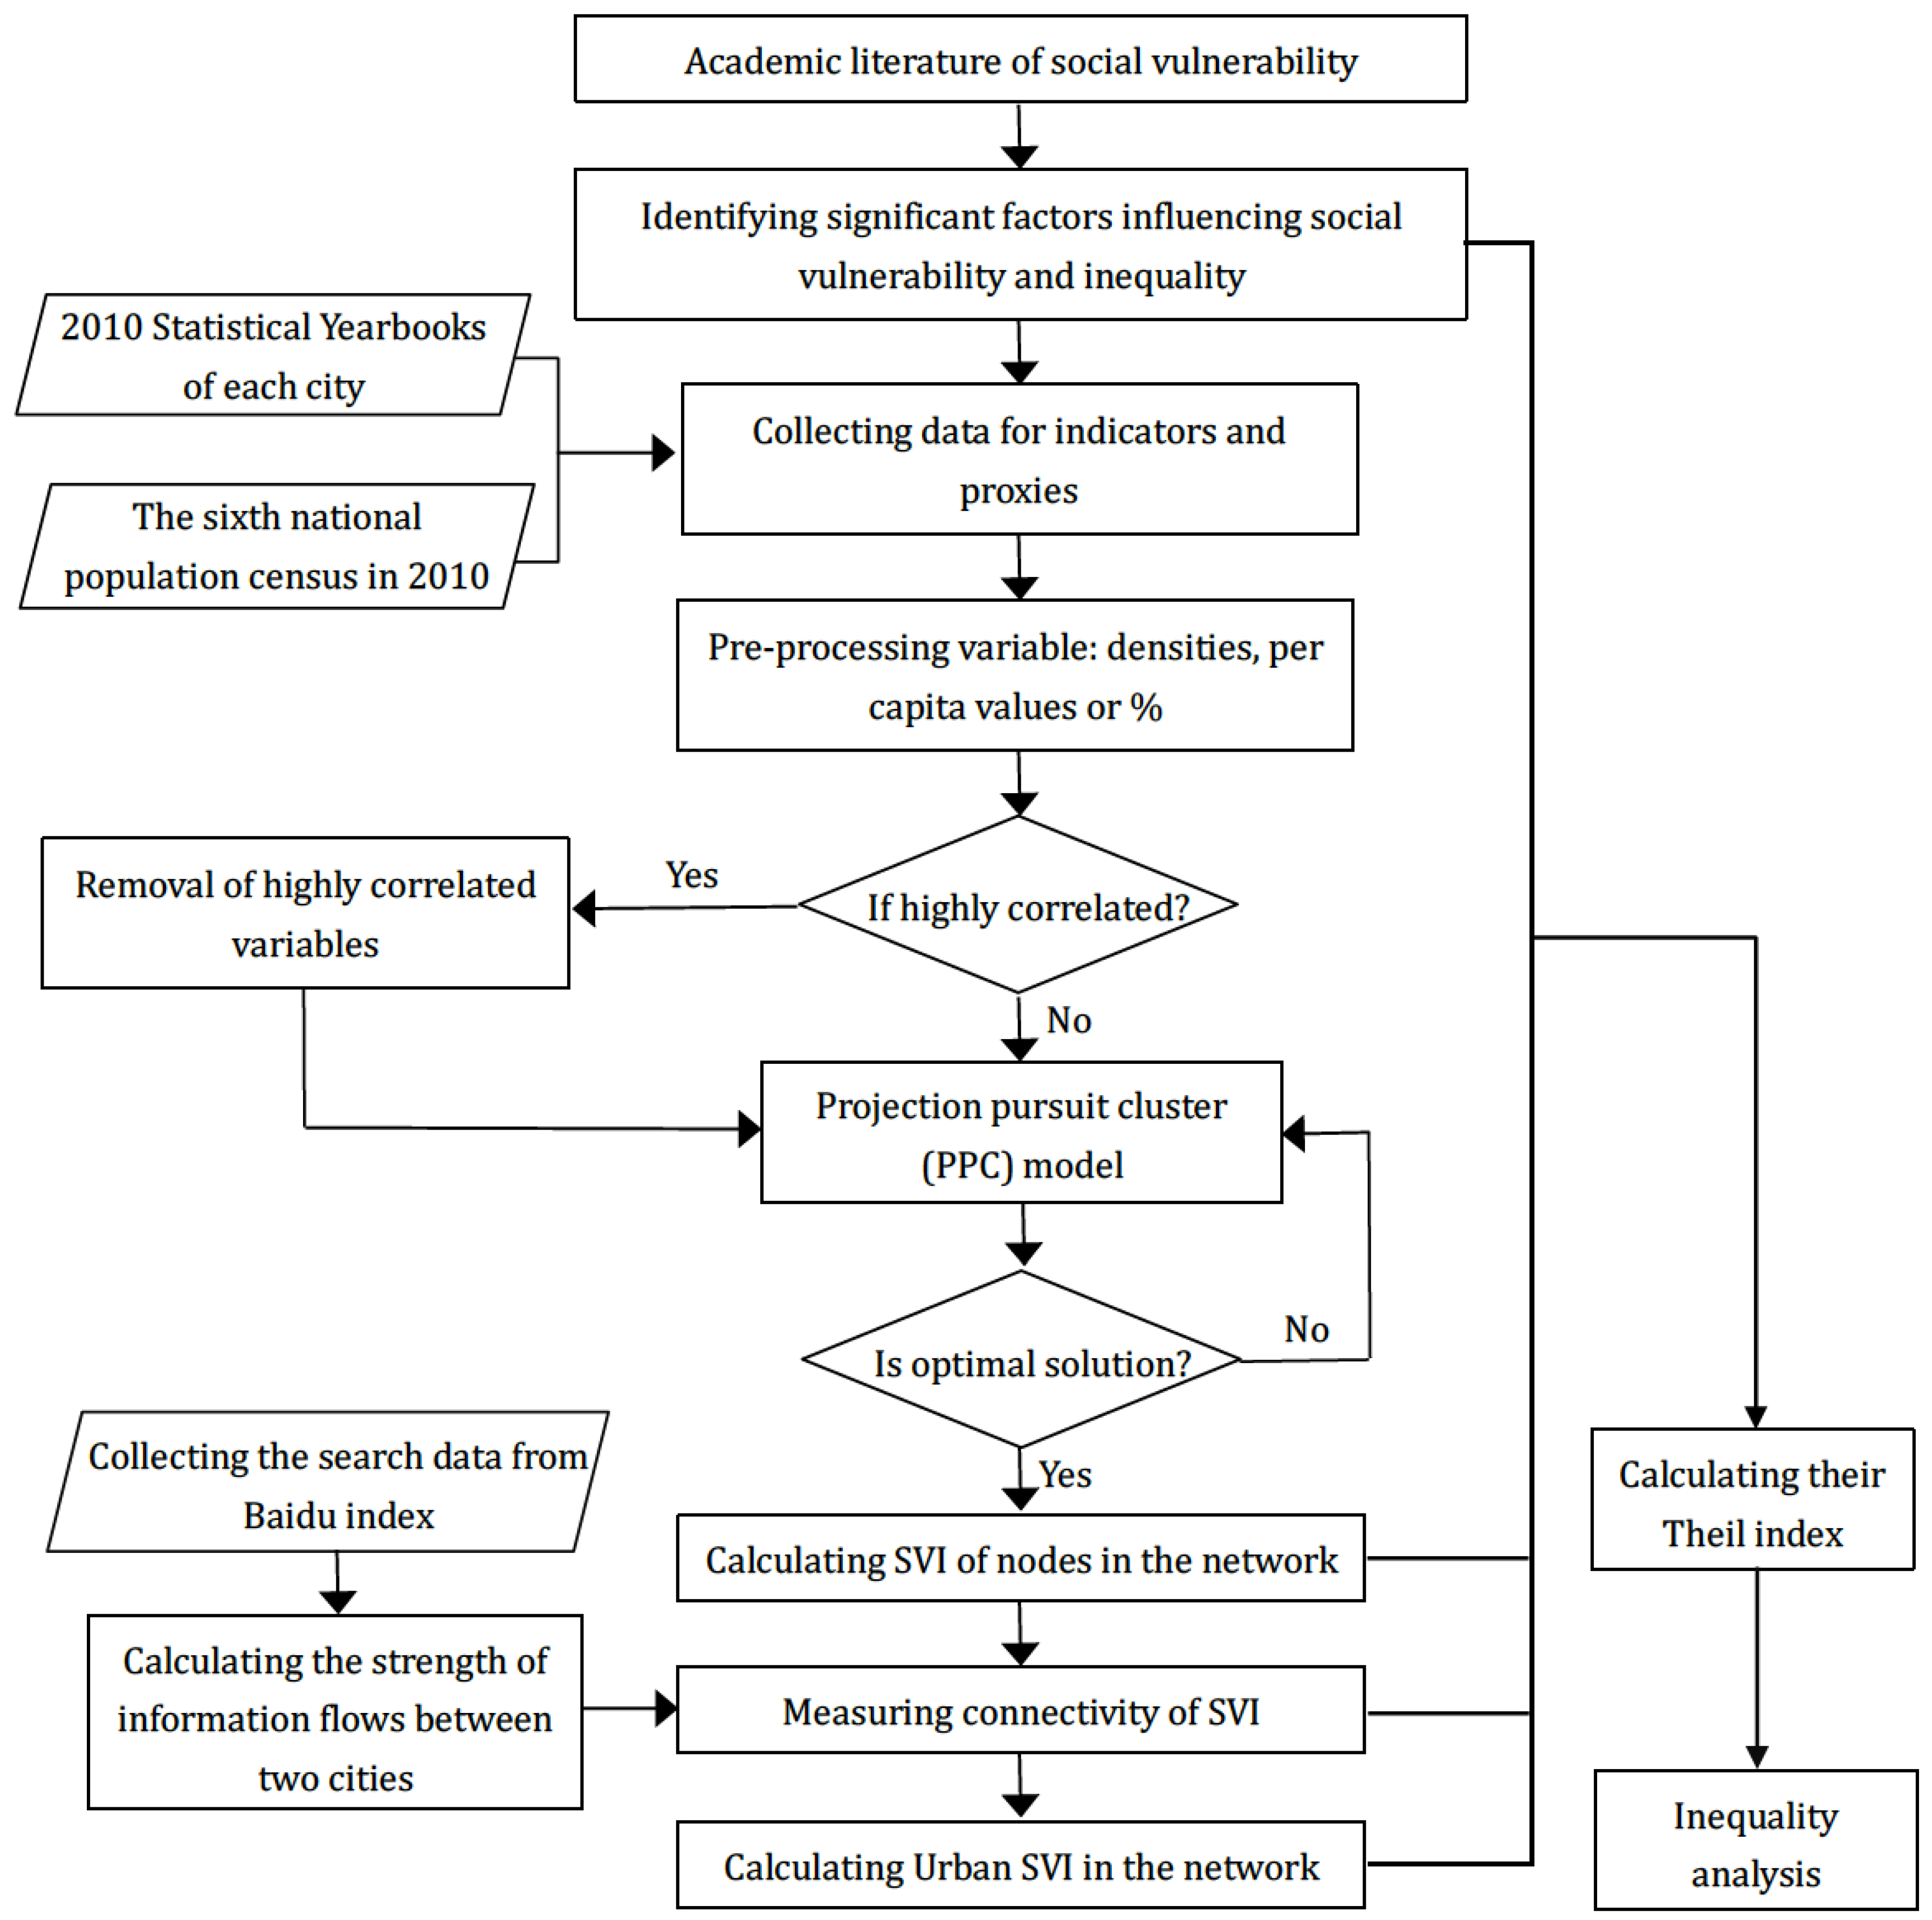
Following the structured plan about social indicators construction indicated by Maggino and Zumbo [50], a method for assessing social vulnerability and inequality is developed and illustrated in Figure 2.
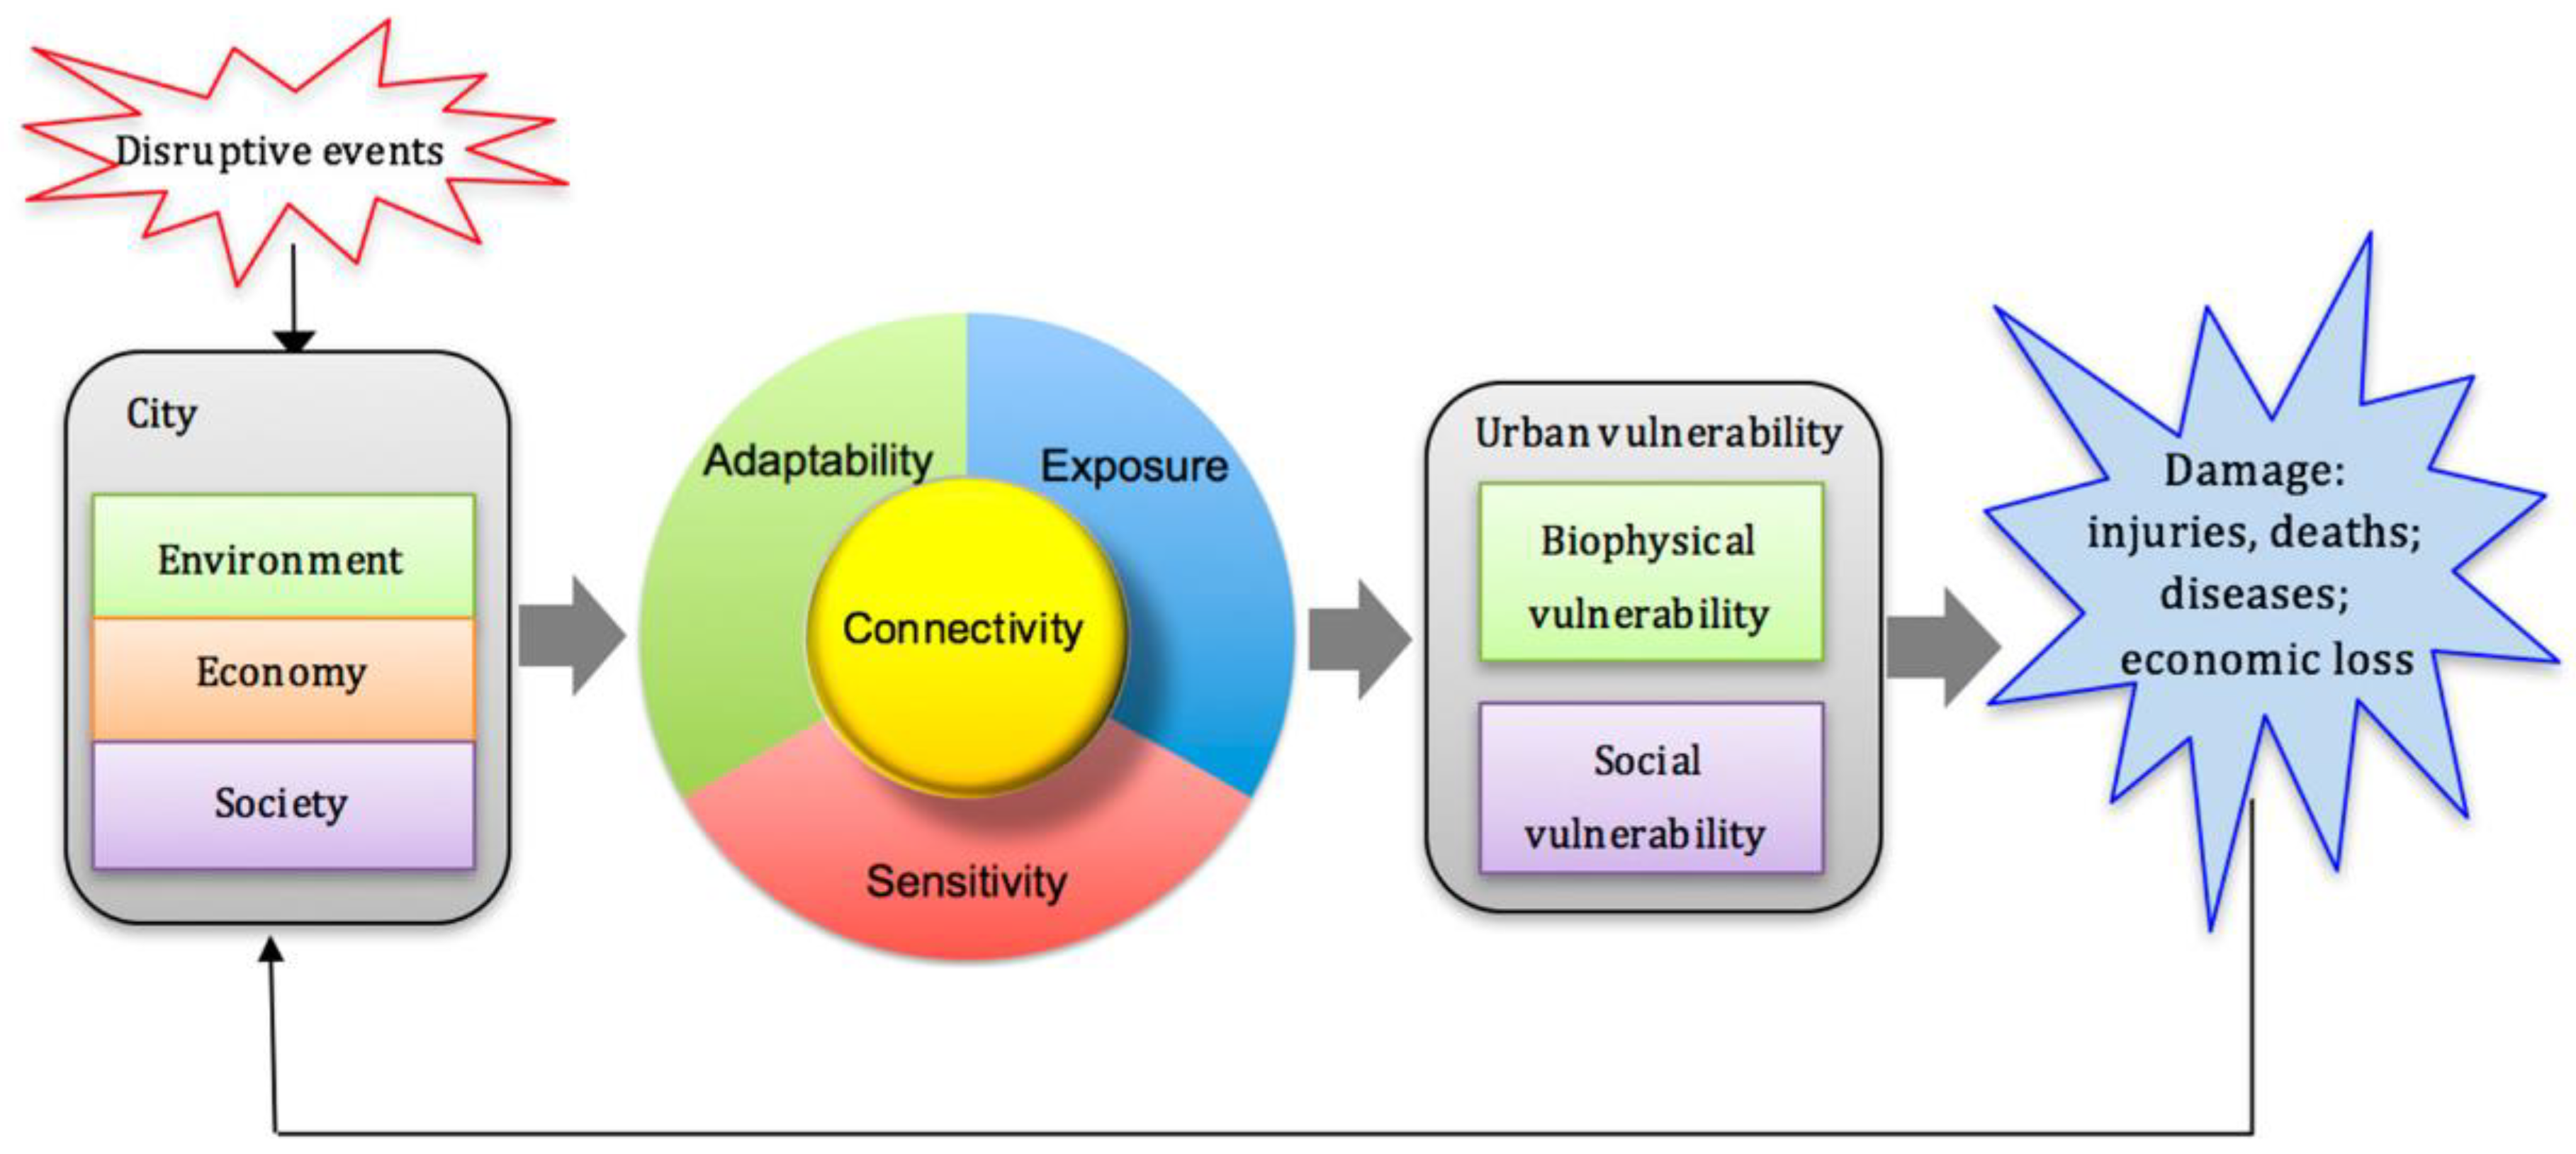
Firstly, we conceptualized social vulnerability in the context of urban agglomeration with the model proposed from a network perspective [42]. As shown in Figure 3, vulnerability is thought to stem from major aspects such as environment, economy and society. When a city suffers from a disruptive event such as climate change or climate-related disaster, all relevant attributes superimposed in three dimensions (exposure, sensitivity, and adaptability) in a traditional perspective. Actually, in a larger scale system (e.g., urban agglomeration), a city is a node linking to other nodes (cities) with different flows including physical and immaterial. All flows can affects urban exposure, sensitivity, and adaptability through changing urban attributes. Thus, from a network perspective, a fourth dimension (connectivity) should be added to the conceptual framework. This dimension aims to evaluate the ability of a city on the connection, openness and coordination in networks. With a risk perspective, these four dimensions are shown up as biophysical and social vulnerabilities that interact with each other to produce the overall vulnerability. When the overall vulnerability interacts with climate change or extreme events, disastrous damage occurs. In turn, damage can moderate or enhance vulnerability through affecting urban attributes and connections. In this paper, we only focus on social vulnerability.
Secondly, the significant factors relevant to both social vulnerability and inequality are identified based on literature mentioned above. The Social vulnerability index (SVI) of individual cities is quantified and analyzed with a projection pursuit cluster (PPC) model, the SVI of cities in urban network is calculated and analyzed with the Baidu Index, and Inequality analysis is measured by the Theil index. The details are as follows.
3.2.1. SVI of Individual Cities
The SVI provides an approach to recognize vulnerability of individual cities in light of various interacting factors of social and economic conditions. Here, a type of data we call attribute data is used. The data are collected from the Sixth National Population Census of China (2010) and several 2010 Statistical Yearbooks of each city in study area. Referring to the literature, 16 primary indicators relevant to social vulnerability and inequality were finally chosen after 8 were removed for their high correlation (Table 1).
A PPC model is applied in this study to weigh these 16 indicators and aggregate the SVI of individual cities. Projection pursuit (PP) is a statistical technique for the exploratory analysis of multivariate data sets first introduced by Friedman and Tukey in 1974 [51]. Projection pursuit seeks out a linear projection in multivariate data onto a lower dimensional space (especially one dimension) by means of optimization of the index of “interestingness”, defined as a projection index. It often uses a projection index computed on a projected density to measure the interestingness of the current projection and employs a numerical optimizer to move the projection direction to a more interesting position [52]. The PP technique can more clearly group data, exclude the interference of outliers and extract the existing structures through finding an interesting set of projections, so it is very important in independent component analysis. The most popular method used in social vulnerability assessment, principal component analysis, is a special case of projection pursuit.
This PPC model involves the following four steps:
(1) Apply min–max normalization to transform values to a minimum-maximum scale.
(2) Convert multidimensional data into a one-dimensional projection value:
where x(i, j) is the normalized value of the ith observation with the jth indicators, p = 16, n = 38; a(j) is projection direction, a unit vector of p dimensions; and and .
Develop an index function Q(a) to find the optimal projection:
where E(z) is the mean of z(i) and R is the local density radius of the window. In this study, R = ; r(i, j) is the distance between the samples, ; and u(t) is the unit step function, u(t) = 1, if or u(t) = 0, if .
(3) Develop the SVI of the individual city (an individual city is regarded as a node in an urban network, labelled SVInode):
where a*(j) is the optimal projection direction illustrating the most interesting structure of multidimensional data. a*(j) was calculated by the PPC model with the program for real-coded genetic algorithm and used as the weight of indicator in our study.
3.2.2. SVI of Cities in Urban Networks
Connectivity, another SVI dimension, describes the ability to connect and interact among individual cities in urban networks. It is considered as a valuable complement of SVI [42]. Here, urban information flow (the Baidu Index) was chosen to represent this dimension [53]. Similar to Google Trends, the Baidu Index, developed by Baidu Inc., helps to study a user’s interest in a particular topic over time from the global to city level [54]. To simulate the information flow, we investigated the mutual search interests among 16 cities in the YRD, 13 cities in the JJJ, and nine cities in the PRD. These data are called relational data in our study. The approach to evaluating SVI in urban networks includes the following 2 steps:
(1) With the relational data, connectivity of social vulnerability (SVIconnectivity) is evaluated as follows:
where i and j represent two particular cities. In the YRD, n = 16; in the JJJ, n = 13; in the PRD, n = 9. x(i, j) corresponds to the total searches from all other cities to city i, and x(j, i) means the sum of information flowing out of city i.
(2) SVIurban is modelled as:
3.2.3. Inequality Analysis
In order to discover the inequalities implicit in the factors of economic, social, health, and cultural conditions in the three urban agglomerations and recognize the influence of connectivity on inequality, a comprehensive and detailed inequality analysis was done based on the Theil index. The Theil index, proposed by Henri Theil, is widely used in the research of inequality [55,56]. It is also viewed as a measure of energy intensity and consumption, racial segregation, isolation, and so on [57,58]. The Theil index of inequality is written as:
where T denotes the overall inequality, n is the number of cities, y corresponds to the average number of the particular variable, and yi is the value of the particular variable in the ith city.
4. Results
4.1. SVI Indicators and Their Inequaities
Based on the PPC model, the weighting values for SVI of individual cities in three urban agglomerations were evaluated, and are shown in Table 2. First, in the present study, GDP makes up 11.84% of the SVI and the weight value reaches 0.42, which implies that this indicator has the most influence on social vulnerability in these urban agglomerations. Three indicators contribute much to SVI with values between 0.3 and 0.4: Children, Illiterate, and Higher education graduated. The indicator Renter influenced SVI the least, with a value of 0.02, making up only 0.6%. These results suggest that GDP, Children, Illiterate, and Higher education graduated are key to social vulnerability reduction in our study area. In other words, the local government need continue to develop economy, on the one hand, pay particular attention to Children and local education, on the other hand.
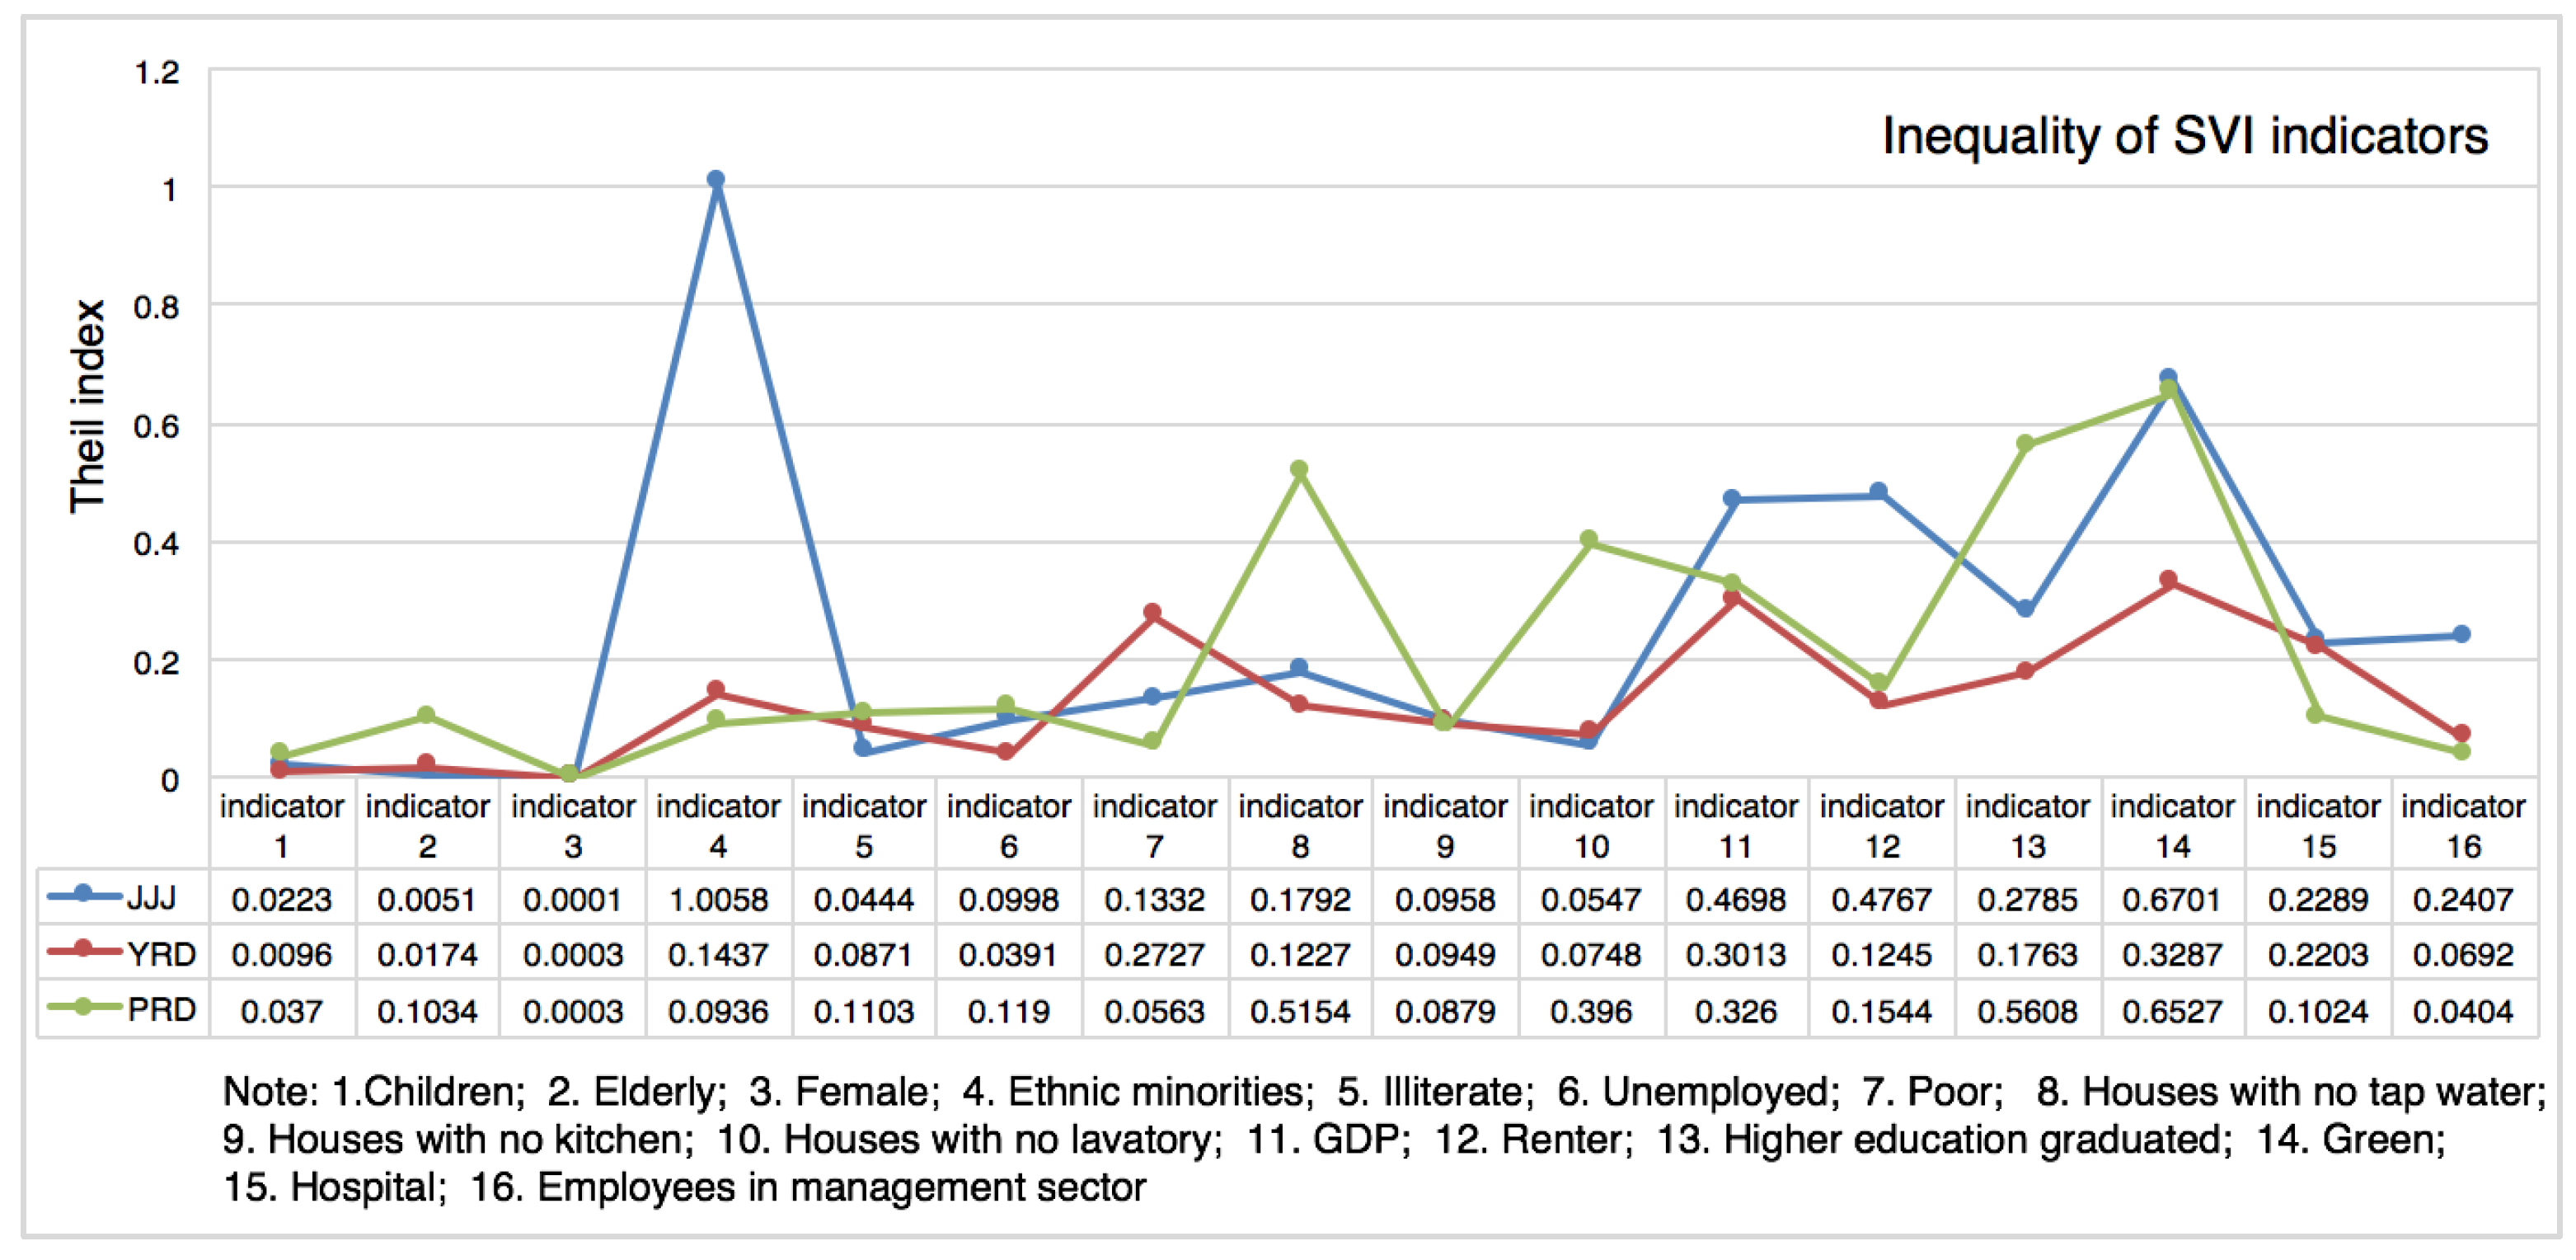
With the Theil index, the inequalities implicit in the SVI indicators were evaluated, and are shown in Figure 4. The variations of indicator inequality are different in the three agglomerations: the JJJ index is from 0.0001 to 1.0058, the YRD index is from 0.0003 to 0.3287, and the PRD index is from 0.0003 to 0.6527. The disparities of indicators in YRD are the least; only inequalities of Poor, GDP, and Green are not good and exceed 0.27. According to Table 2, the weight values of them are 0.26, 0.42, and 0.26, which means they are the focus of social vulnerability reduction. Hence, when pursuing a livelihood with a low level of social vulnerability, the local government should also attach importance to the inequalities of these indicators and take measures to reduce inequalities, for example, promoting local economic development in Zhoushan and Huzhou, improving subsistence allowances system for the urban poor in Zhoushan, and increasing vegetation cover in Yangzhou.
In JJJ, two indicators, Ethnic minorities and Green, exceed 0.65. Such a high disparity of ethnic minorities may be partly due to the specificity of Chengde in the JJJ region. This city was established by a Qing Dynasty emperor as the imperial summer residence, so it is home to large populations of ethnic minorities including Mongol and Manchu in particular and makes up 43.16% of total population [59]. Besides, the Theil indices of GDP and Renters are more than 0.45. Such high values of Green, GDP and Renter warns us that effective and strong measures should be taken to bring down its inequality, for example, supporting the economic development of cities around Beijing, reducing the renter rate in Beijing and Tianjing, and increasing vegetation cover in Cangzhou and Hengshui. In the PRD region, only Green exceeds 0.65, and two indicators, Houses with no tap water and Higher education graduated, are more than 0.5. Such a condition may be related to the typical characteristics of PRD as the workshop of the world. Too much migration creates high inequalities of living conditions and education. The results indicate that the vegetation cover in Zhaoqing should be increased, drinking water coverage should be increased in Shenzhen and Dongguan, and education in Huizhou needs be improved.
4.2. Connectivity Structure and Inequalities
Using QGIS 3.4.2, we display the spatial distribution of connectivity structure in the three urban agglomerations (Figure 5). Observing these three maps, it can be seen that five levels of urban information flows compose the whole connectivity structure. In the JJJ region, Beijing is the center of the connectivity structure, making up 16.6% of total information flow. There are various connections between Beijing and all other cities, two at Level 5 (red lines) and five at Level 4 (dark orange lines). The flows of Shijiazhuang and Tianjin are less than Beijing but more than other cities, making up 11.1% and 10.4%, respectively. These three cities combined with Zhangjiakou, Qinhuangdao, Tanshan, Langfang, and Baoding compose the supporting frame of the JJJ region. Two other cities, Zhangjiakou and Chengde, located in the northern JJJ region, are weakly connected with other cities, contributing less than 5.5% of total information flow.
In the YRD region, Shanghai is undoubtedly the most important city, linking with all other cities and making up 14.9% of total flow. It should be noted that the connections between Shanghai and other cities are strong and range from Level 3 to Level 5. The three strongest skeletons (Level 5) connecting Shanghai and Nanjing, Shanghai and Suzhou, and Shanghai and Hangzhou, along with the relatively strong skeleton (Level 4) linking Shanghai to Nantong, Changzhou, Wuxi, Jiaxing, and Ningbo and linking Hangzhou to Ningbo, Nanjing to Suzhou, and Wuxi to Suzhou, become the main frame of the YRD region. In the PRD region, the strongest skeleton connects Guangzhou, Shenzhen, and Dongguan. These three Level 5 cities, coupled with two Level 4 cities, Foshan and Huizhou, constitute the backbone of the connectivity structure and make up more than 68.8% of the total flow. Two cities in the western part of this region, Zhaoqing and Jiangmen, have less flow than other cities and only make up 14.3% of the whole flow.
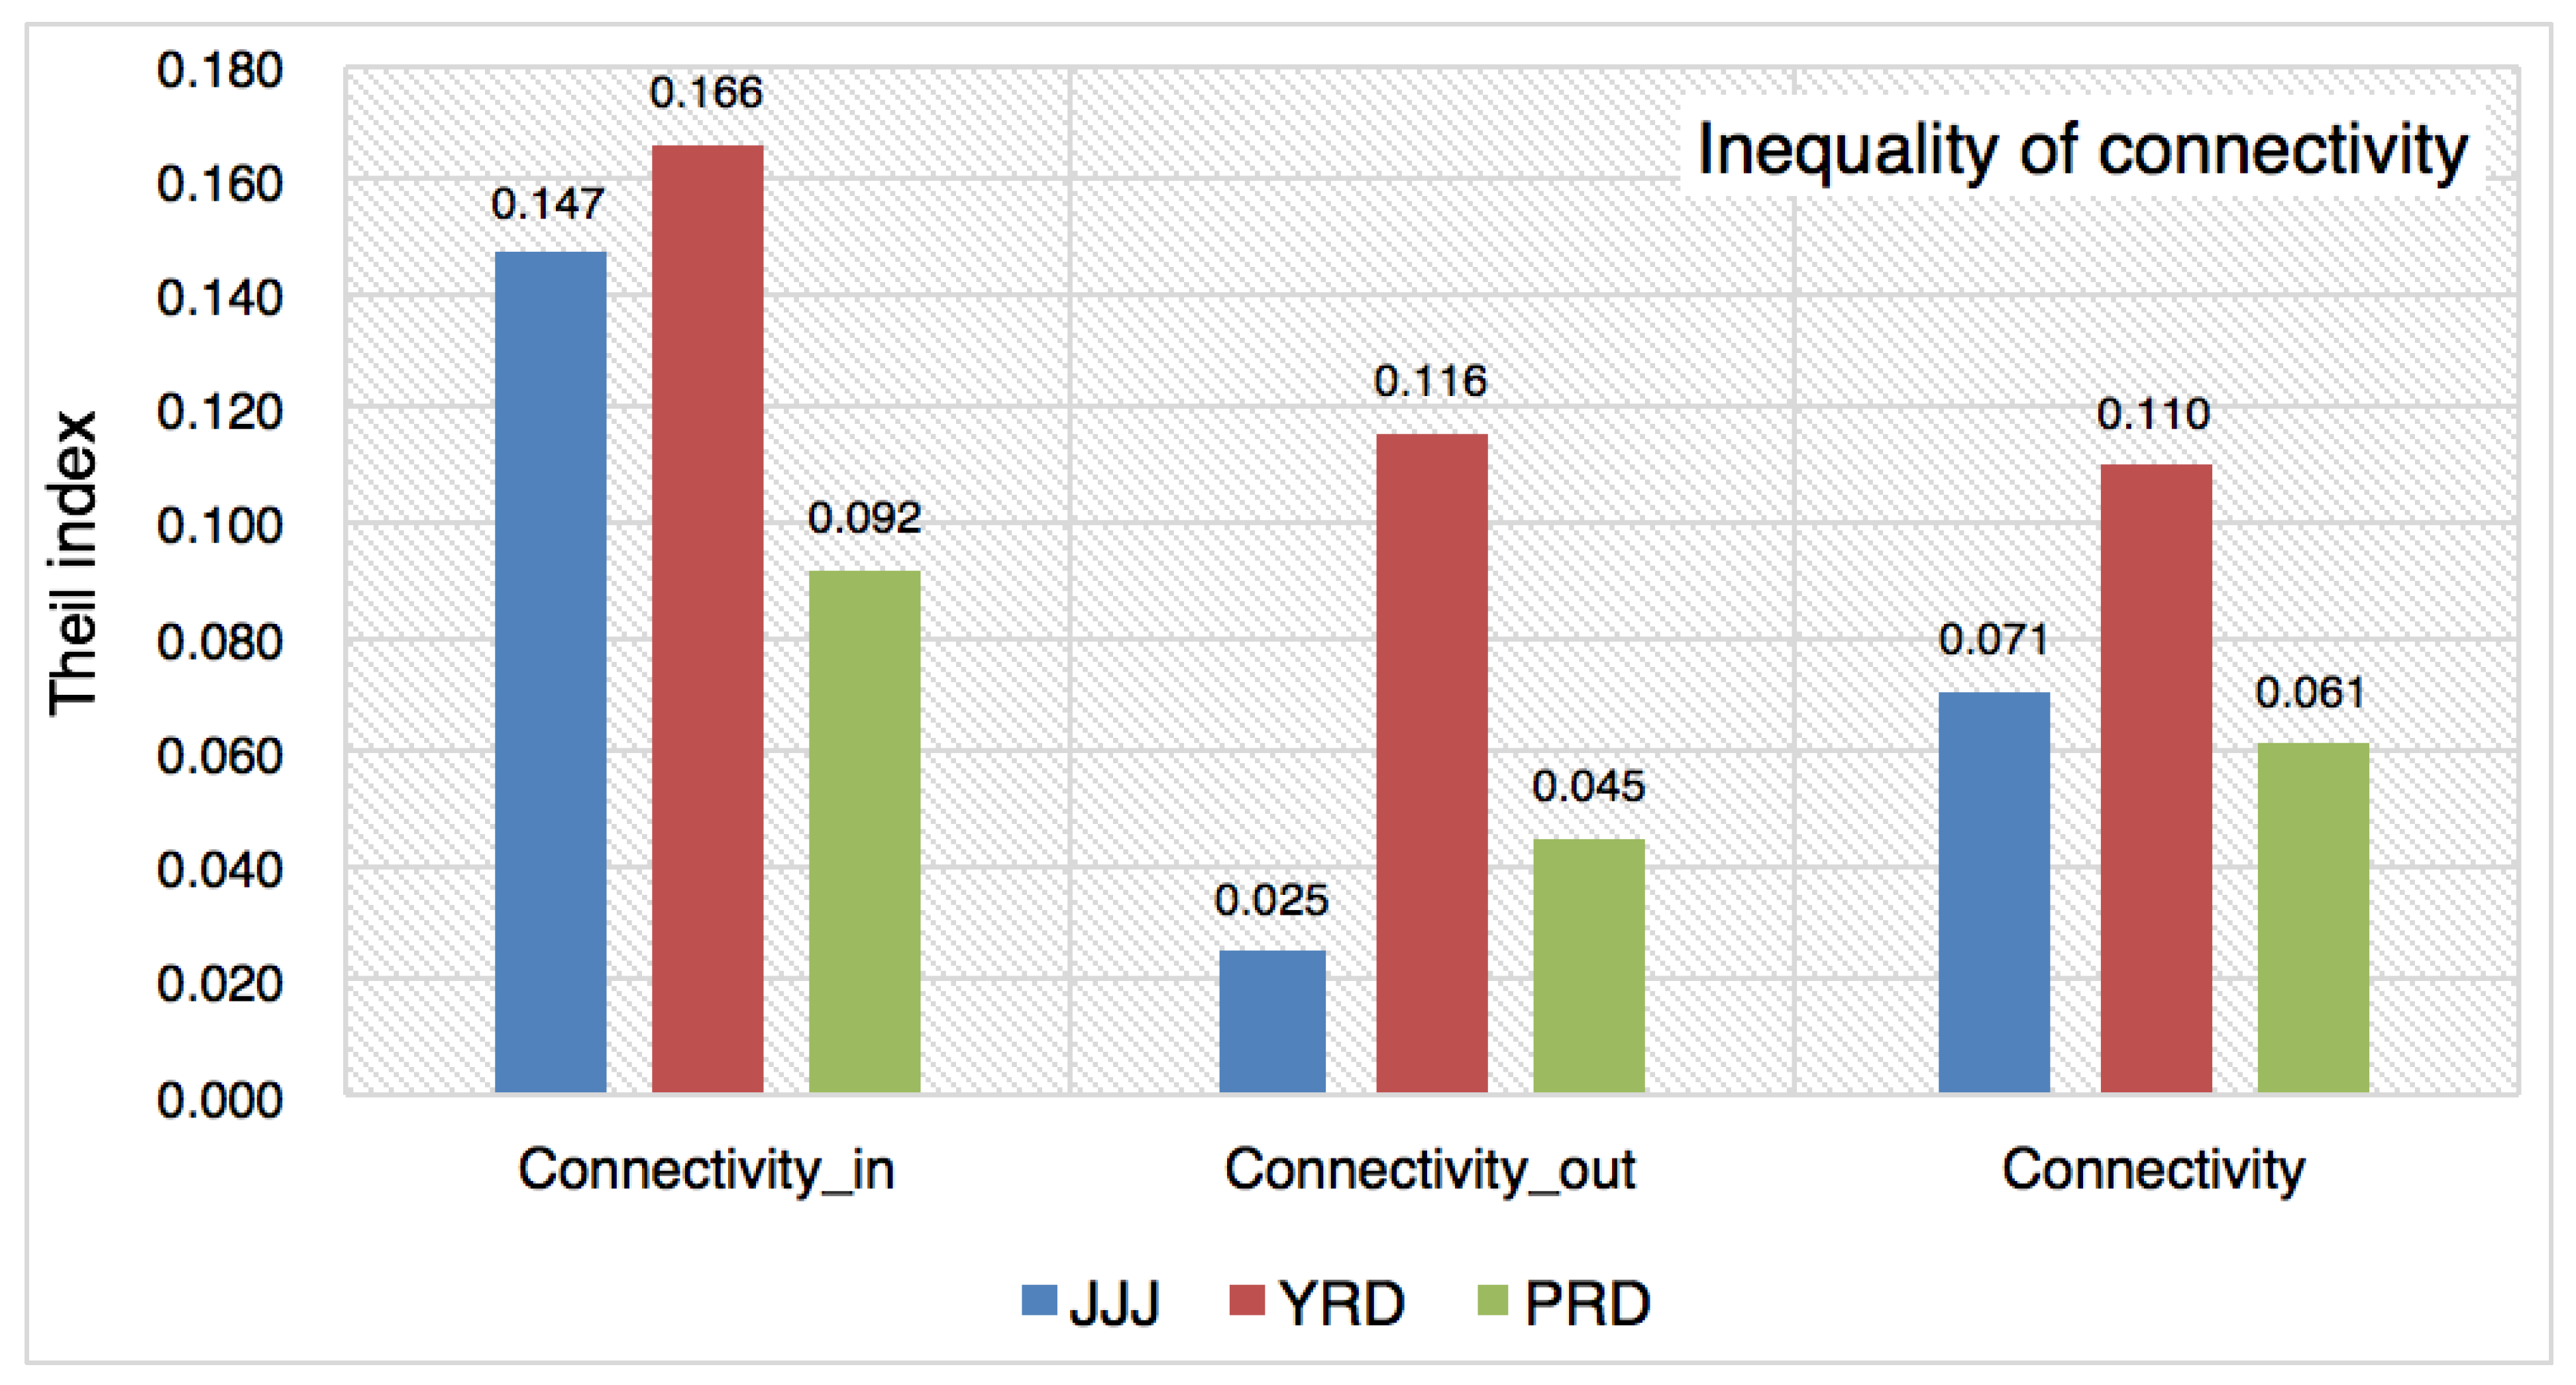
We calculated the Theil index for three types of connectivity: Connectivity_in is about flows from all the other cities to a particular city, Connectivity_out corresponds to the information flowing out of the particular city, and Connectivity is the sum of both. All of these are shown in Figure 6. First, the inequality of Connectivity_in is larger than that of the other types. Second, though the connectivity structure of YRD is more complicated and stronger than that of the other two agglomerations (Figure 5), its inequality is higher than the others. In the JJJ region, the inequality of Connectivity_in and Connectivity are worse than PRD but better than YRD. However, the inequality of Connectivity_out is much better than the other two. Three inequalities of PRD are all small. The inequality of Connectivity_out in PRD is between JJJ and YRD, and the inequalities of Connectivity_in and Connectivity in PRD are the least. Such a condition may result from fewer cities in PRD and more similar urban development.
4.3. SVI and Inequalities
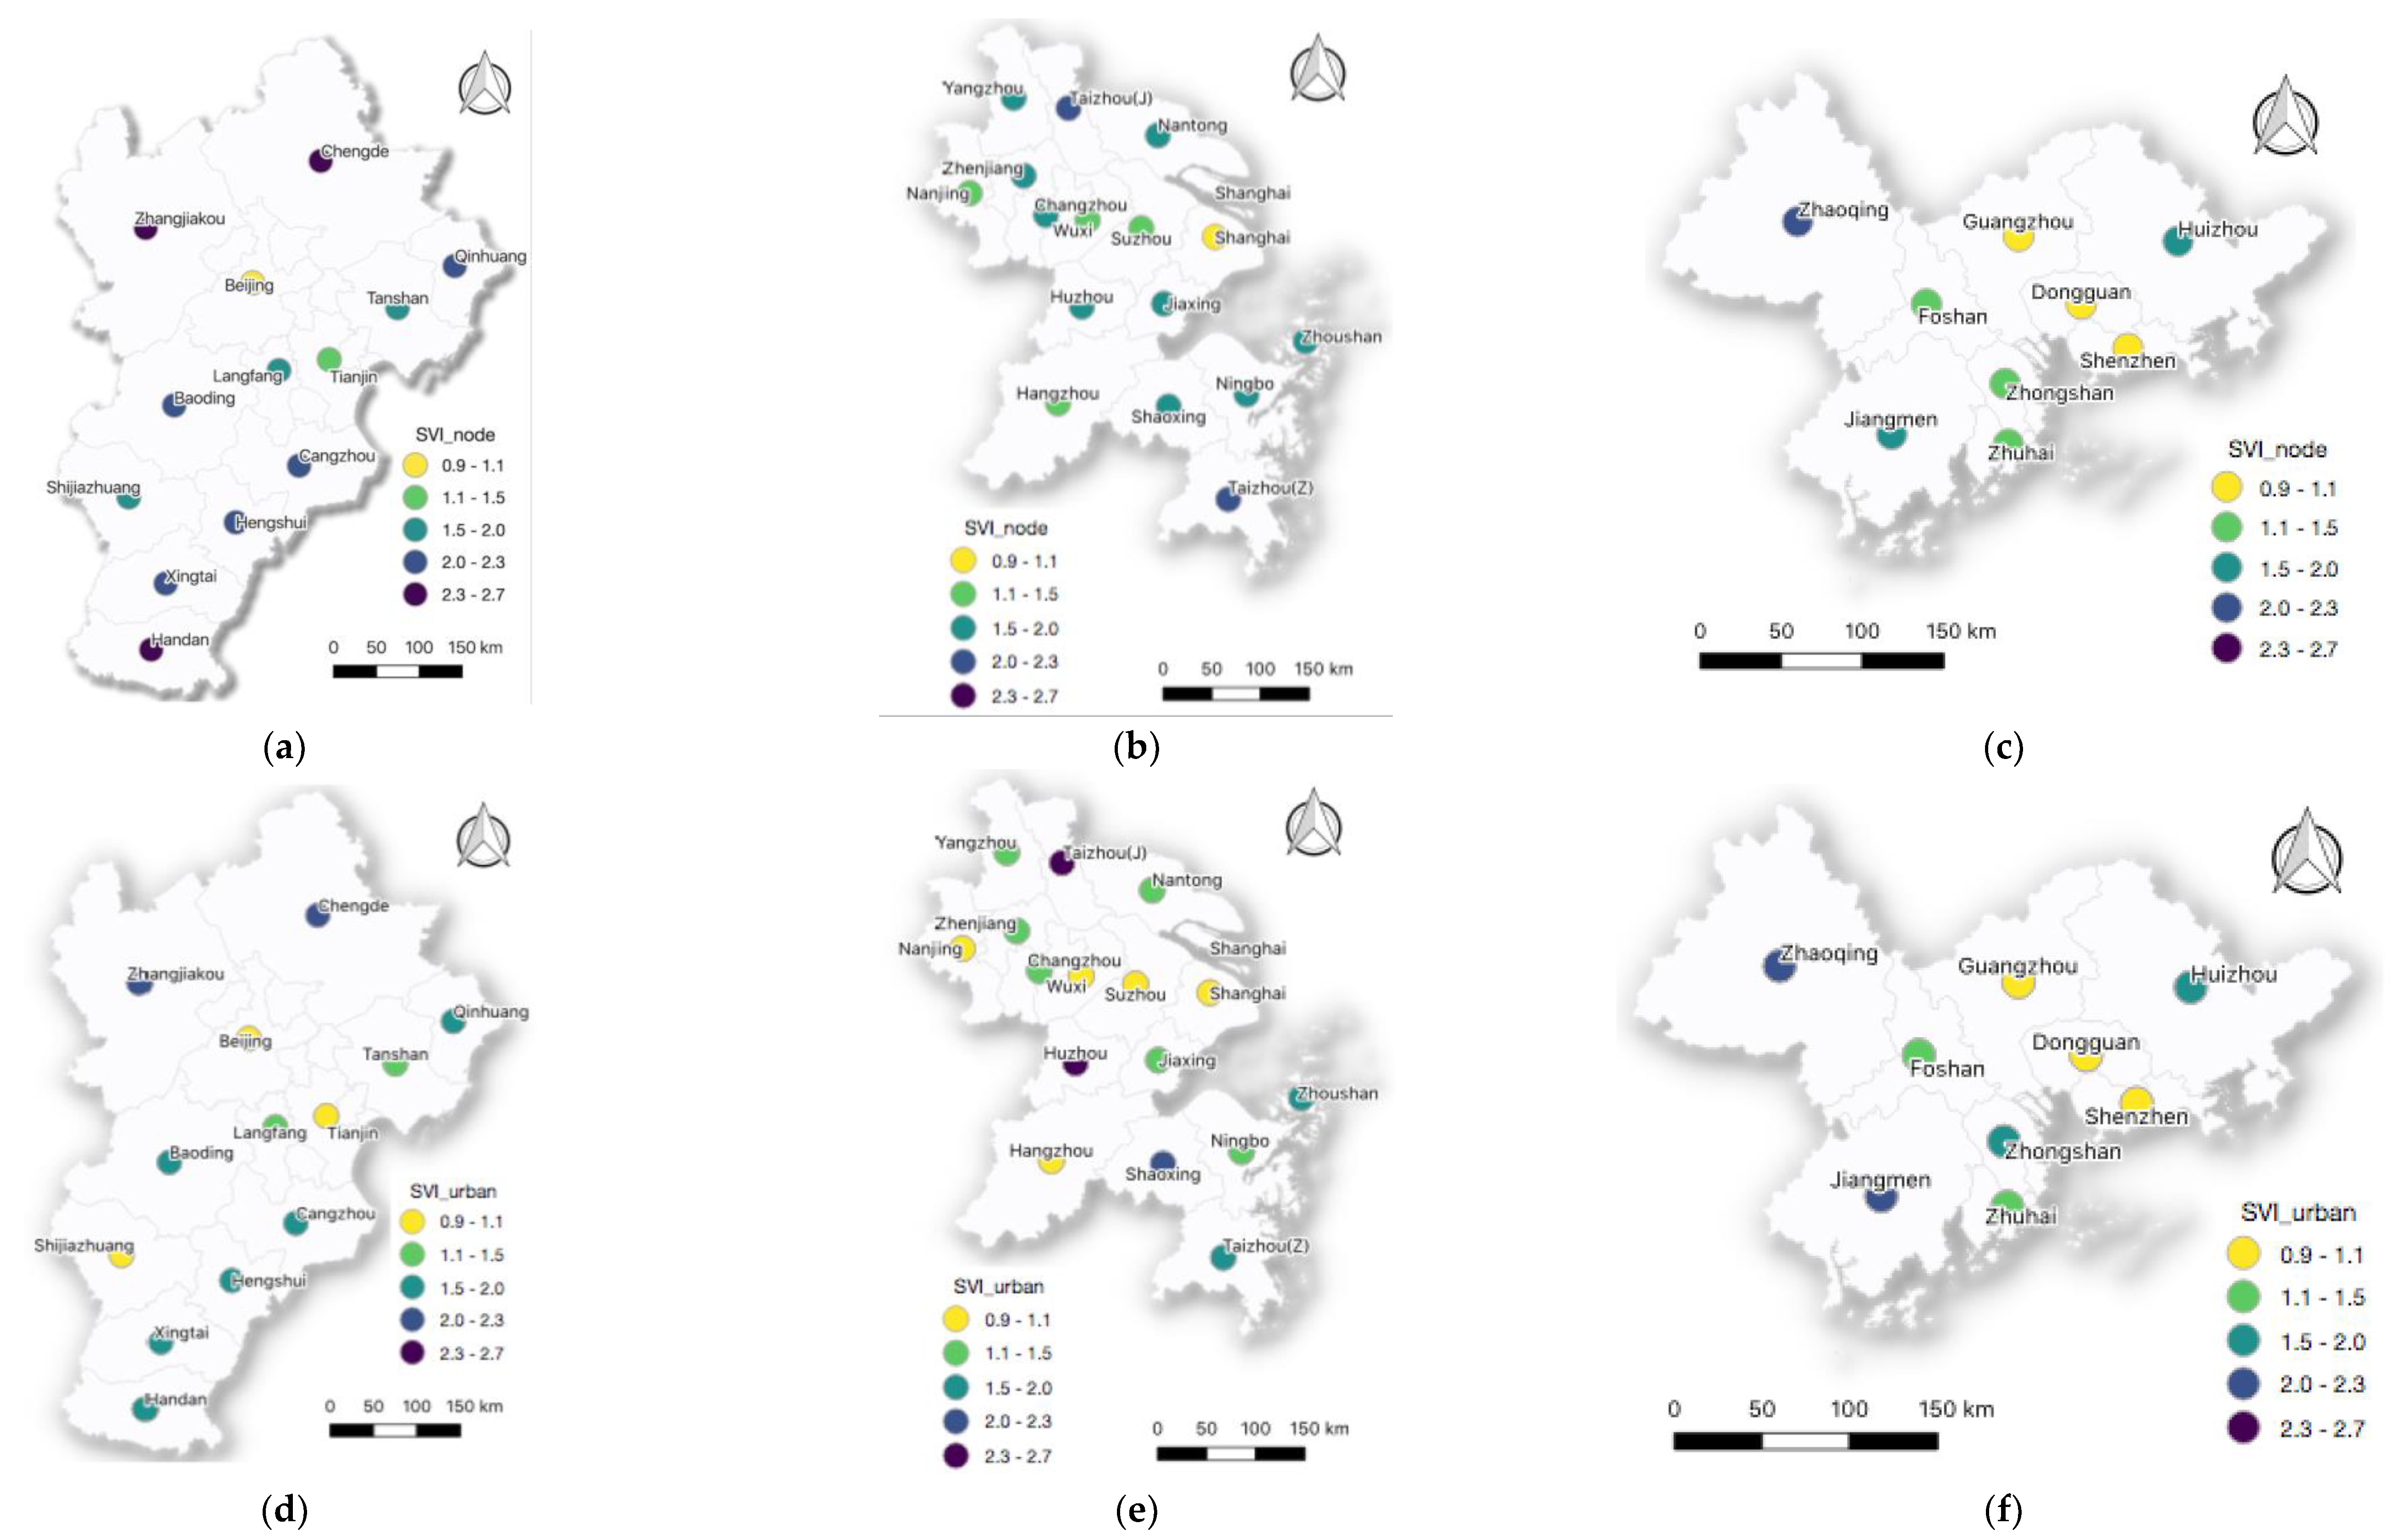
There is no doubt that differences in SVInode can be found in the three urban agglomerations. (1) Separately, one city in JJJ (Beijing), one city in YRD (Shanghai), and three cities in PRD (Guangzhou, Dongguan, Shenzhen) are classified as Level 1. The PRD has the most cities with the least social vulnerability. (2) In YRD and PRD, there is no SVI at Level 5. Two cities in the YRD, Taizhou (J) and Taizhou (Z), and one city in the PRD, Zhaoqing, are at Level 4, while four cities in JJJ, Chengde, Zhangjiakou, Xingtai, and Handan, are at Level 5. Certainly, the condition of SVInode in JJJ is worse than in the other urban agglomerations. When cities in these three regions are connected with urban information flows, their social vulnerability (SVIurban) changes distinctly. (1) In JJJ, besides Beijing and Langfang, all other cities had their social vulnerability reduced. In detail, social vulnerability of Tianjin and Shijiazhuang were reduced to Level 1. Chengde and Zhangjiakou moved from Level 5 to Level 4, and Xingtai and Handan changed from Level 5 to Level 3. (2) In YRD, eleven cities had their social vulnerability decreased. For example, four cities, Nanjing, Wuxi, Suzhou, and Hangzhou, changed from Level 2 to Level 1. Five cities, Ningbo, Changzhou, Jiaxing, Yangzhou and Nantong, changed from Level 3 to Level 2. However, Taizhou (J) and Huzhou were classified as Level 5, and Shaoxing moved from Level 3 to Level 4. (3) In PRD, seven cities kept their original values and only two cities increased their social vulnerability after connection, Zhongshan and Jiangmen. More information is provided in Table 3.
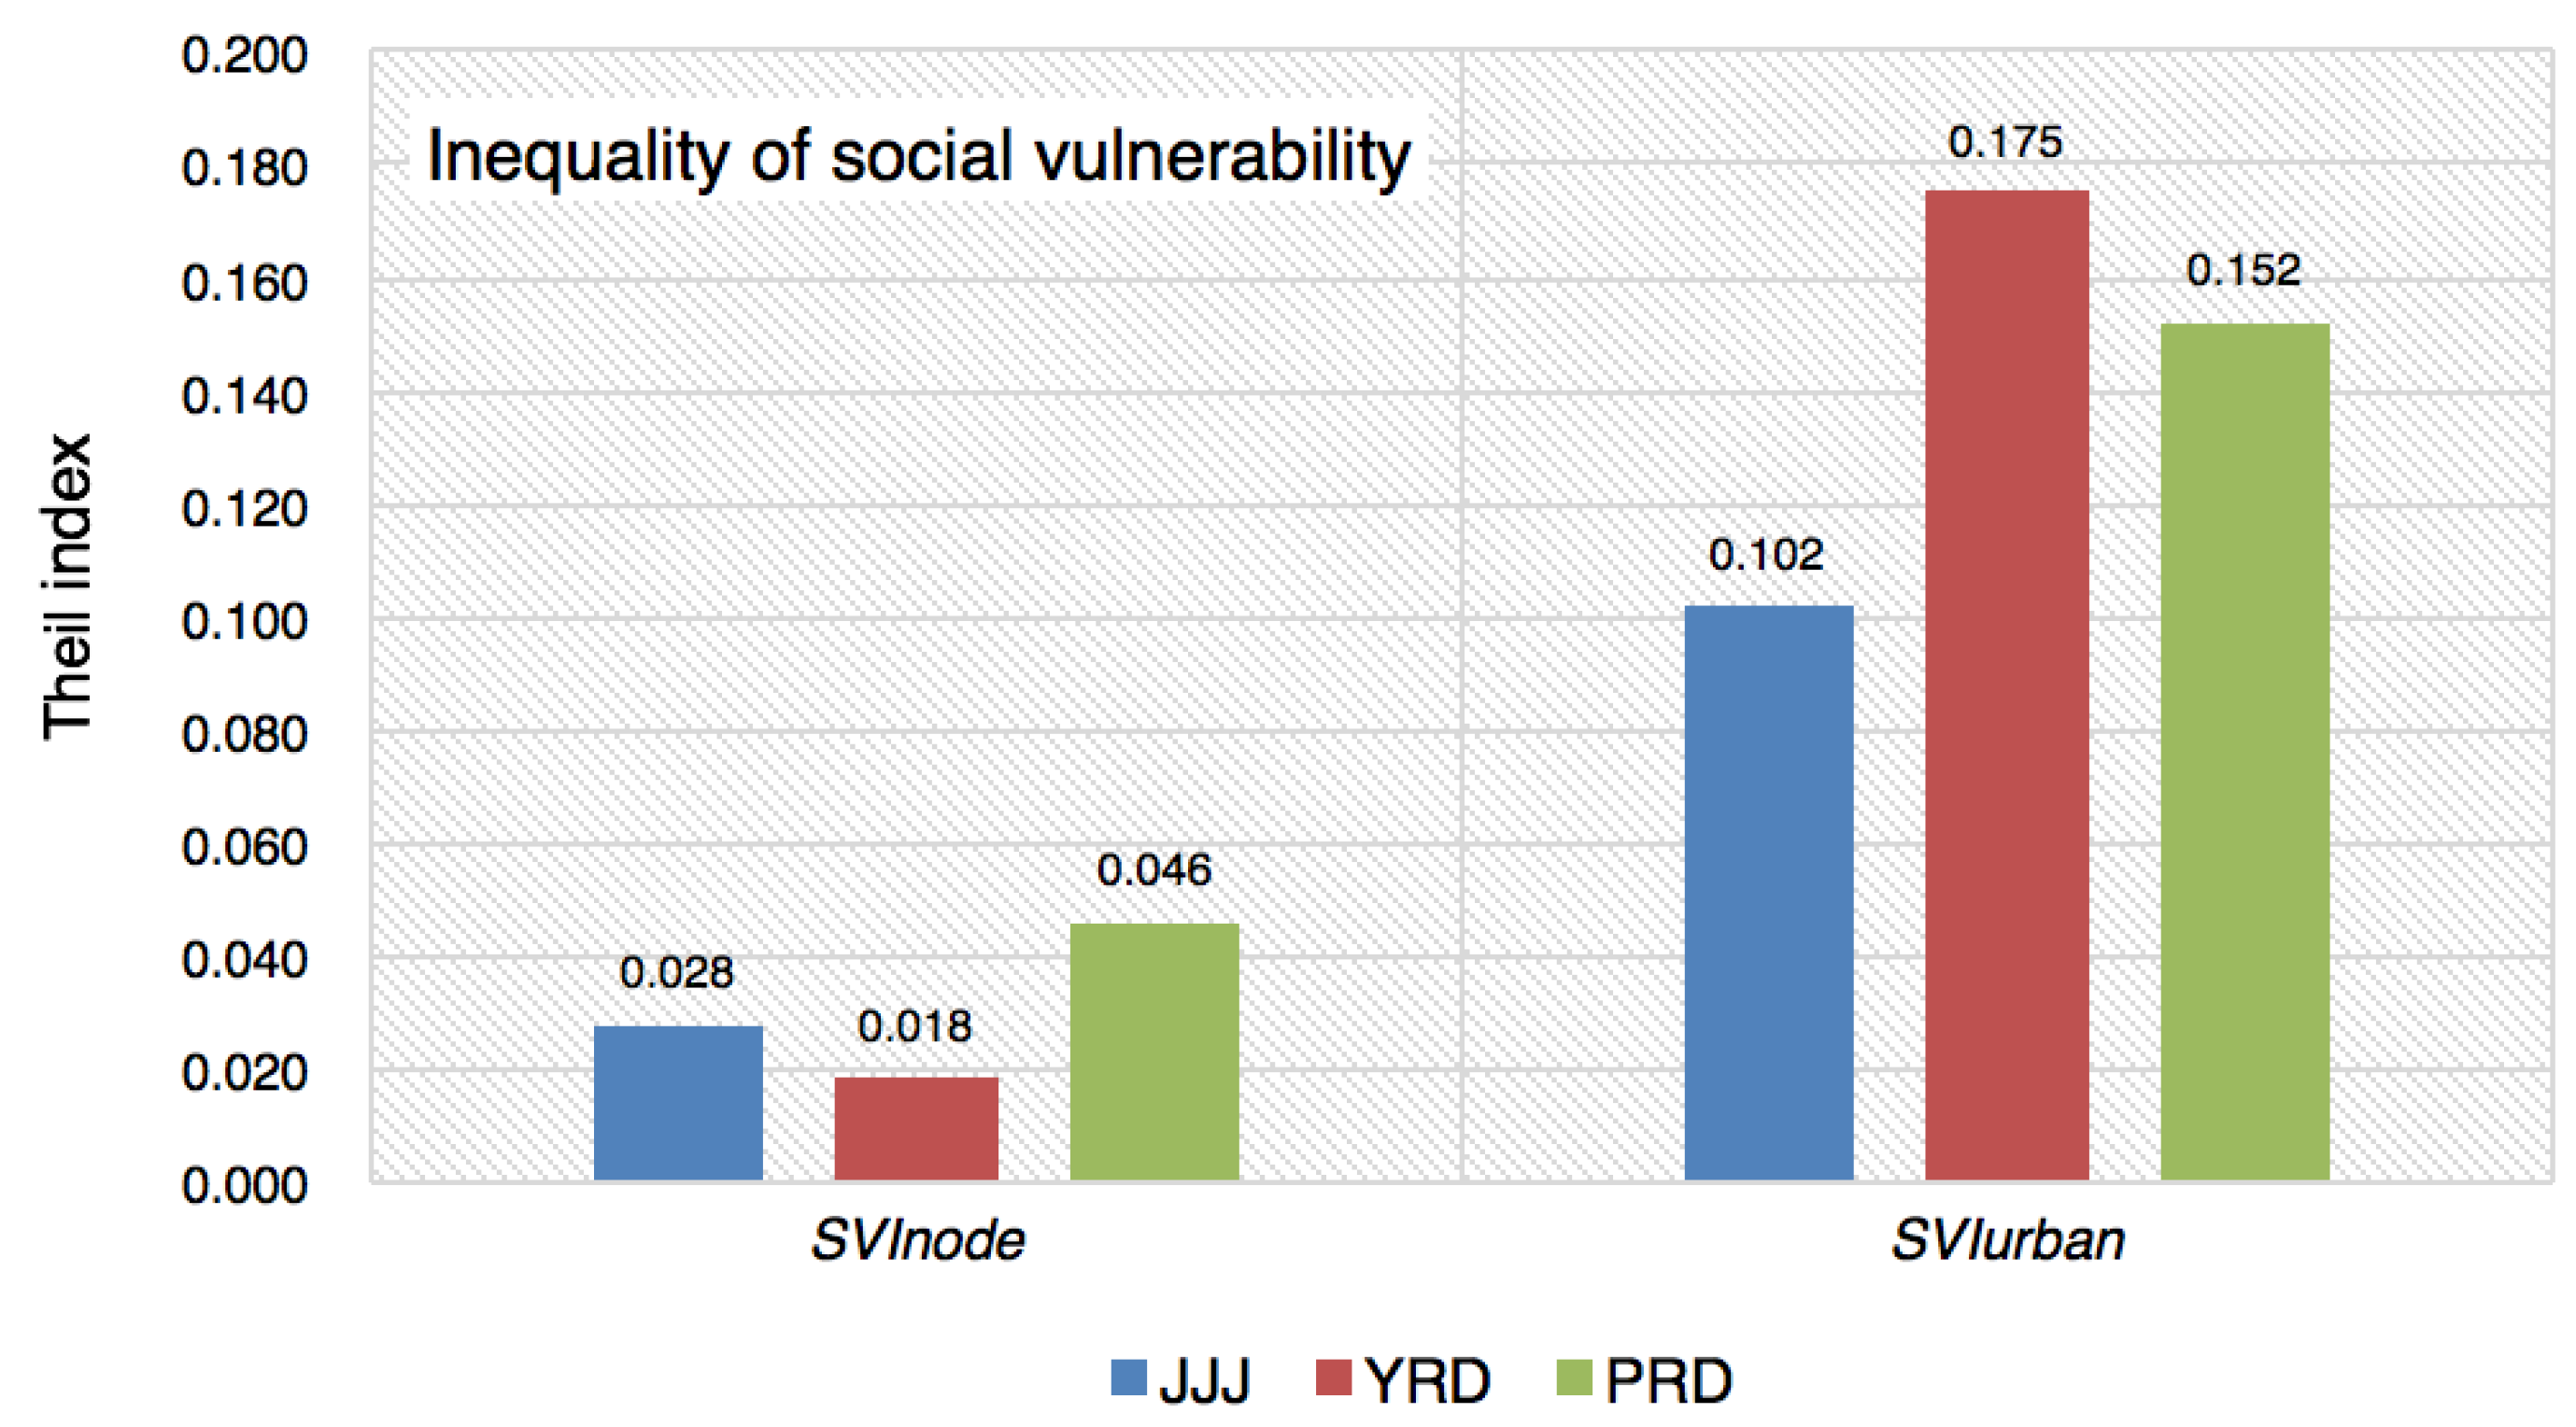
As one particular dimension of social vulnerability, how does connectivity affect the inequalities of SVI in the three agglomerations? We evaluated and compared the Theil index of SVInode and SVIurban (Figure 8). In each urban agglomeration, the inequalities of social vulnerability of individual cities are all less than 0.05. The inequality of PRD is the largest, and that of YRD is the least. When considering connectivity, all inequalities of social vulnerability increased by more than 0.05. In detail, the difference between the social vulnerability with connectivity and without connectivity is 0.157, 0.074 and 0.106 for YRD, JJJ and PRD, respectively. That means connectivity can help reduce social vulnerability; hence, flows between cities shouldn’t be restrained. But on the other hand, connectivity can increase the disparity of social vulnerability, thus, it’s imperative for local government to attach more significance and provide more support to cities in Level 4 and 5, such as Taizhou (J), Huzhou and Shaoxing in YRD, Chengde and Zhangjiakou in JJJ, Zhaoqing and Jiangmen in PRD.
5. Discussion and Conclusions
Social vulnerability has been a persistent issue of risk management and urban development, and inequality analysis can offer us new insights for social vulnerability research. In order to build livelihoods that are resilient to climate change and disasters, we should focus on reducing social vulnerability together with inequality. This paper contributes to a joint analysis of social vulnerability and inequality with reference to urban agglomerations in China. Based on a conceptual framework of social vulnerability from a network perspective, the social vulnerability index (SVI) of individual cities is quantified with a projection pursuit cluster (PPC) model, the SVI of cities in urban networks is calculated with the Baidu Index, and an inequality analysis is measured and explained by the Theil index. We pilot this method in three urban agglomerations: the Jing-Jin-Ji (JJJ) region, the Yangtze River Delta (YRD) region, and the Pearl River Delta (PRD). Accordingly, our findings are summarized in three parts.
(1) SVI indicators and inequalities. The results suggest that the indicators that affect social vulnerability more are GDP, Children, Illiterate, and Higher education graduated. Thus, the local government need continue to develop economy, on the one hand, pay particular attention to Children and local education, on the other hand. The inequalities of SVI indicators are different in the three agglomerations. In the JJJ region, four indicators—Ethnic minorities, Green, GDP and Renters—are more than 0.45. In the YRD region, the disparities of indicators are small except for Poor, GDP, and Green. In PRD, three indicators, GDP, Houses with no tap water, and Higher education graduated, are more than 0.5. Therefore, the government should attach importance to the inequalities of these indicators and take measures to reduce inequalities, for instance, promoting local economic growth in Zhoushan, Huzhou and cities around Beijing, reducing the renter rate in Beijing and Tianjing, increasing vegetation cover in Cangzhou, Hengshui, Yangzhou and Zhaoqing, improving subsistence allowances system for the urban poor in Zhoushan, increasing drinking water coverage in Shenzhen and Dongguan, and improving education in Huizhou.
(2) Connectivity structure in social vulnerability and inequalities. In the JJJ region, Beijing is the center of this area, with Shijiazhuang, Tianjin, Zhangjiakou, Qinhuangdao, Tanshan, Langfang and Baoding composing the supporting frame of the region. In the YRD region, Shanghai is the most important city. The strongest skeleton connecting Shanghai, Nanjing, Suzhou, and Hangzhou, along with the relatively strong skeleton linking Shanghai to Nantong, Changzhou, Wuxi, Jiaxing, Ningbo, and linking Hangzhou to Ningbo, Nanjing to Suzhou, and Wuxi to Suzhou have become the main frame of the region. In the PRD region, the strongest skeleton connects Guangzhou, Shenzhen, and Dongguan. These three cities coupled with Foshan and Huizhou constitute the backbone of the network. Though the connectivity structure of YRD is more complicated than other two agglomerations, its inequality is higher than the others. The inequality of Connectivity_in and Connectivity in JJJ are worse than PRD but better than YRD. However, the inequality of Connectivity_out in JJJ is much better than the other two. These three inequalities in PRD are all small, because the region has more similar urban development.
(3) SVIs of individual cities (SVInode) and of cities in urban networks (SVIurban). The results of SVInode show that PRD has the most cities at the lowest level. Moreover, the condition of SVInode in JJJ is worse than the other urban agglomerations. When the cities in the three regions are connected with urban information flows, their social vulnerability (SVIurban) changes distinctly. In JJJ, besides Beijing and Langfang, all other cities had their social vulnerability reduced. In YRD, eleven cities had their social vulnerability decreased. In PRD, seven cities kept their original values and only two cities increased their social vulnerability after connection. That means connectivity can help reduce social vulnerability, so, connections and flows between cities shouldn’t be restrained.
(4) The inequalities of social vulnerability index. After evaluating and comparing the Theil index of SVInode and SVIurban, we found that in each urban agglomeration, the inequalities of SVInode are all less than 0.05; the inequality of PRD is the largest and that of YRD is the smallest. When considering connectivity, all inequalities of social vulnerability increased by more than 0.05. The difference between the social vulnerability with connectivity and without connectivity is 0.157, 0.074 and 0.106 for YRD, JJJ and PRD, respectively. That means connectivity can increase the disparity of social vulnerability, therefore, it’s crucial for local government to attach more significance and provide more support to cities in Level 4 and 5, such as Taizhou (J), Huzhou and Shaoxing in YRD, Chengde and Zhangjiakou in JJJ, Zhaoqing and Jiangmen in PRD.
Several limitations to our findings deserve mention. First, social vulnerability and social inequality are both complicated, and a joint study cannot avoid simplification and may lose useful information. Second, only one year of data is applied in our study, and a long-time series of data may help us find more about the relationships between social vulnerability and inequality. Third, additional places with various scales such as districts, cities, and urban agglomerations remain to be investigated. More samples and work are needed for our in-depth joint assessment of social vulnerability and inequality in future research.
Author Contributions
Y.G., G.F.Y., and Y.C. contributed the materials; W.D. designed and performed the method; Y.G. analyzed the data and wrote the paper.
Funding
“This research was funded by the National Natural Science Foundation of China (Grant Nos. 41571488, 41401382, 41571342 and 41701186), the Philosophy and Social Sciences Foundation in Jiangsu Province (Grant No. 17JDB010), and the Ministry of Education Humanities and Social Science Fund (Grant No.17YJCZH029).
Acknowledgments
Special thanks to the reviewers and editors for their critical comments that greatly helped in improving the quality of this paper.
Conflicts of Interest
The authors declare no conflict of interest.
References
- Sall, C. Climate trends and impacts in china. Discuss. Pap. 2013, 48. [Google Scholar]
- Pelling, M. The Vulnerability of Cities: Natural Disasters and Social Resilience; Earthscan: London, UK; Sterling, VA, USA, 2003. [Google Scholar]
- Nguyen, C.V.; Horne, R.; Fien, J. Assessment of social vulnerability to climate change at the local scale: development and application of a Social Vulnerability Index. Clim. Chang. 2017, 143, 355–370. [Google Scholar] [CrossRef]
- Gnansounou, E. Assessing the energy vulnerability: Case of industrialised countries. Energy Policy 2008, 36, 3734–3744. [Google Scholar] [CrossRef]
- McCarthy, J.J.; Canziani, O.F.; Leary, N.A.; Dokken, D.J.; White, K.S. Climate Change 2001: Impacts, Adaptation and Vulnerability; McCarthy, J.J., Canziani, O.F., Leary, N.A., Dokken, D.J., White, K.S., Eds.; Cambridge University Press: Cambridge, UK, 2001. [Google Scholar]
- Panthi, J.; Aryal, S.; Dahal, P.; Bhandari, P. Livelihood vulnerability approach to assessing climate change impacts on mixed agro-livestock smallholders around the Gandaki River Basin in Nepal. Reg. Environ. Chang. 2016, 16, 1121–1132. [Google Scholar] [CrossRef]
- Hamdan, R.; Kari, F.; Othman, A. Biophysical vulnerability impact assessment of climate change on aquaculture sector development in Sarawak, Malaysia. Dlsu Bus. Econ. Rev. 2015, 24, 32–44. [Google Scholar]
- Mavhura, E.; Manyena, B.; Collins, A.E. An approach for measuring social vulnerability in context: The case of flood hazards in Muzarabani district, Zimbabwe. Geoforum 2017, 86, 103–117. [Google Scholar] [CrossRef]
- Füssel, H.M. How inequitable is the global distribution of responsibility, capability, and vulnerability to climate change: A comprehensive indicator-based assessment. Glob. Environ. Chang. 2010, 20, 597–611. [Google Scholar] [CrossRef]
- Ciurean, R.L.; Schröter, D.; Glade, T. Conceptual Frameworks of Vulnerability Assessments for Natural Disasters Reduction. In Approaches to Disaster Management-Examining the Implications of Hazards, Emergencies and Disasters; Tiefenbacher, J., Ed.; INTECH Open Access Publisher: London, UK, 2013. [Google Scholar] [Green Version]
- Huynh, L.T.M.; Stringer, L.C. Multi-scale assessment of social vulnerability to climate change: An empirical study in coastal Vietnam. Clim. Risk Manag. 2018, 20, 165–180. [Google Scholar] [CrossRef]
- Villágran de León, J.C. Vulnerability-a Conceptual and Methodological Review; United Nations University Institute for Environment and Human Security: Bonn, Germany, 2006. [Google Scholar]
- Wisner, B.; Blaikie, P.; Cannon, T.; Davis, I. At Risk: Natural Hazards, People’s Vulnerability, and Disasters, 2nd ed.; Routledge: London, UK, 2004. [Google Scholar]
- Cutter, S.L.; Boruff, B.J.; Lynn Shirley, W. Social Vulnerability to Environmental Hazards. Soc. Sci. Q. 2003, 84, 242–261. [Google Scholar] [CrossRef]
- Birkmann, J. Measuring vulnerability to promote disaster-resilient societies: Conceptual frameworks and definitions. In Measuring Vulnerability; United Nations University Press: Tokyo, Japan; New York, NY, USA; Paris, France, 2006; pp. 9–54. [Google Scholar]
- Frigerio, I.; Carnelli, F.; Cabinio, M.; De Amicis, M. Spatiotemporal Pattern of Social Vulnerability in Italy. Int. J. Disaster Risk Sci. 2018, 9, 249–262. [Google Scholar] [CrossRef] [Green Version]
- Wood, N.J.; Burton, C.G.; Cutter, S.L. Community variations in social vulnerability to Cascadia-related tsunamis in the U.S. Pacific Northwest. Nat. Hazards 2010, 52, 369–389. [Google Scholar] [CrossRef]
- Gatto, A.; Busato, F. Defining, Measuring and Ranking Energy Vulnerability Andrea Gatto and Francesco Busato; CREATES Research Paper 2019-1; Department of Economics and Business Economics, Aarhus University: Aarhus, Denmark, 2019. [Google Scholar]
- Holand, I.S.; Lujala, P. Replicating and Adapting an Index of Social Vulnerability to a New Context: A Comparison Study for Norway. Prof. Geogr. 2012, 65, 120529141302005. [Google Scholar] [CrossRef]
- Guillard-gonçalves, C.; Cutter, S.L.; Emrich, C.T. Application of Social Vulnerability Index (SoVI) and delineation of natural risk zones in Greater Lisbon, Portugal. J. Risk Res. 2015, 9877, 1–24. [Google Scholar] [CrossRef]
- Hou, J.; Lv, J.; Chen, X.; Yu, S. China’s regional social vulnerability to geological disasters: evaluation and spatial characteristics analysis. Nat. Hazards 2016, 84, 97–111. [Google Scholar] [CrossRef]
- Agovino, M.; Cerciello, M.; Gatto, A. Policy efficiency in the field of food sustainability. The adjusted food agriculture and nutrition index. J. Environ. Manag. 2018, 218, 220–233. [Google Scholar] [CrossRef] [PubMed]
- Noradika, Y.; Sungsu, M. Assessment of social vulnerability to natural hazards in South Korea: Case study for typhoon hazard. Spat. Inf. Res. 2017, 25, 99–116. [Google Scholar]
- Yenneti, K.; Tripathi, S.; Wei, Y.D.; Chen, W.; Joshi, G. The truly disadvantaged? Assessing social vulnerability to climate change in urban India. Habitat Int. 2016, 56, 124–135. [Google Scholar] [CrossRef]
- Douglas, I.; Alam, K.; Maghenda, M.; Mcdonnell, Y.; Mclean, L.; Campbell, J. Unjust waters: Climate change, flooding and the urban poor in Africa. Environ. Urban. 2008, 20, 187–205. [Google Scholar] [CrossRef]
- Ramin, B.; Svoboda, T. Health of the homeless and climate change. J. Urban Heal. 2009, 86, 654–664. [Google Scholar] [CrossRef]
- Blackburn, R.M.; Blackburn, R.M. What is social inequality? Int. J. Sociol. Soc. Policy 2008, 28, 250–259. [Google Scholar] [CrossRef]
- Frankenberg, E.; Sikoki, B.; Sumantri, C.; Suriastini, W.; Thomas, D. Education, vulnerability, and resilience after a natural disaster. Ecol. Soc. 2013, 18, 16. [Google Scholar] [CrossRef] [PubMed]
- van der Land, V.; Hummel, D. Vulnerability and the role of education in environmentally induced migration in Mali and Senegal. Ecol. Soc. 2013, 18, 14. [Google Scholar] [CrossRef]
- Deressa, T.T.; Hassan, R.M.; Ringler, C.; Alemu, T.; Yesuf, M. Determinants of farmers’ choice of adaptation methods to climate change in the Nile Basin of Ethiopia. Glob. Environ. Chang. 2009, 19, 248–255. [Google Scholar] [CrossRef] [Green Version]
- Durant, T.J. The utility of vulnerability and social capital theories in studying the impact of Hurricane Katrina on the elderly. J. Fam. Issues 2011, 32, 1285–1302. [Google Scholar] [CrossRef]
- Andrew, M.K.; Mitnitski, A.B.; Rockwood, K. Social vulnerability, frailty and mortality in elderly people. Plos One 2008, 3, 1–8. [Google Scholar] [CrossRef] [PubMed]
- Peek, L. Children and Disasters: Understanding Vulnerability, Developing Capacities, and Promoting Resilience—An Introduction. Child. Youth Environ. 2008, 18, 1–29. [Google Scholar]
- Cutter, S.L. Vulnerability to environmental hazards. Prog. Hum. Geogr. 1996, 20, 529–539. [Google Scholar] [CrossRef]
- Maguire, B.; Hagan, P. Disasters and communities: Understanding social resilience. Aust. J. Emerg. Manag. 2007, 22, 16–20. [Google Scholar]
- Warikoo, N.; Carter, P. Cultural Explanations for Racial and Ethnic Stratification in Academic Achievement: A Call for a New and Improved Theory. Rev. Educ. Res. 2009, 79, 366–394. [Google Scholar] [CrossRef] [Green Version]
- Lareau, A. Unequal Childhoods: Class, Race, and Family Life; University of California Press: Berkeley, CA, USA, 2003. [Google Scholar]
- Elder, K.; Xirasagar, S.; Miller, N.; Bowen, S.; Glover, S.; Piper, C. African-American’s decisions not to evacuate New Orleans before Hurricane Katrina: A qualitative study. Am. J. Pub. Heal. 2007, 97, S124–S129. [Google Scholar] [CrossRef]
- Siegal, J. Emotional injury and the Northridge, California earthquake. Nat. Hazards Rev. 2000, 1, 204–211. [Google Scholar] [CrossRef]
- Bethel, J.W.; Burke, S.C.; Britt, A.F. Disparity in disaster preparedness between racial/ethnic groups. Disaster Heal. 2013, 1, 110–116. [Google Scholar] [CrossRef] [PubMed] [Green Version]
- Fothergill, A.; Maestas, E.G.M.; Darlington, J.D. Race, Ethnicity and Disasters in the United States: A Review of the Literature. Disasters 1999, 23, 156–173. [Google Scholar] [CrossRef]
- Ge, Y.; Dou, W.; Zhang, H. A new framework for understanding urban social vulnerability from a network perspective. Sustainability 2017, 9, 1723. [Google Scholar] [CrossRef]
- Tan, Y.; Liu, X.; Hugo, G. Exploring relationship between social inequality and adaptations to climate change: evidence from urban household surveys in the Yangtze River delta, China. Popul. Environ. 2015, 36, 400–428. [Google Scholar] [CrossRef]
- Bie, J.; De Jong, M.; Tang, J. The greater pearl river delta (PRD) as a global city region its shape and development. In Proceedings of the Next Generation Infrastructure Systems for Eco-Cities, Shenzhen, China, 11–13 November 2010; pp. 1–5. [Google Scholar]
- Gu, C.; Hu, L.; Zhang, X.; Wang, X.; Guo, J. Climate change and urbanization in the Yangtze River Delta. Habitat Int. 2011, 1–9. [Google Scholar] [CrossRef]
- Zhang, K. The impacts of global climate change on extreme weather events in Beijing-Tianjin-Hebei area and the countermeasures for disaster prevention. J. Arid L. Resour. Environ. 2011, 25, 122–125. [Google Scholar]
- Gong, D.; Han, H. Extreme Climate Events in Northern China over the Last 50 Years. Acta Geogr. Sin. 2004, 59, 230–238. [Google Scholar]
- Huang, Z.; Zong, Y.; Zhang, W. Coastal inundation due to sea level rise in the PRD, China. Nat. Hazards 2004, 33, 247–264. [Google Scholar] [CrossRef]
- Tracy, A.; Trumbull, K.; Loh, C. Impact of Climate Change in Hong Kong and the Pearl River Delta. China Perspect. 2007, 1, 18–29. [Google Scholar] [CrossRef]
- Maggino, F.; Zumbo, B.D. Measuring the Quality of Life and the Construction of Social Indicators. In Handbook of Social Indicators and Quality of Life Research; Land, K.C., Ed.; Springer Science+Business Media B.V.: Heidelberg, Germany, 2012; pp. 201–238. [Google Scholar]
- Jones, M.C.; Sibson, R. What is Projection Pursuit? J. R. Stat. Soc. Ser. A 1987, 150, 1–37. [Google Scholar] [CrossRef]
- Nason, G.P. Robust projection indices. J. R. Stat. Soc. Ser. B Stat. Methodol. 2001, 63, 551–567. [Google Scholar] [CrossRef] [Green Version]
- Boulton, A.; Devriendt, L.; Brunn, S.; Derudder, B.; Witlox, F. City networks in cyberspace and time: Using Google hyperlinks to measure global economic and environmental crises. In ICTs for Mobile and Ubiquitous Urban Infrastructures: Surveillance, Locative Media and Global Networks; Firmino, R.J., Duarte, F., Ultramari, C., Eds.; IGI Global: Hershey, PA, USA, 2011; pp. 67–87. [Google Scholar]
- Baidu the Baidu Index. Available online: https://zhishu.baidu.com/ (accessed on 2 June 2018).
- Theil, H. Economics and Information Theory; North-Holland Publishing Company: Amsterdam, The Nertherlans, 1967. [Google Scholar]
- Malakar, K.; Mishra, T.; Patwardhan, A. Inequality in water supply in India: An assessment using the Gini and Theil indices. Environ. Dev. Sustain. 2018, 20, 841–864. [Google Scholar] [CrossRef]
- Alcantara, V.; Duro, J.A. Inequality of energy intensities across OECD countries: A note. Energy Policy 2004, 32, 1257–1260. [Google Scholar] [CrossRef]
- Zhang, L.; Yang, Z.; Liang, J.; Cai, Y. Spatial variation and distribution of urban energy consumptions from cities in China. Energies 2010, 4, 26–38. [Google Scholar] [CrossRef]
- Sixth National Population Census Office of State Countil Major Figures on Population Census of China; China Statistics Press: Beijing, China, 2010.
Figure 1.
Study area: geographic location and cities. JJJ, Jing-Jin-Ji; YRD, Yangtze River Delta; PRD, Pearl River Delta.
Figure 1.
Study area: geographic location and cities. JJJ, Jing-Jin-Ji; YRD, Yangtze River Delta; PRD, Pearl River Delta.

Figure 2.
Methodology for assessing social vulnerability and inequality for urban agglomeration.

Figure 3.
A conceptual model for social vulnerability assessment from a network perspective.

Figure 4.
Inequality of SVI indicators in three urban agglomerations.

Figure 5.
Connectivity structure in three urban agglomerations. (a) JJJ, (b) YRD, (c) PRD.
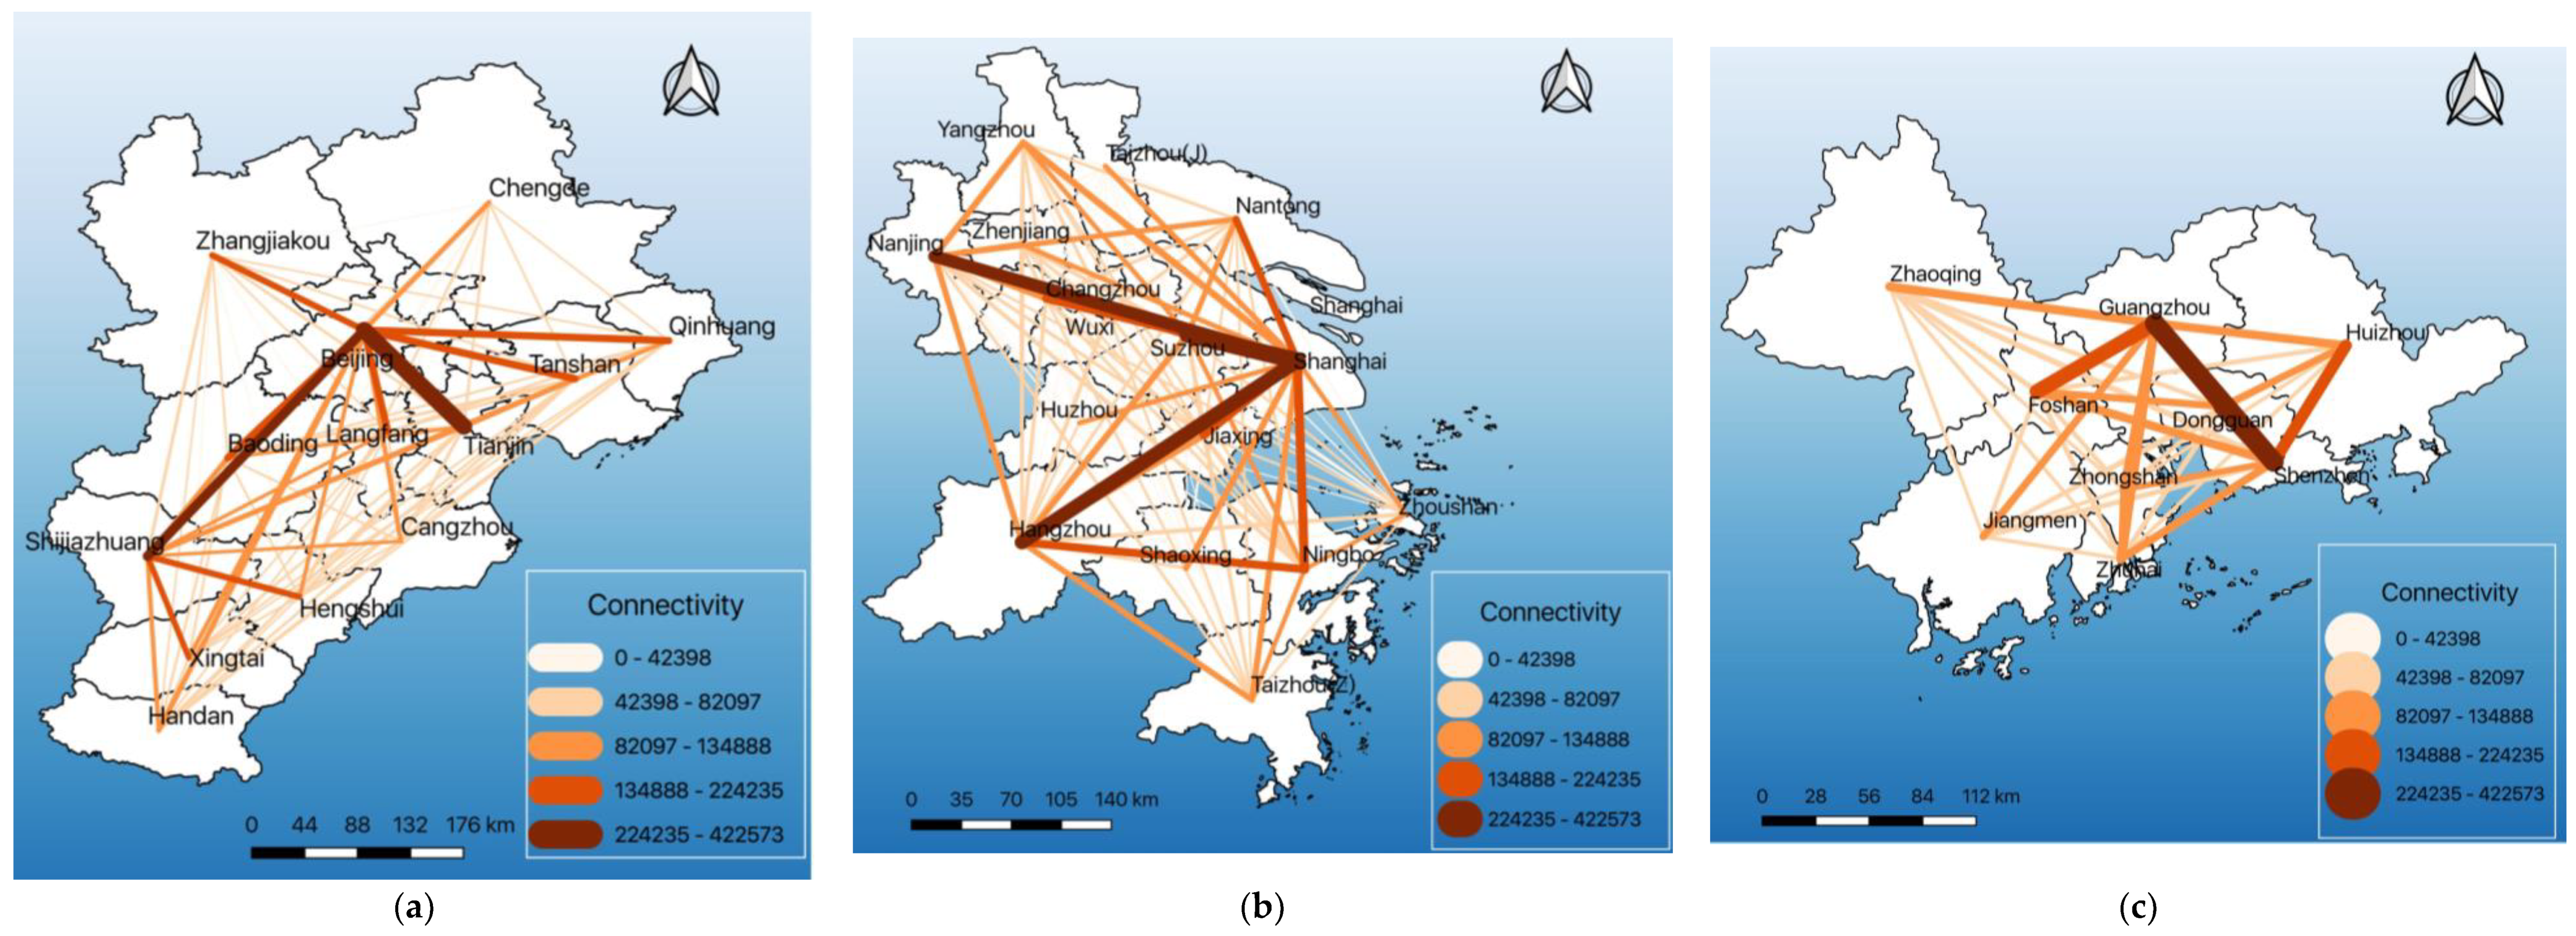
Figure 6.
Inequality of connectivity in three urban agglomerations.

Figure 7.
Spatial distributions of SVIs of individual cities and cities in urban networks. (a) JJJ–SVIs of individual cities, (b) YRD–SVIs of individual cities, (c) PRD–SVIs of individual cities, (d) JJJ-SVIs of cities in urban networks, (e) YRD–SVIs of cities in urban networks, (f) PRD-SVIs of cities in urban networks.

Figure 8.
Inequality of social vulnerability in three urban agglomerations.


Table 1.
Indicators for assessing social vulnerability of individual cities.
| No. | Dimension of Inequality | Dimension of SVI | Indicator | Description | Impact on SVI |
|---|---|---|---|---|---|
| 1 | Health inequality | Sensitivity | Children | Percentage population under 14 years old | + |
| 2 | Sensitivity | Elderly | Percentage population over 65 years old | + | |
| 3 | Sensitivity | Females | Percentage of female resident population | + | |
| 4 | Cultural inequality | Sensitivity | Ethnic minorities | Percentage of minority population | + |
| 5 | Sensitivity | Illiterate | Percentage illiteracy rate | + | |
| 6 | Economic inequality | Sensitivity | Unemployed | Percentage unemployment population | + |
| 7 | Sensitivity | Poor | Percentage of residents covered by subsistence allowances from the government | + | |
| 8 | Exposure | House with no tap water | Percentage of households without tap water in their houses | + | |
| 9 | Exposure | House with no kitchen | Percentage of households without a kitchen in their houses | + | |
| 10 | Exposure | House with no lavatory | Percentage of households without a lavatory in their houses | + | |
| 11 | Adaptability | GDP | Gross domestic product | − | |
| 12 | Social inequality | Sensitivity | Renters | Percentage of households that live in rented houses | + |
| 13 | Adaptability | Higher education graduated | Percentage of population with a college degree | − | |
| 14 | Adaptability | Green | The greening rate in cities | − | |
| 15 | Adaptability | Hospitals | Number of Hospitals | − | |
| 16 | Adaptability | Employees in management sector | Percentage employed in management sector | − |
Table 2.
Weight values for SVIs of individual cities.
| No. | Indicator | Weight | % |
|---|---|---|---|
| 1 | GDP | 0.42 | 11.84% |
| 2 | Higher education graduated | 0.34 | 9.71% |
| 3 | Children | 0.33 | 9.22% |
| 4 | Illiterate | 0.31 | 8.70% |
| 5 | Employees in management sector | 0.3 | 8.43% |
| 6 | Elderly | 0.28 | 7.87% |
| 7 | Poor | 0.26 | 7.37% |
| 8 | Houses with no lavatory | 0.26 | 7.39% |
| 9 | Green | 0.26 | 7.24% |
| 10 | Females | 0.22 | 6.31% |
| 11 | Houses with no tap water | 0.22 | 6.21% |
| 12 | Ethnic minorities | 0.14 | 3.90% |
| 13 | Houses with no kitchen | 0.1 | 2.72% |
| 14 | Unemployed | 0.05 | 1.32% |
| 15 | Hospital | 0.04 | 1.17% |
| 16 | Renters | 0.02 | 0.60% |
Table 3.
Count of cities belonging to each level in three urban agglomerations.
| Level 1 | Level 2 | Level 3 | Level 4 | Level 5 | ||
|---|---|---|---|---|---|---|
| JJJ | SVInode | 1 | 1 | 3 | 4 | 4 |
| SVIurban | 2 | 2 | 7 | 2 | 0 | |
| YRD | SVInode | 1 | 4 | 9 | 2 | 0 |
| SVIurban | 5 | 6 | 2 | 1 | 2 | |
| PRD | SVInode | 3 | 3 | 2 | 1 | 0 |
| SVIurban | 3 | 2 | 2 | 2 | 0 |
© 2019 by the authors. Licensee MDPI, Basel, Switzerland. This article is an open access article distributed under the terms and conditions of the Creative Commons Attribution (CC BY) license (http://creativecommons.org/licenses/by/4.0/).
Share and Cite
MDPI and ACS Style
Ge, Y.; Yang, G.; Chen, Y.; Dou, W. Examining Social Vulnerability and Inequality: A Joint Analysis through a Connectivity Lens in the Urban Agglomerations of China. Sustainability 2019, 11, 1042. https://doi.org/10.3390/su11041042
AMA Style
Ge Y, Yang G, Chen Y, Dou W. Examining Social Vulnerability and Inequality: A Joint Analysis through a Connectivity Lens in the Urban Agglomerations of China. Sustainability. 2019; 11(4):1042. https://doi.org/10.3390/su11041042
Chicago/Turabian StyleGe, Yi, Guangfei Yang, Yi Chen, and Wen Dou. 2019. "Examining Social Vulnerability and Inequality: A Joint Analysis through a Connectivity Lens in the Urban Agglomerations of China" Sustainability 11, no. 4: 1042. https://doi.org/10.3390/su11041042
Note that from the first issue of 2016, this journal uses article numbers instead of page numbers. See further details here.