Indoor Air Quality Enhancement Performance of Liquid Desiccant and Evaporative Cooling-Assisted Air Conditioning Systems


Department of Architectural Engineering, Hanyang University, Seoul 04763, Korea
*
Author to whom correspondence should be addressed.
Sustainability 2019, 11(4), 1036; https://doi.org/10.3390/su11041036
Submission received: 23 January 2019
/
Revised: 11 February 2019
/
Accepted: 15 February 2019
/
Published: 16 February 2019
Abstract
:The main objective of this study is to investigate the indoor air quality enhancement performance of two different liquid desiccant and evaporative cooling-assisted air conditioning systems, such as the variable air volume (VAV) system with the desiccant-enhanced evaporative (DEVap) cooler, and the liquid desiccant system with an indirect and direct evaporative cooling-assisted 100% outdoor air system (LD-IDECOAS), compared with the conventional VAV system. The transient simulations of concentration variations of carbon dioxide (CO2), coarse particles, and fine particles (PM10 and PM2.5) in a model office space served by each system were performed using validated system models that were found in the literature. Based on the hourly thermal loads of the model space predicted by the TRNSYS 18 program, each air conditioning system was operated virtually using a commercial equation solver program (EES). The results indicated that the LD-IDECOAS provided the lowest annual indoor CO2 concentration among all the systems considered in this research, while the VAV system with DEVap cooler exceeded the threshold concentration (i.e., 1000 ppm) during the cooling season (i.e., July, August, and September). For the indoor particulate contaminant concentrations, both liquid desiccant and evaporative cooling-assisted air conditioning systems indicated lower indoor PM2.5 and PM10 concentrations compared with the reference system. The LD-IDECOAS and the VAV with a DEVap cooler demonstrated 33.3% and 23.5% lower annual accumulated indoor PM10 concentrations than the reference system, respectively. Similarly, the annual accumulated indoor PM2.5 concentration was reduced by 16% using the LD-IDECOAS and 17.1% using the VAV with DEVap cooler.
1. Introduction
Recently, liquid desiccant and evaporative cooling technologies are attracting particular interest for developing an alternative air conditioning as an alternative to conventional air conditioning systems that are based on the vapor compression refrigeration cycle [1,2]. Over the last decade, several liquid desiccant and evaporative cooling-assisted air conditioning systems were proposed [3,4,5], which can provide good energy performance compared to conventional systems. Lee et al. [4] suggested a novel air handling system by integrating the desiccant-enhanced evaporative (DEVap) cooler developed by Kozubal et al. [3] with the conventional variable air volume (VAV) system. They replaced the cooling coil of the VAV system with the DEVap cooler that consists of an internally cooled liquid desiccant (LD) dehumidifier and a dew point indirect evaporative cooler (DP-IEC). Lee et al. also suggested a desirable annual operation sequence of their proposed system, and demonstrated that their system could provide air conditioning to the conditioned zone without chiller operation, in addition to 2–3% of the primary energy reduction compared with the conventional VAV system.
Kim et al. [6,7] proposed the liquid desiccant system with indirect and direct evaporative cooling-assisted 100% outdoor air system (LD-IDECOAS). This system is a once-through system that serves the zone by supplying conditioned outdoor air, and the zone return air is exhausted to the outside via the indirect evaporative cooler. No cross-contamination occurs, because the zone return air is not redirected to and mixed with the supply air stream [6,8]. The energy benefit of the LD-IDECOAS compared with the conventional VAV system was also indicated in the open literature [9,10,11]. The LD-IDECOAS indicated 68% less annual operating energy consumption over the conventional VAV system.
While the established investigations suggesting novel air conditioning systems assisted by liquid desiccant and evaporative cooling technologies were focused primarily on their energy benefits, studies addressing the indoor air quality enhancement performances of those systems are scarce. The air contaminant removal efficiencies of the LD dehumidifier and direct evaporative cooler (DEC) were evaluated empirically in some studies. Park et al. [8] indicated that the packed tower-type LD dehumidifier could remove 48% of the 2.5–5.0 μm and 85% of 10–25 μm particulate contaminants in the process air stream. Paschold et al. [12] demonstrated empirically that the DEC with a rigid media pad could remove 11% of 2.5-μm particles (PM2.5), and 49% of 10-μm particles (PM10) in the process air. Liu et al. [13] indicated that the packed tower-type LD and DEC could remove 24.8% and 42.4% of 0.3 to 5-μm particles, respectively. Li et al. [14] indicated that a DEC with a rigid media pad could remove 43% of PM10 and 35% of PM2.5.
Consequently, in this work, the indoor air quality enhancement performance of two novel air conditioning systems assisted by liquid desiccant and evaporative cooling technologies, the VAV system with DEVap cooler, and the LD-IDECOAS were evaluated via simulating the transient variations of PM2.5 and PM10 concentrations in the space served by each system. The ventilation performances of both novel air conditioning systems were also evaluated by predicting the transient variation of CO2 concentration in the conditioned space. The mass-based concentration of each contaminant was used in the simulation.
2. System Overview
2.1. Variable Air Volume System
In the VAV system (Figure 1), the conditioned supply air flow varies to satisfy the cooling or heating load of the conditioned space. The minimum required ventilation air [15] is mixed with the room return air to reduce the energy consumption in the cooling or heating coil. During the cooling season, the process air is cooled and dehumidified by the cooling coil to satisfy the set point condition (e.g., 15 °C dry bulb and 80% relative humidity) of the supply air. In the heating season, if the VAV system is used to provide heating in the zone, the supply air set point temperature (e.g., 45 °C) should be satisfied by the heating coil, and a humidifier should be activated to add moisture into the supply air stream for maintaining the humidity set point (e.g., 30% relative humidity) of the conditioned space. Outdoor air is used only when minimum ventilation is required during these seasons.
In the intermediate season operation, the economizer control is typically activated to conserve the operating energy consumption. When the outdoor enthalpy is lower than the zone enthalpy, outdoor air is introduced as much as the determined supply air flow rate during the cooling mode. Meanwhile, outdoor air is introduced when a minimum amount of ventilation is required to reduce the energy consumption in the heating mode.
2.2. Desiccant-enhanced Evaporative Cooling System
2.2.1. DEVap System Overview
The DEVap system [3,4] shown in Figure 2 consists of an LD dehumidifier and DP-IEC. The supply air-flow rate of the DEVap system is modulated based on the cooling or heating load of the conditioned zone, which is similar to the conventional VAV system. In the typical cooling mode operation, the introduced outdoor air is mixed with the room return air, and subsequently dehumidified by the LD dehumidifier. The dry process air is subsequently cooled by the DP-IEC. As shown in Figure 3, the primary air entering the dry channels (i.e., the primary channels) of the DP-IEC is cooled by the secondary air experiencing evaporative cooling in the wet channels (i.e., the secondary channels). Approximately 30% of the primary air leaving the dry channels is directed to the wet channels and used as secondary air that exhibits the low wet-bulb temperature that is desirable for evaporative cooling [16].
In the DEVap system, because 30% of the cool and dry process air should be redirected to the secondary channels of the DP-IEC and subsequently exhausted to the outside, one may typically decide to deliver all the room return air to the mixing chamber (i.e., no exhaust air) to mix it with the outdoor air (OA) intake flow (i.e., ventilation air) before the LD and DP-IEC. The air-side mass balance of the DEVap system can be expressed by Equations (1) through (4), and the OA intake flow rate is determined by Equation (5):
When the OA temperature is lower than the room set point temperature in the intermediate season, the economizer control is activated to conserve energy consumption, which is similar to the conventional VAV system. Outdoor air is introduced by the added amount of the determined supply air-flow rate and the exhausted DP-IEC air-flow rate. The entire room air-flow rate is exhausted through the exhaust air duct. Therefore, outdoor air and the determined mixing air (Equation (5)) are introduced to the zone.
2.2.2. Annual Operation
The operating modes of the DEVap system can be determined by considering the OA conditions on the psychrometric chart, as shown in Figure 4 [4]. When the OA temperature is higher than the room air temperature set point, or when the enthalpy of the OA is higher than that of the room air (i.e., regions A and B), the OA intake flow is mixed with the room return air, and subsequently dehumidified (if required) and cooled in the DEVap section of the system to satisfy the SA set point condition. In regions C and D, when the OA temperature is between the SA set point and the room air temperature, while the OA enthalpy is lower than that of the room air, the DEVap system operates in the economizer (i.e., 100% outdoor air) mode, which is similar to the economizer operation in the conventional VAV system. The 100% OA flow that was introduced should be dehumidified (if it is required) and cooled in the DEVap section of the system to satisfy the SA set point condition.
Meanwhile, when the OA condition is in region E, the DEVap section can be deactivated and bypassed (i.e., no additional dehumidification and cooling of the process air). Consequently, the DEVap system operates similarly to the conventional VAV system in region E, including during the heating season.
2.3. Liquid Desiccant and Evaporative Cooling-Assisted 100% Outdoor Air System
2.3.1. LD-IDECOAS Overview
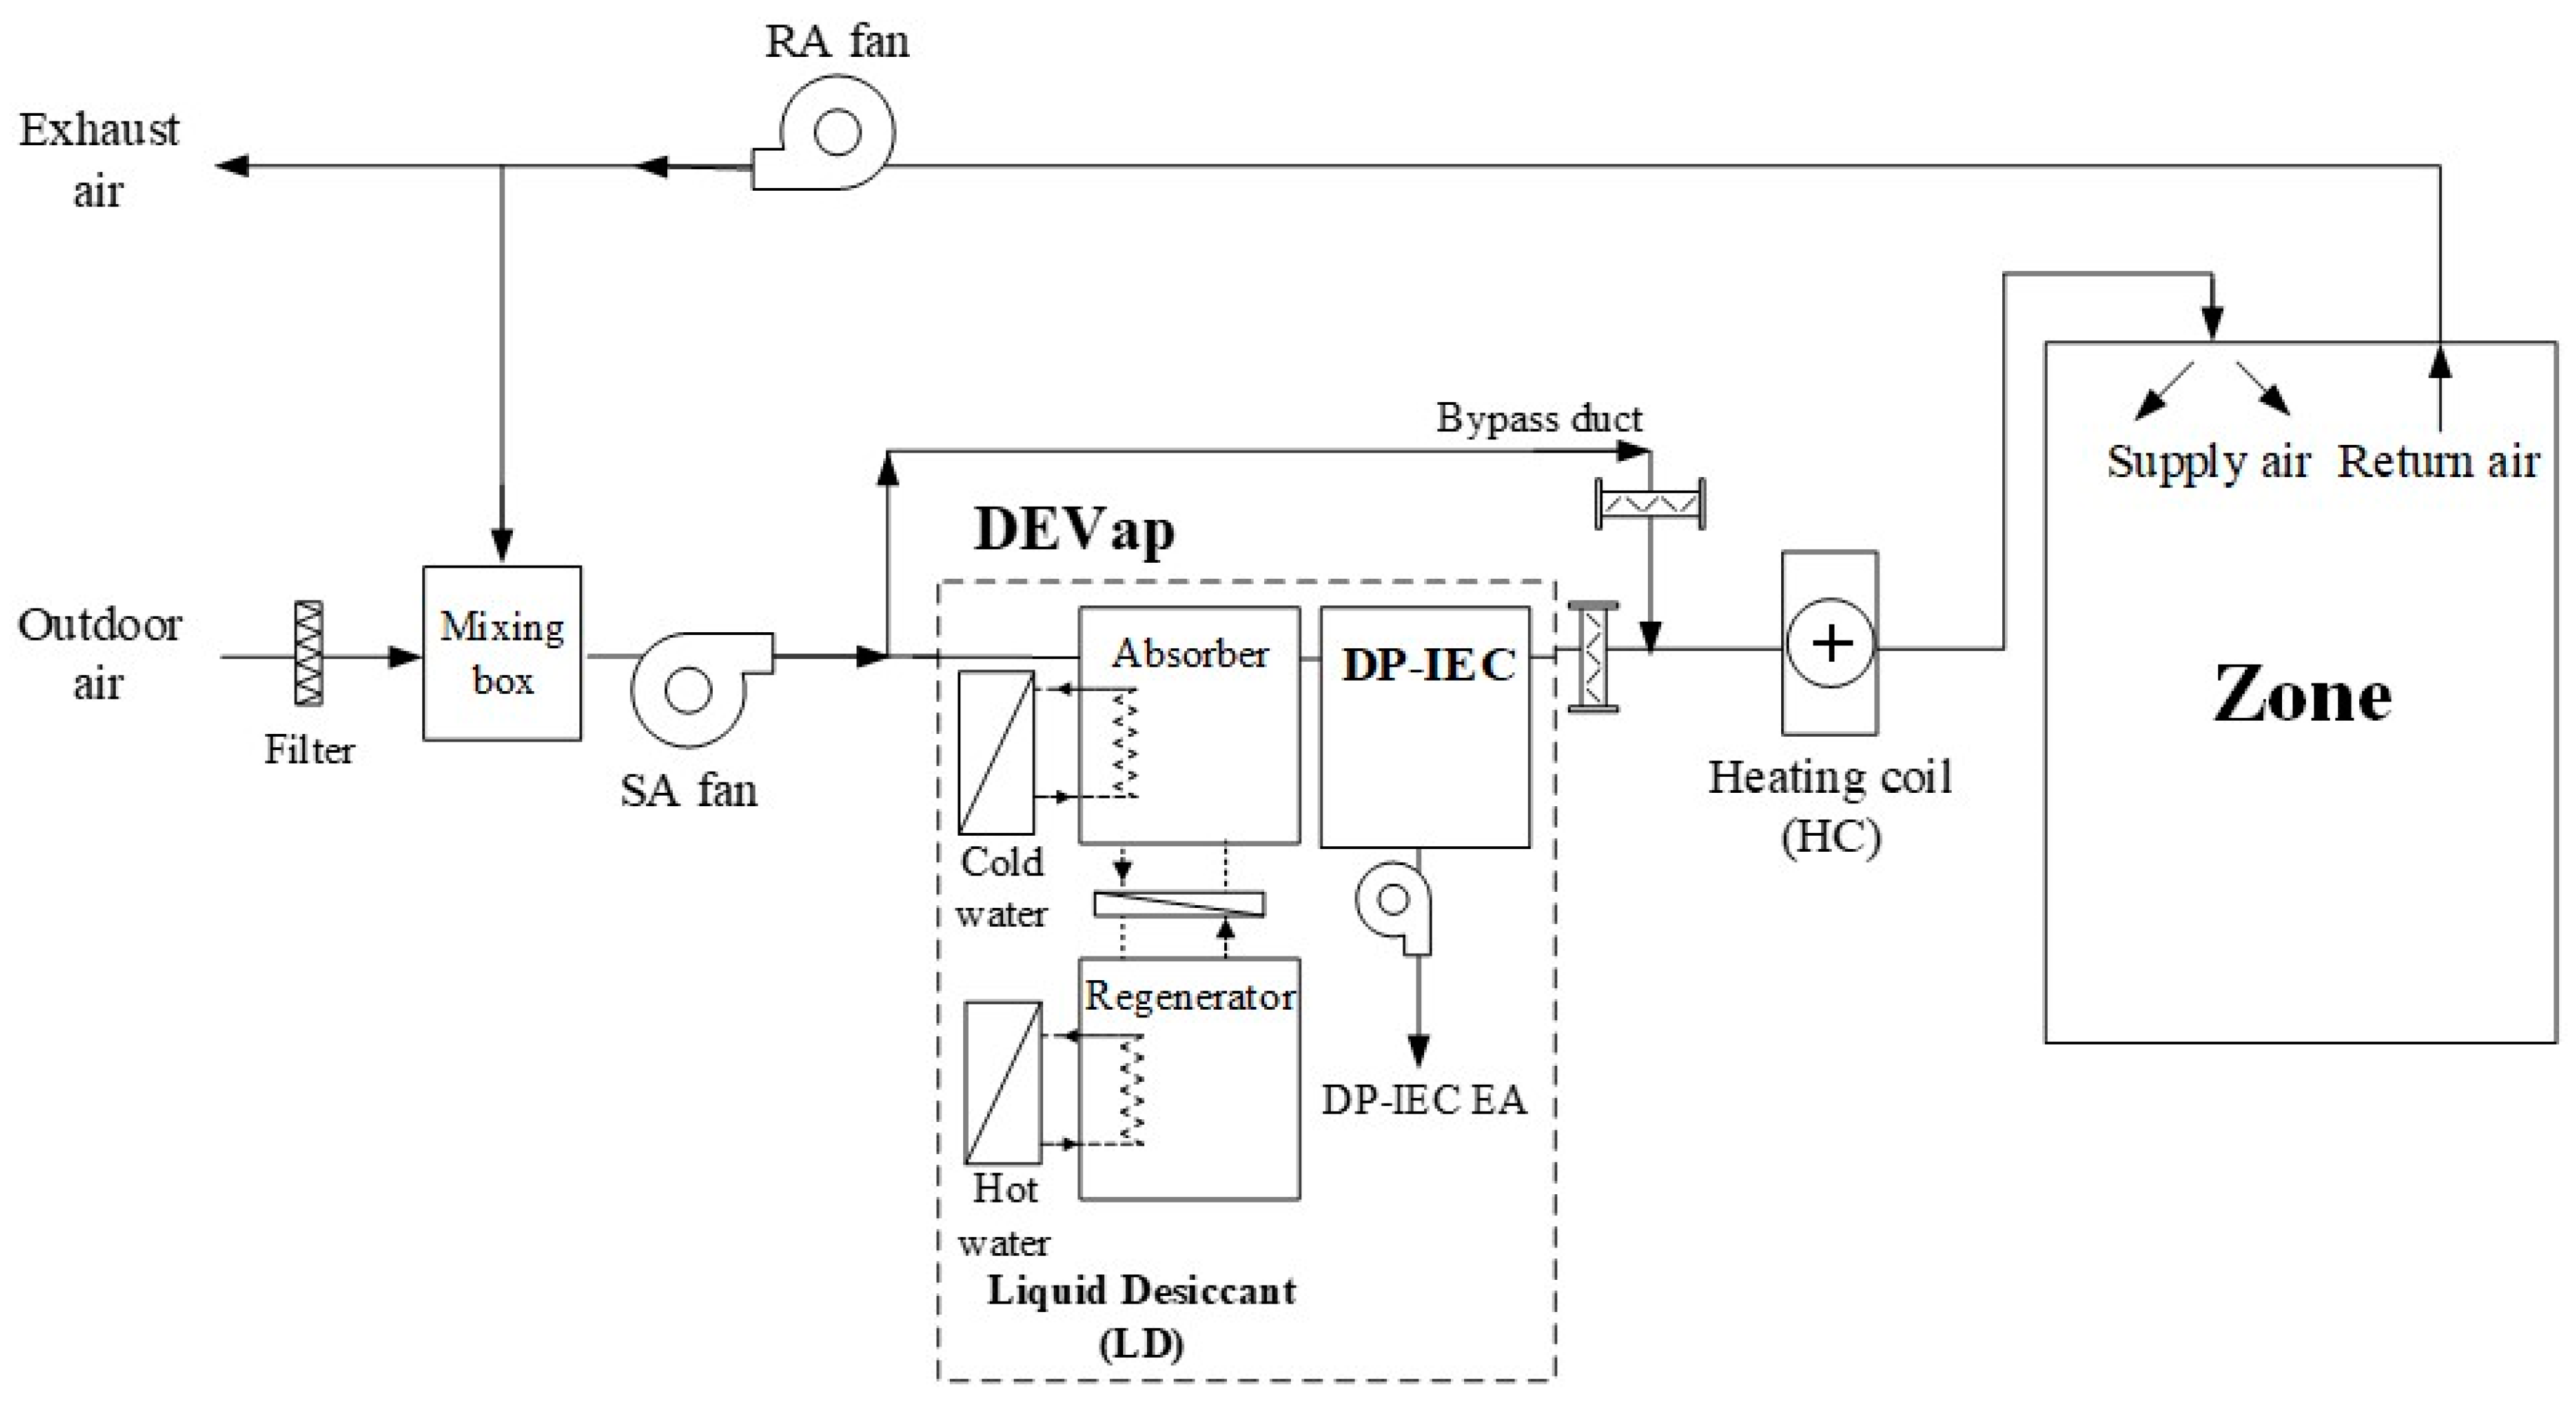
The LD-IDECOAS (Figure 5) consists of an LD, IEC, and DEC on the process air [6]. This system serves the conditioned zone by supplying conditioned OA only. The room return air is exhausted (via the IEC if necessary), and never mixed with the introduced OA. The supply air-flow rate of the LD-IDECOAS is also modulated based on the cooling or heating load of the conditioned zone, which is similar to the conventional VAV system.
In the typical cooling season operation, the hot and humid OA entering the LD-IDECOAS is dehumidified initially in the absorber of the LD section, where the strong desiccant solution is sprayed on the surface of the packed bed contacting the process air. This dehumidification process is exothermic; therefore, the strong desiccant solution should be cooled before the absorber. The dehumidified process air is subsequently cooled in the primary channels of the IEC. For enhancing the IEC performance, as the secondary air experiences evaporative cooling in the secondary channels of the IEC, one should select the air at a lower wet-bulb temperature between the outdoor air and room return air. If the process air temperature leaving the IEC does not satisfy the set point, the DEC is activated to provide additional cooling; however, it may saturate the SA stream.
2.3.2. Annual Operation
The operating modes of the LD-IDECOAS are determined by the OA conditions on the psychrometric chart shown in Figure 6 [7]. When the OA humidity ratio and wet-bulb temperature (or enthalpy) are higher than those at the SA set point (i.e., region A), the LD-IDECOAS operates during the typical cooling season operation mode addressed in the previous section. The lines ‘a’ and ‘b’ in Figure 6 indicate the humidity ratio (HR) of the wet bulb, or the enthalpy of the SA at the set point condition.
When the OA condition is in region B, the LD section of the LD-IDECOAS is deactivated, and the introduced OA is cooled through the IEC and DEC, because the OA is already drier than the supply condition.
In region C, the OA temperature is higher than the SA set point temperature; however, the OA wet-bulb temperature (or enthalpy) is lower than that for the SA target condition. To satisfy the required SA temperature, one may turn off (or bypass) the LD and IEC, and activate the DEC. When the OA humidity ratio and wet-bulb temperature (or enthalpy) are lower than those at the SA set point (i.e., region D), the LD and DEC are deactivated, and the IEC operates in the dry mode (i.e., no water is supplied into the secondary channels). The IEC under the dry operation mode operates as a sensible air-to-air heat exchanger, reclaiming the sensible heat from the room return air to heat the process air up to its set point.
During the heating season operation, similar to the operation mode in region D, the process air is preheated in the IEC by reclaiming sensible heat from the exhaust air, and subsequently heated by the heating coil to its set point temperature (e.g., 45 °C).
3. Indoor Air Quality Simulation
3.1. Simulation Overview
To compare the indoor air quality of the space served by three different air conditioning systems—the conventional VAV system, the DEVap system, and the LD-IDECOAS—the detailed simulations of the contaminant concentration variation in the model space conditioned by each system were performed in this research. The system simulation models applied in the previous research [4,6] evaluating the energy performance of each system were used again in this work to obtain the operating information such as the supply air, return air, and outdoor air intake flow rates during the system operation, all of which are critically required for predicting the indoor air quality of the conditioned zone served by each system. More detailed descriptions of the established model of each system are omitted in this work, because one may refer to the open literature [4,6].
3.2. Model Space
The hourly thermal loads of a single-story office building located in Seoul, Korea were estimated by the energy simulation using the TRNSYS 18 software. The floor area of the model building was 400 m2, and the floor height was three meters. Two 40-m2 windows were located in the exterior walls facing the south and north. The window-to-wall ratio of the model building was 0.33. The office space should be maintained at a dry-bulb temperature (DBT) of 26 °C and 50% RH in summer; a 24 °C DBT and 50% RH in the intermediate season; and a 20 °C DBT and 30% RH during the winter. In Table 1, the detailed physical information of the model space is summarized.
Based on the acquired hourly cooling and heating loads’ profiles, the three different air conditioning systems considered in this research were operated virtually using the established equation-based simulation model of each system operating in a commercial equation solver program (i.e., EES software).
3.3. Simulation Method
The hourly variation of each air contaminant concentration in the model space was simulated by the mass balance equation (Equation (6)) [17,18]:
For simplicity, the following were assumed: no infiltration or exfiltration in the model space (i.e., ); no additional air filtration (i.e., ); no deposition and re-suspension in the duct works (i.e., ) and system components (). Consequently, Equation (6) could be simplified to Equation (7) by considering only air contaminants introduced with the supply air flow (), exhausted with the exhaust air flow (), and generated in the conditioned space ().
The concentrations of PM10 and PM2.5 were the mass concentration, and were applied directly to the mass balance equation, while the volumetric concentration of CO2 was converted to the mass concentration for the simulation using Equations (8) through (11):
Since the atmospheric CO2 concentration exceeded 400 ppm recently [19], it was assumed that the background (or outdoor air) CO2 concentration was 400 ppm in this research. As for the PM10 and PM2.5 concentrations in the outdoor air, the official hourly measurement data [20] provided by the local government was applied in this simulation (Figure 7). It was also assumed that each occupant in the office generated 0.0052 L/s of CO2 [15], while no generation sources of airborne particles was available in the model office space for simplicity [21].
3.4. Particle Removal Rates
Simulations were conducted based on the data verified in the previous experimental study. It was indicated in the open literature [8] that the packed tower-type LD dehumidifier could remove 48% of 2.5–5.0 μm particles, and 85% of 10–25 μm particles by using the particle counter, which can measure the number of small airborne particles with the residual error of 0.1%. Consequently, in this work, the PM2.5 and PM10 removal rates for the packed-tower-type LD dehumidifier that was used in the DEVap system and LD-IDECOAS were set as 48% and 85%, respectively. Meanwhile, the DEC used in the LD-IDECOAS also removes particulate contaminants in the process air stream. Based on the established research [12], investigating the airborne particle (0.1 to 20 μm) removal efficiency of the DEC with a rigid pad, the PM2.5 and PM10 removal rates at the DEC were as 11% and 49%, and the R2 values of PM2.5 and PM10 were 0.964 and 0.935, respectively. The particle deposition and re-suspension in the duct works and air conditioning coils [22,23,24,25], which would exhibit a relatively insignificant impact on the particulate contaminant concentration of the process air stream compared with the LD dehumidifier and the DEC, were neglected in this work for simplicity.
4. Simulation Results
4.1. Indoor CO2 Concentration
Figure 8 shows the comparison of the monthly CO2 concentration of three different air conditioning systems. As shown, the conventional VAV system and the LD-IDECOAS maintained the indoor CO2 concentration below the threshold (i.e., 1000 ppm) during an entire year, while the LD-IDECOAS supplying conditioned 100% outdoor air indicated much lower CO2 concentration than the VAV system during the cooling and intermediate seasons (i.e., from April to October) because of overventilation.
However, the DEVap system could not always maintain the indoor CO2 concentration below the threshold in the cooling season operation. Figure 8 shows that the CO2 concentration of the model space conditioned by the DEVap system was higher than 1000 ppm for 46.9%, 47.7%, and 20.5% of the operating hours in July, August, and September, respectively. This was because, in the DEVap system, 30% of the dehumidified process air should be exhausted to the outside at the DP-IEC before the conditioned zone; therefore, the occupants would experience a lack of ventilation. Meanwhile, during the heating season (i.e., from November to March), when the minimum required outdoor air was introduced in each air conditioning system, the indoor CO2 concentration was maintained below the threshold (i.e., 1000 ppm) in all cases, as shown in Figure 8.
To compare the ventilation performance of the systems considered in this research, the duration (or accumulation) curve of CO2 concentration in the model space served by each system is presented in Figure 9. As shown, the DEVap system demonstrated a higher indoor CO2 concentration than the conventional VAV system for 6827 h over a year, while the LD-IDECOAS provided lower CO2 concentration than the conventional VAV system in the conditioned space for 6827 h over a year. Consequently, one may conclude that the LD-IDECOAS would provide better ventilation performance compared to the other two systems.
4.2. Indoor PM2.5 and PM10 Concentrations
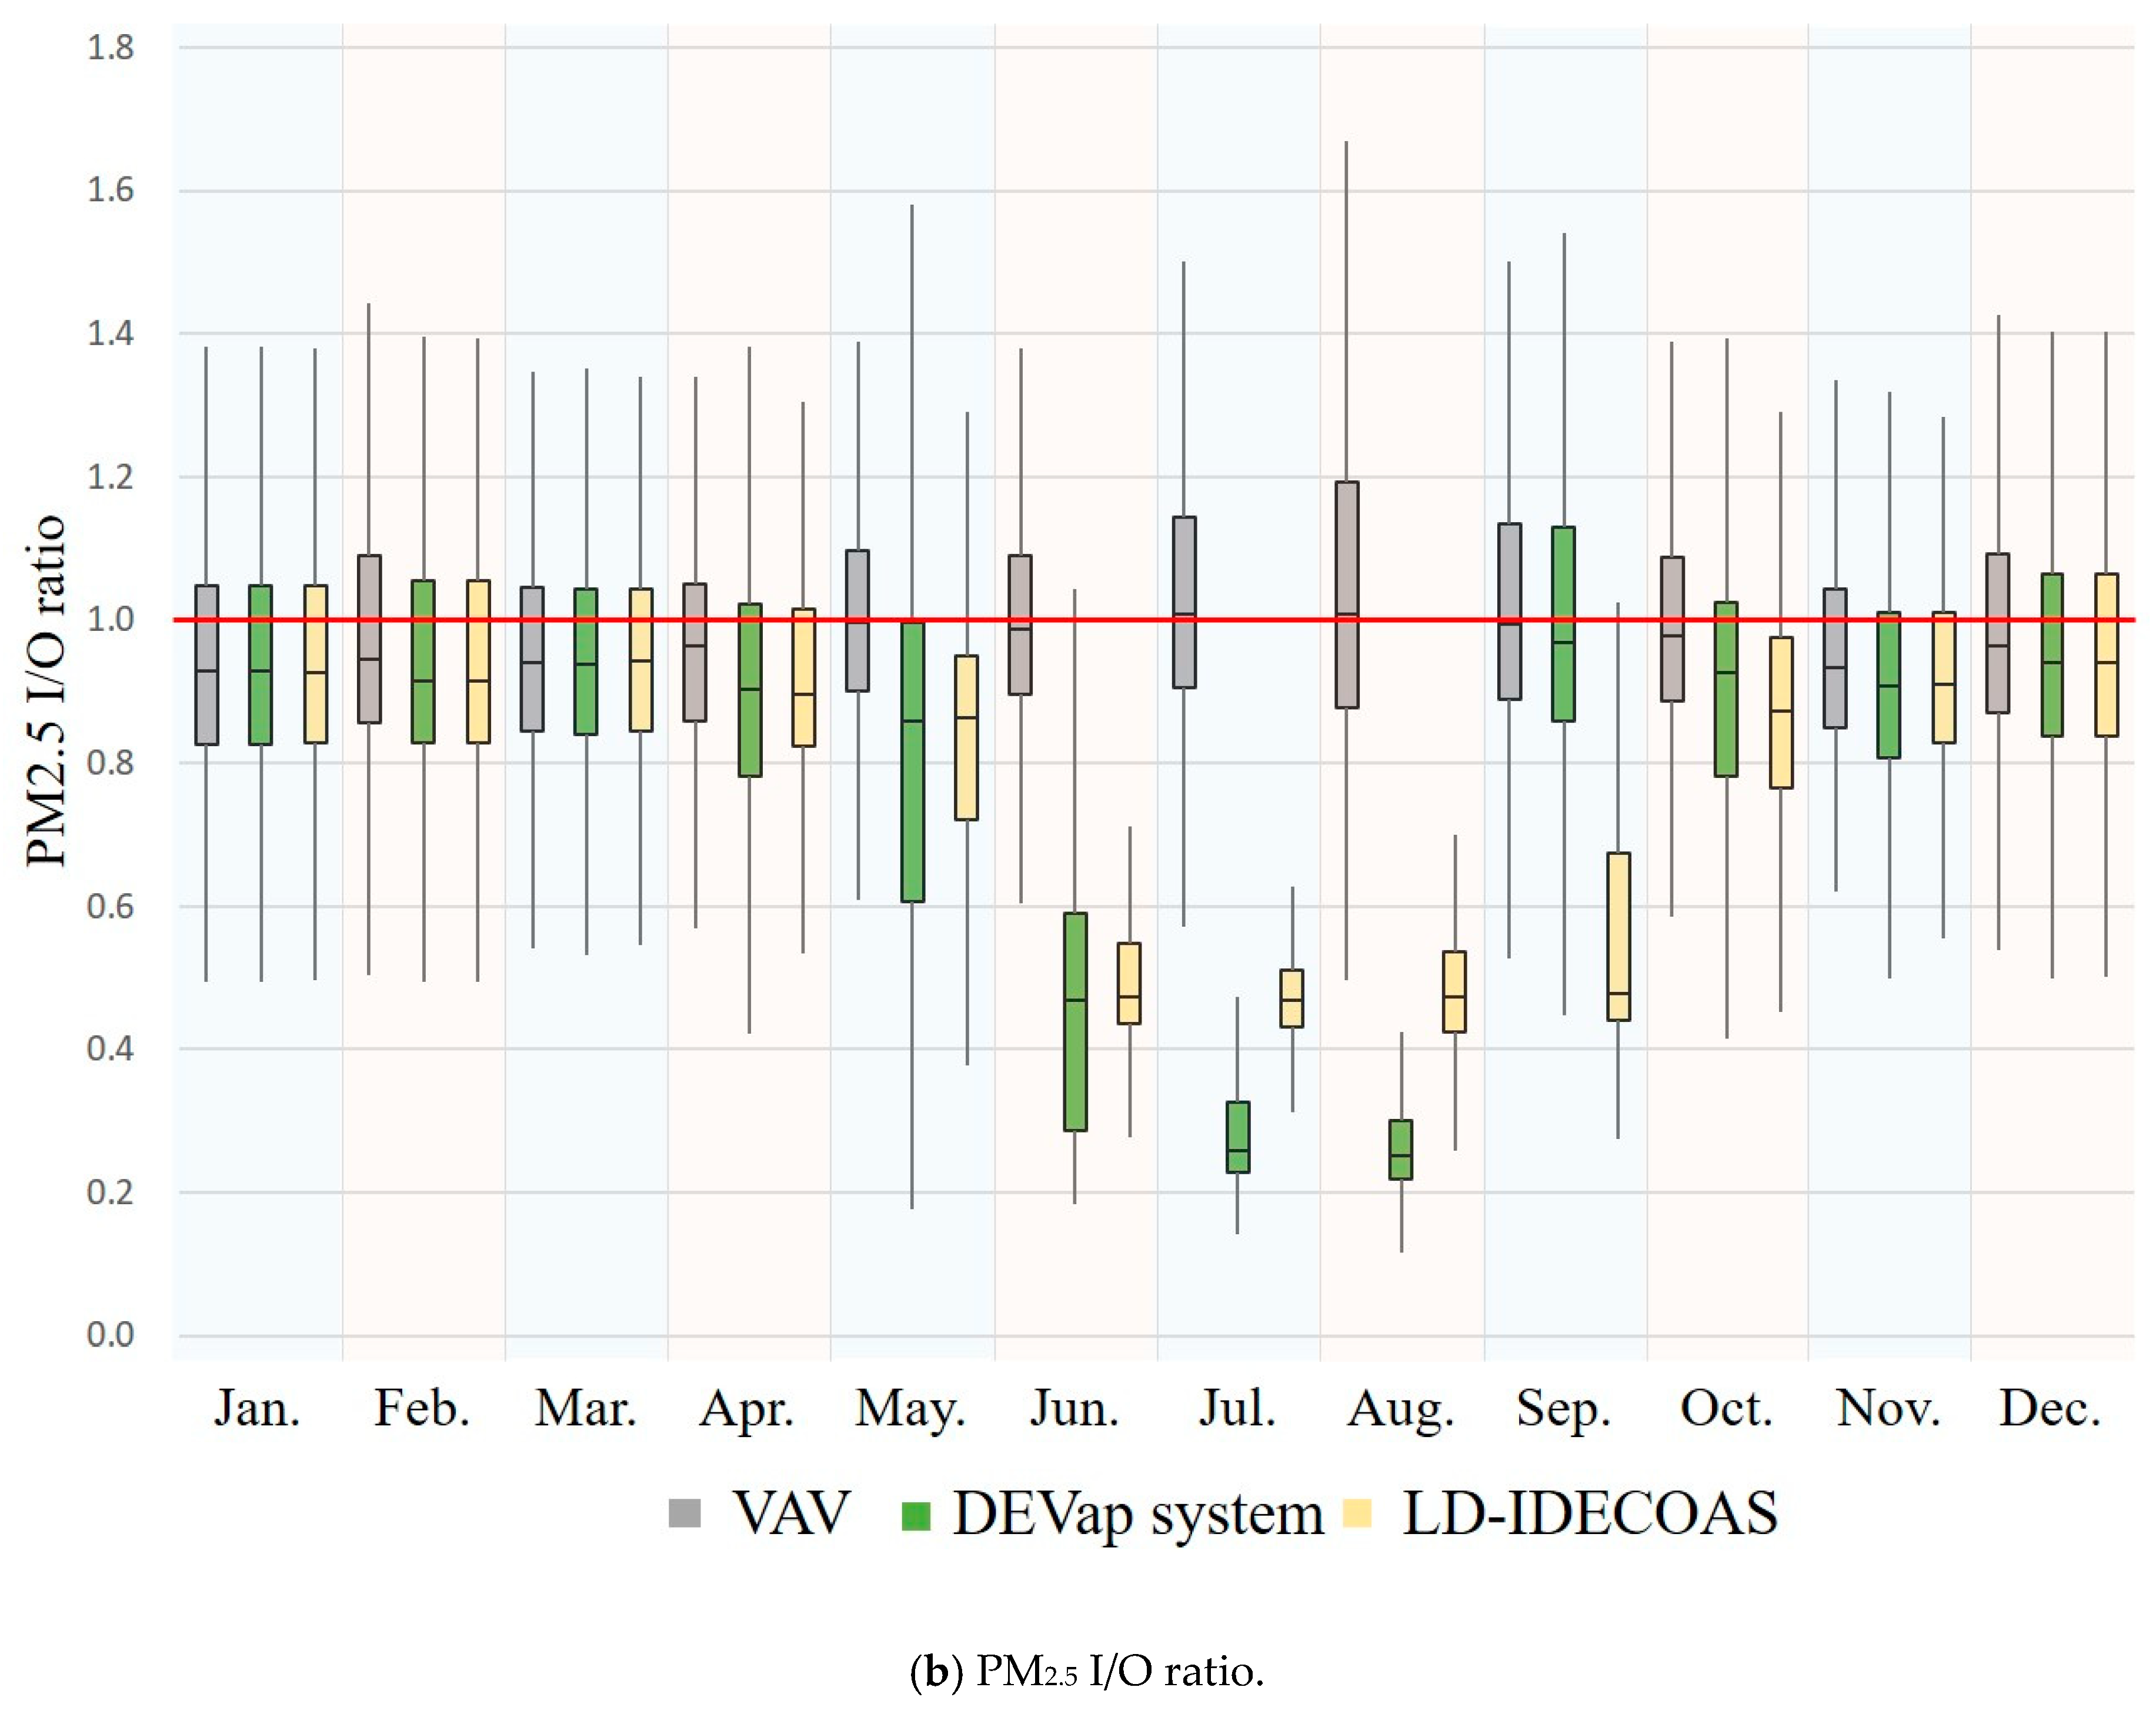
To compare the PM2.5 and PM10 concentration variations for a year in the model office space conditioned by three different air conditioning systems, the ratio of indoor-to-outdoor concentrations (I/O ratio) for the PM2.5 and PM10 were determined based on the hourly simulation data for each system.
Figure 10a shows the comparison of the monthly I/O ratio of the PM10 acquired in each system operation. As shown, the DEVap system and LD-IDECOAS indicated significantly lower PM10 I/O ratios compared with the conventional VAV system during the cooling and intermediate seasons (i.e., from April to October). It was because the LD dehumidifier that was used in both the DEVap system and LD-IDECOAS, and the DEC system in the LD-IDECOAS, exhibited 85% and 45% PM10 removal efficiencies, respectively.
A comparison of the monthly I/O ratios of PM2.5 acquired in each system operation is presented in Figure 10b. Since the LD dehumidifier in both the DEVap system and LD-IDECOAS, and the DEC in the LD-IDECOAS, exhibited 48% and 11% PM2.5 removal efficiencies, respectively, the DEVap system and the LD-IDECOAS indicated a significantly lower PM2.5 I/O ratio compared with the conventional VAV system during the cooling and intermediate seasons (i.e., from April to October).
Meanwhile, as shown in Figure 10, during the heating season (i.e., from November to March), when the LD dehumidifier and DEC were inactivated, and the minimum required outdoor air was introduced in each air conditioning system, no significant differences were shown in the I/O ratios for the PM10 and PM2.5 among the three air conditioning systems.
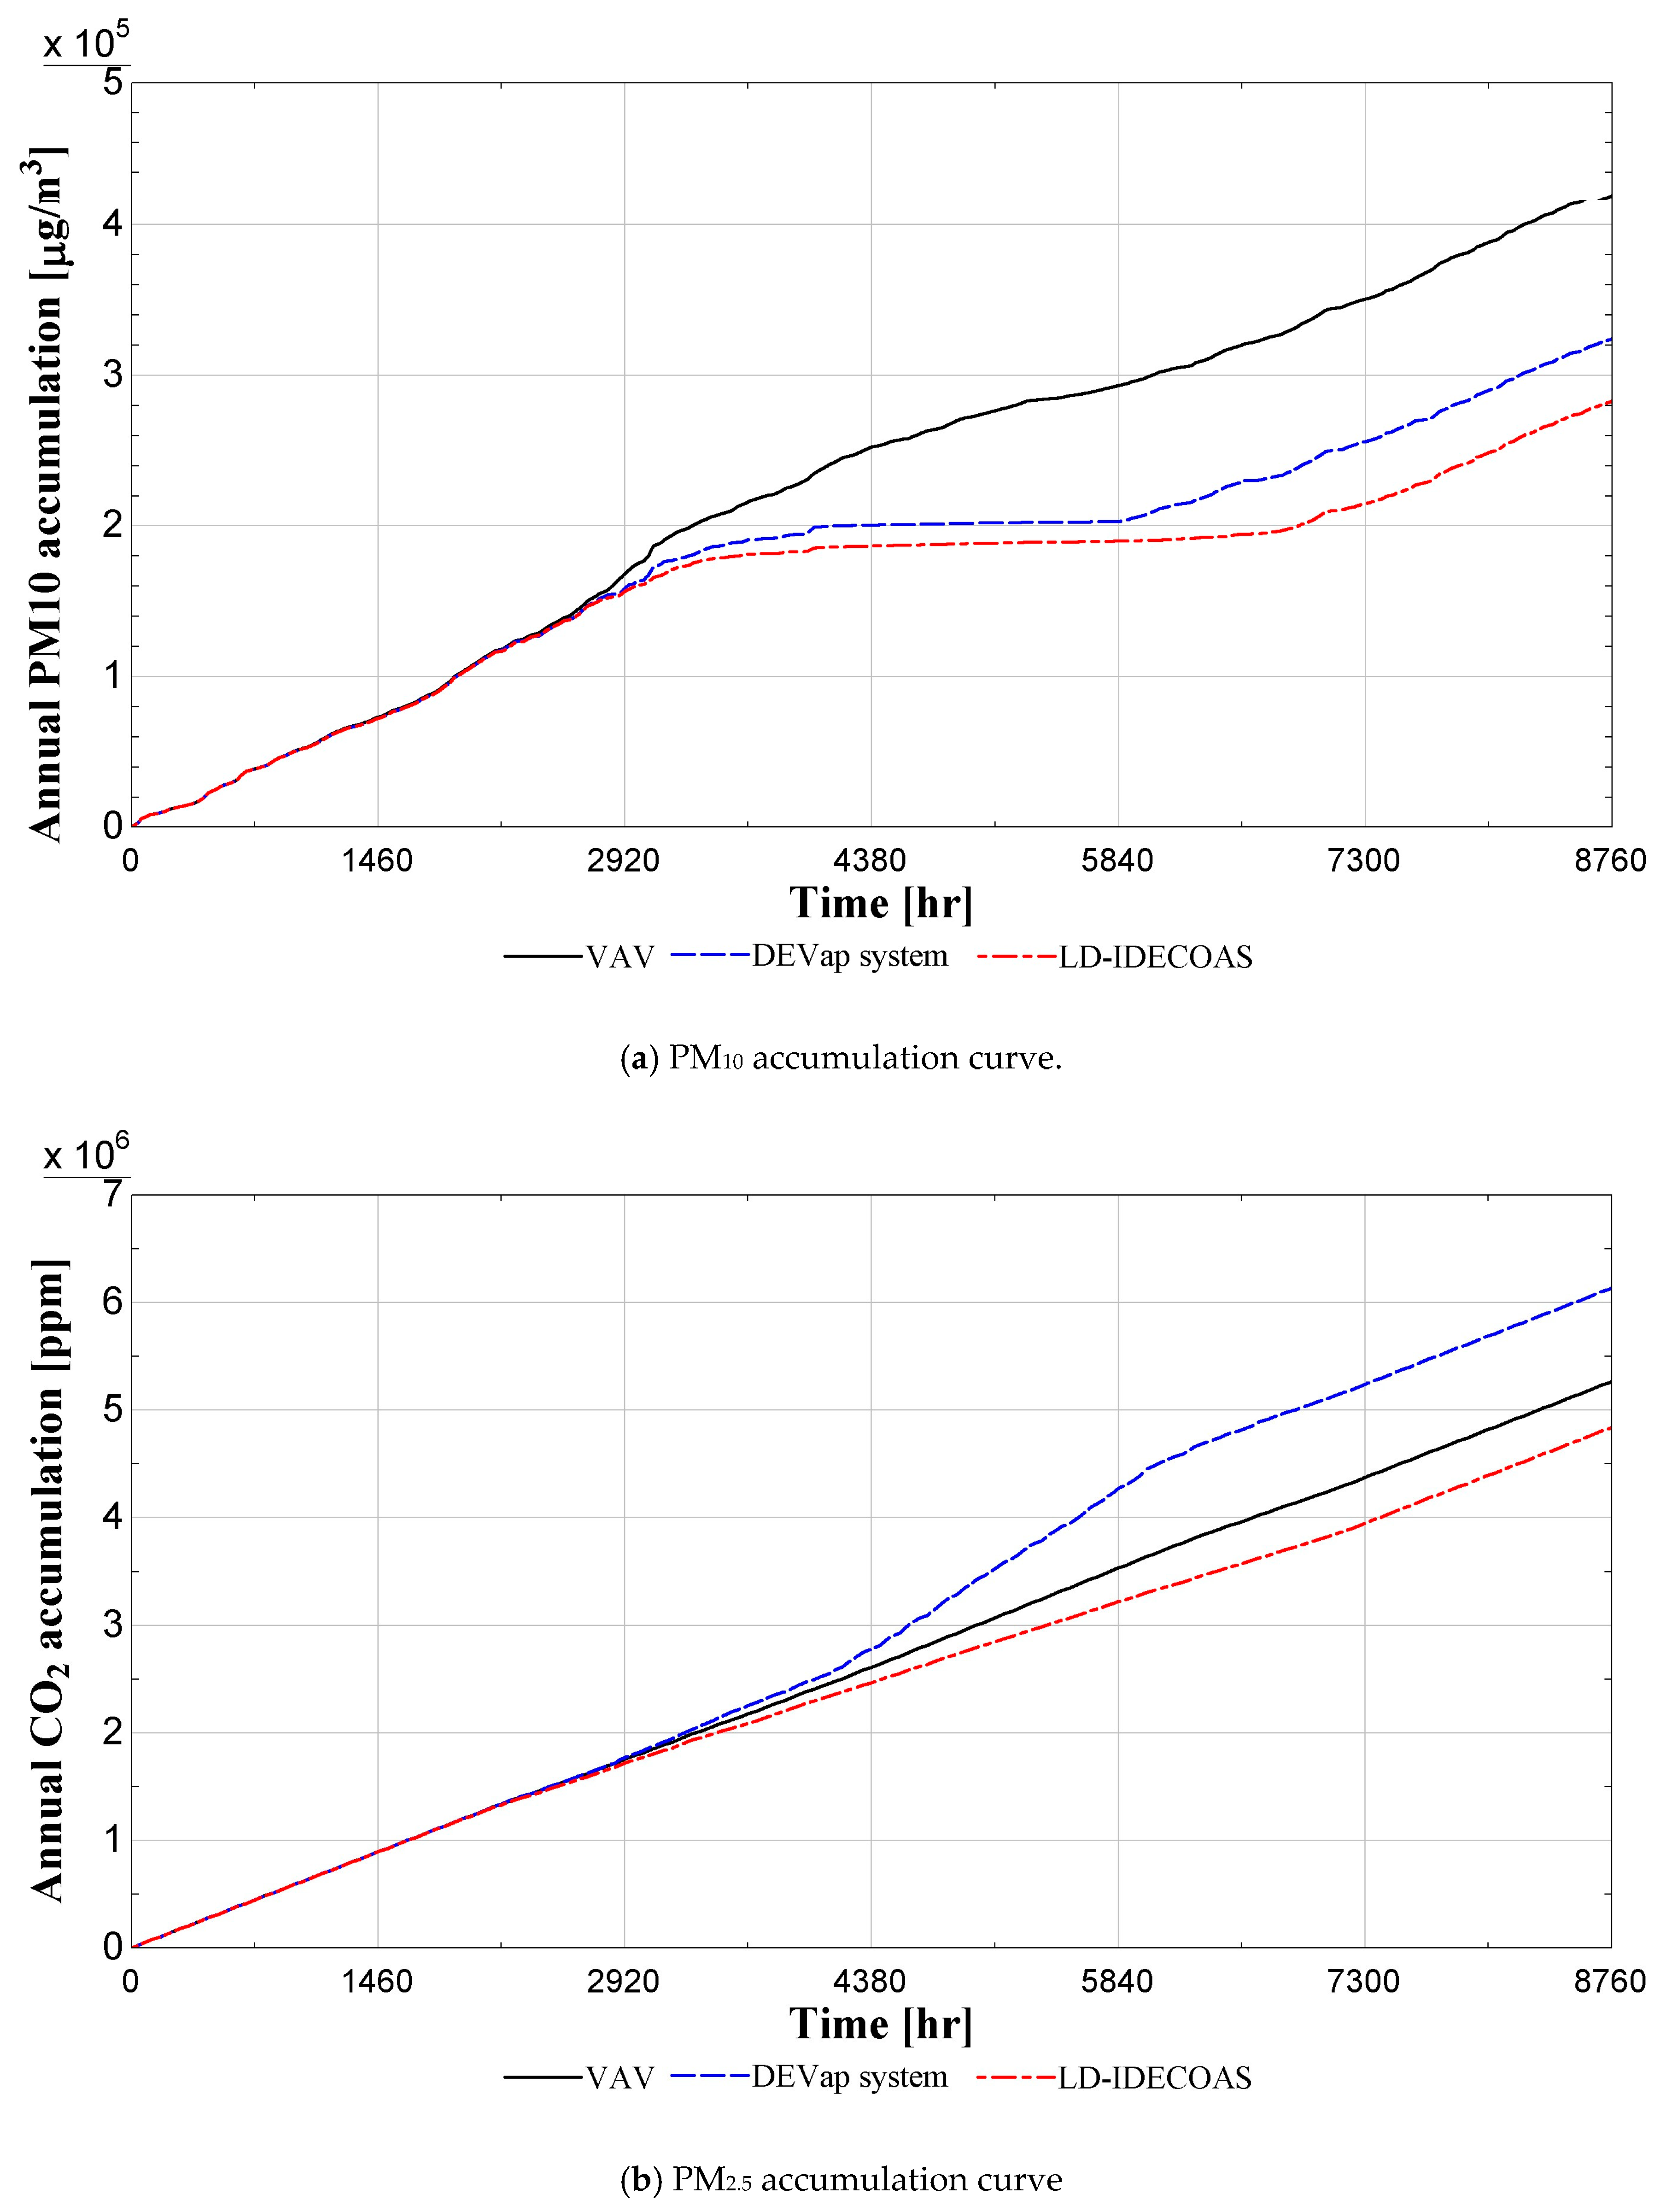
To compare the performance of each system regarding the removal of airborne particles more clearly, the duration (or accumulation) curves of the PM10 and PM2.5 concentrations in the model space served by each system are presented in Figure 11.
As shown in Figure 11a, the LD-IDECOAS, which contains two components (i.e., LD dehumidifier and DEC) that reduce the PM10 in the process air stream, provided the lowest annual accumulation of PM10 concentration in the conditioned space, while the LD-IDECOAS inherently introduced the outdoor air flow containing PM10 compared with the other two systems. The LD-IDECOAS indicated 33.3% and 9.8% less annual PM10 accumulations compared with the conventional VAV system and DEVap system, respectively.
Meanwhile, in the duration curves of the PM2.5 concentration for each system case shown in Figure 11b, the DEVap system indicated the lowest annual accumulation of PM2.5 concentration in the conditioned space, while it was not vastly different from the annual PM2.5 duration curve for the LD-IDECOAS. Although the LD-IDECOAS contained two components (i.e., LD dehumidifier and DEC) that could reduce the PM2.5 concentration in the process air stream, the PM2.5 removal efficiencies of both components (i.e., 48% and 11%, respectively) were much lower than those for PM10 (i.e., 85% and 45%, respectively). In addition, the LD-IDECOAS inherently introduced outdoor air containing PM2.5 compared with the other two systems. Consequently, the LD-IDECOAS indicated a 1.7% higher annual PM2.5 accumulation than the DEVap system that contained one component (i.e., LD humidifier) providing PM2.5 reduction in the process air stream, while the annual PM2.5 accumulation of the LD-IDECOAS was 16% less than that of the conventional VAV system.
5. Conclusions
In this research, the indoor air quality performance of two different types of liquid desiccant evaporative cooling systems (i.e., DEVap system and LD-IDECOAS) were compared with that of a reference air handling system (i.e., conventional VAV system) by performing a series of transient simulations for the variations in CO2, PM10, and PM2.5 concentrations in the model space served by each system. For simplicity, the deposition and re-suspension of particulate contaminants in the ducts and the conditioned space were not considered. It was also assumed that the filtration rates of the pre-filters and air conditioning coils installed in each system for the airborne particles were negligible.
The results indicated that the LD-IDECOAS could maintain lower CO2, PM10, and PM2.5 concentrations inside the conditioned zone compared with the other two systems in the annual operation, while the DEVap system provided better indoor air quality than the reference VAV system. The indoor air quality benefit of the LD-IDECOAS that was observed in this research was primarily due to the inherent characteristics of the system. The LD-IDECOAS is a once-through system that does not redirect the contaminated room air to the supply air side, while the reference system and the DEVap system reuse the room return air. In addition, two major components (i.e., LD and DEC) of the LD-IDECOAS provided significant impact on reducing the PM10 and PM2.5 concentrations of the conditioned zone. These results show that the LD-IDECOAS not only has the advantage of saving more energy than the reference system, but also has a positive effect on the health of occupants by providing better air quality to occupants. Since this study investigated the concentration of indoor particles based on the simulation, additional empirical and analytical research would be required for the clear verification of the results acquired in this research.
Author Contributions
B.-J.K. designed the research, conducted the experiment, and finished the writing of the paper; J.P. provided helpful comments on the experimental method and results; J.-W.J. supervised the research design and execution, and provided valuable suggestions during the writing of the manuscript.
Acknowledgments
This work was supported by the Korea Agency for Infrastructure Technology Advancement (KAIA) grants (18CTAP-C116268-03 and 19CTAP-C141826-02), and the Korea Institute of Energy Technology Evaluation and Planning (KETEP) (No. 20184010201710).
Conflicts of Interest
The authors declare no conflict of interest.
References
- Goetzler, W.; Zogg, R.; Young, J.; Johnson, C. Energy Savings Potential and RD&D Opportunities for Non-Vapor-Compression HVAC Technologies; US Department of Energy: Washington, DC, USA, 2014.
- Dieckmann, J.; Roth, K.; Brodrick, J. Liquid Desiccant Air Conditioners. ASHRAE J. 2008, 50, 90–95. [Google Scholar]
- Kozubal, E.; Woods, J.; Burch, J.; Boranian, A.; Merrigan, T. Desiccant Enhanced Evaporative Air-Conditioning (DEVap): Evaluation of a New Concept in Ultra Efficient Air Conditioning. Available online: https://www.nrel.gov/docs/fy11osti/49722.pdf (accessed on 16 February 2019).
- Lee, S.J.; Kim, H.J.; Dong, H.W.; Jeong, J.W. Energy saving assessment of a desiccant-enhanced evaporative cooling system in variable air volume applications. Appl. Therm. Eng. 2017, 117, 94–108. [Google Scholar] [CrossRef]
- Dong, H.W.; Lee, S.J.; Yoon, D.S.; Park, J.Y.; Jeong, J.W. Impact of district heat source on primary energy savings of a desiccant-enhanced evaporative cooling system. Energy 2017, 123, 432–444. [Google Scholar] [CrossRef]
- Kim, M.H.; Kim, J.H.; Kwon, O.H.; Choi, A.S.; Jeong, J.W. Energy conservation potential of an indirect and direct evaporative cooling assisted 100% outdoor air system. Build. Serv. Eng. Res. Technol. 2011, 32, 345–360. [Google Scholar] [CrossRef]
- Kim, M.H.; Park, J.Y.; Sung, M.K.; Choi, A.S.; Jeong, J.W. Annual operating energy savings of liquid desiccant and evaporative-cooling-assisted 100% outdoor air system. Energy Build. 2014, 76, 538–550. [Google Scholar] [CrossRef]
- Park, J.Y.; Yoon, D.S.; Li, S.; Park, J.; Bang, J.I.; Sung, M.; Jeong, J.W. Empirical analysis of indoor air quality enhancement potential in a liquid-desiccant assisted air conditioning system. Build. Environ. 2017, 121, 11–25. [Google Scholar] [CrossRef]
- Kim, M.H.; Dong, H.W.; Park, J.Y.; Jeong, J.W. Primary energy savings in desiccant and evaporative cooling-assisted 100% outdoor air system combined with a fuel cell. Appl. Energy 2016, 180, 446–456. [Google Scholar] [CrossRef]
- Shin, J.H.; Park, J.Y.; Jo, M.S.; Jeong, J.W. Impact of Heat Pump-Driven Liquid Desiccant Dehumidification on the Energy Performance of an Evaporative Cooling-Assisted Air Conditioning System. Energies 2018, 11, 345. [Google Scholar] [CrossRef]
- Park, J.Y.; Jeong, J.W. Operating energy savings of a liquid desiccant and evaporative cooling-assisted air-handling system in marine applications. Energies 2017, 10, 487. [Google Scholar] [CrossRef]
- Paschold, H.; Li, W.W.; Morales, H.; Walton, J. Laboratory study of the impact of evaporative coolers on indoor PM concentrations. Atmos. Environ. 2003, 37, 1075–1086. [Google Scholar] [CrossRef]
- Liu, X.; Guan, B.; Liu, X. Experimental Study on the Filtration Efficiency of Structured Packing Air Handling Processors. Procedia Eng. 2015, 121, 2037–2043. [Google Scholar] [CrossRef] [Green Version]
- Li, W.W.; Paschold, H.; Morales, H.; Chianelli, J. Correlations between short-term indoor and outdoor PM concentrations at residences with evaporative coolers. Atmos. Environ. 2003, 37, 2691–2703. [Google Scholar] [CrossRef]
- ASHRAE. ANSI/ASHRAE/IES Standard 62.1-2016 Ventilation for Acceptable Indoor Air Quality; American Society of Heating, Refrigerating and Air-Conditioning Engineers, Inc.: Atlanta, Georgia, 2016. [Google Scholar]
- Woods, J.; Kozubal, E. A desiccant-enhanced evaporative air conditioner: Numerical model and experiments. Energy Convers. Manag. 2013, 65, 208–220. [Google Scholar] [CrossRef]
- Meckler, M. Improving Indoor Air Quality Through Design, Operation and Maintenance; Fairmont Press: Lilburn, Georgia, 1996. [Google Scholar]
- Ward, M.; Siegel, J.A.; Corsi, R.L. The effectiveness of stand alone air cleaners for shelter-in-place. Indoor Air 2005, 15, 127–134. [Google Scholar] [CrossRef] [PubMed]
- NOAA Earth System Research Laboratory, Global Monitoring Division, Trends in Atmospheric Carbon Dioxide. 2018. Available online: https://www.esrl.noaa.gov/gmd/ccgg/trends/global (accessed on 17 August 2018).
- Airkorea, Airkorea download final Confirmation Data. 2018. Available online: https://www.airkorea.or.kr/last_amb_hour_data (accessed on 6 April 2018).
- Marsik, T.; Johnson, R. HVAC air-quality model and its use to test a PM2.5 control strategy. Build. Environ. 2008, 43, 1850–1857. [Google Scholar] [CrossRef]
- Abt, E.; Suh, H.H.; Catalano, P.; Koutrakis, P. Relative contribution of outdoor and indoor particle sources to indoor concentrations. Environ. Sci. Technol. 2000, 34, 3579–3587. [Google Scholar] [CrossRef]
- Jamriska, M.; Morawska, L.; Clark, B.A. Effect of ventilation and filtration on submicrometer particles in an indoor environment. Indoor Air 2000, 10, 19–26. [Google Scholar] [CrossRef] [PubMed]
- Macintosh, D.L.; Myatt, T.A.; Ludwig, J.F.; Baker, B.J.; Suh, H.H.; Spengler, J.D. Whole house particle removal and clean air delivery rates for in-duct and portable ventilation systems. J. Air Waste Manag. Assoc. 2008, 58, 1474–1482. [Google Scholar] [CrossRef] [PubMed]
- Jamriska, M. Relation between indoor and outdoor exposure to fine particles near a busy Arterial Road. Indoor Air 1999, 9, 75–84. [Google Scholar] [CrossRef] [PubMed]
Figure 1.
Schematic of variable air volume (VAV) system.
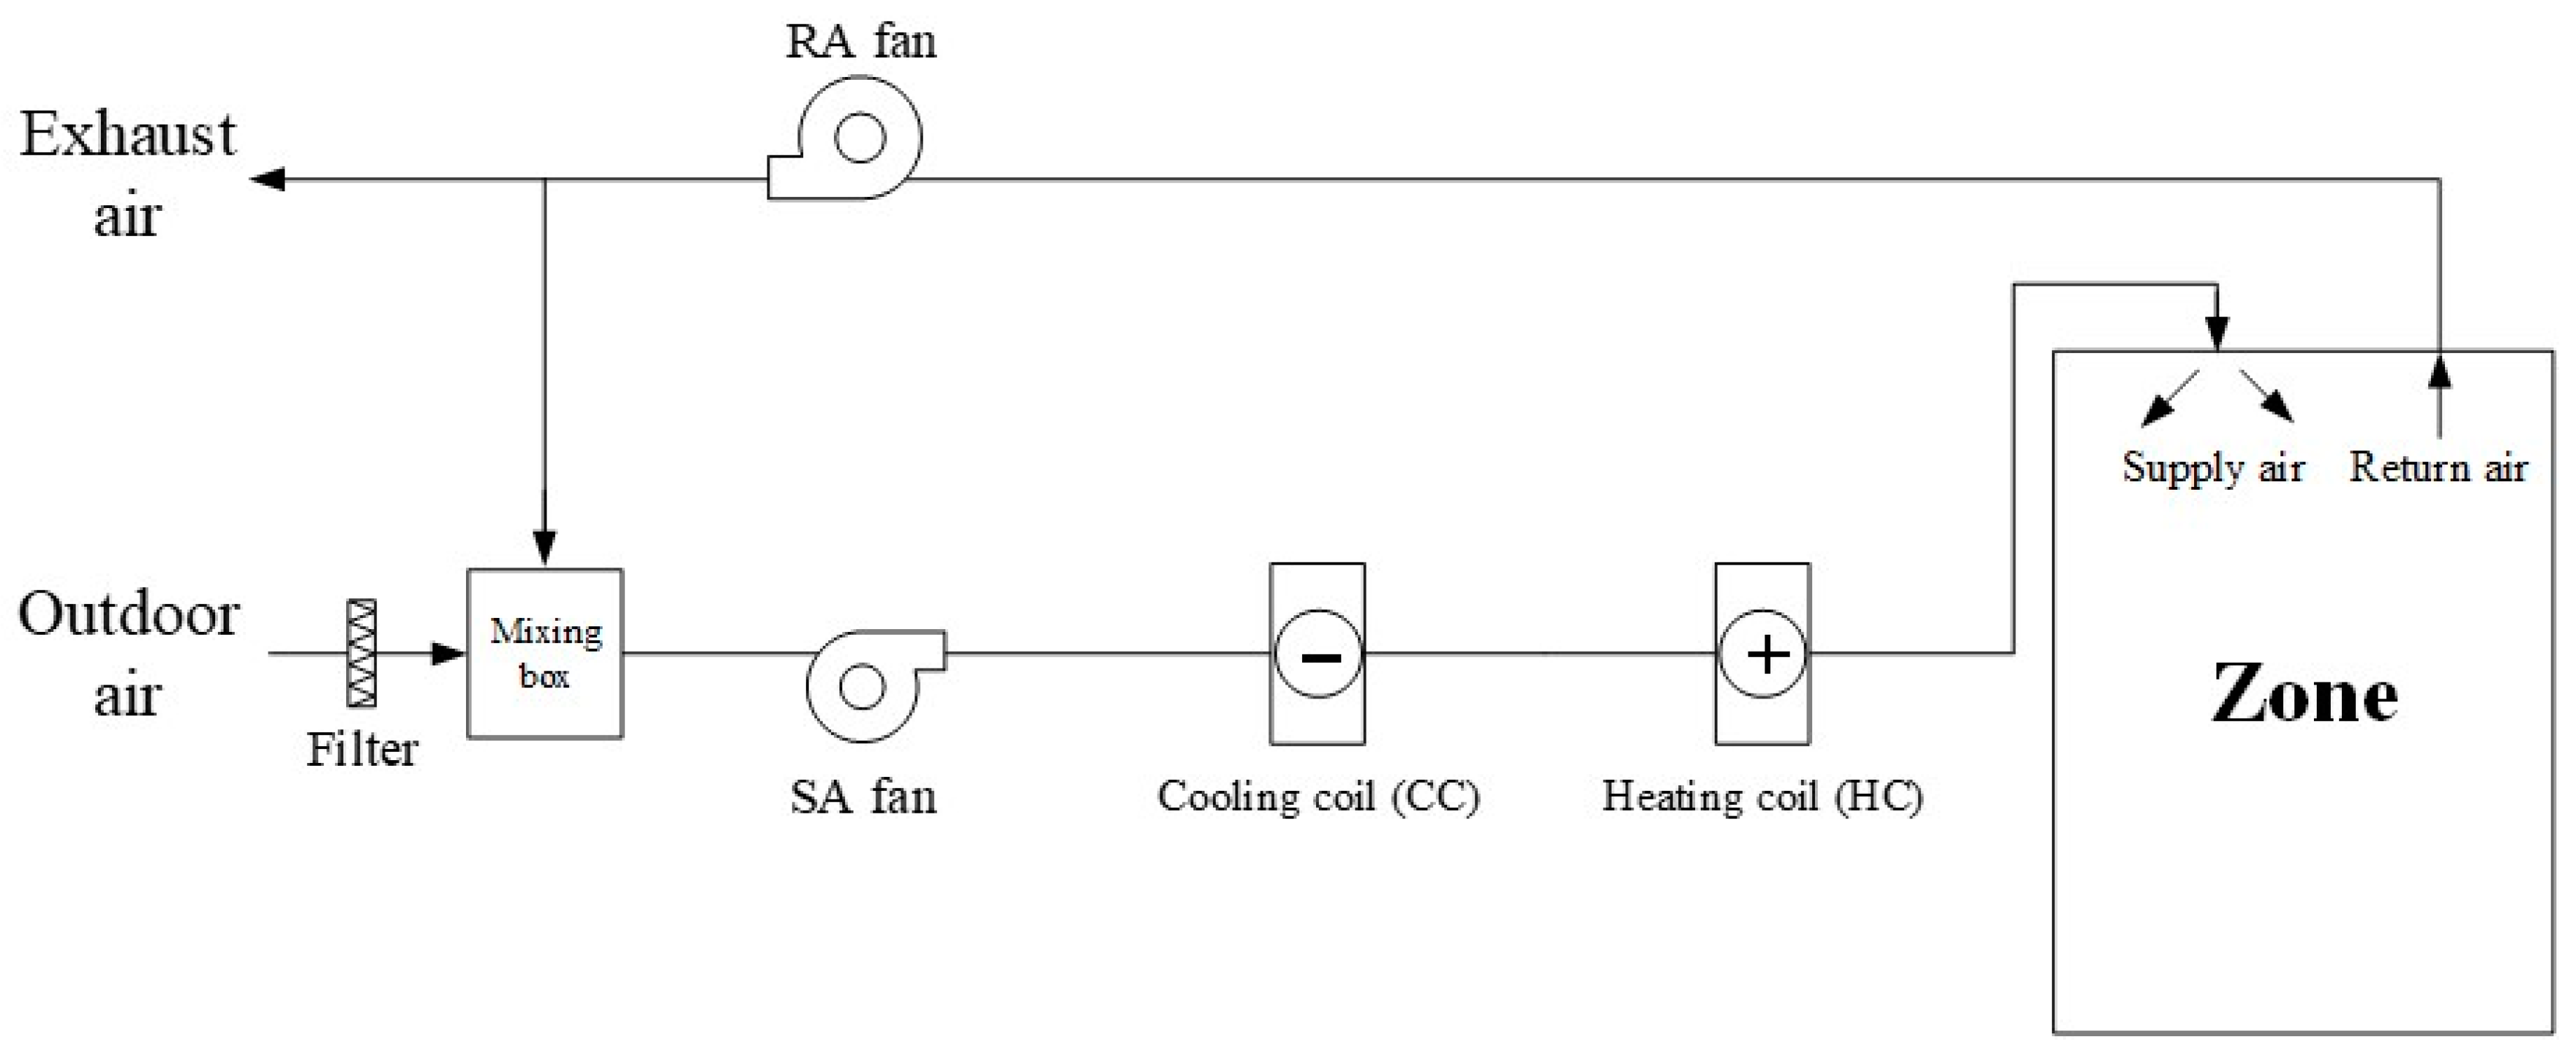
Figure 2.
Schematic of desiccant-enhanced evaporative (DEVap) system.

Figure 3.
Schematic of dew point indirect evaporative cooler (DP-IEC).
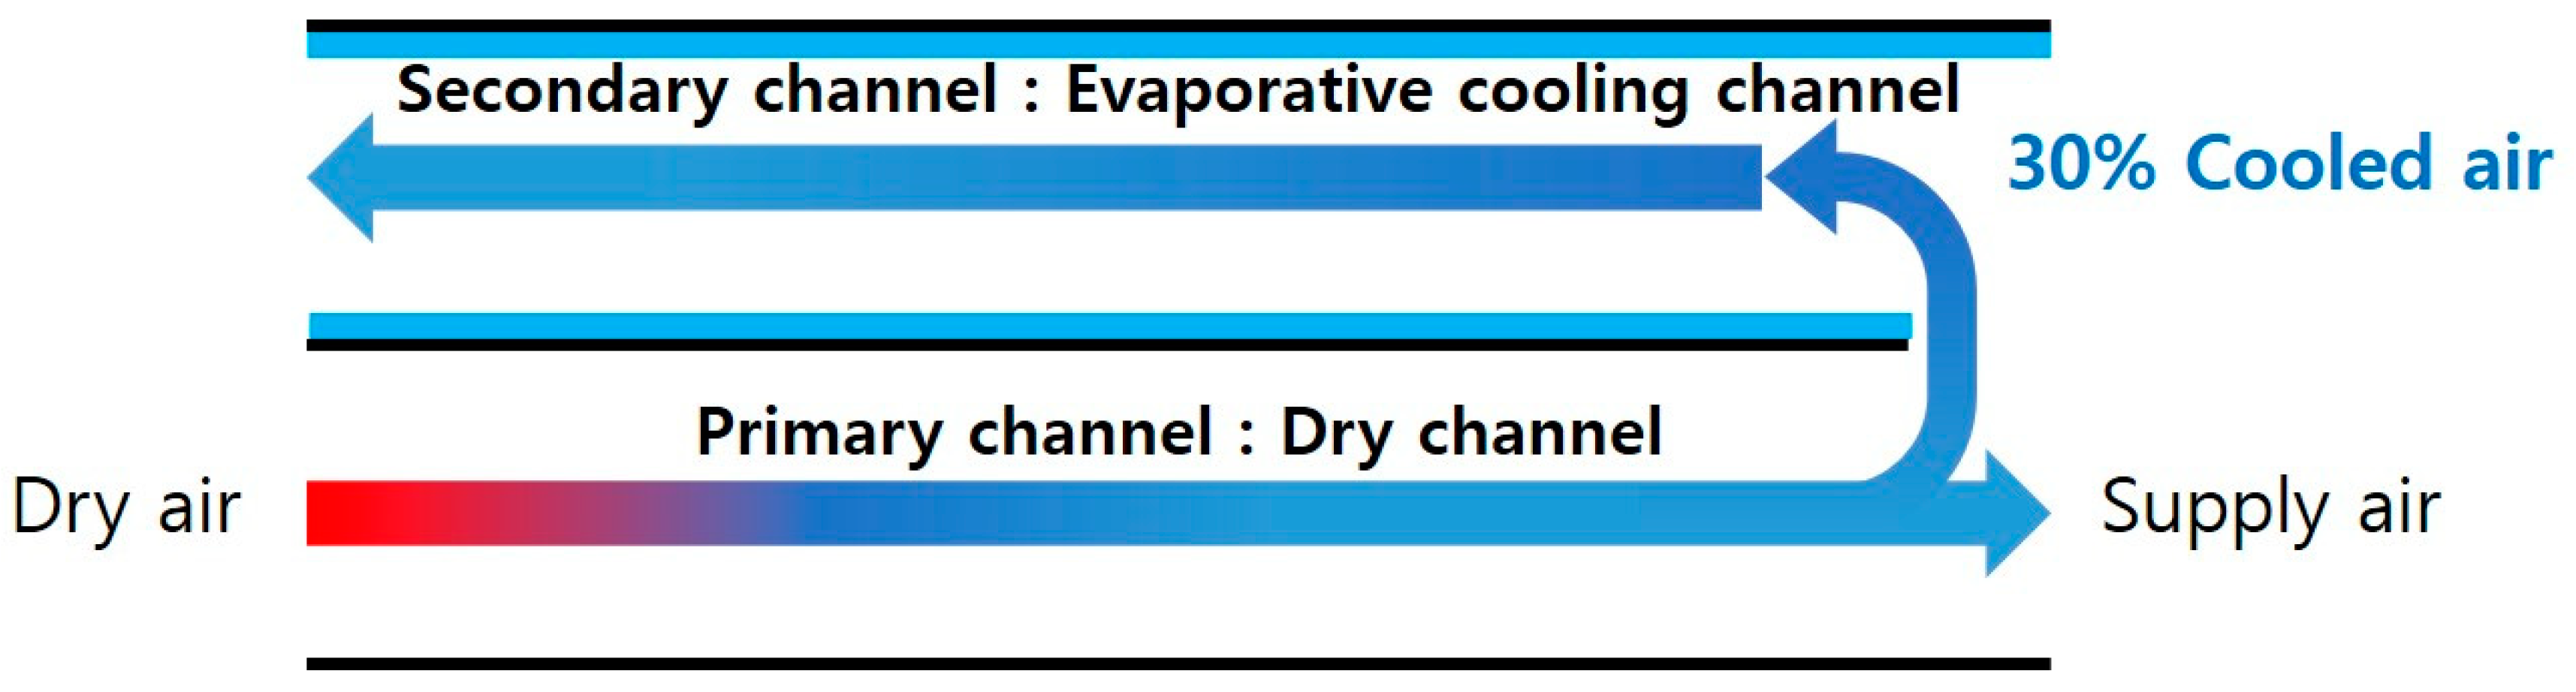
Figure 4.
Operation modes of the DEVap cooling system on a psychrometric chart.
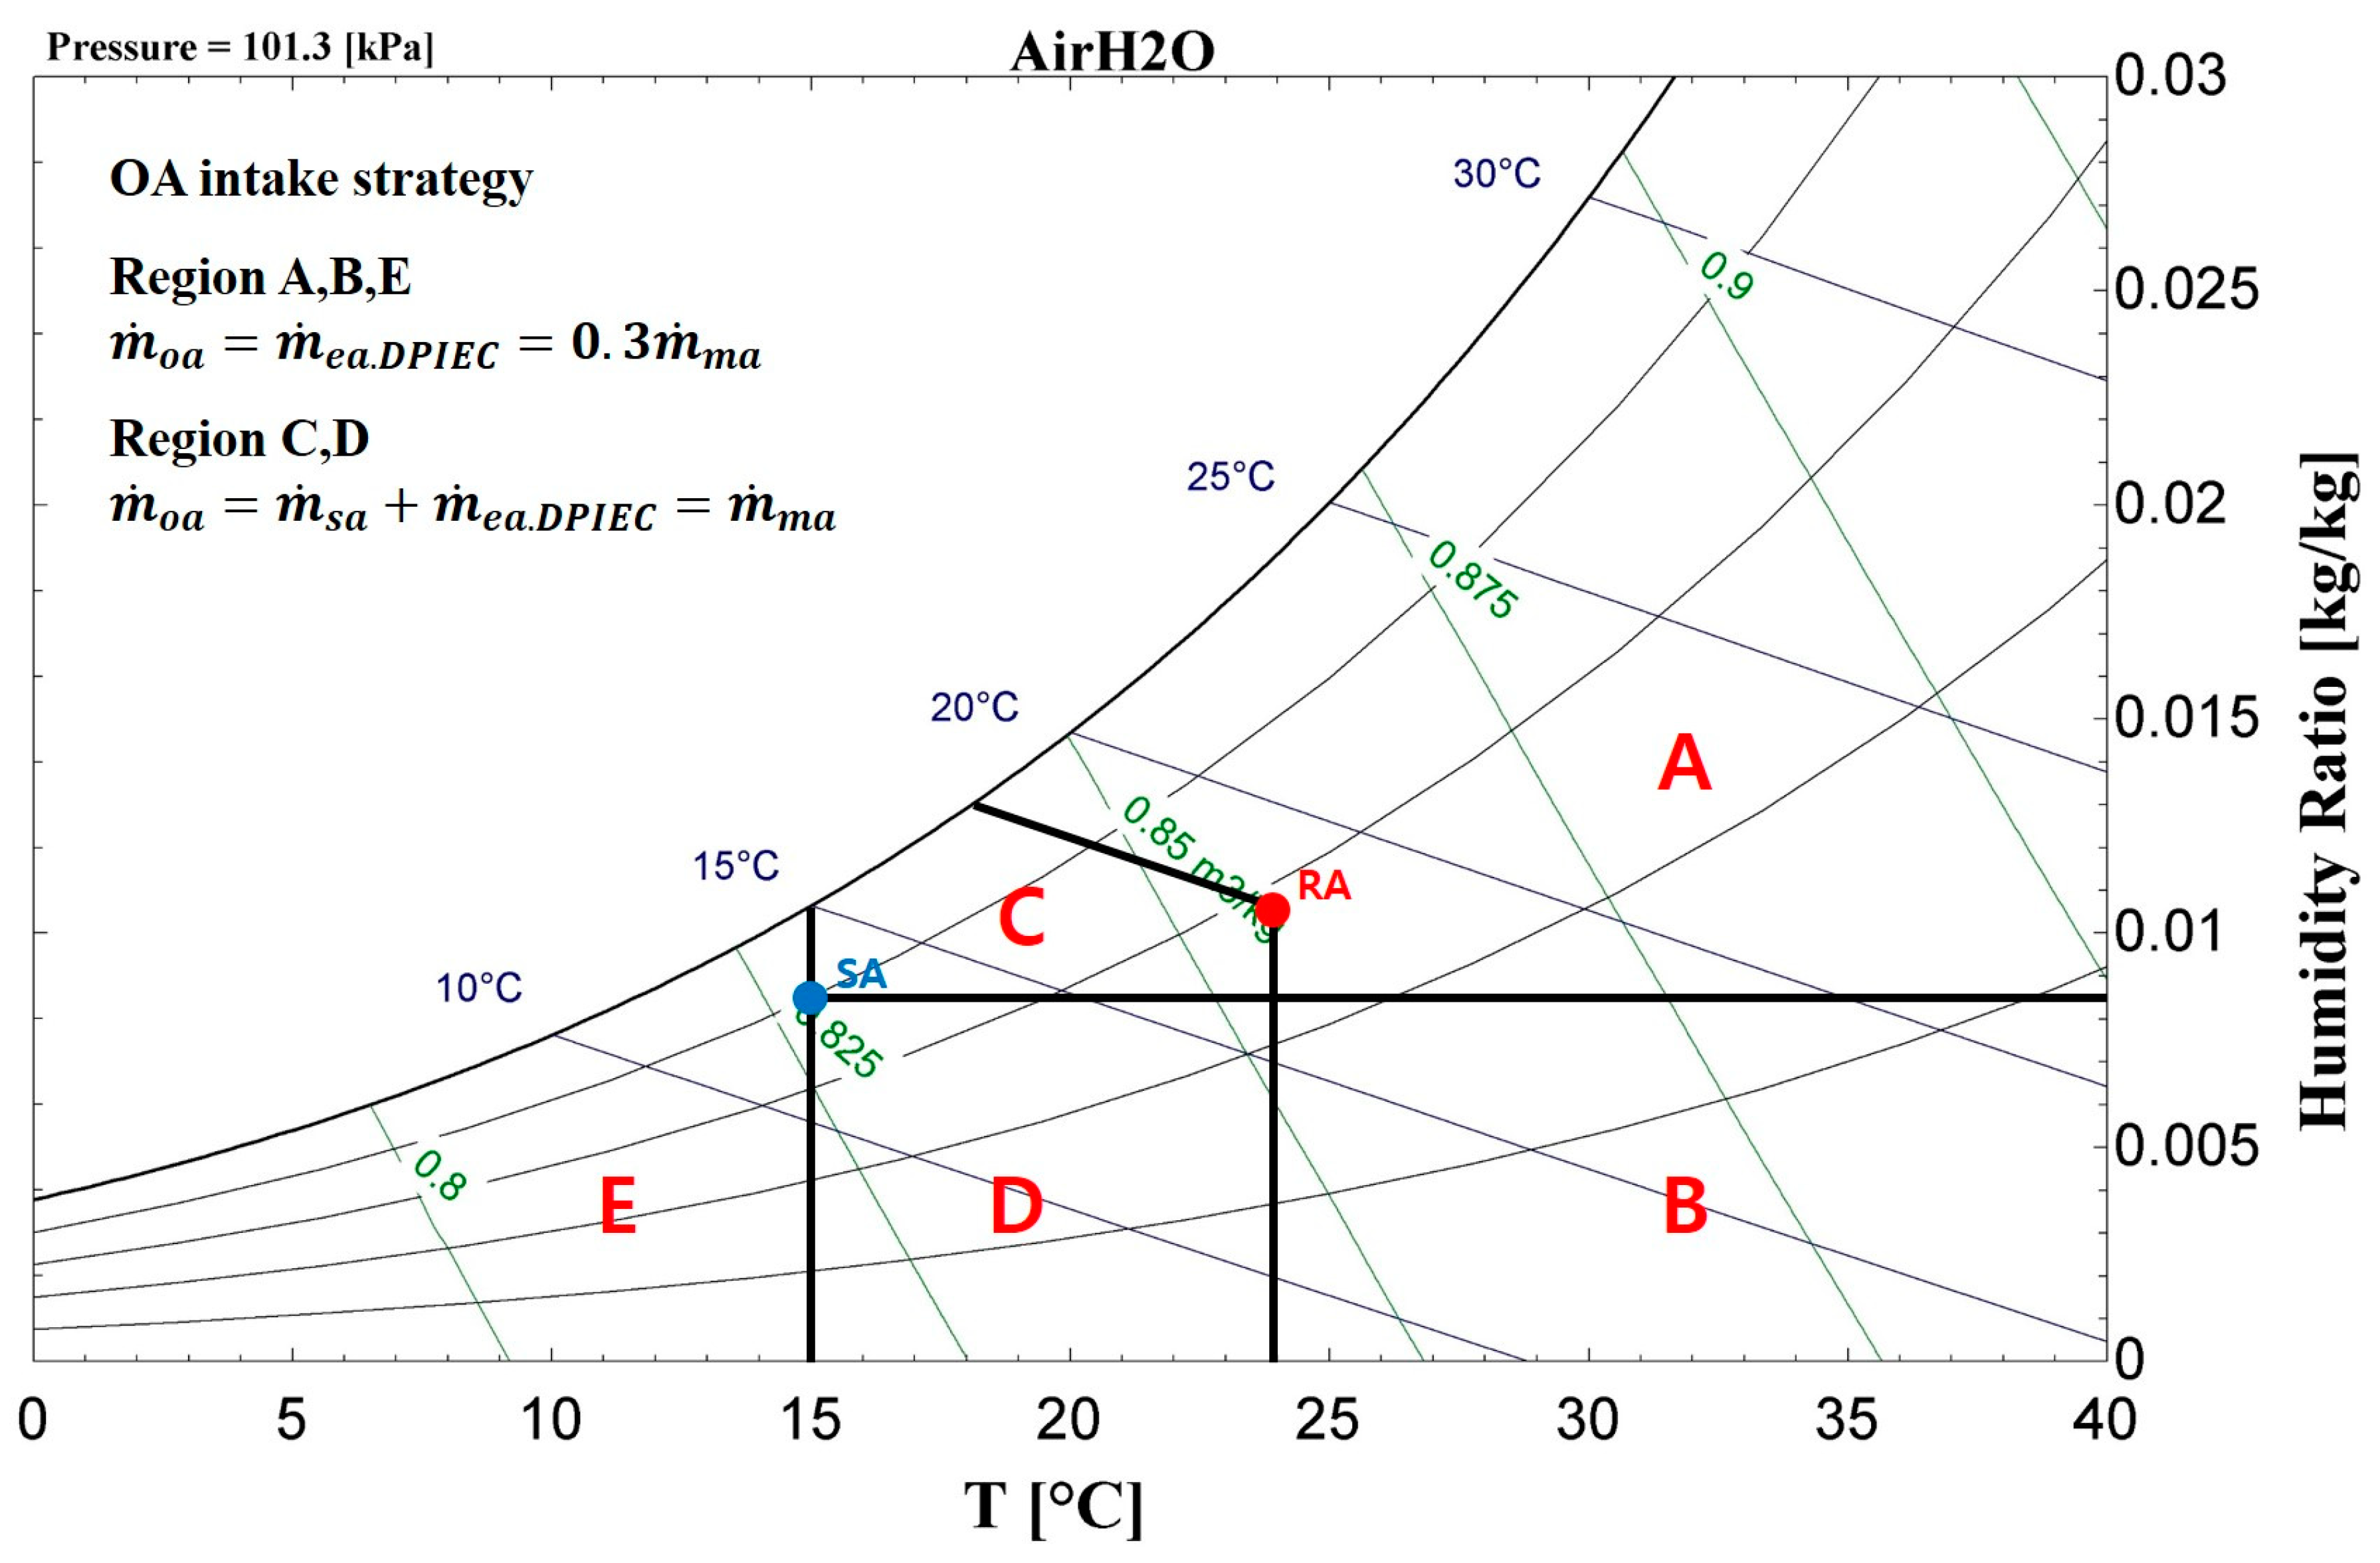
Figure 5.
Schematic of liquid desiccant system with indirect and direct evaporative cooling-assisted 100% outdoor air system (LD-IDECOAS).
Figure 5.
Schematic of liquid desiccant system with indirect and direct evaporative cooling-assisted 100% outdoor air system (LD-IDECOAS).
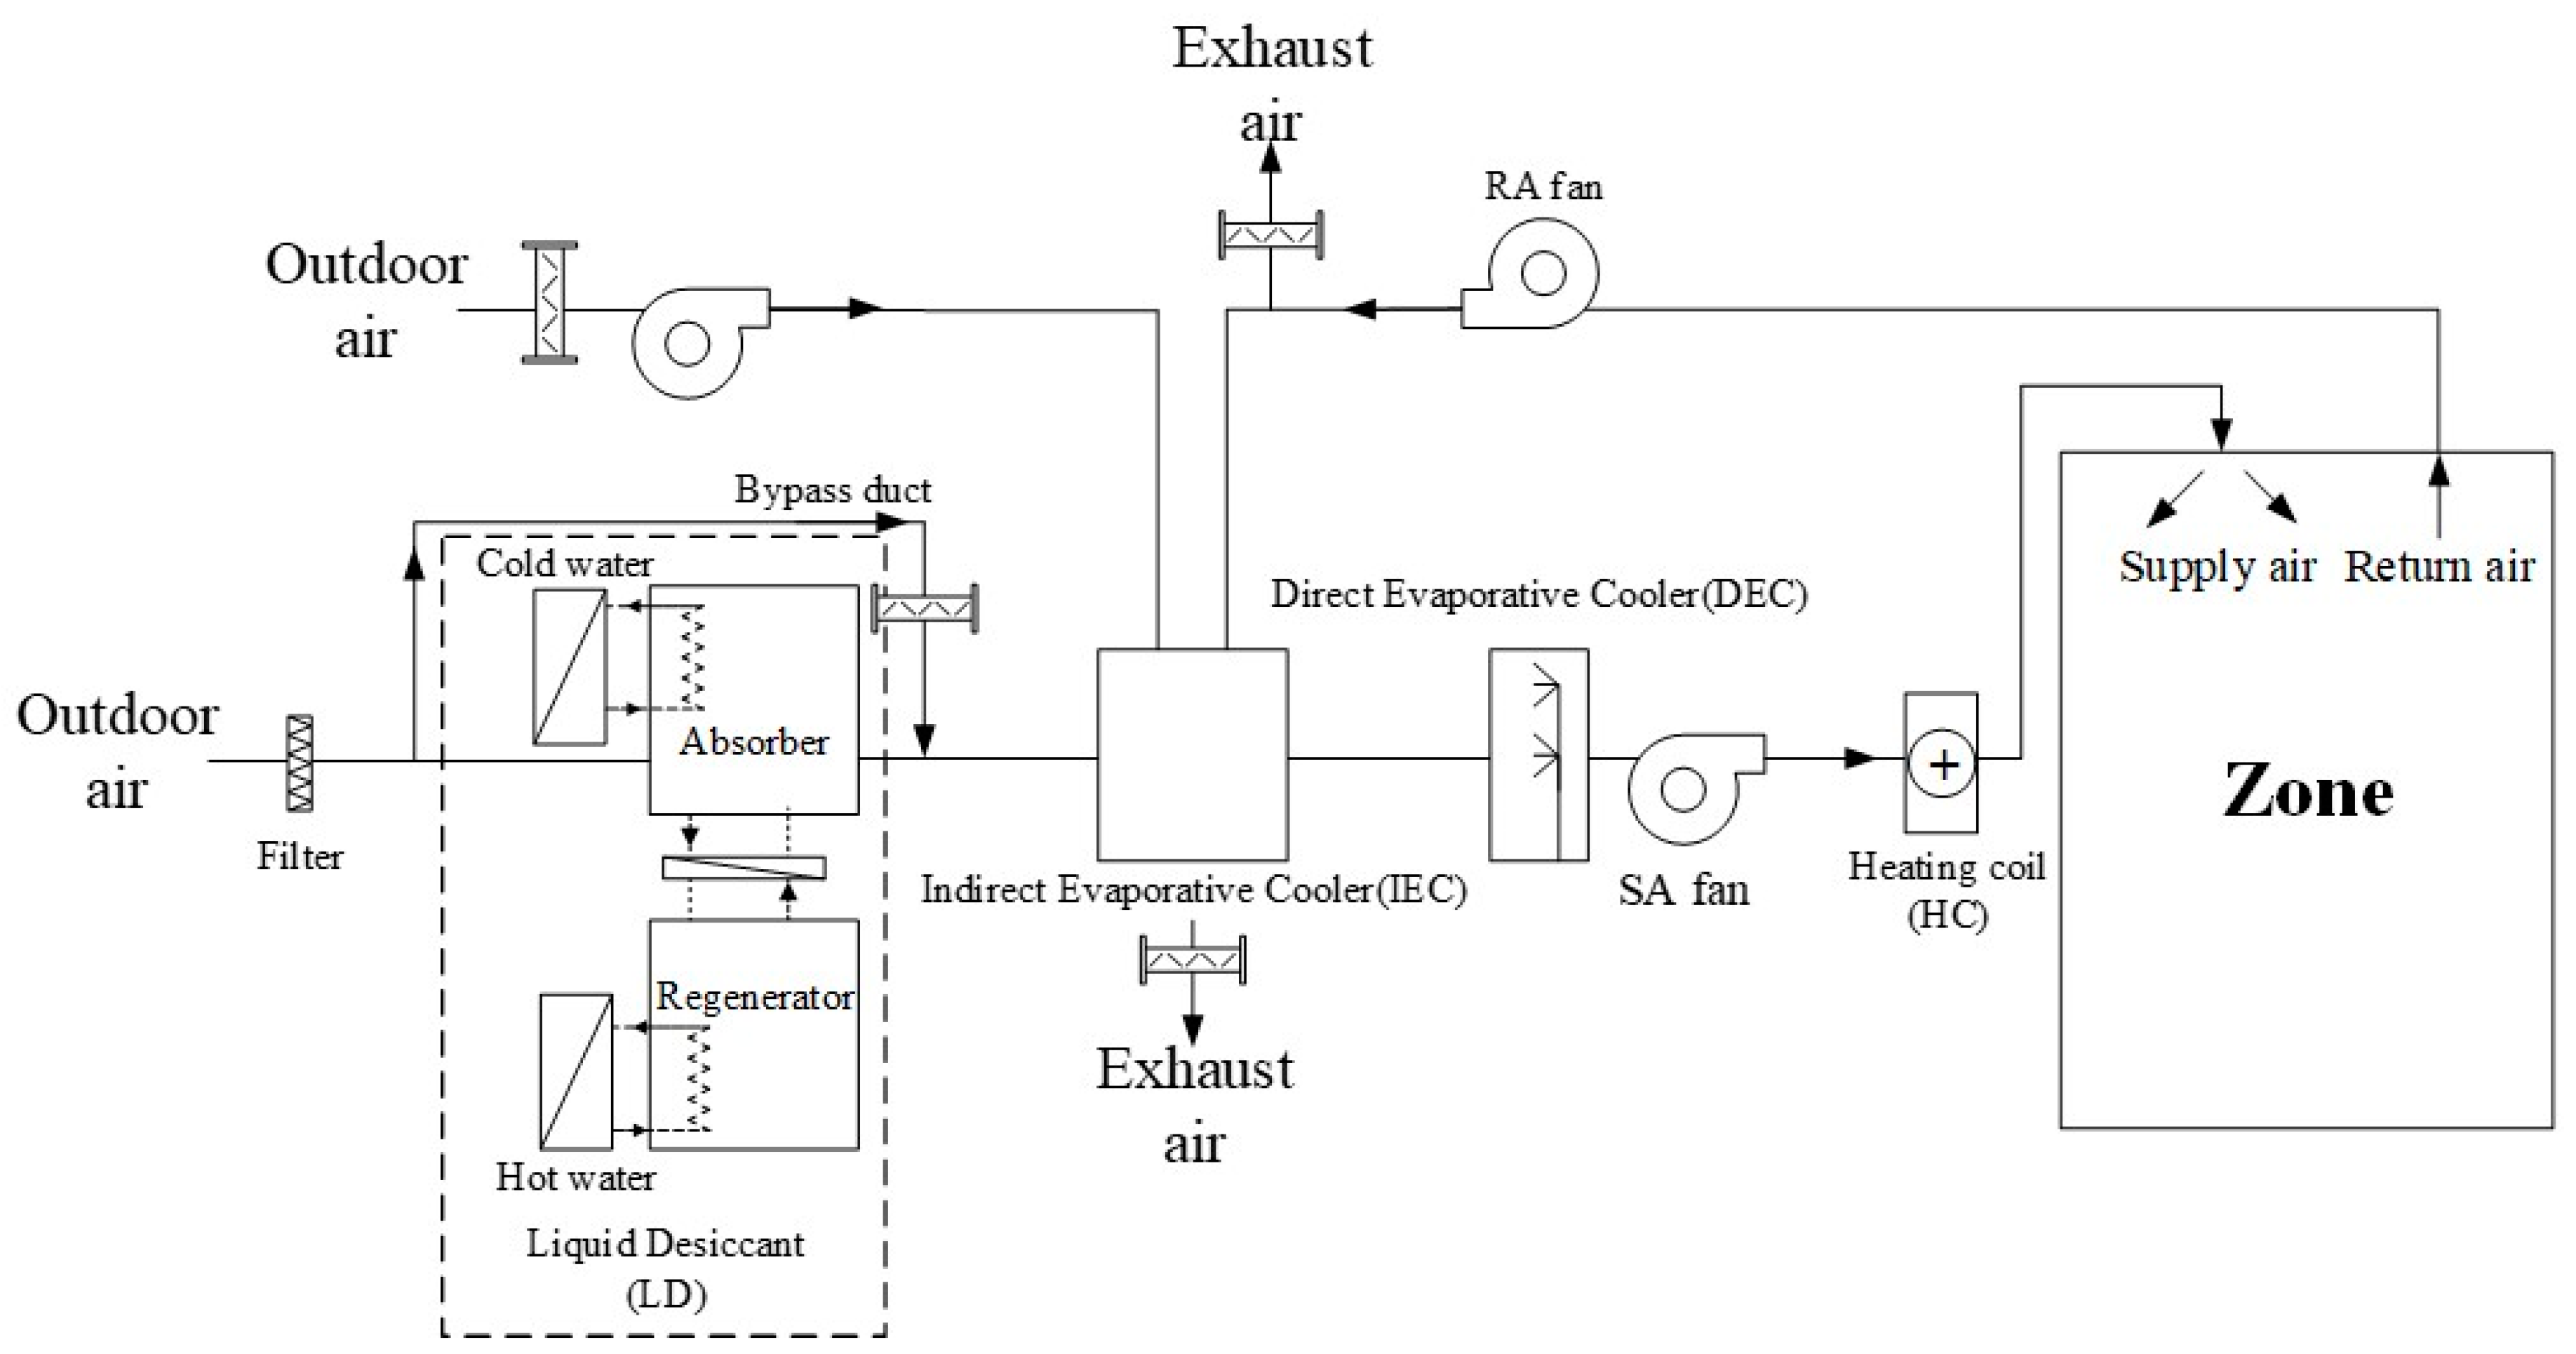
Figure 6.
Operation modes of the LD-IDECOAS on a psychrometric chart.
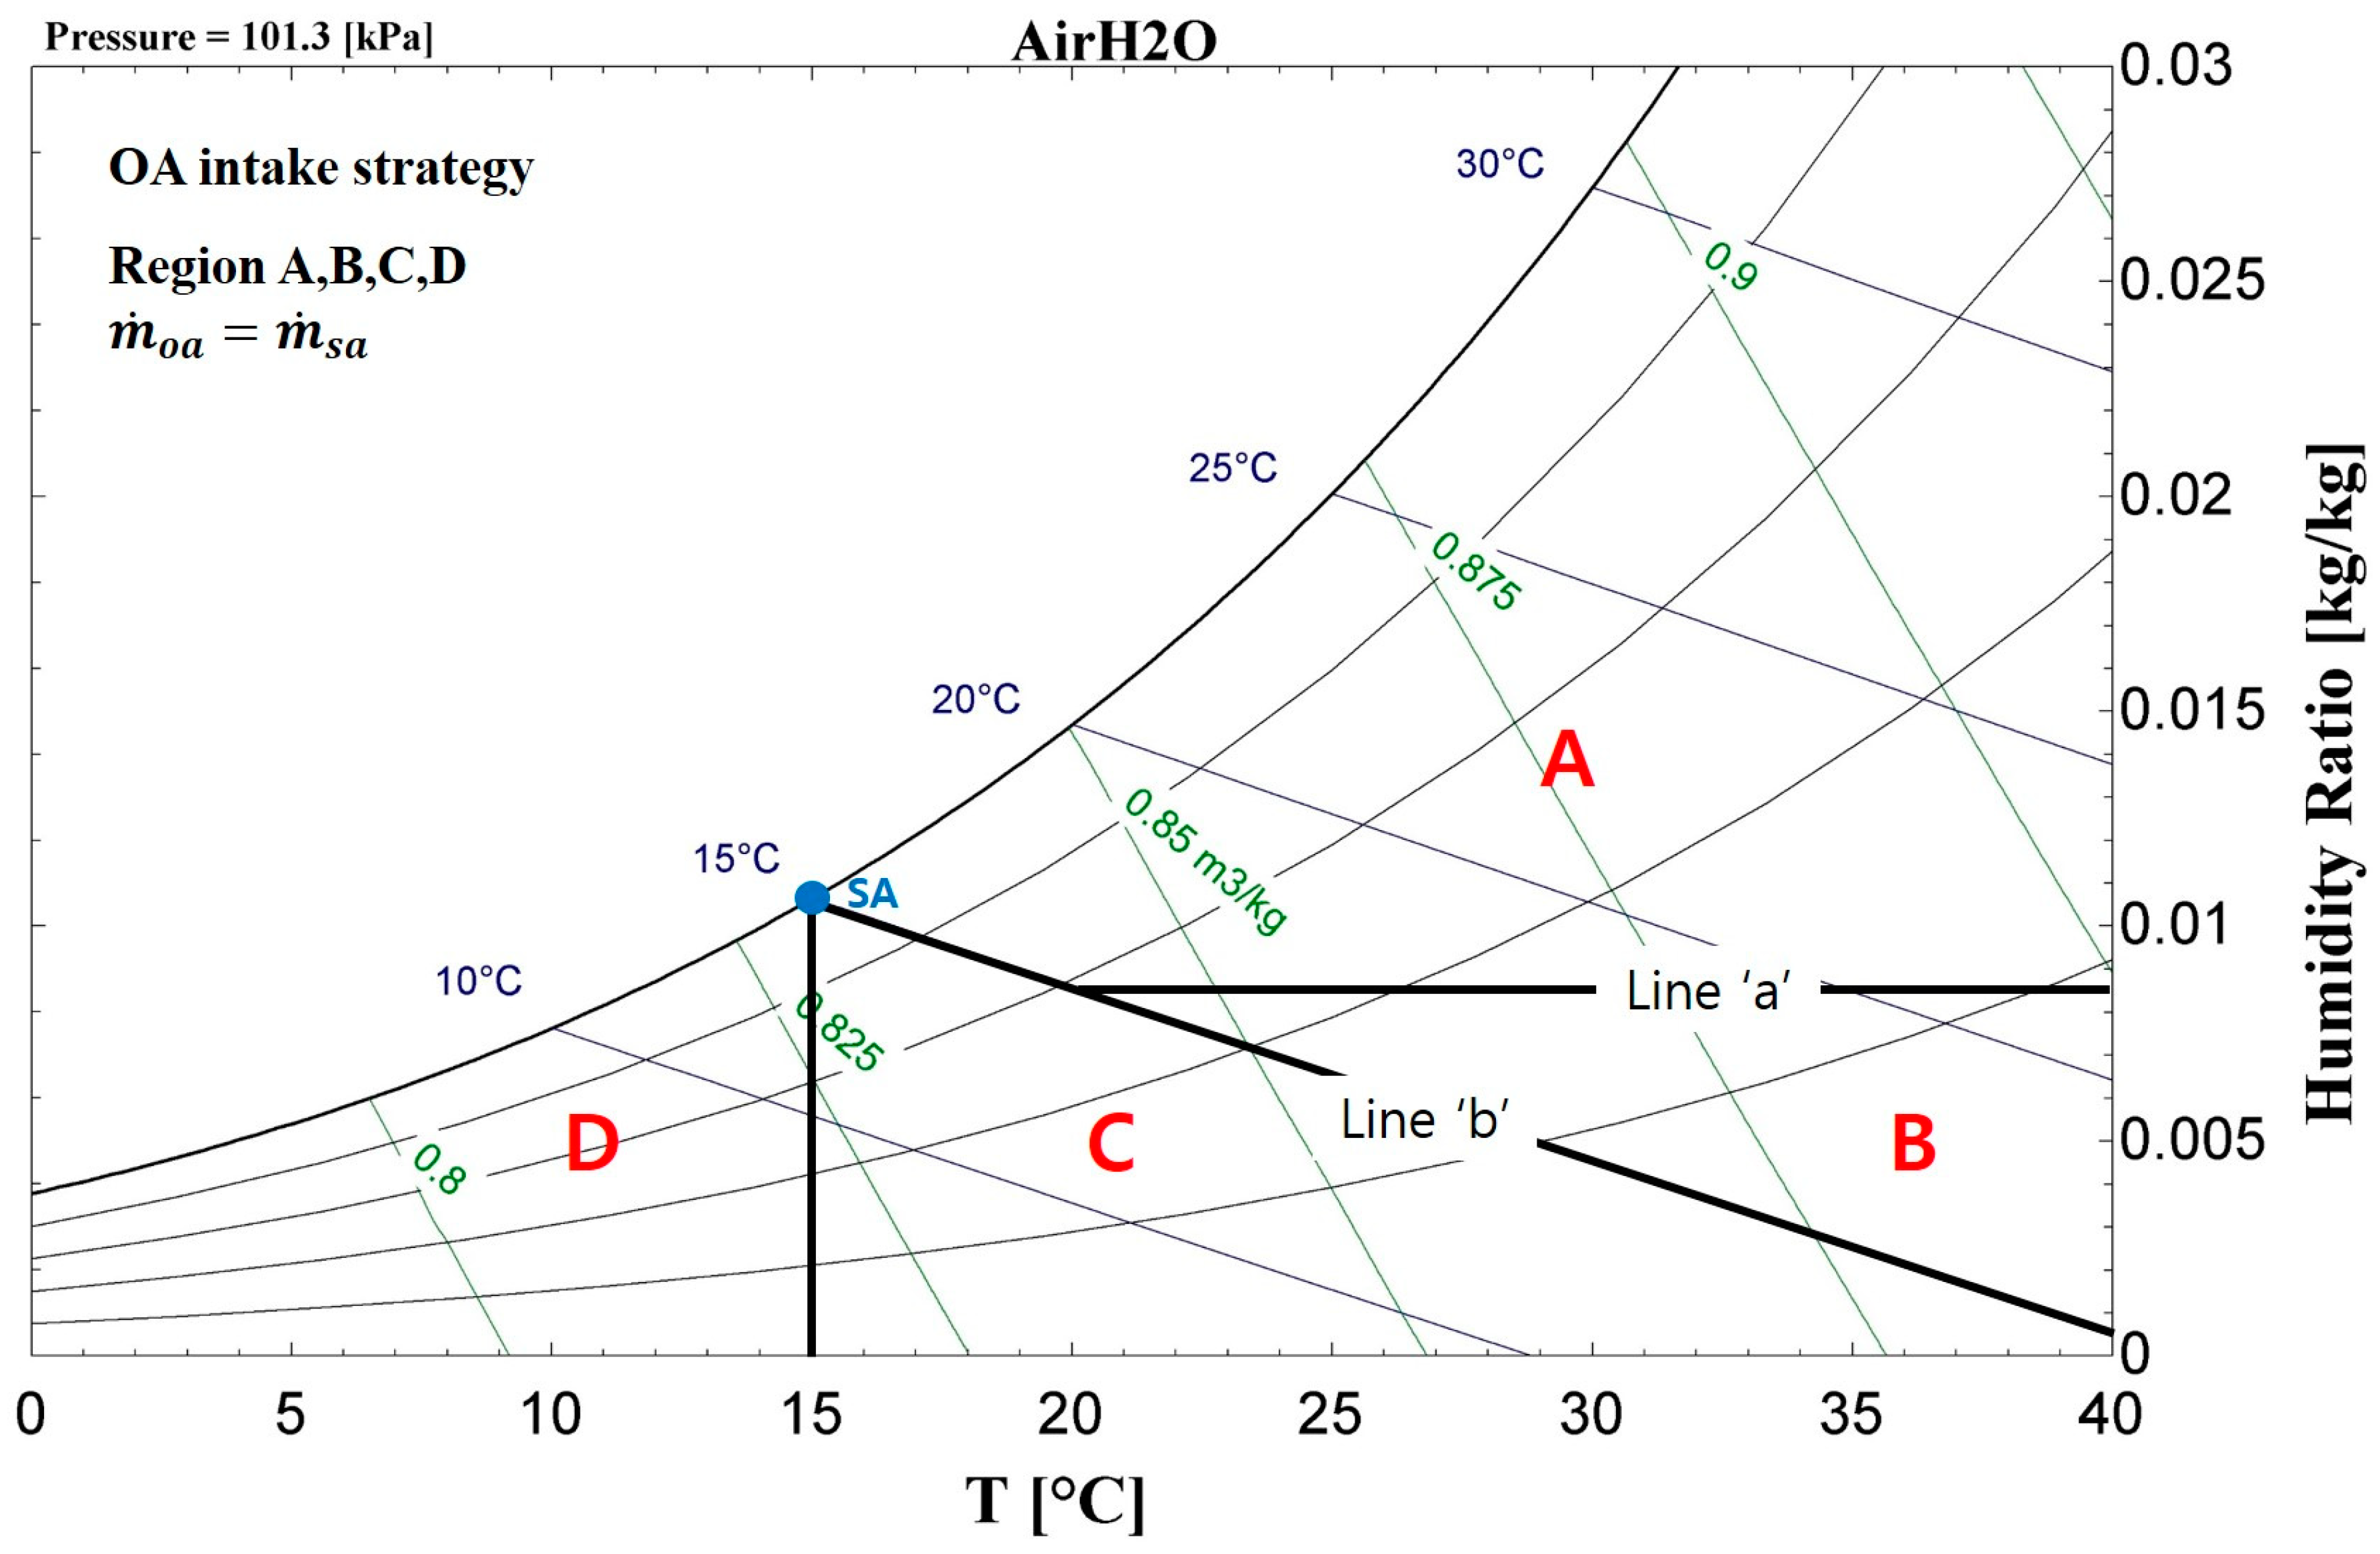
Figure 7.
Outdoor PM concentrations.
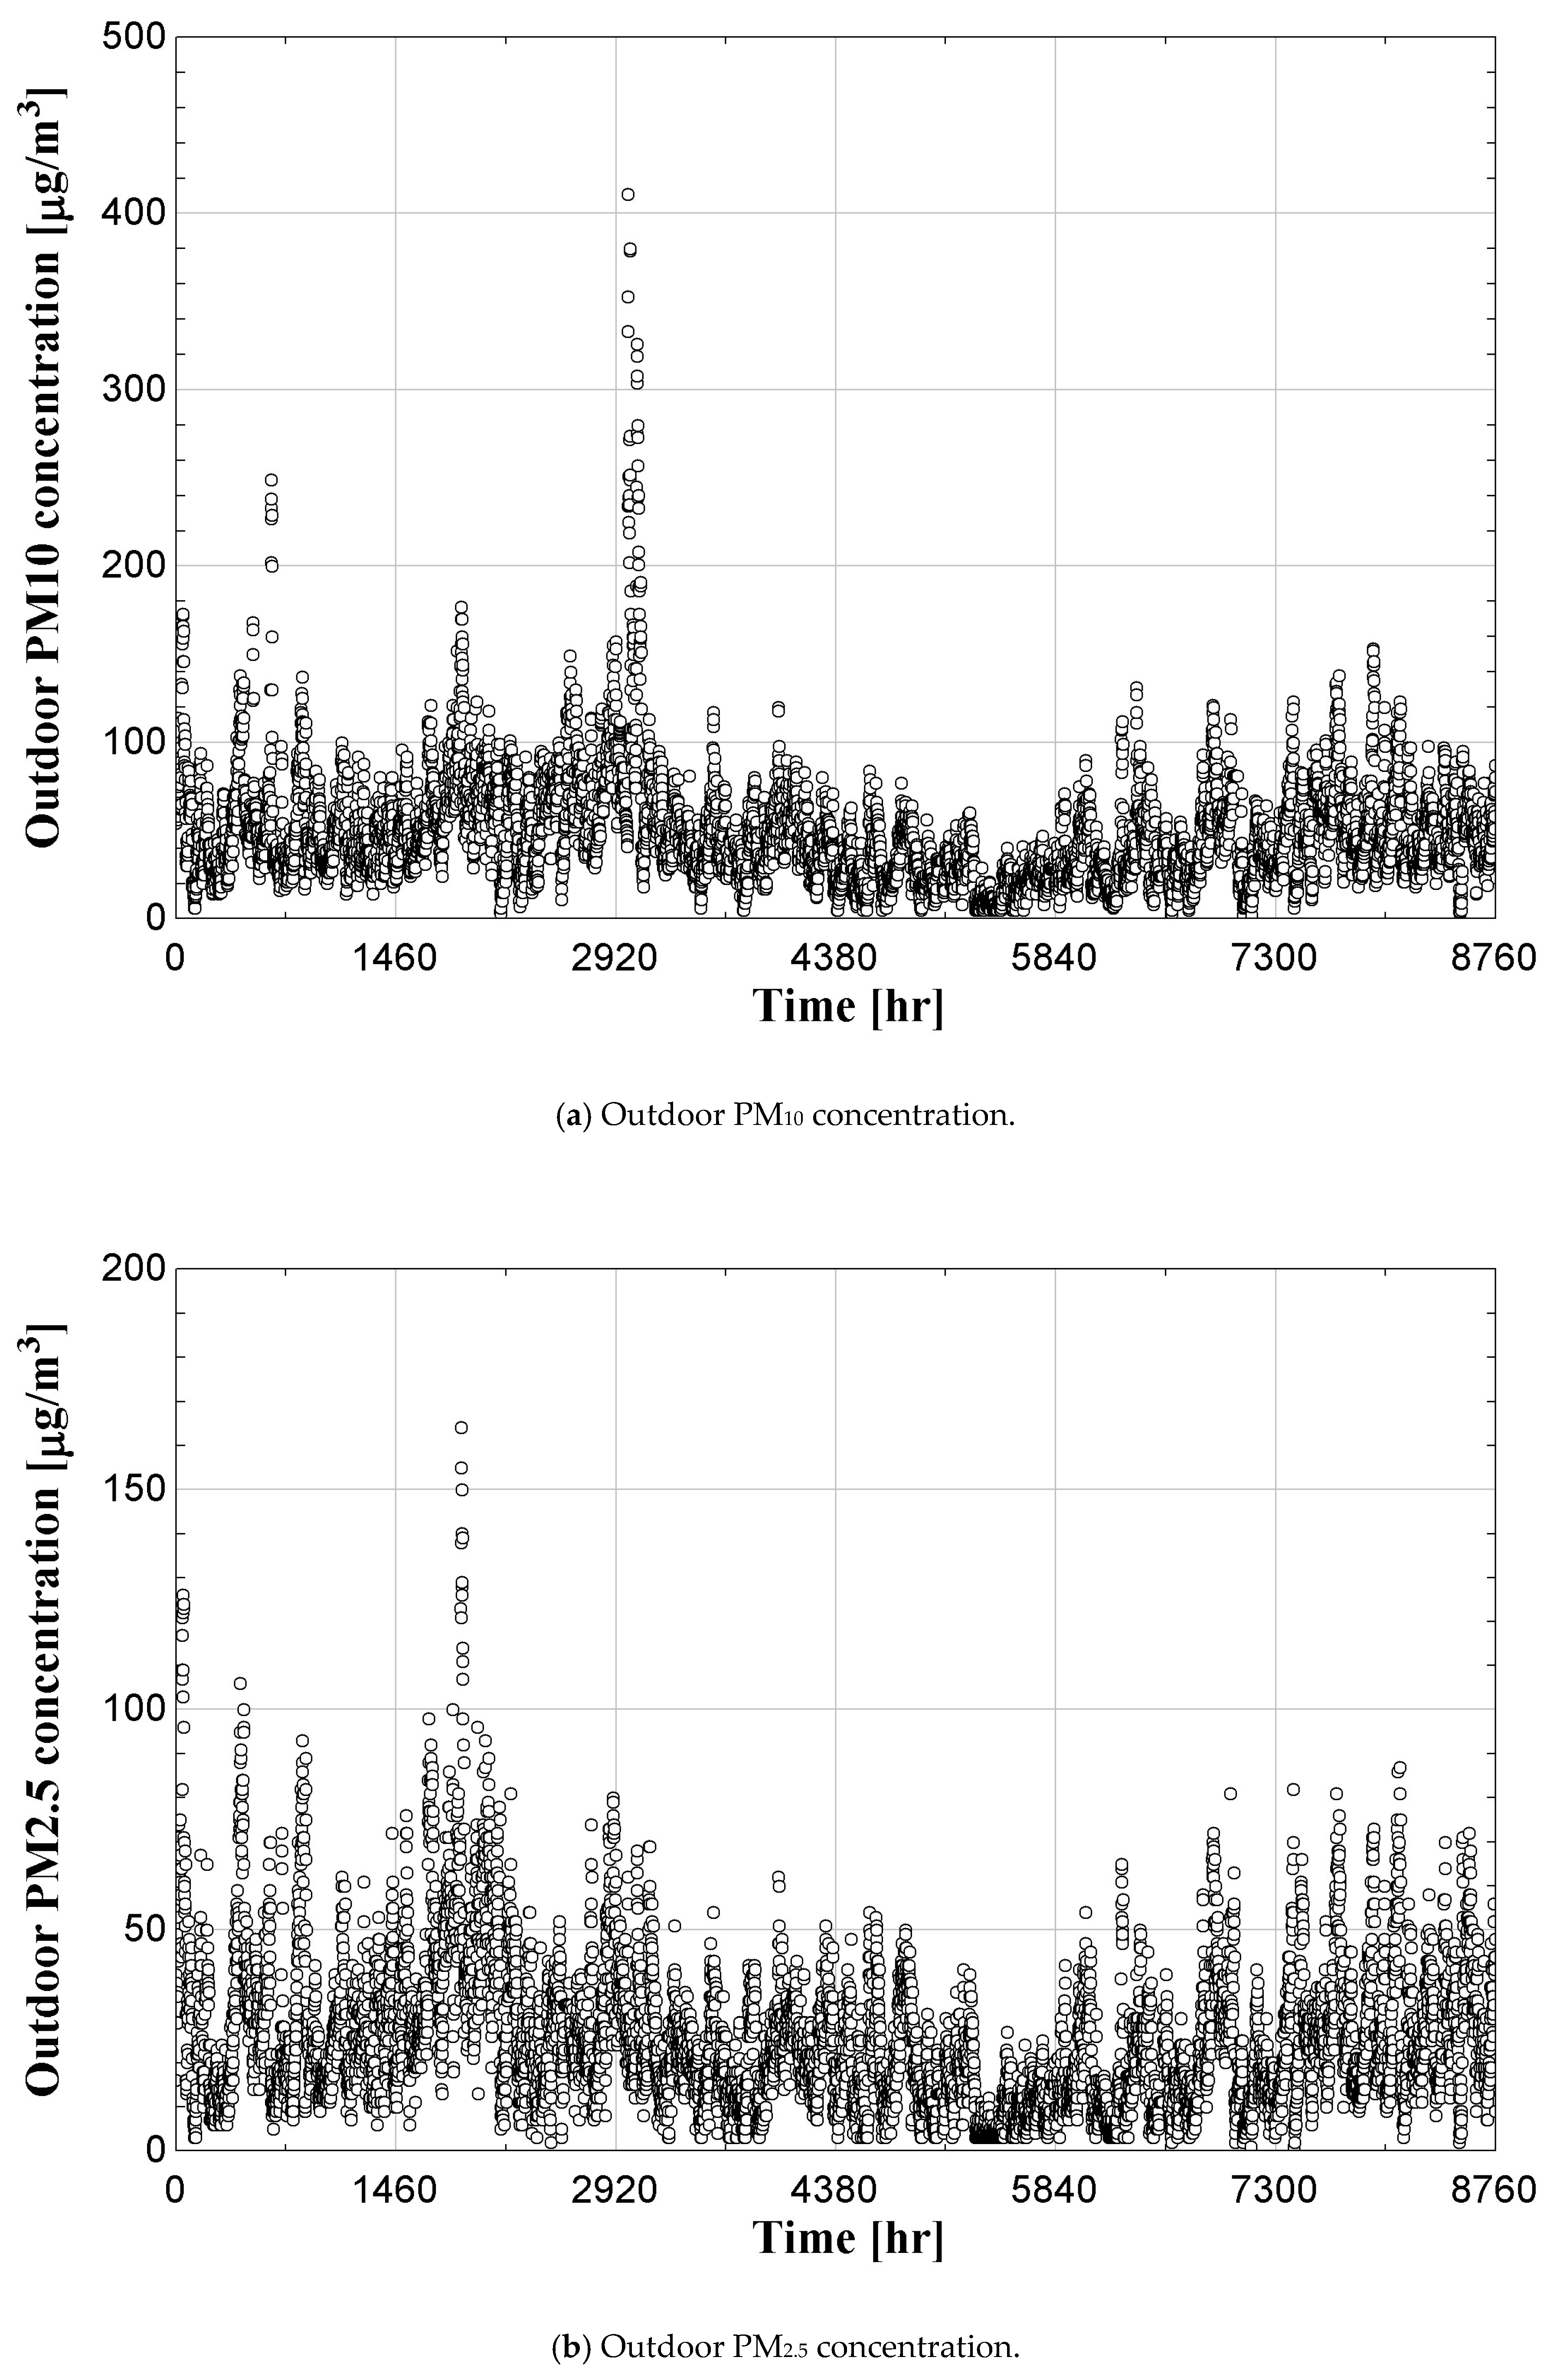
Figure 8.
Indoor CO2 concentration monthly box plot chart.

Figure 9.
Indoor CO2 accumulation chart.
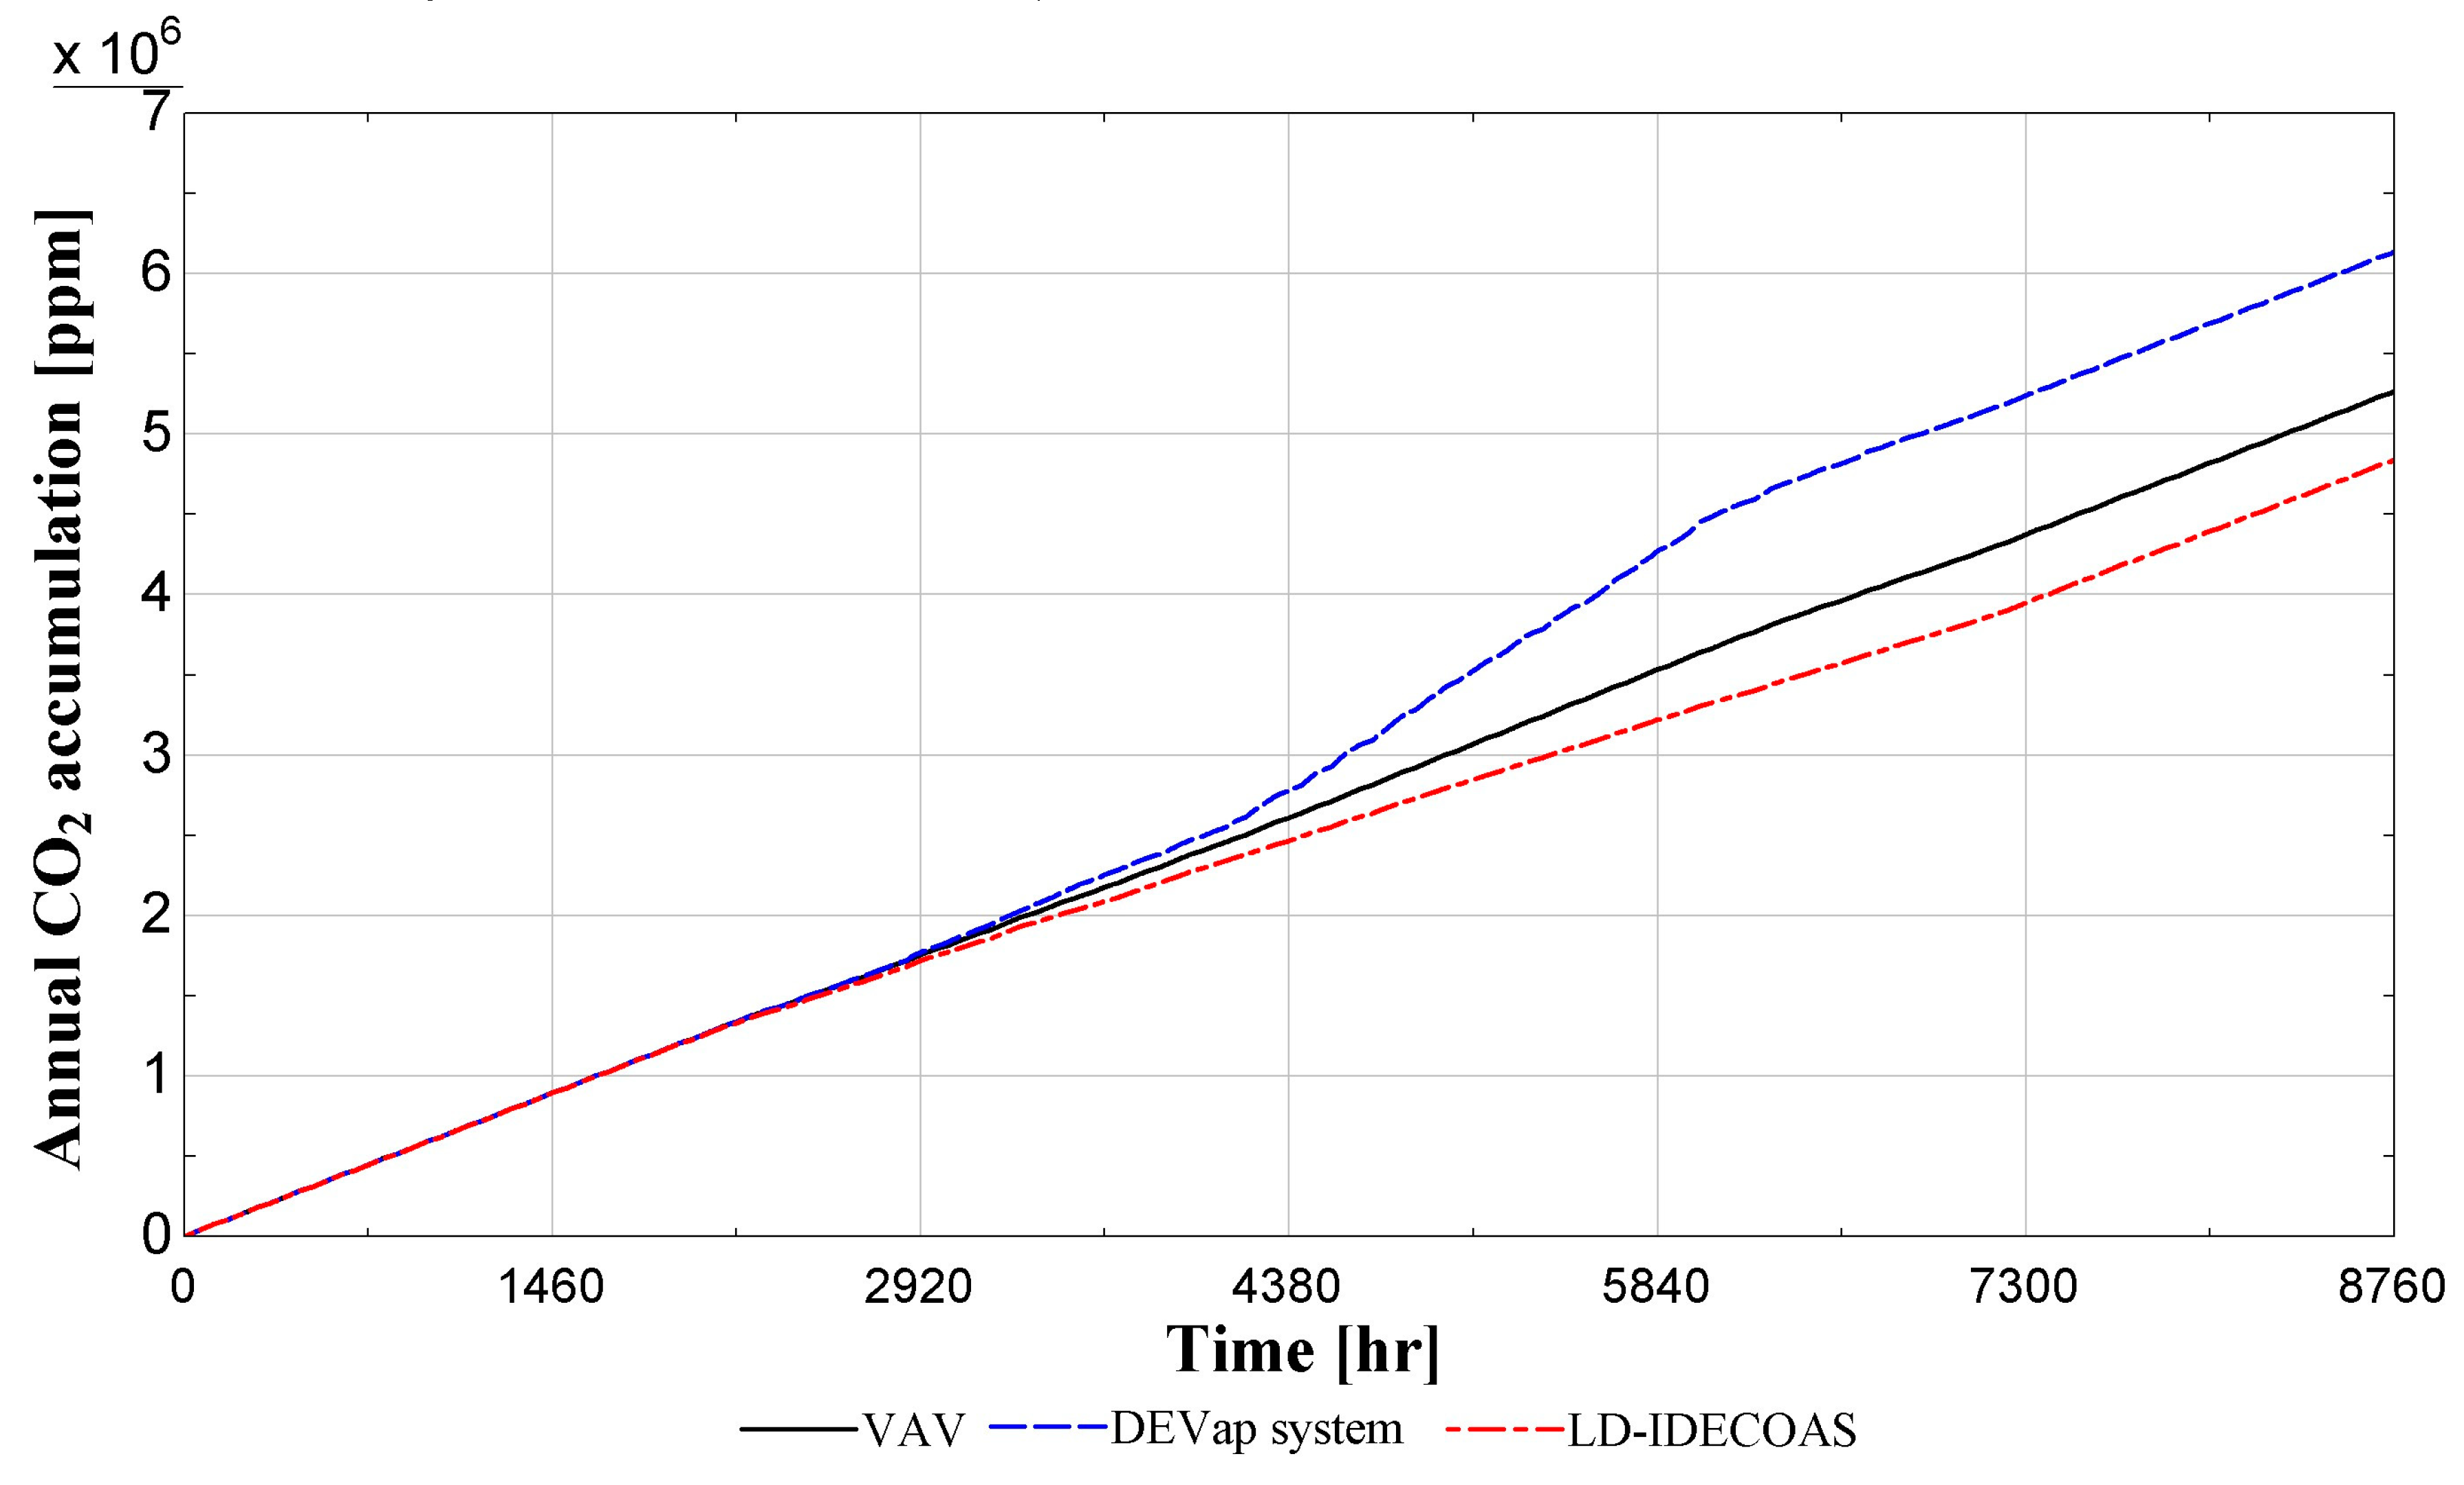
Figure 10.
Comparison of I/O ratio for the airborne particles.


Figure 11.
Annual accumulation curves for PM10 and PM2.5.

Table 1.
Physical conditions of the model office space.
| Site | Seoul, South Korea | ||
|---|---|---|---|
| Weather data | Seoul weather data | ||
| Building type | Open-plan office (20 m × 20 m × 3 m) | ||
| U-values [W/m2K] | Roof | 0.149 | |
| Wall | 0.252 | ||
| Floor | 0.297 | ||
| Windows (0.33 window/wall ratio) | 1.4 | ||
| Internal heat gain | Equipment | Light six W per floor area | |
| Occupants | Load | 115 W per person | |
| Room set point | Summer | Temperature Relative humidity | 26 °C 50% |
| Intermediate | Temperature Relative humidity | 24 °C 50% | |
| Winter | Temperature Relative humidity | 20 °C 30% | |
© 2019 by the authors. Licensee MDPI, Basel, Switzerland. This article is an open access article distributed under the terms and conditions of the Creative Commons Attribution (CC BY) license (http://creativecommons.org/licenses/by/4.0/).
Share and Cite
MDPI and ACS Style
Kim, B.-J.; Park, J.; Jeong, J.-W. Indoor Air Quality Enhancement Performance of Liquid Desiccant and Evaporative Cooling-Assisted Air Conditioning Systems. Sustainability 2019, 11, 1036. https://doi.org/10.3390/su11041036
AMA Style
Kim B-J, Park J, Jeong J-W. Indoor Air Quality Enhancement Performance of Liquid Desiccant and Evaporative Cooling-Assisted Air Conditioning Systems. Sustainability. 2019; 11(4):1036. https://doi.org/10.3390/su11041036
Chicago/Turabian StyleKim, Beom-Jun, Junseok Park, and Jae-Weon Jeong. 2019. "Indoor Air Quality Enhancement Performance of Liquid Desiccant and Evaporative Cooling-Assisted Air Conditioning Systems" Sustainability 11, no. 4: 1036. https://doi.org/10.3390/su11041036
Note that from the first issue of 2016, this journal uses article numbers instead of page numbers. See further details here.