Article

Effect of Freeze–Thaw Cycles on Phosphorus Fractions and Their Availability in Biochar-Amended Mollisols of Northeast China (Laboratory Experiment)

1
School of Forestry, Northeast Forestry University, 26 Hexing Road, Harbin 150040, China
2
Department of Forest Environment Protection, Kangwon National University, Chuncheon 24341, Korea
*
Authors to whom correspondence should be addressed.
Sustainability 2019, 11(4), 1006; https://doi.org/10.3390/su11041006
Submission received: 26 November 2018 / Revised: 19 January 2019 / Accepted: 12 February 2019 / Published: 15 February 2019

Abstract

:
Freeze–thaw cycles stimulate the release of available soil phosphorus (P) in winter, and biochar as a soil amendment could improve P availability. Nevertheless, it is unclear how freeze–thaw cycles and biochar amendment interact to affect the soil P fractions and their availability in winter, particularly under different soil water conditions. We simulateda freeze–thaw cycle experimentto assess the effects of three factors on soil P fractions: soil moisture content (22%, 31%, and 45%), frequencies of freeze–thaw cycles (0, 1, 3, 6, and 12 times) and biochar amendment (soil and biochar-amended soil). Modified Hedley sequential P fractionation was conducted to measure the soil P fractions. Increasing the number of freeze–thaw cycles increased soil labile P fractions in the soil with the lowest moisture content (22%). After biochar amendment, the content of labile P decreased as the number of freeze–thaw cycles increased. Biochar amendment enhanced P availability in Mollisols owing to the direct effect of NaOH-Po, which has a large direct path coefficient. Principal components analysis showed that moisture content was a major factor influencing the variation in the P fractions. The P fractions were separated by the interactive effects of biochar amendment and freeze–thaw cycles in soils with a higher moisture content (45%), indicating that the effects of freeze–thaw cycles on P availability appear to be more pronounced in biochar-amended Mollisols of higher water contents.

1. Introduction

As a limiting nutrient for crop growth, phosphorus (P) in soil plays a critical role in plant energy metabolism, biochemical processes, and energy transformation [1]. A suitable level of P bioavailability in soilcan sustain agricultural yields [2]. Although P, composed of inorganic and organic forms, is abundant in soils (the average P content of soil is approximately 0.05% (w/w)), only 0.1% of the total P is available to plants because it occurs mostly in insoluble forms [3]. As inorganic P (Pi) is largely the preferred source for plant P uptake and organic P (Po) acts as a sink of soil soluble P for the soil solution, knowledge of the different P fractions within soils is essential to understand P bioavailability [4,5]. The sequential extraction procedure developed by Hedley et al. [6] and adapted by Tiessen and Moir [7]and Cross and Schlesinger [8] has been efficient at obtaining various Pi and Po fractions differing in their availability to microorganisms and plants [5]. Sui et al. [9] modified the method of Hedley et al. [6]; they used H2O as the first extractant instead of equilibrating the soil sample with an anion-exchange resin to identify the P fractions in biosolid-amended Mollisols. This method has been widely applied in research on the effects of P fractions in manure-amended soil [10], organic and inorganic P-source-amended soil [11], and fertilized soil [12].
Mollisols, also called black soils, are mainly distributed in Northeast China and are considered one of the most important soil resources for crop production in China owing to their high fertility and superior physical and chemical characteristics [13,14]. However, long-term excessive and unsustainable agronomic practices have resulted in severe degradation in soil P availability during recent decades [15]. Meanwhile, transformation and movement of P in the Mollisol of northeast China are also affected by freeze–thaw cycles through the associated biochemical and physicochemical processes [16]. Although soil freeze–thaw cycles are a natural phenomenon at high latitudes, recent climate change has altered the frequency and intensity of freeze–thaw cycles during winter and early spring, mainly depending on regional climatic conditions and the thickness of the insulating snow cover [17,18]. Significant declines of snow cover due to warmer climate enhance soil frost in some regions [19], while in other regions climate change may decrease frost intensity and frequency as well as the duration of soil frost [17,20]. Repeated freeze–thaw cycles can stimulate P mineralization and extractability to change P fractions when damage to organisms and/or physical disruption of soil aggregates occur, which subsequently affects soil P availability [18,21,22,23]. Other mechanisms of the effects of freeze–thaw cycles on soil P fractions were related to microbial immobilization [24]. The dynamics of soil freezing and tha wing events, such as the frequency, temperature, and the rate, can influence soil nutrient turnover. The response of P fractions to freeze–thaw cycles among different soil types differ. Zhao et al. [18] reported that continuous freezing increases NaHCO3-extractable P, which further increases significantly following alternate freeze–thaw cycles in sandy soil. Conversely, a negative effect on sub-Arctic soil P availability owing to a decline in available P and microbial P during freeze–thaw cycles was demonstrated by Sjursen et al. [25]. Moreover, the inconsistent phenomenon suggests that further research is required to clarify the effect of freeze–thaw cycles on P availability in black soils.
Biochar is a product of either thermal pyrolysis or gasification, and it is created by heating carbon-rich biomass (feedstock) with limited or no air [26]. As biochar amendment can improve soil P availability mediated by changes in soil properties, such as soil pH, moisture retention, and soil microbial biomass and activity [3], biochar is proposed as a good soil-amendment for improving soil productivity and fertility. In addition, biochar alters soil surface chemistry owing to its large surface area and high negative surface charge and, therefore, affects P distribution in soils [27]. Previous studies on biochar amendment predominantly concentrated on soil nutrient availability and crop productivity during the growing period, without considering the effects of biochar amendment on the P fractions after freeze–thaw cycles [28,29,30]. This suggests that clarifying the response of P fractions to biochar amendment during freeze–thaw cyclesis essential for sustainable agricultural development in black soil regions.
In this study, a freeze–thaw experiment was simulated in a laboratory to investigate the effect of freeze–thaw cycles on P fractions in biochar-amended black soil. The objectives of this study were as follows: (i) identify the change in the black soil P fractions’ response to the biochar amendment and freeze–thaw cycles; and (ii) reveal the interactive effects between different freeze–thaw cycles and soil moisture conditions on P availability after biochar amendment.

2. Materials and Methods

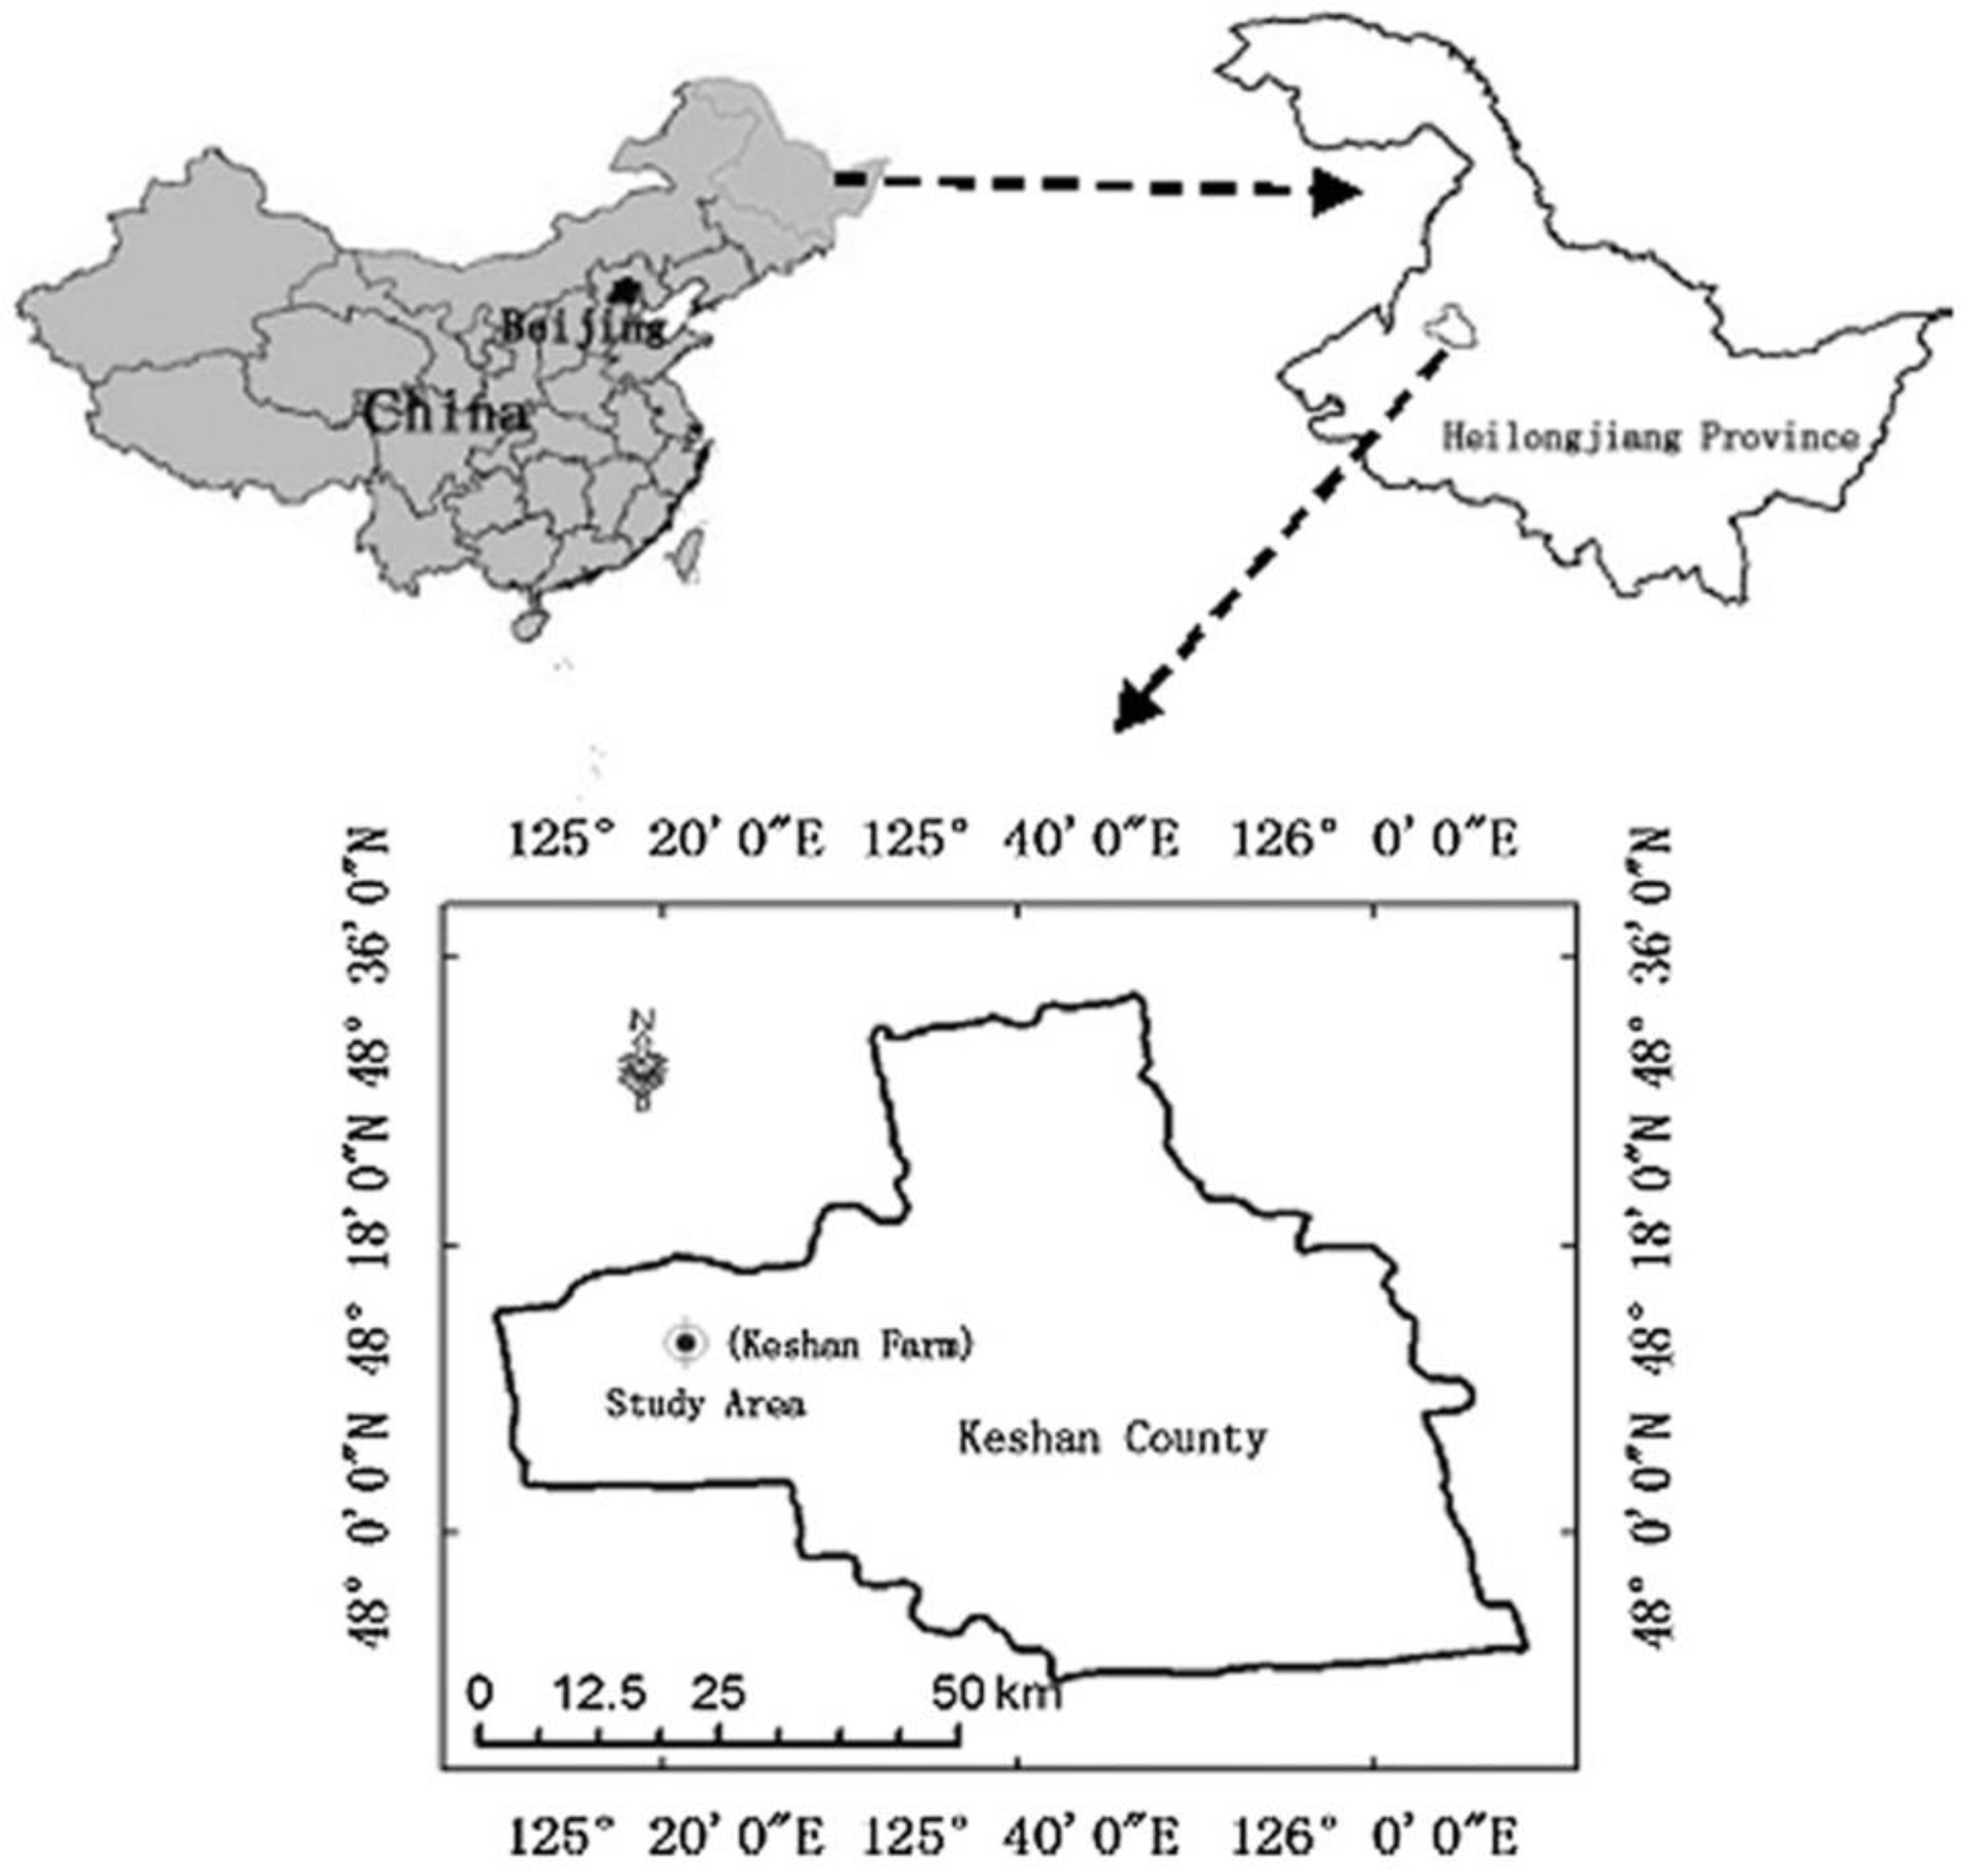
2.1. Soil Sampling and BiocharPreparation

The study was conducted at Keshan Farm in the black soil region of northeast China. The site location ranges from approximately N48°12′ to N48°23′ latitude and from E125°08′ to E125°37′ longitude (Figure 1) [31]. Soil in the study area is a typical black soil that was classified as a Mollisol with a clayey, loamy texture (i.e., 45% clay, 33% silt, and 22% sand). This area was chosen because the soil type and tillage practices are representative of intensive soybean production in the region. Soil in this area is frozen from early November and is thawed from early April to the middle of June. The mean annual maximum frozen soil depth is 2.5 m. The properties of the soil sample were as follows; bulk density atadepth of 0 to 10 cm (1.1 g cm−3), pH (5.8), soil organic carbon (51 g·kg−1), total phosphorus (0.86 g·kg−1), total nitrogen (3 g·kg−1), available phosphorus (43 mg·kg−1), and available nitrogen (120 mg·kg−1). Soil samples were collected at a depth of 10 cm from five randomly assigned points in the study site. The collected samples were then air-dried in the shade and sieved through a 2-mm mesh. Subsequently, the sieved soil was homogenized and stored at room temperature until the incubation experiment.
The biocharused in this study was produced from soybean straw pyrolyzed at 500 °C under anaerobic conditions. The temperature was increased at a rate of approximately 13 °C·min−1 and maintained at 500 °C for 2 h. The furnace was naturally cooled to 25 °C. The biochar was ground, passed through a 0.15-mm sieve, and mixed thoroughly before application. The organic carbon, total phosphorus, and total nitrogen of the biochar were 169 g·kg−1, 1.5 g·kg−1, and 6.4 g·kg−1, respectively, and its pH was 7.8. The available phosphorus and nitrogen contents of the biochar were 79 mg·kg−1 and 156 mg·kg−1, respectively.

2.2. Experimental Design

An incubation experiment was conducted in 500 cm3 plastic cups containing 400 g of soil and uniformly added biochar at a proportion of 4% [13]. Biochar-amended soil (B)samples were adjusted to 70% of the soil field capacity equal to the study area, and incubated at 25 °C for 60 d. Water content was maintained by adding deionized water every 2 d based on weight loss. Soil samples without bio-charamendment were incubated simultaneously as controls(S) in the same conditions. After incubation, soils (S) and biochar-amended soils (B) were divided into three equal groups to adjust the moisture content to 22% (M1), 31% (M2), and 45% (M3), which represent half of the saturated moisture content (22%), natural moisture content (31%), and saturated moisture content (45%), respectively, in this study site. To stabilize the moisture content, soil samples for moisture content treatments were pre-incubated at 5 °C for 3 d. There after, each different moisture content soil sample was separated and subjected to five different freeze–thaw cyclefrequencies:0 (FT0), 1 (FT1), 3 (FT3), 6 (FT6), and 12 (FT12). Each freeze–thaw cycle consisted of a 12-h freezing period at −10 °C, followed by 12-h thawing at 5 °C. The unfrozen soil sample (FT0) corresponding to each different moisture content treatment was maintained at 5 °C during the experimental period. Therefore, a total number of 30 treatment combinations (i.e., a factorial 3 × 5 × 2: three kinds of soil moisture content, five frequencies of freeze–thaw cycles, soil and biochar-amended soil), were performed with four replicates in this study. Once all the treatments were completed, four replicated soil samples of each treatment were mixed normally to determine soil phosphorus fractions and available P.

2.3. Soil Phosphorus Fractionation

Sequential P fractionation based on Sui et al. [9] was used in this study to investigate the change in available P fractions that were removed on the basis of increasing chemical stability with different labile P fractions. A uniformed 0.5 g soil sample, taken from four well-mixed replicated soil samples of each treatment, was extracted sequentially with deionized water followed by the addition of 0.5 M NaHCO3 (pH = 8.2), 0.1 M NaOH, and 1 M HCl and shaken for 16 h after each addition. Finally, residual-P (Res-P) was digested with H2SO4–H2O2. The NaHCO3, NaOH, and HCl extracts were divided into two aliquots to measure TP and Pi. The P amount determined before digestion with H2SO4–H2O2 was only Pi. Oxidation by H2SO4–H2O2 liberated Po, and the determined P was TP. Po was calculated as the difference between TP and Pi [8,9,32]. The available P (Pa) in soil was extracted with 0.03 M NH4F and 0.025 M HCl and measured using the molybdenum blue method [33]. The determination of P fractions and Pa was conducted with four replications.
The H2O-Pi fraction is the most effective Pi form for plant growth [34]. NaHCO3-P (Pi and Po) are considered labile P pools, which include some microbial P, and are weakly sorbed on the surface of iron (Fe) and aluminum (Al) oxides P. The NaOH-P containing secondary Pi, which is bound to Fe and Al compounds and clay edges, and Po is associated with humic and fulvic acids; it is considered moderately labile P [35]. The HCl-P (Pi and Po) is associated with calcium (Ca) and is considered a stable form of P. Res-P is the most chemically stable Pi form covered by sesquioxides [34]. Labile P included H2O-P, NaHCO3-Pi, and NaHCO3-Po fractions. Pi is the sum of H2O-Pi, NaHCO3-Pi, NaOH-Pi, HCl-Pi, and Res-P. Po is the sum of NaHCO3-Po, NaOH-Po, and HCl-Po.

2.4. Statistical Analysis

A multiple ANOVA, conducted with SPSS’s General Linear Model (GLM, Fixed Factors) was used to compare the interaction between biochar amendment, freeze–thaw cycles, and soil moisture content on each P fraction, and the content of Pi and Po. Significant differences in the same species of P fractions, inorganic and organic P fractions of biochar amendment, freeze–thaw cycles, and moisture content treatment were identified using a one-way analysis of variance (ANOVA) technique followed by Least Significant Difference (LSD) multiple range tests. Principal components analysis (PCA) was applied to the data on P fractions to identify overall trends in P fractions as affected by freeze–thaw cycles and biochar amendment. To perform PCA, the variables were standardized to zero mean and unit variance, and the analysis was performed on the correlation matrix. The applicability of the PCA to the data sets used in this study was verified through the application of Bartlett’s sphericity test [36]. Varimax rotation was conducted to retain and rotate the first two components, whereby the variance in each variable was redistributed so that each contributed strongly to one of the components and weakly to the others [37]. The path analysis was used to examine the causal path of P fractions to the available P(Pa) on biochar amendment. To apply path analysis, all the data were subjected to normality tests. Direct and indirect effects in the path analysis were derived from multiple linear regressions of P fractions on the Pa, and simple correlation coefficients between Pi fractions. The direct effects of P fractions on the Pa were denoted path coefficients and were taken as standardized partial regression coefficients for each of the soil P fractions in the multiple linear regressions against the Pa [38]. Indirect effects of P fractions on the Pa occurred from the product of the simple correlation coefficient between soil P fractions and the path coefficient. The correlation between Pa and individual P fractions was the sum of the entire path connecting two variables [39]. All statistical analyses were performed with SPSS 22.0 (IBM Institute, Armonk, NC, USA) with a significance threshold of p < 0.05.

3. Result

3.1. Interaction of Moisture Content and Freeze–Thaw Cycles on Soil and Biochar-Amended Soil Phosphorus Fractions

When the P fraction data were analyzed using a multiple ANOVA approach, a significant effect of moisture content, biochar amendment, freeze–thaw cycles and both of their interactions on each labile fraction, NaOH-Po, Po, and Pa are shown in Table 1. Regardless of the large differences among other fractions, these were influenced by freeze–thaw cycles, interactions between freeze–thaw cycles and moisture content, and interactions between TrT, FT, and M.

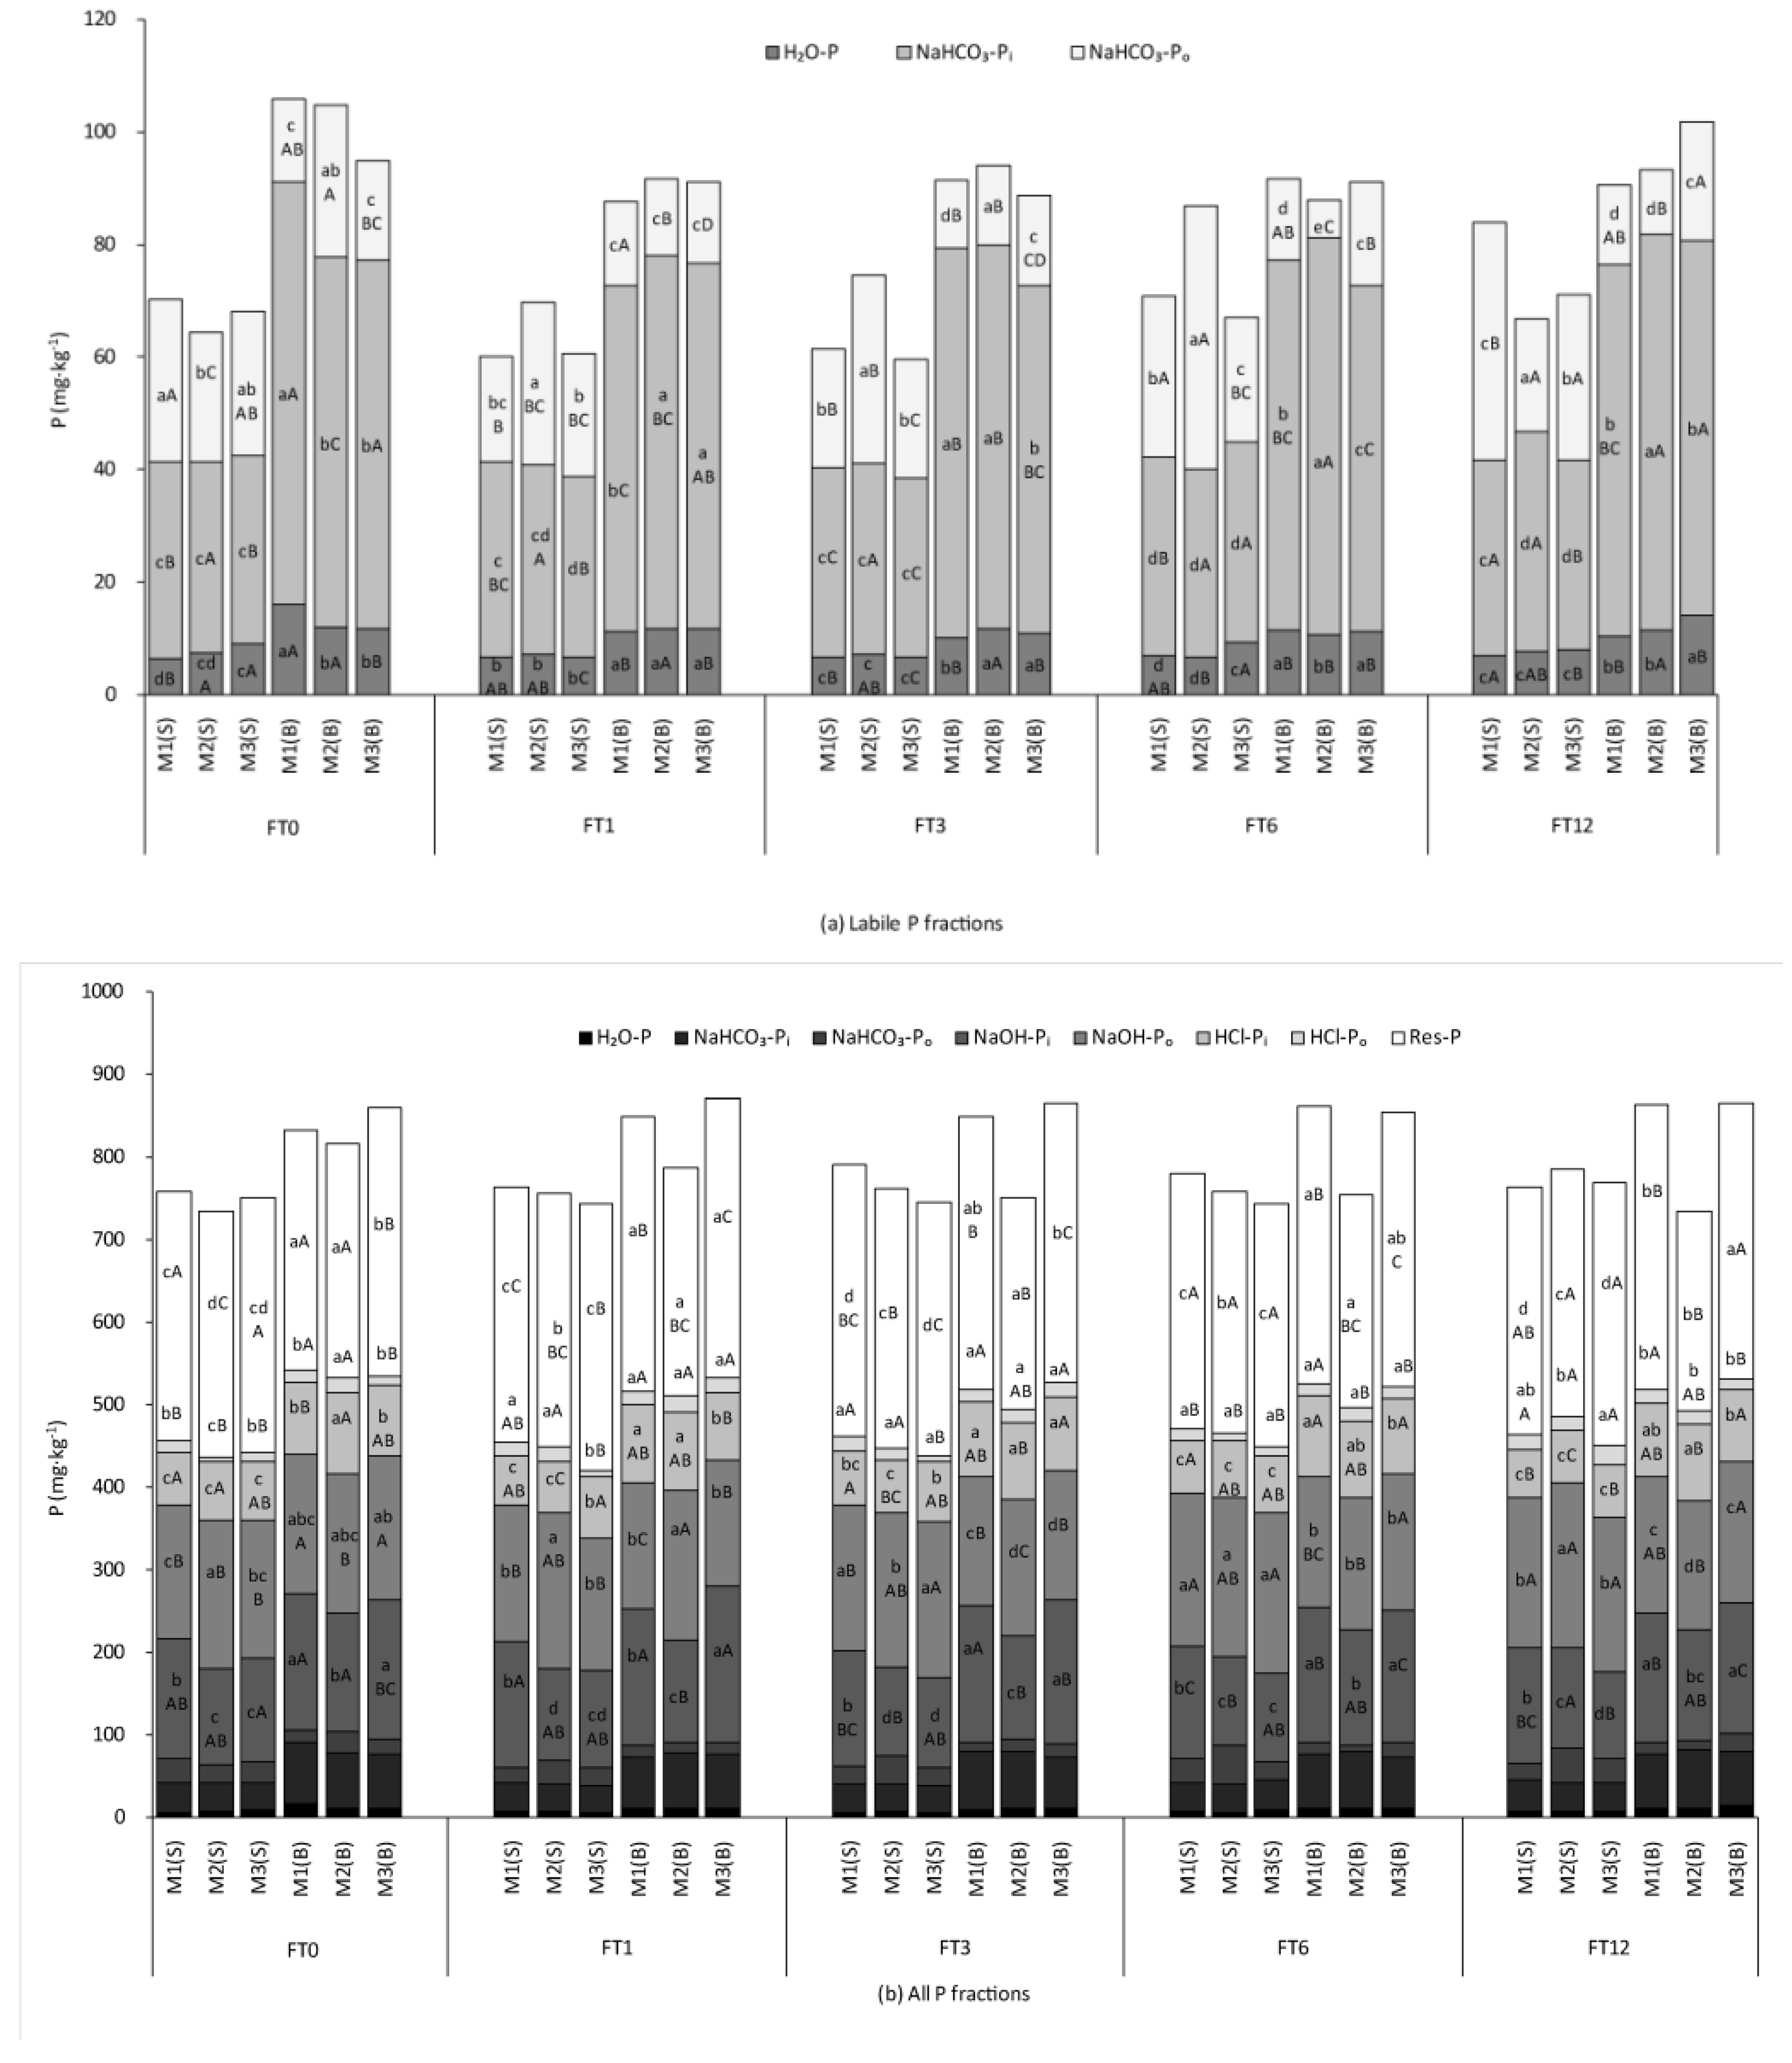
3.1.1. Soil Phosphorus Fractions

The distribution of different P fractions obtained from the sequential extraction of P is presented in Figure 2. The most significant difference between biochar amendment, freeze–thaw cycles, and moisture content treatment is evident in the labile P fractions (Figure 2a). The ranges of labile P fractions in soil and biochar-amended soil were 60to 87 mg·kg−1 and 88 to 106 mg·kg−1, respectively. For the labile P fractions, the contents of H2O-P and NaHCO3-Pi were twice as high in biochar-amended soil than in soil. With an increasing frequency of freeze–thaw cycles, the H2O-P and NaHCO3-Pi in soil and biochar-amended soil in M2 and M3 were generally raised, while M1 showed a decrease after biochar amendment. An average of 27% of total P was in the NaHCO3-Po in soil, and lower percent (15%) of NaHCO3-Po was observed in biochar-amended soil. During freeze–thaw cycles treatment, the content of NaHCO3-Po in M2 and M3 was more sensitive than M1in biochar-amended soil. Applying the soil P fractions to all the treatments, P was mainly found under the moderate labile NaOH-P (Pi and Po) fractions, ranging between 277 mg·kg−1 and 344 mg·kg−1. The ranges of NaOH-Pi in soil and biochar-amended soil were 108 to 153 mg·kg−1, and 123 to 189 mg·kg−1, respectively. Although higher NaOH-Pi content of M1 and M3 in biochar-amended soils was shown, no significant differences were found between the frequencies of freeze–thaw cycles. Similar to NaHCO3-Po, the average NaOH-Po contents of biochar-amended soil (163 mg·kg−1) was lower than soil (181 mg·kg−1). The HCl-Pi fraction associated with the carbonate fraction is averaged at 66 mg·kg−1 and 91 mg·kg−1 in soil and biochar-amended soil, respectively.

3.1.2. Inorganic and Organic Phosphorus Contents

Higher content of Pi was observed for biochar-amended soil with average values of 78% for M1,74% for M2, and 77% for M3 of total P, as compared with 72% for M1,69% for M2, and 71% for MC3 in soil, proving that biochar amendment increased Pi content in soil (Table 2). Unlike Pi, biochar amendment reduced the content in Po, which showed average values of22% for M1, 26% for M2, and 23% for M3 of total P as compared with 28% for M1, 31% for M2, and 29% for M3 in the soil.

3.2. Effects of BiocharAmendment on Soil Phosphorus Availability

To evaluate the effects of biochar amendment on soil P availability, a path analysis was conducted to analyze the relationship between the individual Pi fractions, and evaluate the significance of its direct and indirect effects on Pa in Table 3. Backward-stepwise regression was used to identify the P fractions that explained most of the variation in Pa. Before biochar was amended to the soil, The NaOH-Pi, NaHCO3-Po, and HCl-Pi directly affected Pa, and the highest contribution of NaOH-Pi in direct effects was shown, followed by NaHCO3-Po and HCl-Pi. Moreover, analysis of the indirect effects indicated that the indirect path coefficients of NaHCO3-Po on the Pa via NaOH-Pi were relatively higher than via HCl-Pi. Soil NaHCO3-Po has a large direct coefficient, and the indirect path coefficient of NaOH-Pi via NaHCO3-Po was larger than that via HCl-Pi fractions. Soil HCl-Pi only had a large direct path coefficient, which suggested that it mainly affected Pa through a direct path. After biochar amendment, change in the effects on soil P availability showed that HCl-Pi and NaOH-Po had a direct effect on soil P availability.

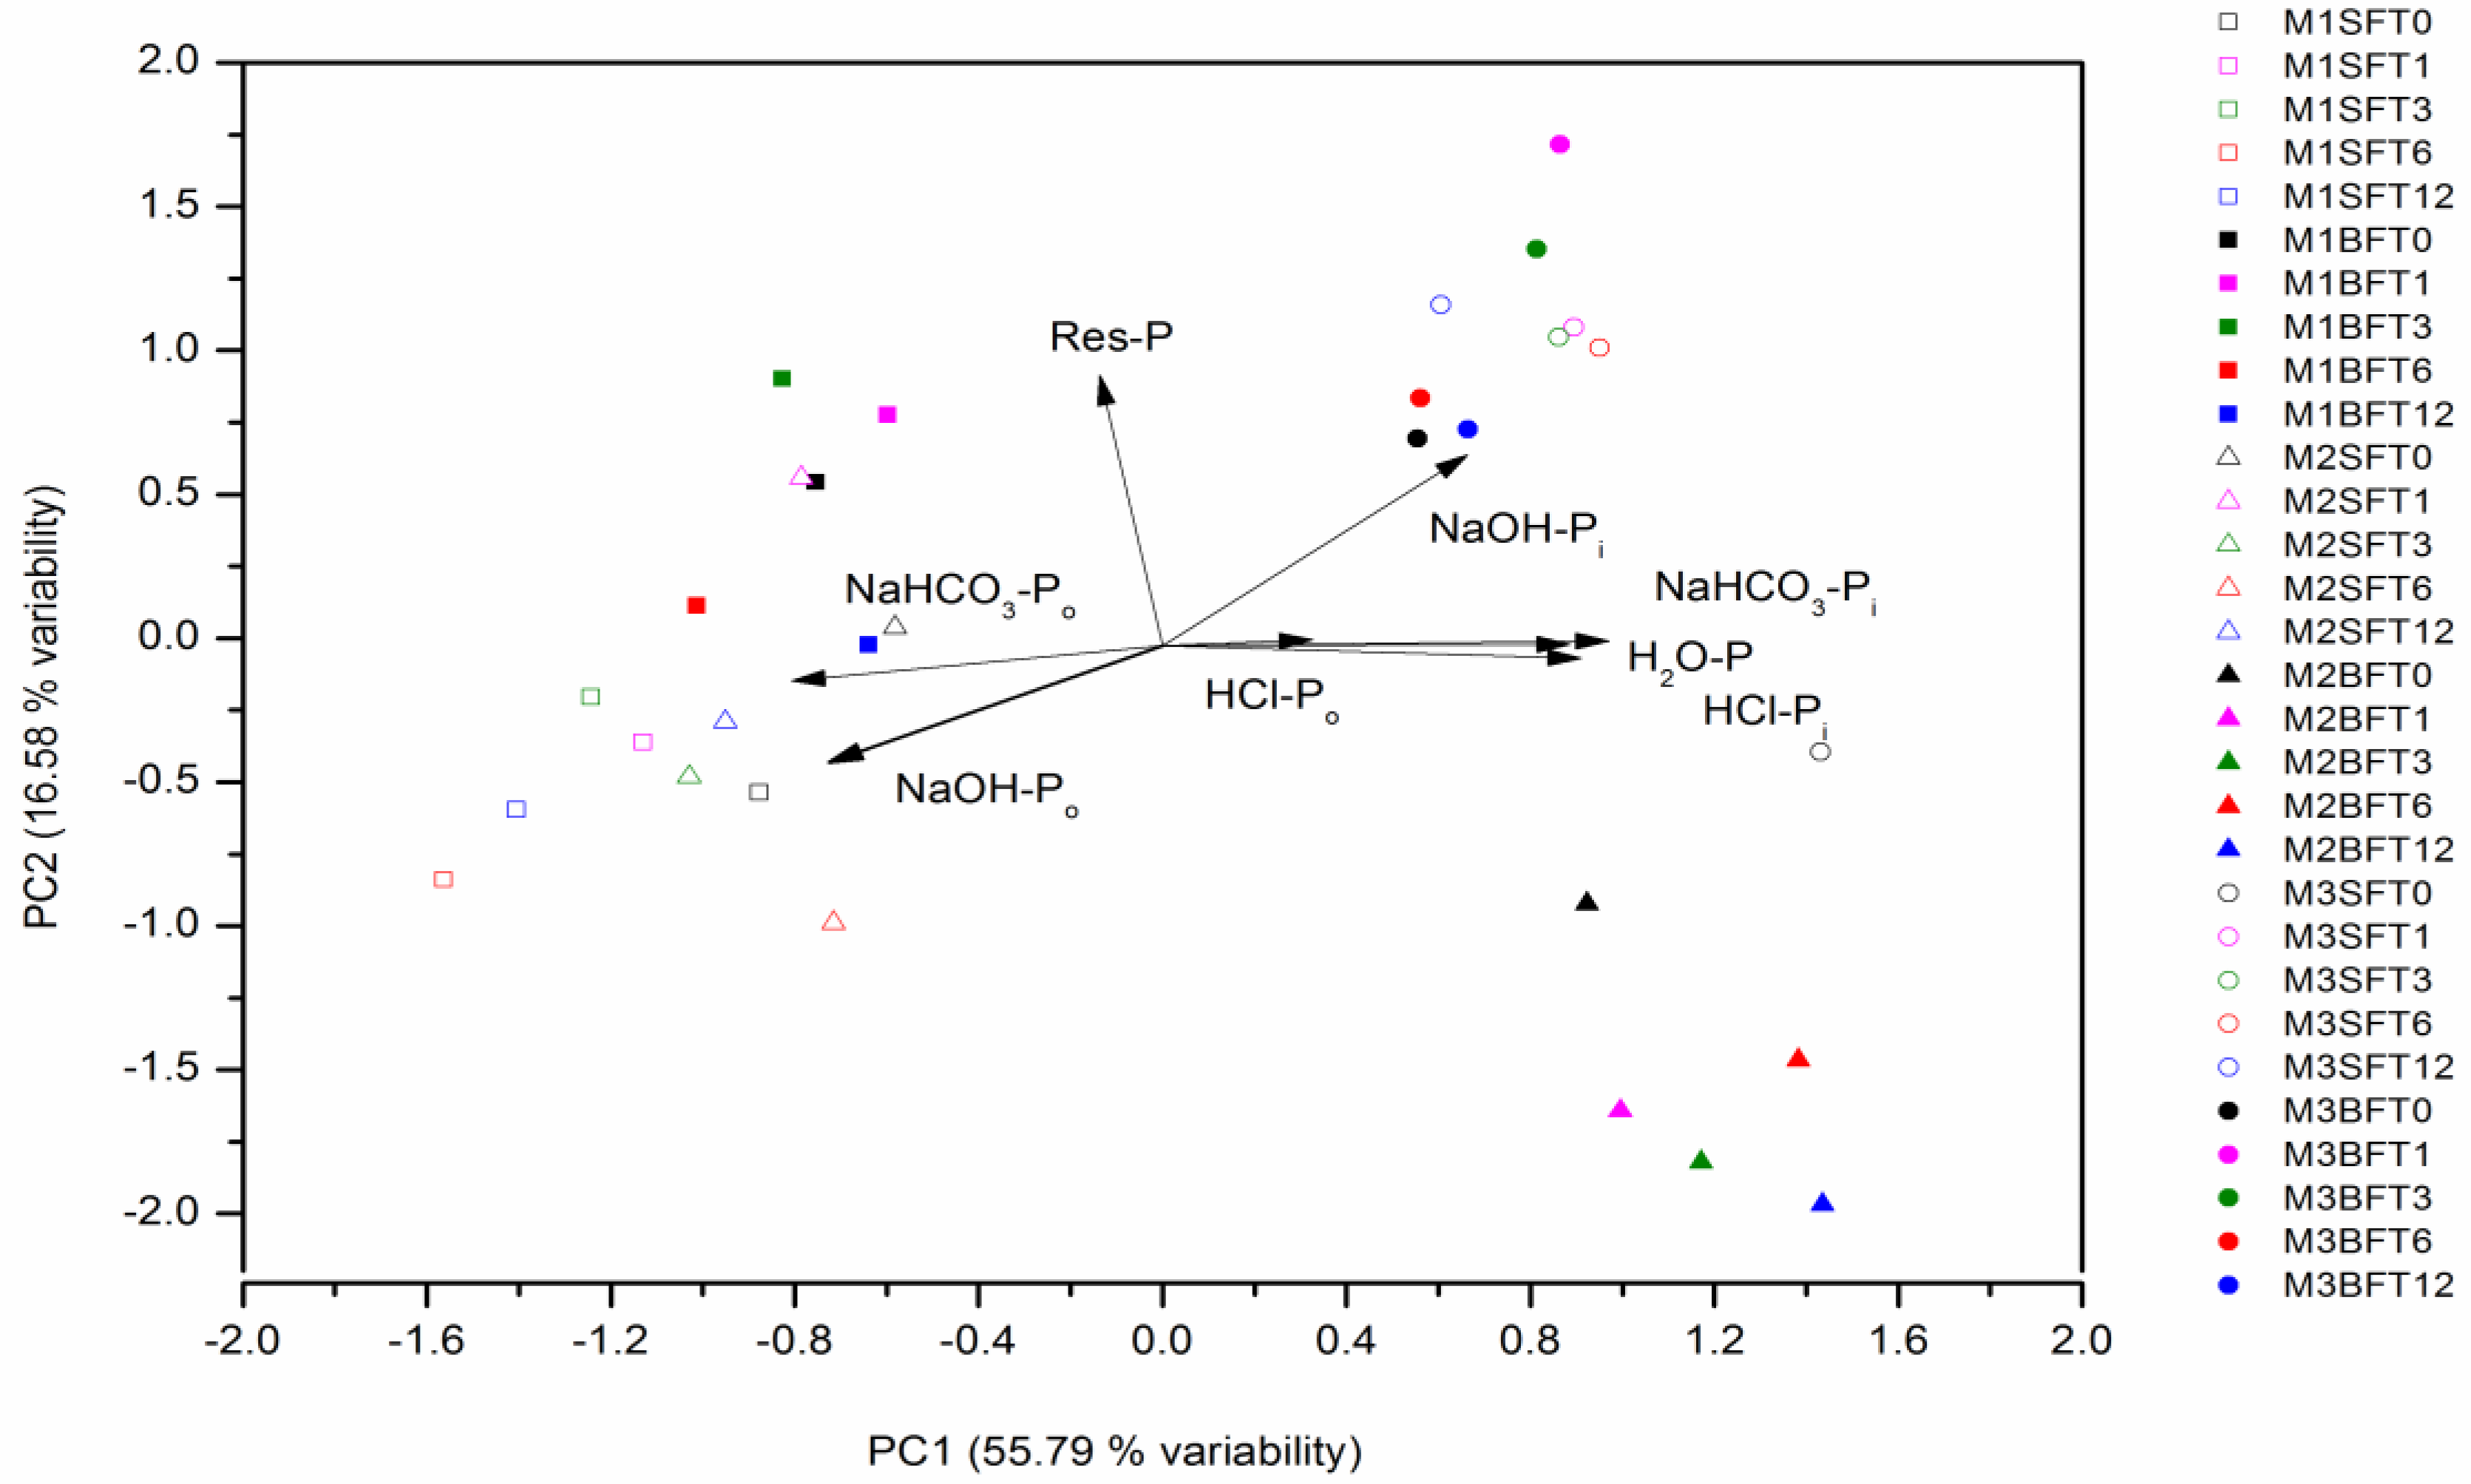
3.3. Factors Affecting Phosphorus Fractions in Mollisols

A principal component analysis (PCA) was used to separate the treatments based on their P chemistry, and much of the variability in soil data matrices could be explained by PCs (Figure 3). The PCA results revealed that all the soil samples were clearly separated along the two components (PC1 and PC2). The P fractions of H2O-P, NaHCO3-Pi, NaHCO3-Po, NaOH-Pi, NaOH-Po, and HCl-Pi were highly correlated with PC1 (55.79%), whereas NaOH-Pi and Res-P were highly correlated with PC2 (16.58%). The PCA showed that samples were mainly grouped closely by moisture content treatment, indicating that moisture content was the main drive factor in these variations of the P fractions. The M1S and M1SFT differed from M1B and M1BFT along PC1, indicating that biochar amendment could strongly affect the P fractions at M1, regardless of the freeze–thaw cycles treatment. The biochar amendment did not distinctly change the P fractions in M2. The M3S apart from M3SFT, M3B, and M3BFT implied that the effect of biochar amendment and freeze–thaw cycles stimulated changes in the P fractions in M3.

4. Discussion

4.1. Effects of Freeze–Thaw Cycles and Moisture Content on Phosphorus Fractions

Soil P fractions were strongly controlled by a combination of physical, chemical, and biological reactions, as reported by Shi et al. [40]. Significant changes in P fractions induced by freeze–thaw cycles and moisture content are shown in Figure 2 and Table 1, in which the changes of P appear to be more pronounced in soils of higher moisture content (Figure 3). Similar to Perrott et al. [41] and Fabre et al. [42], increasing labile P fractions was shown in this study. However, Xu et al. [43] studied mineral soils in China and found that multiple rounds of freezing decrease the concentration of P in soil solutions. Some studies mainly attributed the changes in labile P to higher organic matter content that originated from the release of microbial compounds by lysis or from the damage of microbial cells on freeze–thaw cycles [43]. This organic matter served as a direct source of labile P in soil or enabled recalcitrant nutrient transformation into a more labile nutrient pool, contributing to the flush of nutrient mineralization and solubilization [44]. In addition, soil aggregate stability decreased with repeated freeze–thaw cycles, and such a disturbance could increase the Fe-bound P release, which was adsorbed, by low bonding energy, to the surface of ion Fe [45,46]. Higher moisture content had a more pronounced effect on labile P fractions because the disruption of soil aggregates were intensified owing to soil freeze–thaw cycles [47] and stimulated the release of labile P. This is similar to the findings of Xie and Gao [48], from their research on the effect of freeze–thaw cycles on P availability in alpine meadows. The change in HCl-P and NaOH-P after freeze–thaw cycles and moisture content treatment could also be explained by the higher organic matter content [40].

4.2. Phosphorus Fractionsand Availability Response to Freeze–ThawCycles and Moisture Content in Biochar-Amended Mollisols

The change in P fractions and enhanced P availability after freeze–thaw cycles and moisture content treatment were mainly the result of the direct effect of biochar amendment and the interaction between these three treatments. In our study, distinct changes in the labile-P, NaOH-P, HCl-P, and Pa were observed, which corresponds to the results reported in Eduah et al. [27]. The Resin-P, NaHCO3-Pi, and HCl-Pi of soils were found to increase significantly upon biochar amendment, making P available for plant uptake. This is consistent with the findings of other studies where in bio-charamendmentim proved soil P availability [49]. First, higher contents of NaOH-P and HCl-P [32], mineral P [50], and Pa [3] in biochar itself had direct effects on P fractions and availability. Second, suitable soil conditions, which mobilize the associated microbial activity, were built after biochar application [51]. The macropores (>200 nm) of biochar could serve as habitats for soil microorganisms, such as bacteria, fungi, and protozoa, and prevented them from being disturbed by the freeze–thaw cycles process [52]. Therefore, in conjunction with freeze–thaw cycles and moisture content, biochar amendment improved mineralization of organic P [51]. This could explain the changes in Pi and Po in Table 2. Third, changes of NaOH-P and HCl-P in biochar-amended soil could be attributed to increasing soil pH. When the pH of soil increased, higher contents of exchangeable Ca significantly affected P fractions because of Ca precipitation [53,54]. This is in agreement with our results from the pathway analysis, which showed that the HCl-Pi negatively affects soil P availability and NaOH-Po enhances P availability in biochar-amended Mollisols.

5. Conclusions

In conclusion, the content of labile P fractions and Pi in biochar-amended soils was higher than in soils before they were subjected to freeze–thaw cycles, indicating that biochar amendment enhances P availability before freeze–thaw cycles. Before biochar amendment, the increasing number of freeze–thaw cycles could increase the content of labile P fractions. However, there were no significant changes in inorganic P. After biochar amendment, both the content of labile P fractions and Pi increased, but the labile P fractions decreased with increasing frequency of freeze–thaw cycles. This revealed that biochar amendment enhances P availability after freeze–thaw cycles. In conjunction with freeze–thaw cycles and moisture content treatments, the P fraction of NaOH-Po improves soil P availability in biochar-amended soil. The result of PCA showed that higher moisture content enhanced the effect of freeze–thaw cycles on P fractions of biochar-amended soil indicating that freeze–thaw cycles impact P availability of biochar-amended soil, particularly in arable black soil with a higher water content.

Author Contributions

All authors contributed to the intellectual content of this paper. Y.H. wrote the manuscript; X.C. and B.C. offered many suggestions and revised the manuscript. All authors have read and approved the final manuscript.

Funding

This work was supported by the Fundamental Research Funds for the Central Universities under Grant (No. 2572016AA35); the National Natural Science Foundation of China under Grant (No. 41271293 and No. 41302222).

Conflicts of Interest

The authors declare no conflict of interest.

References

  1. Raghothama, K.G.; Karthikeyan, A.S. Phosphate acquisition. Plant Soil 2005, 274, 37. [Google Scholar] [CrossRef]
  2. Soinne, H.; Peltovuori, T. Extractability of slurry and fertilizer phosphorus in soil after repeated freezing. Argric. Food Sci. 2005, 14, 181–188. [Google Scholar] [CrossRef]
  3. Liu, S.; Meng, J.; Jiang, L.; Yang, X.; Lan, Y.; Cheng, X.; Chen, W. Rice husk biochar impacts soil phosphorous availability, phosphatase activities and bacterial community characteristics in three different soil types. Appl. Soil Ecol. 2017, 116, 12–22. [Google Scholar] [CrossRef]
  4. Redel, Y.; Rubio, R.; Godoy, R.; Borie, F. Phosphorus fractions and phosphatase activity in an Andisol under different forest ecosystems. Geoderma 2008, 145, 216–221. [Google Scholar] [CrossRef]
  5. Pavinato, P.S.; Merlin, A.; Rosolem, C.A. Phosphorus fractions in Brazilian Cerrado soils as affected by tillage. Soil Till. Res. 2009, 105, 149–155. [Google Scholar] [CrossRef]
  6. Hedley, M.J.; Stewart, J.W.B.; Chauhan, B. Changes in inorganic and organic soil phosphorus fractions induced by cultivation practices and by laboratory incubations. Soil Sci. Soc. Am. J. 1982, 46, 970–976. [Google Scholar] [CrossRef]
  7. Tiessen, H.; Moir, J.O. Characterization of available P by sequential extraction. In Soil Sampling and Methods of Analysis; Carter, M.R., Ed.; CRC Press: Boca Raton, FL, USA, 1993; pp. 75–86. ISBN 0-87371-861-5. [Google Scholar]
  8. Cross, A.F.; Schlesinger, W.H. A literature review and evaluation of the Hedley fractionation: Applications to the biogeochemical cycle of soil phosphorus in natural ecosystems. Geoderma 1995, 64, 197–214. [Google Scholar] [CrossRef]
  9. Sui, Y.; Thompson, M.L.; Shang, C. Fractionation of phosphorus in a Mollisol amended with biosolids. Soil Sci. Soc. Am. J. 1999, 63, 1174–1180. [Google Scholar] [CrossRef]
  10. Hao, X.; Godlinski, F.; Chang, C. Distribution of phosphorus forms in soil following long-term continuous and discontinuous cattle manure applications. Soil Sci. Soc. Am. J. 2008, 72, 90–97. [Google Scholar] [CrossRef]
  11. Kashem, M.A.; Akinremi, O.O.; Racz, G.J. Phosphorus fractions in soil amended with organic and inorganic phosphorus sources. Can. J. Soil Sci. 2004, 84, 83–90. [Google Scholar] [CrossRef] [Green Version]
  12. Saleque, M.A.; Naher, U.A.; Islam, A.; Pathan, A.B.M.B.U.; Hossain, A.T.M.S.; Meisner, C.A. Inorganic and organic phosphorus fertilizer effects on the phosphorus fractionation in wetland rice soils. Soil Sci. Soc. Am. J. 2004, 68, 1635–1644. [Google Scholar] [CrossRef]
  13. Yao, Q.; Liu, J.; Yu, Z.; Li, Y.; Jin, J.; Liu, X.; Wang, G. Three years of biochar amendment alters soil physiochemical properties and fungal community composition in a black soil of northeast China. Soil Biol. Biochem. 2017, 110, 56–67. [Google Scholar] [CrossRef]
  14. Yao, Q.; Liu, J.; Yu, Z.; Li, Y.; Jin, J.; Liu, X.; Wang, G. Changes of bacterial community compositions after three years of biochar application in a black soil of northeast China. Appl. Soil Ecol. 2017, 113, 11–21. [Google Scholar] [CrossRef]
  15. Tang, X.; Li, Z.; Ma, Y.; Liang, Y. Mechanism of fulvic acid-and organic manure-mediated phosphorus mobilization in black soil at low temperature. Plant Nutr. Fert. Sci. 2012, 18, 893–899. [Google Scholar] [CrossRef]
  16. Yu, X.; Zou, Y.; Jiang, M.; Lu, X.; Wang, G. Response of soil constituents to freeze-thaw cycles in wetland soil solution. Soil Biol. Biochem. 2011, 43, 1308–1320. [Google Scholar] [CrossRef]
  17. Matzner, E.; Borken, W. Do freeze-thaw events enhance C and N losses from soils of different ecosystems? A review. Eur. J. Soil Sci. 2008, 59, 274–284. [Google Scholar] [CrossRef]
  18. Zhao, Q.; Zeng, D.H.; Fan, Z.P. Effects of freeze-thaw on soil nitrogen and phosphorus availability at the Keerqin Sandy Lands, China. J. For. Res. 2008, 19, 44–48. [Google Scholar] [CrossRef]
  19. Groffman, P.M.; Driscoll, C.T.; Fahey, T.J.; Hardy, J.P.; Fitzhugh, R.D.; Tierney, G.L. Colder soils in a warmer world: A snow manipulation study in a northern hardwood forest ecosystem. Biogeochemistry 2001, 56, 135–150. [Google Scholar] [CrossRef]
  20. Urakawa, R.; Shibata, H.; Kuroiwa, M.; Inagaki, Y.; Tateno, R.; Hishi, T.; Fukuzawa, K.; Hirai, K.; Toda, H.; Oyanagi, N.; et al. Effects of freeze–thaw cycles resulting from winter climate change on soil nitrogen cycling in ten temperate forest ecosystems throughout the Japanese archipelago. Soil Biol. Biochem. 2014, 74, 82–94. [Google Scholar] [CrossRef]
  21. Henry, H.A.L. Soil freeze-thaw cycle experiments: Trends, methodological weaknesses and suggested improvements. Soil Biol. Biochem. 2007, 39, 977–986. [Google Scholar] [CrossRef]
  22. Vaz, M.D.R.; Edwards, A.C.; Shand, C.A.; Cresser, M.S. Changes in the chemistry of soil solution and acetic acid extractable P following different types of freeze/thaw episodes. Eur. J. Soil Sci. 2010, 45, 353–359. [Google Scholar] [CrossRef]
  23. Freppaz, M.; Williams, B.L.; Edwards, A.C.; Scalenghe, R.; Zanini, E. Simulating soil freeze/thaw cycles typical of winter alpine conditions: Implication for N and P availability. Appl. Soil Ecol. 2007, 35, 247–255. [Google Scholar] [CrossRef]
  24. Yevdokimov, I.; Larionova, A.; Blagodatskaya, E. Microbial immobilisation of phosphorus in soils exposed to drying-rewetting and freeze-thawing cycles. Biol. Fertil. Soils 2016, 52, 685–696. [Google Scholar] [CrossRef]
  25. Sjursen, H.; Michelsen, A.; Holmstrup, M. Effects of freeze–thaw cycles on microarthropods and nutrient availability in a sub-Arctic soil. Appl. Soil Ecol. 2005, 28, 79–93. [Google Scholar] [CrossRef]
  26. Dari, B.; Nair, V.D.; Harris, W.G.; Nair, P.K.R.; Sollenberger, L.; Mylavarapu, R. Relative influence of soil-vs. biochar properties on soil phosphorus retention. Geoderma 2016, 280, 82–87. [Google Scholar] [CrossRef]
  27. Eduah, J.O.; Breuning-Madsen, H.; Abekoe, M.; Andersen, M.N. Phosphorus fractionation and sorption characteristics of biochar amended soils of Ghana. In Proceedings of the International Research of Food Security, Natural Resource Management and Rural Development, Bonn, Germany, 20–22 September 2017. [Google Scholar]
  28. Madiba, O.F.; Solaiman, Z.M.; Carson, J.K.; Murphy, D.V. Biochar increases availability and uptake of phosphorus to wheat under leaching conditions. Biol. Fertil. Soils 2016, 52, 439–446. [Google Scholar] [CrossRef]
  29. Xu, G.; Zhang, Y.; Sun, J.; Shao, H. Negative interactive effects between biochar and phosphorus fertilization on phosphorus availability and plant yield in saline sodic soil. Sci. Total Environ. 2016, 568, 910–915. [Google Scholar] [CrossRef] [Green Version]
  30. Chintala, R.; Schumacher, T.E.; McDonald, L.M.; Clay, D.E.; Malo, D.D.; Papiernik, S.K.; Clay, S.A.; Julson, J.L. Phosphorus Sorption and Availability from Biochars and Soil/Biochar Mixtures. Clean-Soil Air Water 2014, 42, 626–634. [Google Scholar] [CrossRef]
  31. Zhao, P.; Li, S.; Wang, E.; Chen, X.; Deng, J.; Zhao, Y. Tillage erosion and its effect on spatial variations of soil organic carbon in the black soil region of China. Soil Till. Res. 2018, 178, 72–81. [Google Scholar] [CrossRef]
  32. Xu, G.; Zhang, Y.; Shao, H.; Sun, J. Pyrolysis temperature affects phosphorus transformation in biochar: Chemical fractionation and 31P NMR analysis. Sci. Total Environ. 2016, 569, 65–72. [Google Scholar] [CrossRef]
  33. Murphy, J.; Riley, J.P. A modified single solution method for the determination of phosphate in natural waters. Anal. Chim. Acta. 1962, 27, 31–36. [Google Scholar] [CrossRef]
  34. Rose, T.J.; Hardiputra, B.; Rengel, Z. Wheat, canola and grain legume access to soil phosphorus fractions differs in soils with contrasting phosphorus dynamics. Plant Soil 2010, 326, 159–170. [Google Scholar] [CrossRef]
  35. Qin, S.J.; Liu, J.S.; Wang, G.P.; Wang, J.D. Seasonal changes of soil phosphorus fractions under Calamagrostis angustifolia wetlands in Sanjiang Plain, China. Acta Ecol. Sin. 2007, 27, 3844–3851. [Google Scholar] [CrossRef]
  36. Panishkan, K.; Swangjang, K.; Sanmanee, N.; Sungthong, D. Principal component analysis for the characterization in the application of some soil properties. World Acad. Sci. Eng. Technol. 2012, 6, 727–729. [Google Scholar]
  37. Borůvka, L.; Vacek, O.; Jehlička, J. Principal component analysis as a tool to indicate the origin of potentially toxic elements in soils. Geoderma 2005, 128, 289–300. [Google Scholar] [CrossRef]
  38. Kang, J.; Hesterberg, D.; Osmond, D.L. Soil organic matter effects on phosphorus sorption: A path analysis. Soil Sci. Soc. Am. J. 2009, 73, 360–366. [Google Scholar] [CrossRef]
  39. Yang, X.; Chen, X.; Guo, E.; Yang, X. Path analysis of phosphorus activation capacity as induced by low-molecular-weight organic acids in a black soil of Northeast China. J. Soil Sediment 2018, 1–8. [Google Scholar] [CrossRef]
  40. Shi, Y.C.; Ziadi, N.; Messiga, A.J.; Lalande, R.; Hu, Z.Y. Soil phosphorus fractions change in winter in a corn-soybean rotation with tillage and phosphorus fertilization. Pedosphere 2015, 25, 1–11. [Google Scholar] [CrossRef]
  41. Perrott, K.W.; Sarathchandra, S.U.; Waller, J.E. Seasonal storage and release of phosphorus and potassium by organic matter and the microbial biomass in a high-producing pastoral soil. Aust. J. Soil Res. 1990, 28, 593–608. [Google Scholar] [CrossRef]
  42. Fabre, A.; Pinay, G.; Ruffinoni, C. Seasonal changes in inorganic and organic phosphorus in the soil of a riparian forest. Biogeochemistry 1996, 35, 419–432. [Google Scholar] [CrossRef]
  43. Xu, G.; Sun, J.; Xu, R.; Lv, Y.; Shao, H.; Yan, K.; Zhang, L.; Blackwell, M.S.A. Effects of air-drying and freezing on phosphorus fractions in soils with different organic matter contents. Plant Soil Environ. 2011, 57, 228–234. [Google Scholar] [CrossRef] [Green Version]
  44. Gordon, H.; Haygarth, P.M.; Bardgett, R.D. Drying and rewetting effects on soil microbial community composition and nutrient leaching. Soil Biol. Biochem. 2008, 40, 302–311. [Google Scholar] [CrossRef]
  45. Lehrsch, G.A.; Sojka, R.E.; Carter, D.L.; Jolley, P.M. Freezing effects on aggregate stability affected by texture, mineralogy, and organic matter. Soil Sci. Soc. Am. J. 1991, 55, 1401–1406. [Google Scholar] [CrossRef]
  46. Koponen, H.T.; Martikainen, P.J. Soil water content and freezing temperature affect freeze–thaw related N2O production in organic soil. Nutr. Cycl. Agroecosys. 2004, 69, 213–219. [Google Scholar] [CrossRef]
  47. Kværnø, S.H.; Øygarden, L. The influence of freeze–thaw cycles and soil moisture on aggregate stability of three soils in Norway. Catena 2006, 67, 175–182. [Google Scholar] [CrossRef]
  48. Xie, Q.; Gao, Y. The effects of freezing-thawing on soil carbon, nitrogen and phosphorus availabilities in Alpine Meadow on the Qinghai-Tibetan Plateau. J. Soil Water Conserv. 2015, 29, 137–142. [Google Scholar] [CrossRef]
  49. Cui, H.J.; Wang, M.K.; Fu, M.L.; Ci, E. Enhancing phosphorus availability in phosphorus-fertilized zones by reducing phosphate adsorbed on ferrihydrite using rice straw-derived biochar. J. Soil Sediment 2011, 11, 1135–1141. [Google Scholar] [CrossRef]
  50. Mukherjee, A.; Zimmerman, A.R. Organic carbon and nutrient release from a range of laboratory-produced biochars and biochar–soil mixtures. Geoderma 2013, 193, 122–130. [Google Scholar] [CrossRef]
  51. Anderson, C.R.; Condron, L.M.; Clough, T.J.; Fiers, M.; Stewart, A.; Hill, R.A.; Sherlock, R.R. Biochar induced soil microbial community change: Implications for biogeochemical cycling of carbon, nitrogen and phosphorus. Pedobiologia 2011, 54, 309–320. [Google Scholar] [CrossRef]
  52. Gul, S.; Whalen, J.K.; Thomas, B.W.; Sachdeva, V.; Deng, H.Y. Physico-chemical properties and microbial responses in biochar-amended soils: Mechanisms and future directions. Agric. Ecosyst. Environ. 2015, 206, 46–59. [Google Scholar] [CrossRef]
  53. Zhao, Q.; Zeng, D. Phosphorus cycling in terrestrial ecosystems and its controlling factors. Chin. J. Plant Ecol. 2005, 29, 153–163. [Google Scholar] [CrossRef]
  54. Xu, G.; Sun, J.N.; Shao, H.B.; Chang, S.X. Biochar had effects on phosphorus sorption and desorption in three soils with differing acidity. Ecol. Eng. 2014, 62, 54–60. [Google Scholar] [CrossRef] [Green Version]
Figure 1. Location of the study area.
Sustainability 11 01006 g001
Figure 2. Phosphorus fractions in soil and biochar-amended soil with different freeze–thaw cycles (FT) and moisture contents (M) extracted by modified Hedley sequential method (mg·kg−1). (a) represents labile phosphorus fractions and (b) represents all phosphorus fractions. Different lowercase letters indicate significance among different biochar amendment and moisture contents within the same freeze–thaw cycles at p < 0.05. Different uppercase letters indicate significant differences in the same biochar amendment and moisture contents within the same freeze–thaw cycles at p < 0.05.
Sustainability 11 01006 g002
Figure 3. Principal components analysis (PCA) ordination of the P fraction variables following soil and biochar-amended soils with different soil moisture contents and freeze–thaw cycles. M1, M2 and M3 represent half of saturated moisture content (22%), natural moisture content (31%), and saturated moisture content (45%), respectively. (S) and (B) represent soil and biochar-amended soil, respectively. FT represents freeze–thaw cycles including 0, 1, 3, 6, and 12 freeze–thaw cycles.
Sustainability 11 01006 g003
Table 1. Significance values of the interactive effects for all the analyzed parameters of moisture content (M), biochar amendment (TrT), and freeze–thaw cycles (FT) treatment.
SourcesH2O-PNaHCO3-PiNaHCO3-PoNaOH-PiNaOH-PoHCl-PiHCl-PoRes-PLabile-PPiPoPa
M0.00400000.033NS00000
TrT0000000.001NS0000
FT0000.00100.0130.0010.00400.01200
M × TrT0.0380000.01400.01400000.005
TrT × FT0.00600NS0NS0NS0NS00
M × FT000.00200NSNS000.00100
M × TrT × FT0000.0120.0230.0090000.0010.0020
Note: NS represents no significance. M represents a half of saturated moisture content, natural moisture content, and saturated moisture content; TrT represents soil (S) and biochar-amended soil (B); FT include 1, 3, 6, and 12 FT and an unfrozen control.
Table 2. Inorganic phosphorus (Pi) and organic phosphorus (Po) contents in soil (S) and biochar-amended soil (B) with different freeze–thaw cycles (FT) and moisture contents (M).
Moisture ContentsTreatmentNumber of FTPiPoPi/(Pi + Po)%Po/(Pi + Po)%
M1S (n = 4)0556 ± 10abC203 ± 18bcAB73 ± 2abB27 ± 2bcB
1565 ± 18abC199 ± 15cBC74 ± 2aB26 ± 2cB
3577 ± 34aB215 ± 5abcB73 ± 1abB27 ± 1bcB
6552 ± 7abB228 ± 7aB71 ± 1cC29 ± 1aB
12545 ± 12bBC219 ± 4abC71 ± 1bcC29 ± 1abC
B (n = 4)0637 ± 6bA196 ± 8aB76 ± 1bA24 ± 1aC
1666 ± 2aB184 ± 8bC78 ± 1aA22 ± 1bC
3666 ± 9aA183 ± 6bD78 ± 1aA22 ± 1bC
6674 ± 11aA188 ± 6abCD78 ± 1aA22 ± 1bD
12669 ± 2aA195 ± 6aDE77 ± 1abA23 ± 1abE
M2S (n = 4)0524 ± 17aD210 ± 6cAB71 ± 1aC29 ± 1cA
1522 ± 16aB234 ± 8bA69 ± 1bcC31 ± 1abA
3528 ± 18aC234 ± 15bA69 ± 2abC31 ± 2bcA
6512 ± 23aC247 ± 10abA67 ± 2bcD33 ± 2abA
12526 ± 5aC259 ± 7aA67 ± 1cE33 ± 1aA
B (n = 4)0603 ± 14aB214 ± 5aA74 ± 1bcB26 ± 1abB
1573 ± 11bC214 ± 16aB73 ± 2cB27.13 ± 2aB
3555 ± 21bBC196 ± 4bC74 ± 1bcB26.12 ± 1abB
6573 ± 14bB181 ± 8cD76 ± 1aB24 ± 1cC
12551 ± 15bB184 ± 2bcE75 ± 1abB25 ± 1bcD
M3S (n = 4)0546 ± 19abC204 ± 6cdAB73 ± 1abBC27 ± 1cdAB
1556 ± 8aC188 ± 17dC75 ± 2aB25 ± 2dB
3528 ± 23abC218 ± 9bcB71 ± 2bcC30 ± 2bcA
6517 ± 17bC227 ± 19abB69 ± 2cCD31 ± 2abAB
12529 ± 29abBC241 ± 16aB69 ± 2cD31 ± 2aB
B (n = 4)0656 ± 8bA204 ± 8aAB76 ± 1cA24 ± 1aC
1685 ± 7aA187 ± 7cC79 ± 1aA21 ± 1cC
3674 ± 16abA191 ± 5bcCD78 ± 0abA22 ± 0bcC
6656 ± 19bA199 ± 11abC77 ± 1bcAB23 ± 1aCD
12661 ± 10bA204 ± 6aD76 ± 1cA24 ± 1abE
Note: Different lowercase letters in the same treatment within the same moisture content indicate significance among five freeze–thaw cycles at p < 0.05, Different uppercase letters in the same number of freeze–thaw cycles indicate significant differences within biochar amendment and moisture content at p < 0.05.
Table 3. Direct effects and indirect effects of individual P fractionson available P (Pa) in soil (S) and biochar-amended soil (B).
TreatmentVariableDirect Path CoefficientIndirect Path CoefficientTotal
→NaOH-Pi→NaHCO3-Po→HCl-Pi
S (n = 60)NaOH-Pi−0.39 ** −0.1044−0.0578−0.1622
NaHCO3-Po0.348 **0.117 −0.00850.1085
HCl-Pi0.244 **0.0924−0.0122 0.0802
B (n = 60)VariableDirect path coefficientIndirect path coefficientTotal
→HCl-Pi→NaOH-Po
HCl-Pi−0.393 ** 0.00090.0009
NaOH-Po0.285 **−0.0012 −0.0012
Note: * Significant at p < 0.05, ** Significant at p < 0.01.

