Article

Can Common Reed Fiber Become an Effective Construction Material? Physical, Mechanical, and Thermal Properties of Mortar Mixture Containing Common Reed Fiber

Department of Civil and Environmental Engineering, Nazarbayev University, Astana 010000, Kazakhstan
*
Authors to whom correspondence should be addressed.
Sustainability 2019, 11(3), 903; https://doi.org/10.3390/su11030903
Submission received: 27 November 2018 / Revised: 22 December 2018 / Accepted: 29 December 2018 / Published: 11 February 2019
(This article belongs to the Special Issue Sustainable Construction and Building Materials)

Abstract

:
Due to the increased demands of adapting the sustainability concept in the construction industry, many researchers have developed and evaluated the composite materials made with agricultural by-products, such as straws, fruit-shells, and cobs, as construction materials. Because no research work has been reported regarding the incorporation of common reed fiber (CRF) into a concrete composite to produce the green and sustainable concrete, this research has focused on the evaluation of physical, mechanical, and thermal properties of mortar mixture containing CRF regarding density, porosity, compressive and flexural strengths, and thermal conductivity. In total, six mixtures with 0%, 2%, 4%, and 6% CRF; 0.5% steel fiber (SF); and the combination of 6% CRF and 0.5% SF were prepared. Based on the experimental outputs, a simple analysis of heat loss was also been performed. The test results presented that the incorporation of CRF into mortar mixture proportionally reduced its unit weight and significantly increased its absorption capacity and porosity. Although the use of only CRF in the mortar mixture did not improve both compressive and flexural strengths compared to the plain mixture, the combined use of CRF and SF to increase both compressive and flexural strengths generated a synergetic effect to increase both strengths. The addition of CRF to the mixture has the benefit of producing a significant decrease in heat loss for a typical building in Astana due to the lower thermal conductivity and higher porosity to density ratio.

1. Introduction

Interest in the impact of buildings on the environment and on human health is growing every year. This is connected to green building (GB) technology. The concept of GB includes the need and desire for more energy efficient and environmentally friendly construction practices from planning and design to the demolition of the building throughout a building’s life [1]. The aims of GB can be achieved by improving the good thermal performance of the building and by using safe construction materials with a low environmental impact [2]. The excellent thermal performance of a building can be attained using suitable materials, such as a high-performance window and an insulator with low thermal conductivity to provide airtightness through the building envelope. On the other hand, safe construction materials with little environmental impact should be non-toxic, reusable, renewable, and recyclable, without causing ‘Sick Building Syndrome’ (SBS). Yu and Crump [3] and Barreca et al. [4] reported that significant risk factors for SBS are linked to the use of inappropriate building materials and ventilation systems. Therefore, modern sustainable construction industry and many researchers have started to use environmentally friendly by-products of agriculture as construction materials in order to fulfill the Green Building Rating (GBR) system to evaluate sustainability points in the energy and atmosphere category of the Leadership in Energy and Environmental Design (LEED) [5,6]. Agricultural by-products used as construction materials include straw, fruit-shell, cob, seed, pod, husk, bagasse, hemp shiv, biochar, giant reed, and so on [2,7].
When these agricultural by-products are used in a concrete matrix, they are used in the forms of ash, aggregate, and fiber. For example, some ashes derived from agricultural biomass, such as rice husk, biochar, and pam oil fuel ash, have been successfully used in cement or concrete as supplementary cementitious materials (SCMs). It is well-known that the use of rice husk ash in a concrete matrix can improve the strength and durability of concrete due to the pozzolanic reaction between highly reactive amorphous silica from rice husk ash and portlandite from cement hydration [8,9,10,11,12]. Cuthbertson et al. [13] used biochar from residual biomass of the bio-ethanol industry as a concrete filler. They found that the addition of biochar to the concrete reduced the concrete density and compressive strength, but improved the thermal and acoustic properties. Aldahdooh et al. [14] and Bamaga et al. [15] partially replaced cement with palm oil fuel ash (POFA) in the concrete mixture and evaluated the compressive strength and durability. They found that all concretes containing POFA had a higher long-term strength and good resistance for chloride ions penetration compared to a control concrete. Salim et al. [16] successfully used sugarcane bagasse ash to improve the bearing strength of sandy loam soil compressed earth block bricks.
Some researchers have evaluated the wide availability of agricultural wastes (oil palm shell and coconut shell) as a suitable and dependable alternative for aggregate in concrete. Shafigh and his colleagues [17,18] developed high strength oil palm shell lightweight concrete, which exhibited about 53 MPa for 28-day compressive strength. Coconut shells, like oil palm shells, were also utilized as a coarse aggregate in the production of concrete. Gunasekaran et al. [19,20] reported that coconut shell could be used as a lightweight aggregate to produce structural lightweight concrete. Binici et al. [21] and Mati-Baouche et al. [22] developed an insulating bio-based composite made from sunflower stalks. They found that the mechanical and thermal performances of this composite were competitive with other insulating materials available on the market.
In studies of the addition of agricultural wastes as a fiber form to the concrete, Ataie [23] investigated the effect of rice straw fibers (RSF) on the strengths and drying shrinkage of concrete. He found that the addition of RSF to the concrete reduced the strength and increased the drying shrinkage. Islam and Ahmed [24] studied the influence of jute fiber on concrete fresh and hardened properties. They found that the slump of concrete decreased as the amount of jute fiber increased. They also reported that the small amount of fiber increased the compressive strength, but showed no significant impact on the split tensile strength of concrete. Moreover, it was found that the addition of agricultural natural fibers in concrete improves the compressive strength, tensile strength, toughness, and cracking behavior [25,26,27]. Berardi and Iannace [28] investigated the acoustic characterization of various natural fibers (kenaf, wood, hemp, coconut, cork, cane, cardboard, and sheep wool) for sound absorption applications. They found that these fibers had good sound absorption coefficients due to their porous structures and significant sound absorption at a low frequency could be obtained by increasing their thickness. Although more significant interest in the utilization of agricultural by-products as construction materials has increased over the last years, there is still much room to investigate other types of agricultural by-products and their applications in construction materials.
Reed is one of the most widely distributed and highly productive wetland plant genera in the world. Since the reed is very fast growing, it is frequently cut, consequently make raw material widely available [28]. In Kazakhstan, the reeds occupy a large area along the lake shores, and the reed areas are around 2,000,000 hectares [29]. Since prehistoric times, reed has been used by humans in construction applications. For instance, the reed has been traditionally used for roof hatching [30,31]. Moreover, in recent years, many researchers have applied the reed as a renewable material to construction applications. Gabarrón et al. [32] reported that flooring and roofing slabs made with the enhanced surface roughness of the contact interface between plaster and common reed have a higher flexural strength than the traditional structural element. Bołtryk and Pawluczuk [31] studied properties of a lightweight cement composite made with common reed as an organic filler. They found that this composite can be an excellent sustainable construction material because it has good insulating-structural properties and absorbs the carbon dioxide from the atmosphere very well. Barreca et al. [4] conducted a comparative study regarding the production of CO2 for the indoor environmental thermal control of houses with combined walls of both giant reed and agglomerated cork, with giant reed walls, and with a brick wall. They found that the combined wall had the lowest CO2 emission, which a value of less than ¼ compared to the brick house. The house with giant reed walls was ranked in second place, with less than ½ CO2 emission compared to the brick house. The application of giant reed ash (GRA) and air-dried giant reed fibers (GRF) in concrete mixtures was investigated by Ismail and Jaeel [32]. They reported that the 28-day compressive and flexural strengths of concrete containing GRA and GRF increased compared to the plain concrete when they replaced sand by 7.5%.
As previously stated, because of increased sustainability demands in the construction area, the use of agricultural by-products is becoming justified in concrete technology. The use of these by-products is inhibited by a lack of research into the properties of cement composites containing them. Although several studies have been conducted on the properties of concrete containing giant reed material, no research work has been reported regarding the incorporation of common reed fiber into concrete to produce green and sustainable concrete. Therefore, this paper investigated the physical, mechanical, and thermal properties of a mortar mixture containing common reed fiber. Furthermore, to investigate more applications of CRF mixture, such as insulating material, heat loss through the walls of a building was calculated.

2. Materials and Methods

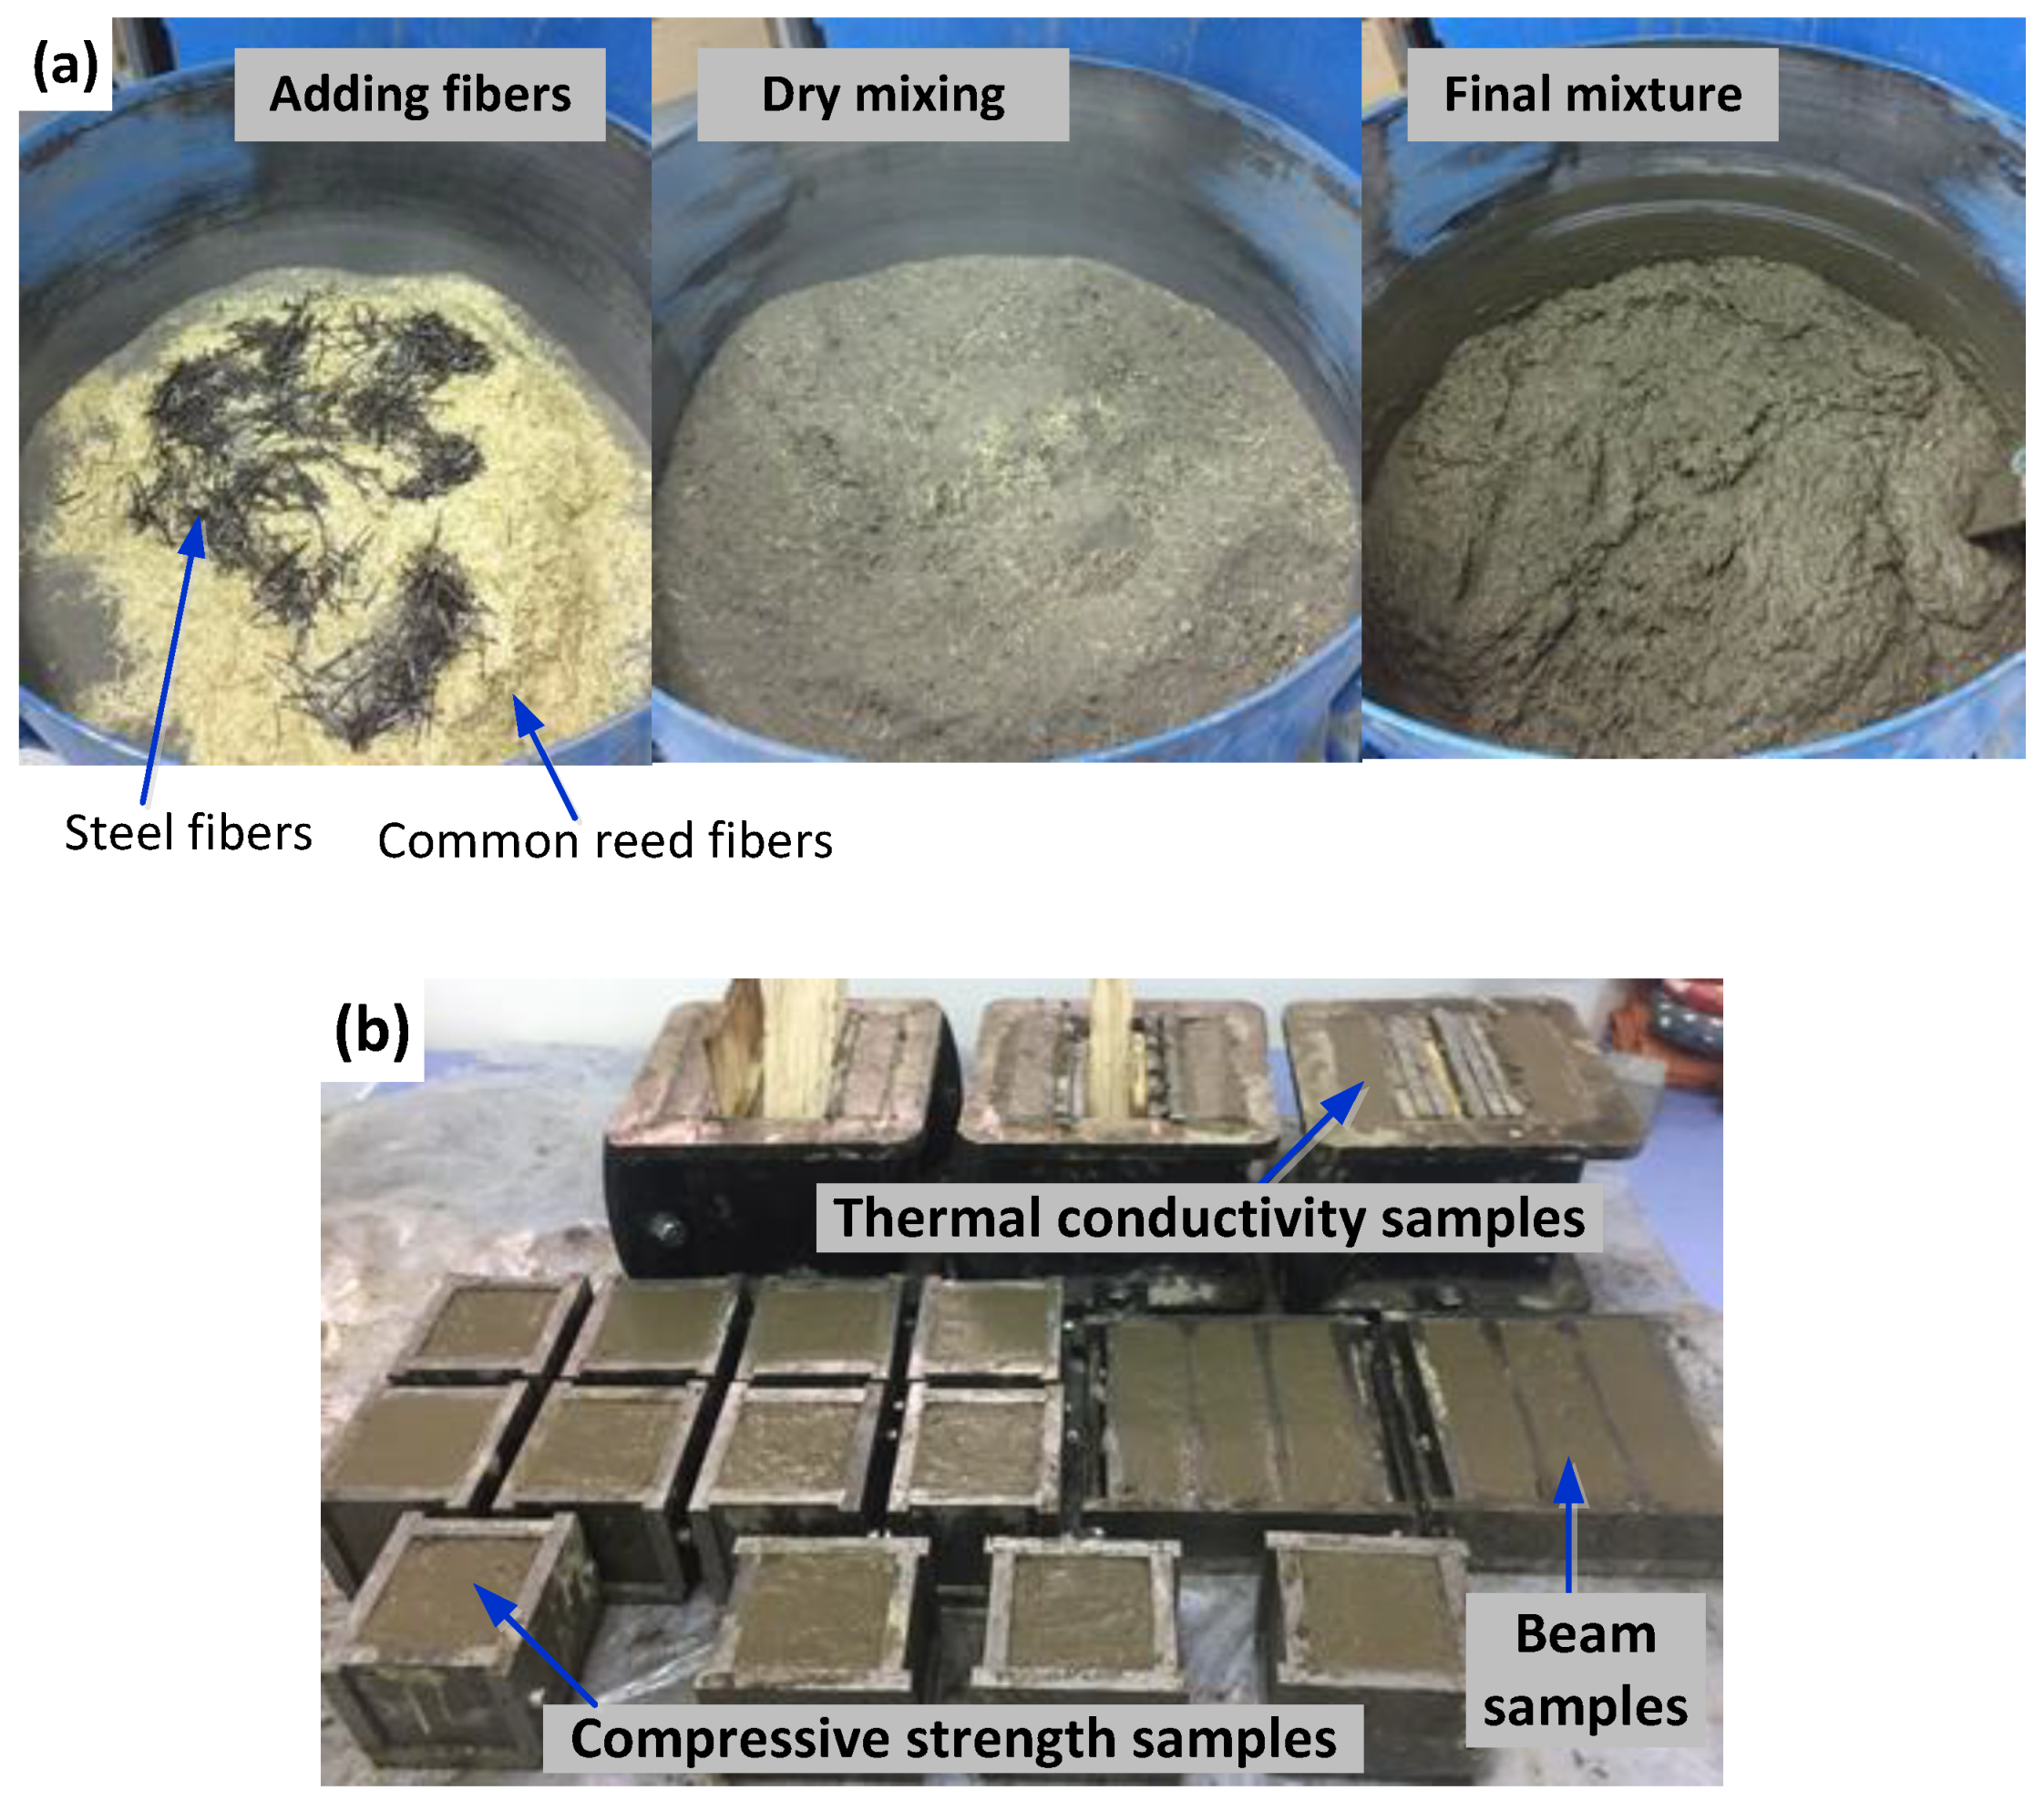
2.1. Materials, Mixture Proportion, Mixing Procedure, and Specimen Preparation

Materials used in this study were ASTM Type I ordinary Portland cement, river sand, steel fiber (SF), and common reed fiber (CRF). Cement obtained from Heidelberg Cement had a specific gravity of 3.15. The locally obtained river sand had a 2.76 fineness modulus with the volume fractions (percent retained on sieve) of 3.9% (4.75 mm), 12.7% (2.36 mm), 15.0% (1.18 mm), 14.4% (0.6 mm), 37.4% (0.3 mm), 11.6% (0.15 mm), 4.7% (0.075 mm), and 2.2% (pan). The specific gravity, absorption capacity, and moisture content of sand were 2.64, 2.13%, and 0.2%, respectively.
Common reed was obtained from a local Shim river area in Astana, Kazakhstan and processed into the fiber form using an automated crusher after open-air drying. The produced fibers were sieved to remove dust and tiny fibrous particles of a thickness less than 1 mm and shorter than 10 mm. The average size of common reed fiber (CRF) was approximately 15 mm. This CRFs were kept under dry atmosphere by using a desiccator just before the fiber reinforced mortar mixtures were manufactured. Steel fiber (SF) was also used to compare the test results of the mixtures containing CRF with those with SF. The geometry and the properties of CRF and SF are presented in Table 1. The tensile strength of fibers was obtained using the Tinius Olsen machine according to the ASTM D3822-01 Standard Test Method for Tensile Properties of Single Textile Fibers [33].
As shown in Table 2, the six mixtures were prepared to evaluate the physical, mechanical, and thermal properties of the mortar mixture containing CRF. The water to cement ratio (w/c) of the mortar mixture was 0.45. The CRF and SF were replaced with fine aggregate. The CRF contents of 0% (control), 2%, 4%, and 6% by volume of fine aggregate were used. For comparison, the mixture containing an SF content of 0.5% was cast. Finally, mixtures with a combination of CRF and SF in the respective volume fractions of 6.0% and 0.5% were also made to investigate the synergistic effect of the combination of CRF and SF.
For the mixing procedure, cement and aggregate were placed into the pan-type mixer of a 100 L capacity and were then dry-mixed for 30 s. CRF and SF were added to the mixer and mixed for 30 s. After drying mixing, water was then added and mixed for 90 s. After a 60 s non-stirring rest time to mix residuals adhered to the walls of the mixer by hand, the mixture was continuously mixed for an additional 90 s. The total mixing time was about 5 min (Figure 1a).
As shown in Figure 1b, the specimen for compressive strength was cast in a 70 × 70 × 70 mm cube mold after mixing was completed. The casting of samples was completed in two layers with the help of tamping with a steel rod and shaking to achieve better compaction. Additionally, while the 40 × 40 × 160 mm prismatic specimen was prepared for flexural strength, the specimen with a 150 × 150 × 30 mm dimension was cast for a thermal conductivity test. After casting was done, molds were covered with plastic sheets to prevent moisture evaporation. After 24 h, all specimens were demolded and cured in lime-saturated water under 24 ± 2 °C until the corresponding age, when hardened property tests were performed.

2.2. Fresh and Hardened Properties Tests and Thermal Conductivity Measurement

Immediately after mixing was complete, the flowability of mixtures incorporating CRF and/or SF was evaluated by conducting the ASTM C1437-15 Standard Test Method for Flow of Hydraulic Cement Mortar [34]. The mini-flow cone was filled with fresh mortar. After the mold was lifted away from the mortar, a caliper was used to measure two diameters of the initial spread of the mixture. Then, dropping the table 25 times in 15 s took place. A caliper was used again to measure the diameters of the final spread of mixture. Equation (1) was used to calculate the relative flowability (Gm) of the mixture.
G m = ( d 1 × d 2 d 0 2 ) d 0 2
where, Gm = relative flowability; d1 and d2 = diameters of the final spread after dropping; and d0 = an average of two diameters of the initial spread before dropping or flow cone diameter (100 mm).
Fundamental physical parameters directly related to the performance of the mortar mixture are the unit weight, absorption capacity, and porosity. The unit weight of mortar is its mass density. The unit weight of fresh and hardened samples was determined by weighing fresh (in mold) and hardened samples and dividing their weight by the volume (70 × 70 × 70 mm size). The determination of absorption capacity and porosity was achieved using the ASTM C642-13 Standard Test Method for Density, Absorption, and Voids in Hardened Concrete [35]. The average of three specimens at the testing age was used for analysis. The absorption and porosity properties of mixture samples were calculated using the following Equations (2) and (3).
A = W s d W o d W s d × 100
where, A = absorption after immersion (%); Wsd = the weight of the surface-dry sample in the air after immersion; and Wod = the weight of the oven-dried sample in the air.
P = ( W s d W o d ) ( W s d W w a t e r ) × 100
where, P = boiling saturation porosity (%); Wsd = the weight of the surface-dry sample in the air after immersion; Wod = the weight of the oven-dried sample in the air; and Wwater = the apparent weight of the sample in water after immersion and boiling.
A compressive strength test and flexural strength test called the modulus of rupture (MOR) were performed according to the guidelines of ASTM C109/C109M-16a Standard Test Method for Compressive Strength of Hydraulic Cement Mortars [36] and ASTM C 293/C293M-16 Standard Test Method for Flexural Strength of Concrete (Using Simple Beam with Center-Point Loading) [37], respectively. The average of three specimens at the testing age was used for analysis. The flexural strength was calculated using Equation (4).
S f = 3 P L 2 b d 2
where, Sf = flexural strength; P = maximum applied load; L = span length; b = average width of the specimen; and d = average depth of the specimen.

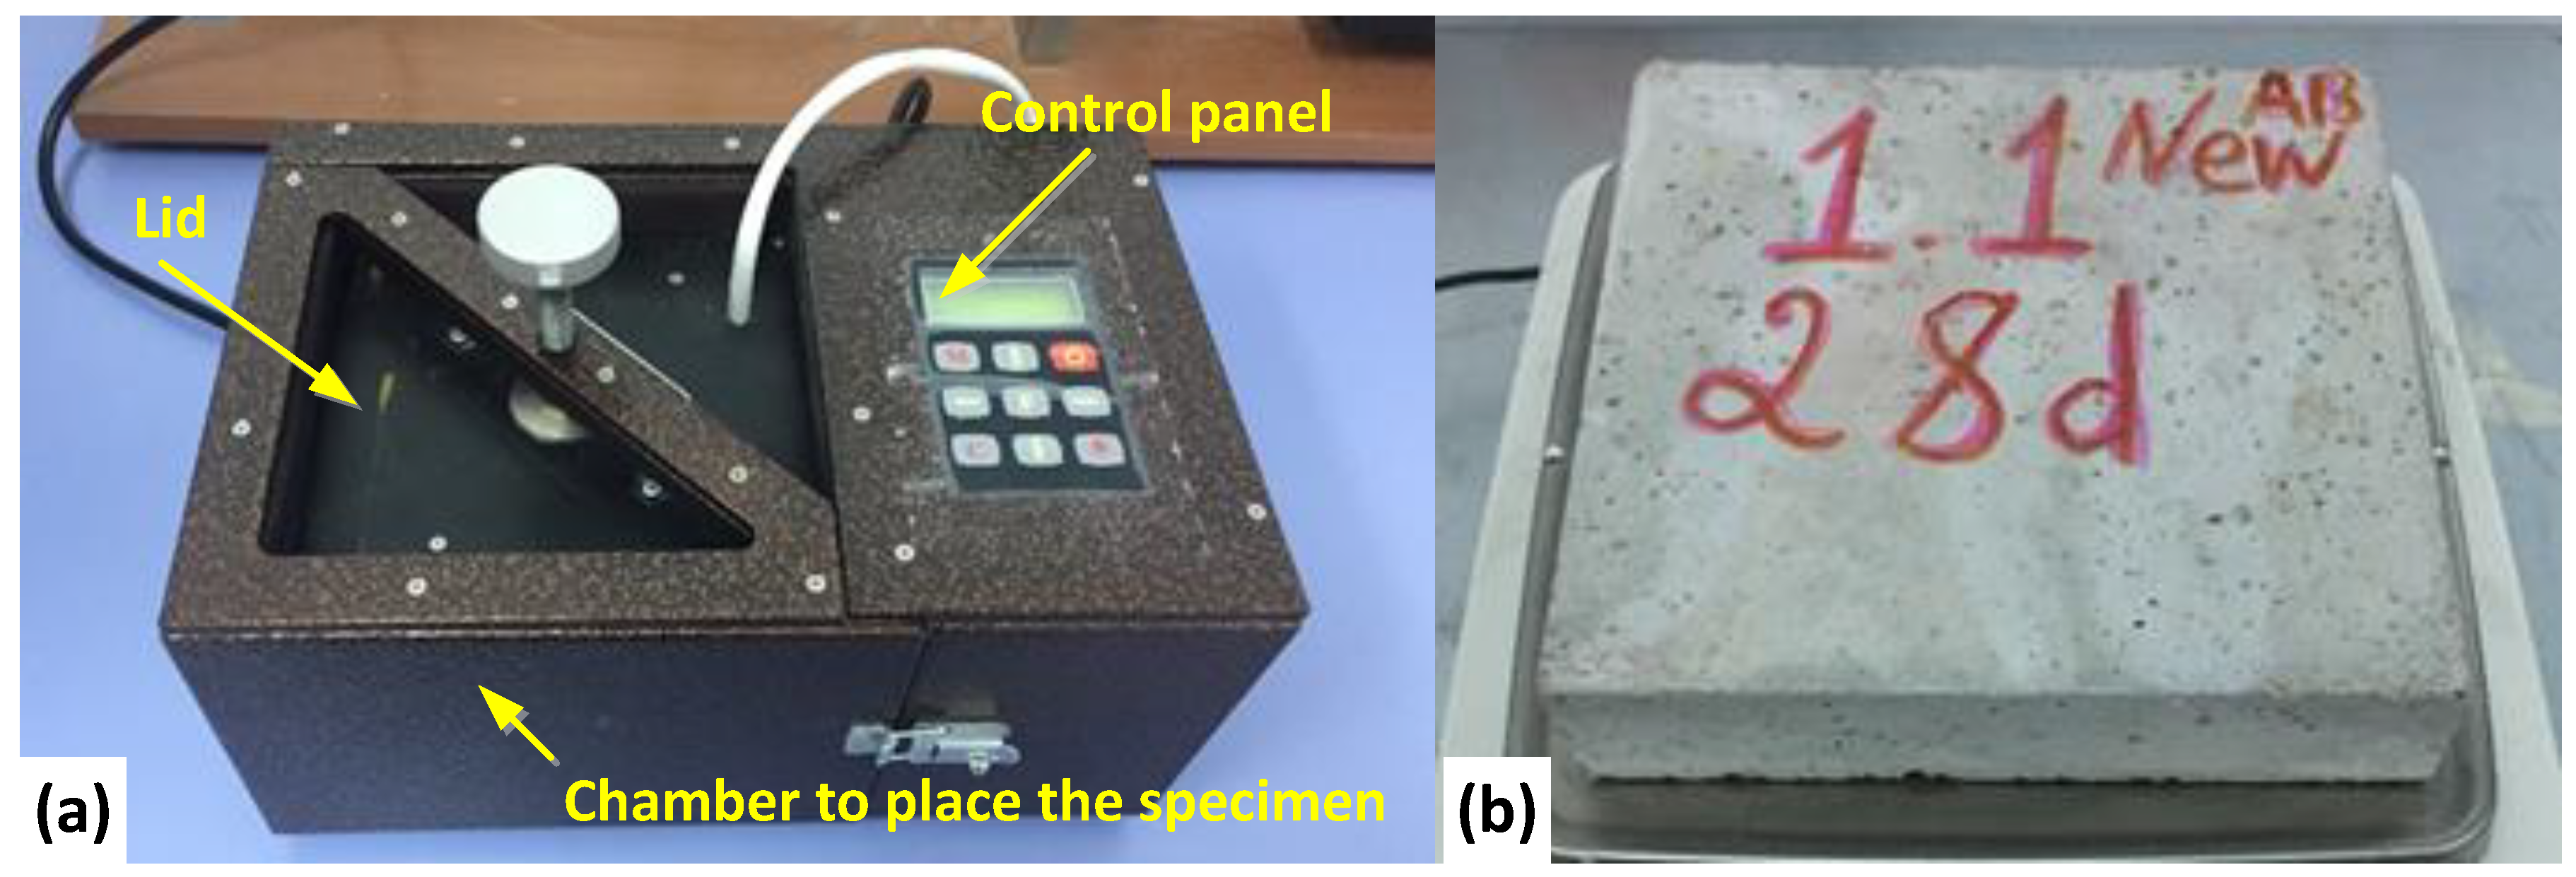
2.3. Thermal Conductivity Measurement

As shown in Figure 2, equipment called ‘ИTC-1 «150»’ using the stationary flow of cold and hot air stream from two parallel facets was used to measure the thermal conductivity (λ) of each mixture. This equipment can measure three thermal properties, such as thermal conductivity (W/mK), thermal insulance (m2K/W), and heat flux (W/m2), using the specimen which has dimensions of 150 × 150 mm, with thickness variation from 3 mm to 40 mm. Three specimens per each mixture of 150 × 150 × 30 mm size were used to measure the λ at curing ages of 7, 14, and 28 days. Before testing, samples were removed from the water bath and dried for 24 h at 100 °C. Because the measurement device requires samples to be smooth, plate samples were smoothened on the one uneven side, the top side, with sandpaper installed on a drilling device.

3. Test Results and Discussion

3.1. Evaluation of Physical Properties

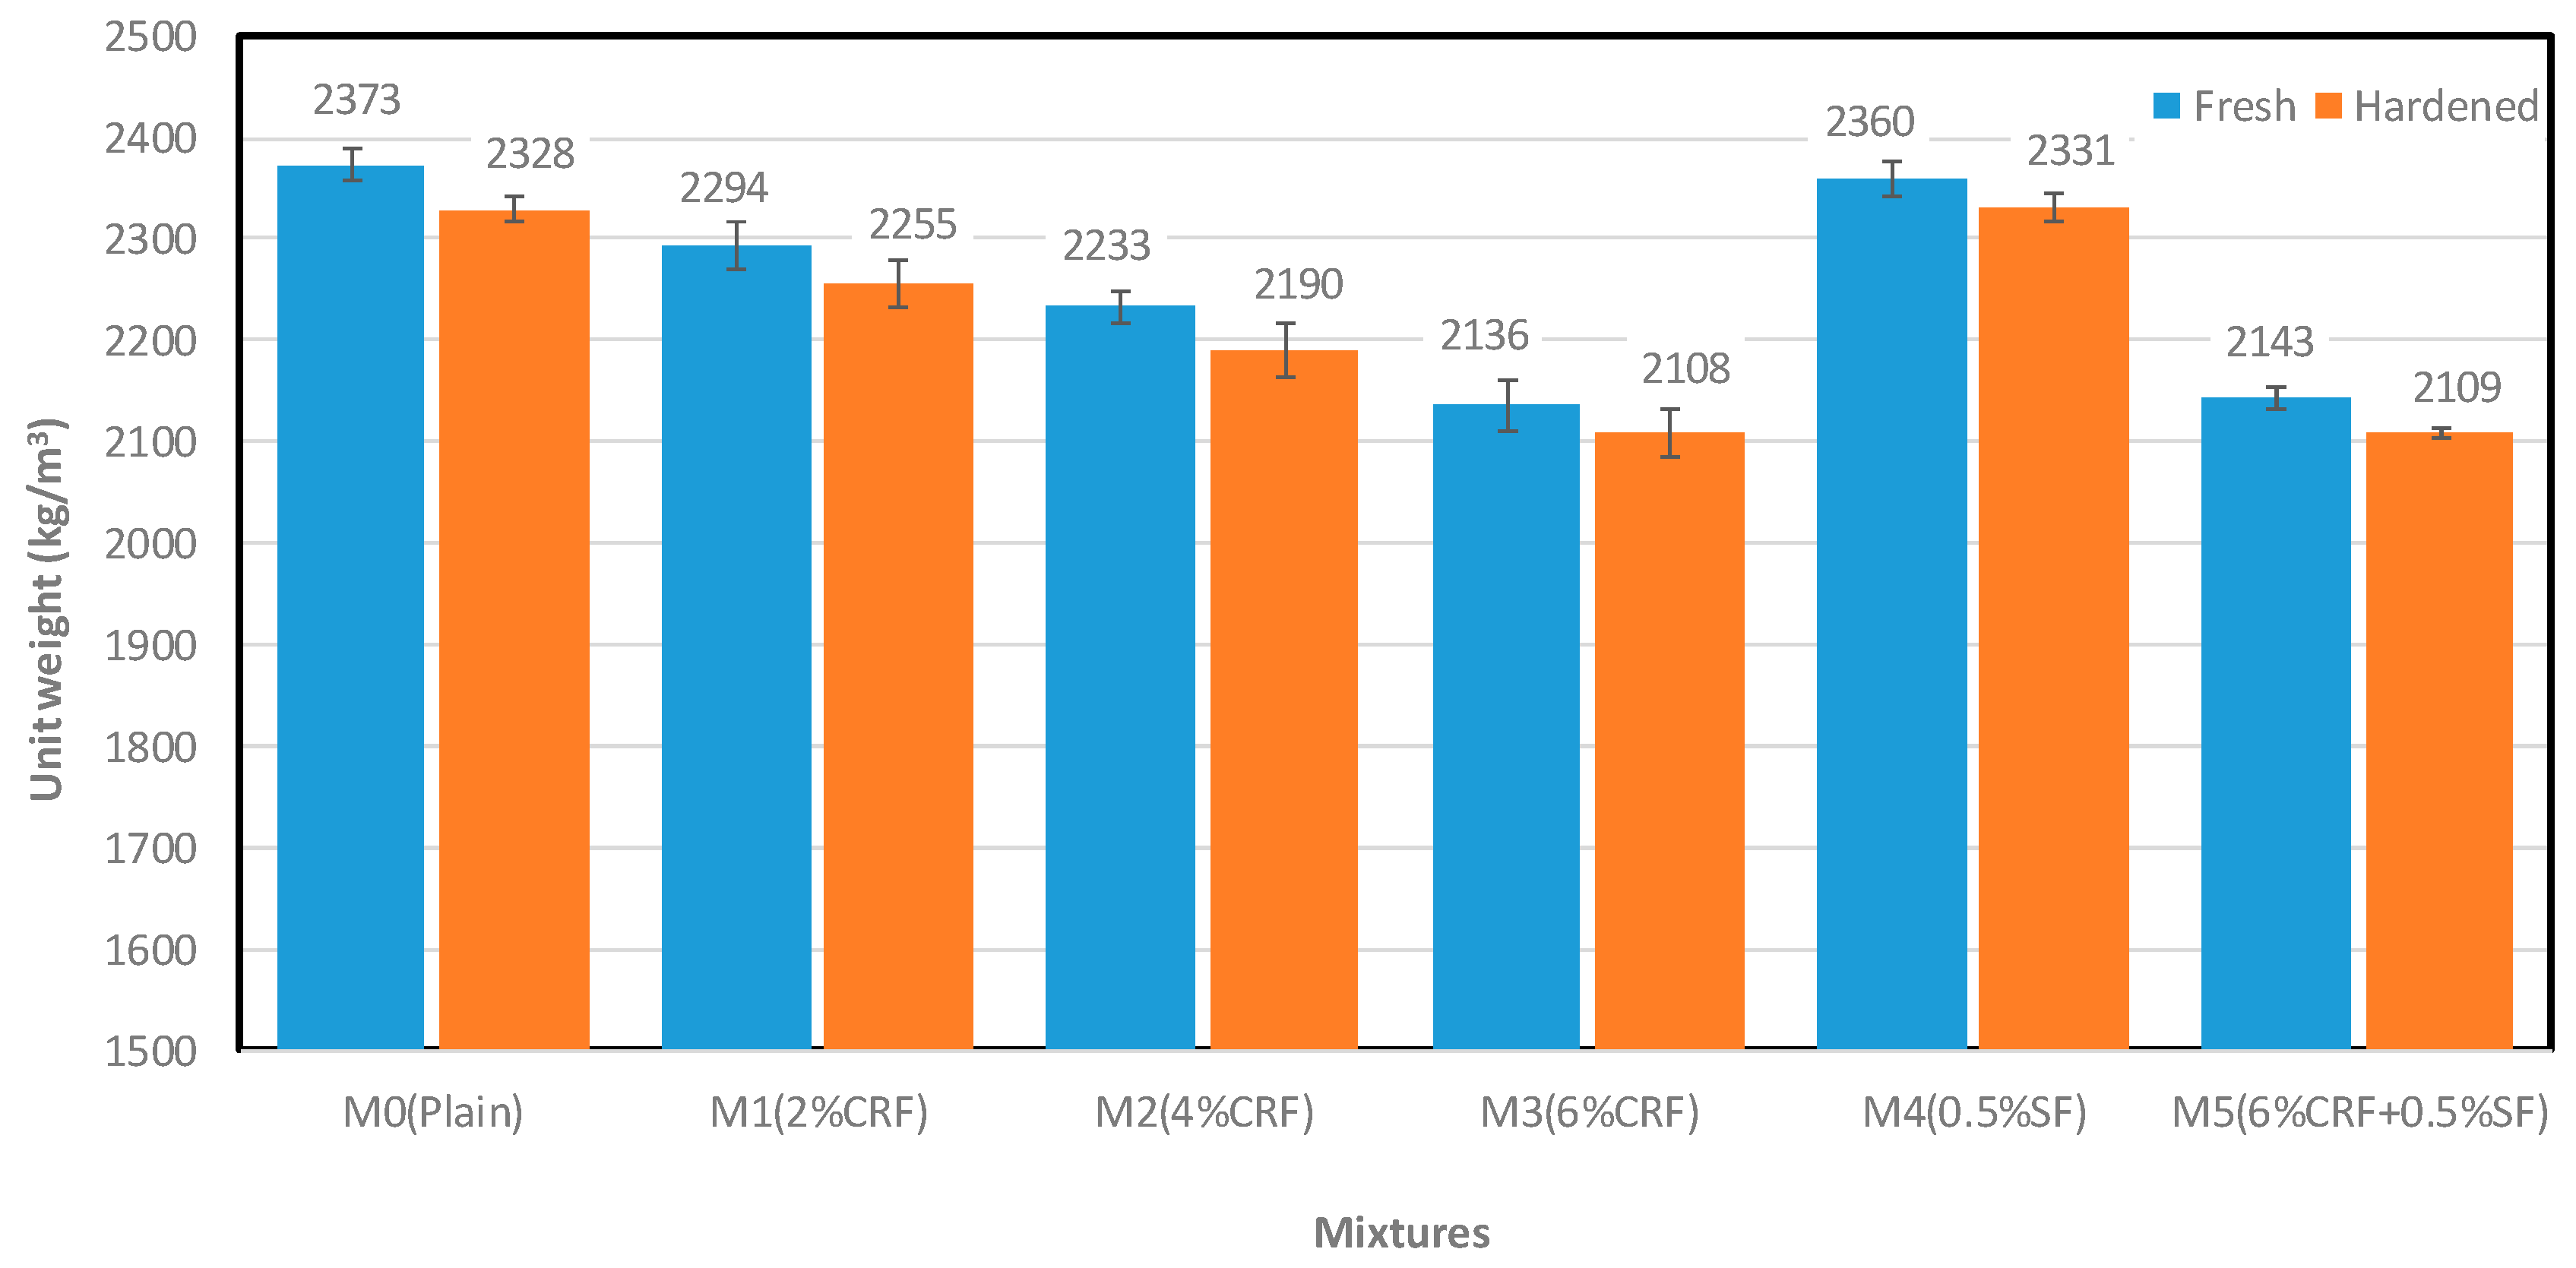
3.1.1. The Relationship between Unit Weight and CRF and SF Contents

Figure 3 illustrates both fresh and hardened unit weights of all six mortar mixtures. As expected, the unit weight of the fresh mortar mixture is higher than that of the hardened mortar in all mixtures. This may be the result of the hydration of cement and evaporation of a small amount of water from the surface of samples within the initial 24-h hardening period, which caused hardened specimens to possess a slightly lower mass than they used to have at the time of casting. Mixtures M1, M2, and M3 containing common reed fibers (CRF) have a lower unit weight than the control mixture M0. These mixtures exhibit a steady decrease in both fresh and hardened unit weight with the increase in CRF content. On the contrary, both fresh and hardened unit weights of mixture M4 containing 0.5% steel fiber (SF) are higher than those of plain concrete. These results are attributed to the specific gravity of CRF and SF. It should be noted that mixtures M1 through M3 and M4 are produced when replacing their aggregates with CRF or SF by volume. The unit weight of mixture M5 containing 6% CRF and 0.5% SF is between mixture M3 and M4. This result is expected because the CRF inside mixture M5 lowers its unit weight significantly below that of mixture M0, while SF inside M5 slightly raises it above that of M3.

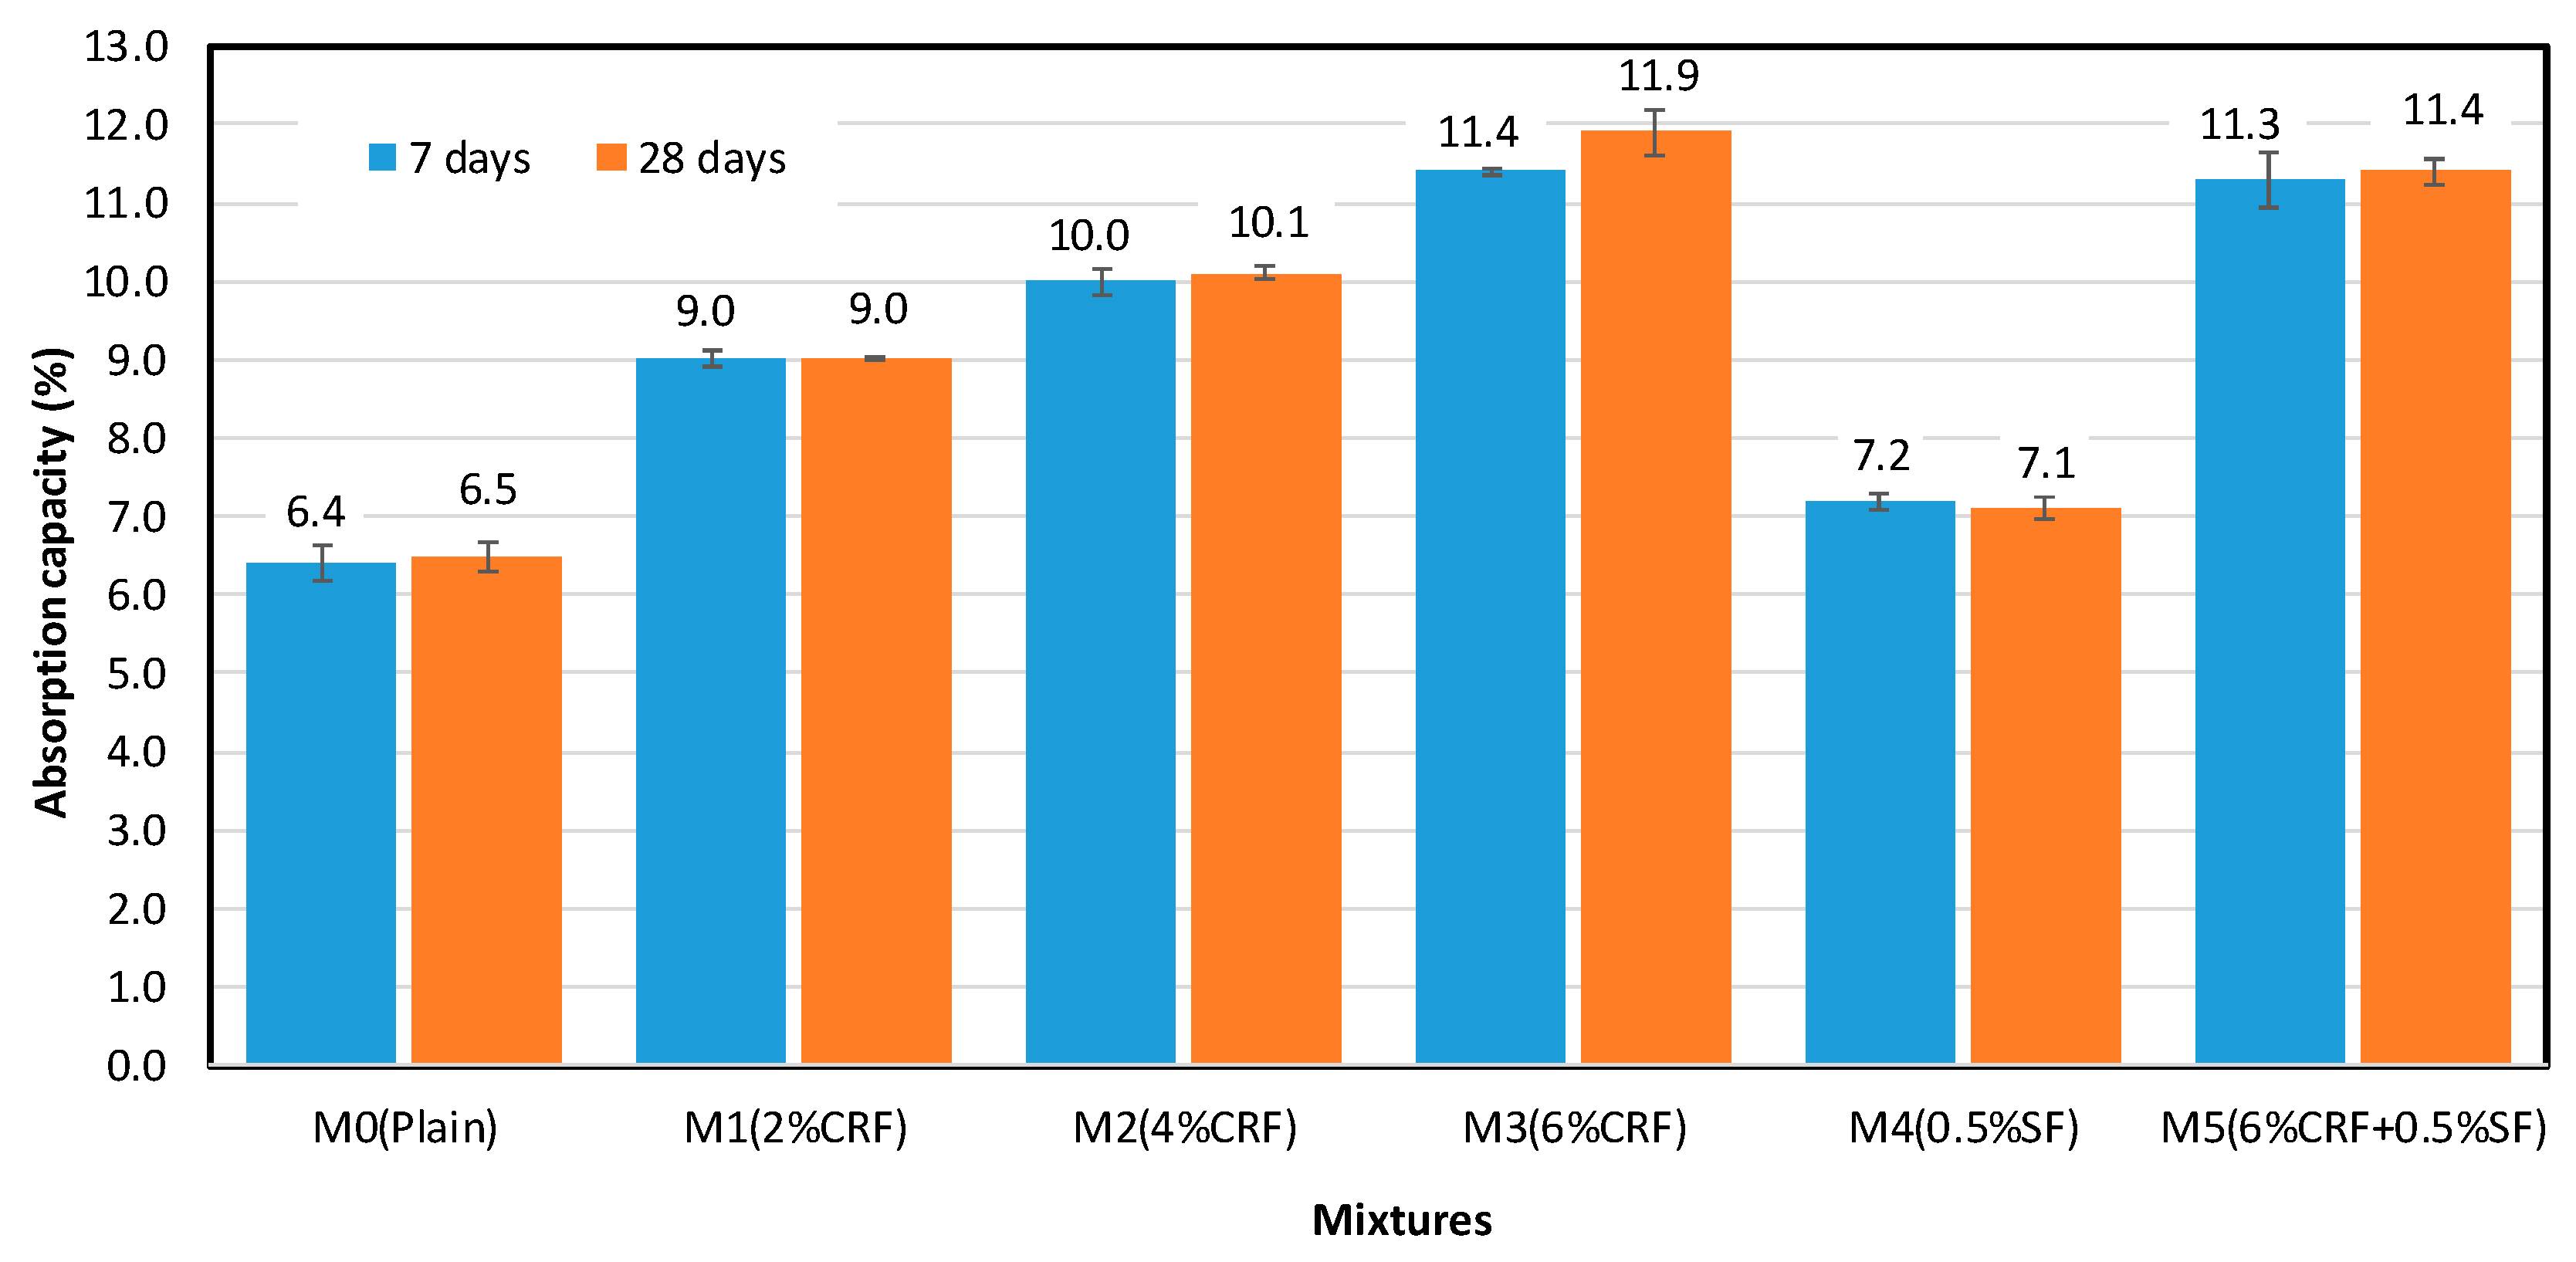
3.1.2. The Relationship between Water Absorption and CRF and SF Contents

Figure 4 presents the water absorption capacity (AC) of each mixture at 7-day curing. As predicted, all mixtures containing CRF exhibit a remarkably high AC compared to the plain mortar mixture M0, regardless of the type of specimen. Such a high absorption capacity is explained by the fact that CRF itself has a high AC of 231%, while the aggregate has an AC of only 2.13%. Again, it should be noted that mixtures containing CRF are produced by replacing their aggregates with CRF. For example, the mixture M3 with the highest CRF content shows the highest AC value of 11.4%, while mixtures M2 and M1 show a smaller AC of 10.0% and 9.0% compared to mixture M3, respectively. In addition, the control mixture M0 has an AC of 6.4%, which is three to five percent lower than that of all other mixes containing CRF. Based on these results, it is easily predicted that mixture M4 containing 0.5% SF has a lower AC value than the other mixtures containing CRF because mixture M4 does not include any CRF and the steel fiber has no absorption capacity. Interestingly, mixture M4 shows a 0.8% higher AC than plain mixture M0. A possible explanation for such an uninvited outcome may be due to the interconnected and open pores of the mixture. This result is matched with the porosity test results shown in Figure 5. Finally, the mixture M5 combined with 6.0% CRF and 0.5% SF has an AC of 11.3%, which is, as predicted, similar to that of mix M3, since both mixtures contain an identical CRF content (6.0%).
Figure 4 also shows the effect of curing age on the absorption capacity of the mixture. In spite of a little variation between ages, there is no influence of age on the AC of mixtures. For instance, samples cured for 28 days have a 0.1% to 0.5% higher AC than 7-day cured ones, but its effect on AC is barely noticeable. Therefore, it may be stated that the AC value is controlled by 7-day curing age and there are no significant changes beyond that curing time.

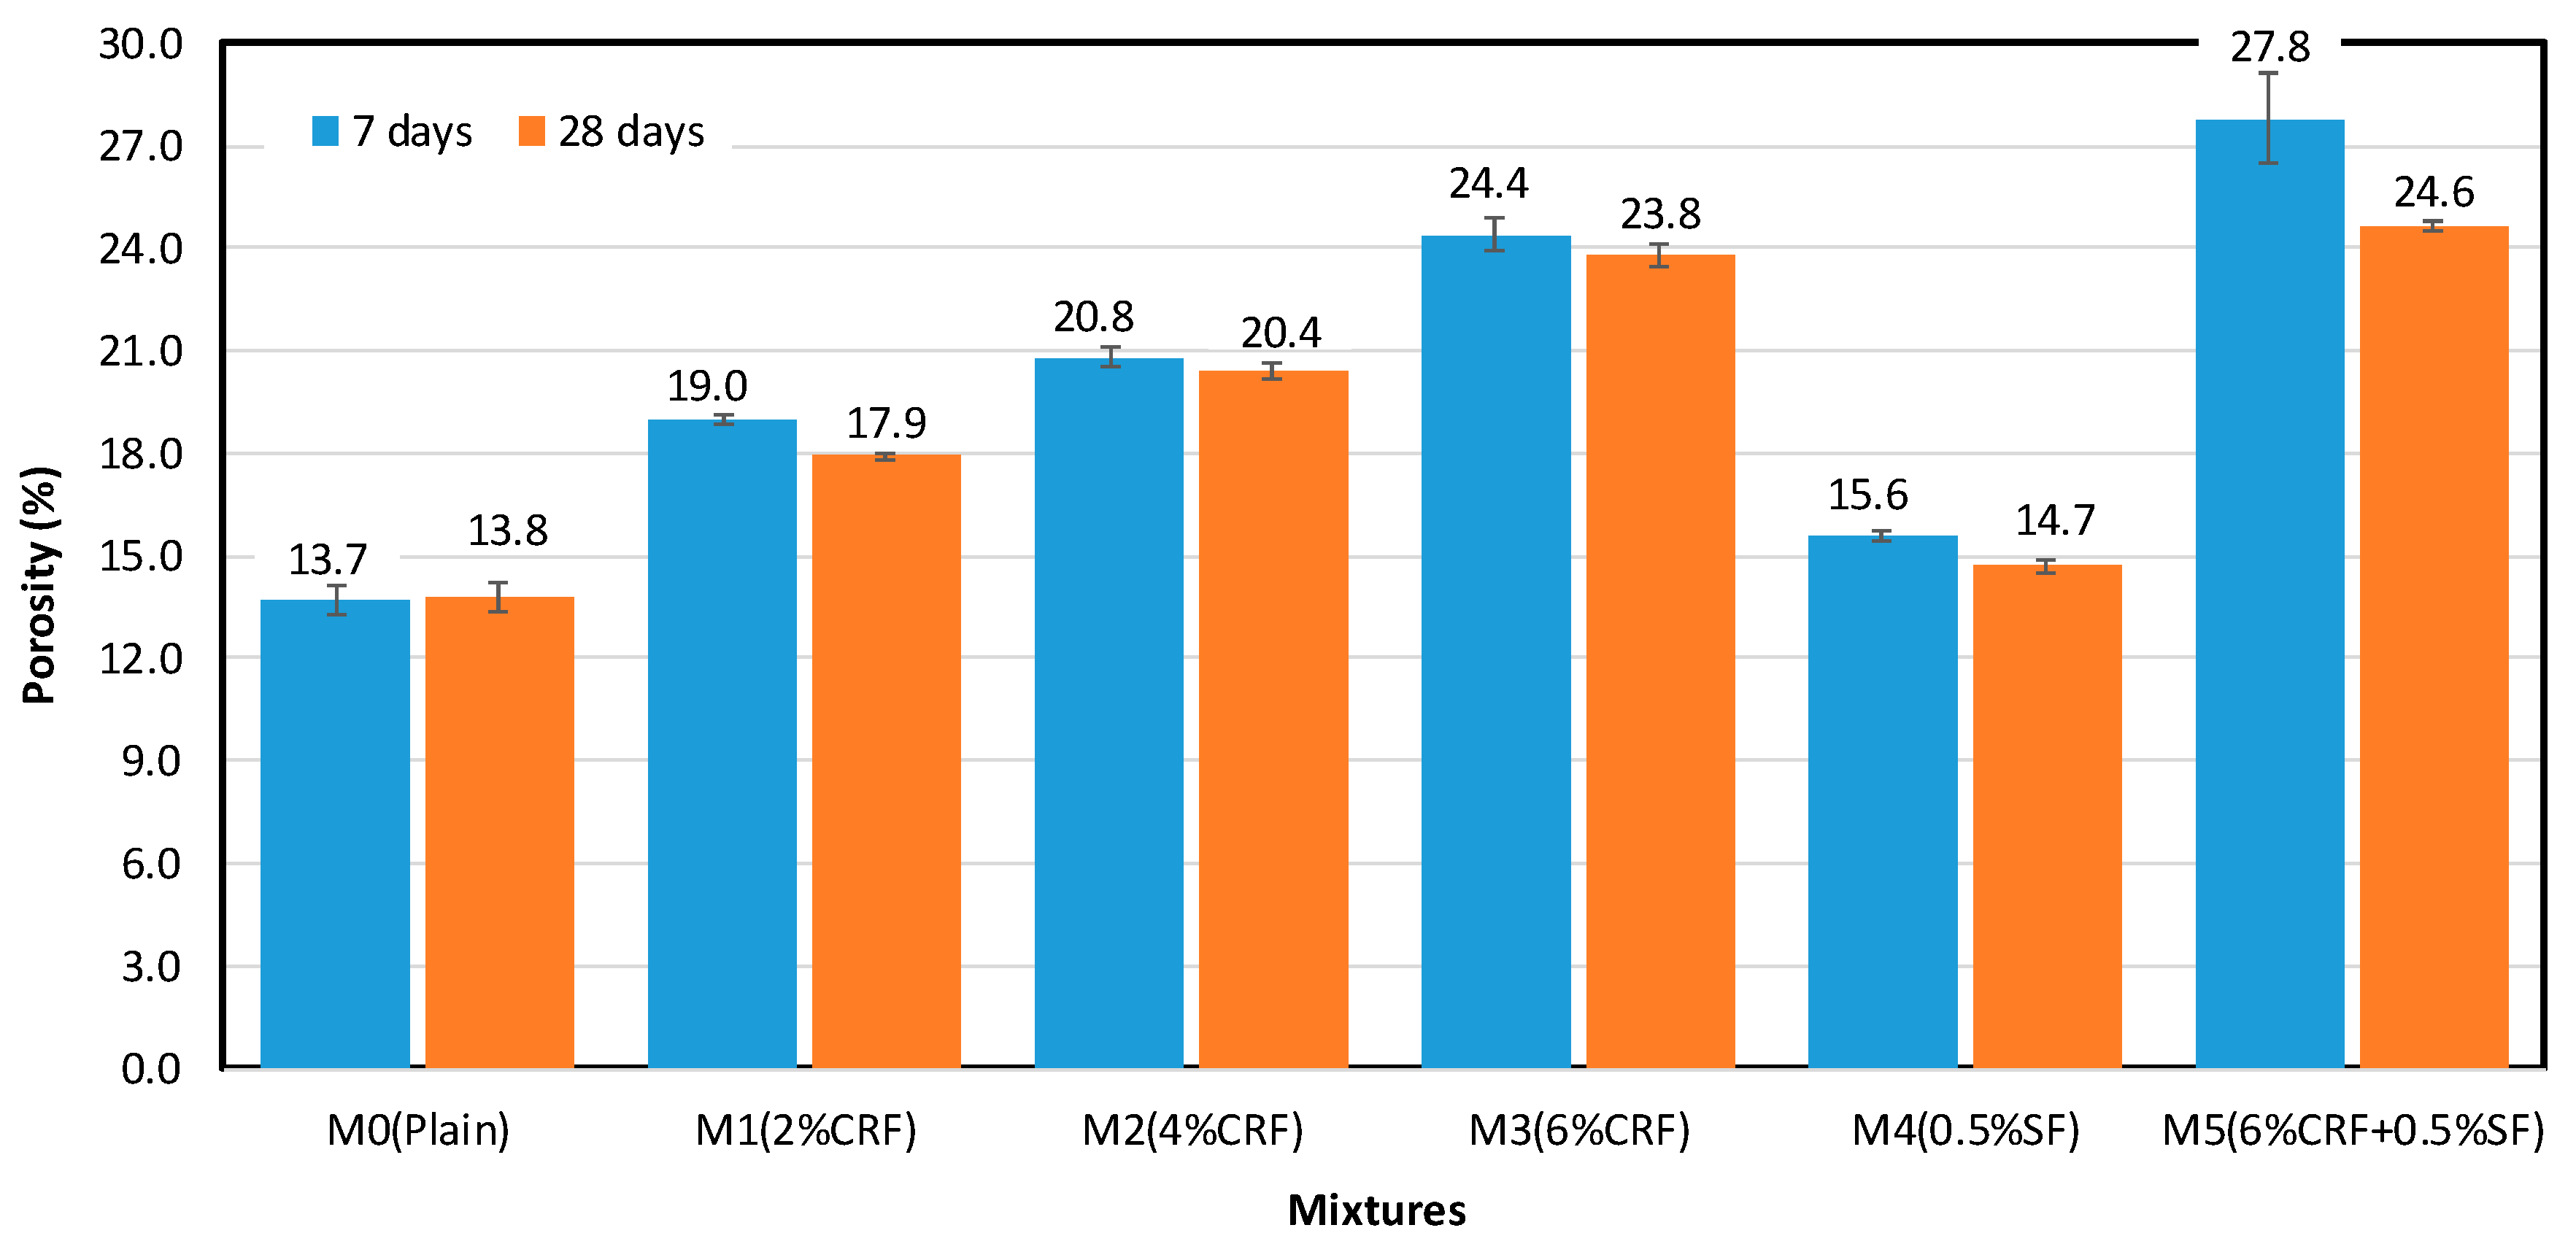
3.1.3. The Relationship between Porosity and CRF and SF Contents

Porosity results on each mixture are plotted in Figure 5. It is clear that the porosity results show the same trend as the AC results for all mixtures. Mixtures incorporated with CRF have a significantly higher porosity compared to both the plain mixture M0 and mixture M4 containing SF. Such high porosities of CRF mixtures may be caused by the high porosity of fibers of the common reed plant itself. For instance, the mixture M3 with the highest CRF content presents the highest porosity value of 24.4%, and mixtures M2 and M1 fall behind substantially, with a porosity of 20.8% and 19.0%, respectively. Mixtures M0 and M4 have an identical porosity value because neither of them contains any CRF. The control mixture M0 has a porosity of 13.7%, which ranges from 6 to 14% lower than other mixtures containing CRF. Interestingly, the porosity of mixture M4 is 1.9% higher than that of mixture M0. This may be caused by additional pores emerging on the interface between the surface of steel fibers and the mortar matrix. It seems that the cementing effect between steel and the aggregate is lower than between aggregate particulates themselves, but it is necessary to confirm this result with microstructural analysis using a scanning electron microscope (SEM). Lastly, the combination mixture M5 with CRF and SF has a porosity of 27.8%, which is the most considerable value compared to all other mixtures. This result is attributed to both of the reasons explained above, the porosity of CRF and inhibition of closing of pores by steel fibers.
The comparison of the porosity values of samples after 7-day and 28-day curing is also illustrated in Figure 5. The specimens cured for 28 days have a 0.1% to 3.2% lower porosity than the 7 day-cured ones. Similar to the AC results, the porosity of the mixture decreased with increasing curing age. This is a well-known phenomenon. During the hydration process, the hydration products of the concrete gradually fill capillary pores, and its porosity and permeability are eventually reduced. This trend in porosity is connected to the results of unit weight, and compressive and flexural strengths. The increase in porosity of the mixture causes the decrease in unit weight and both compressive and flexural strengths [38].

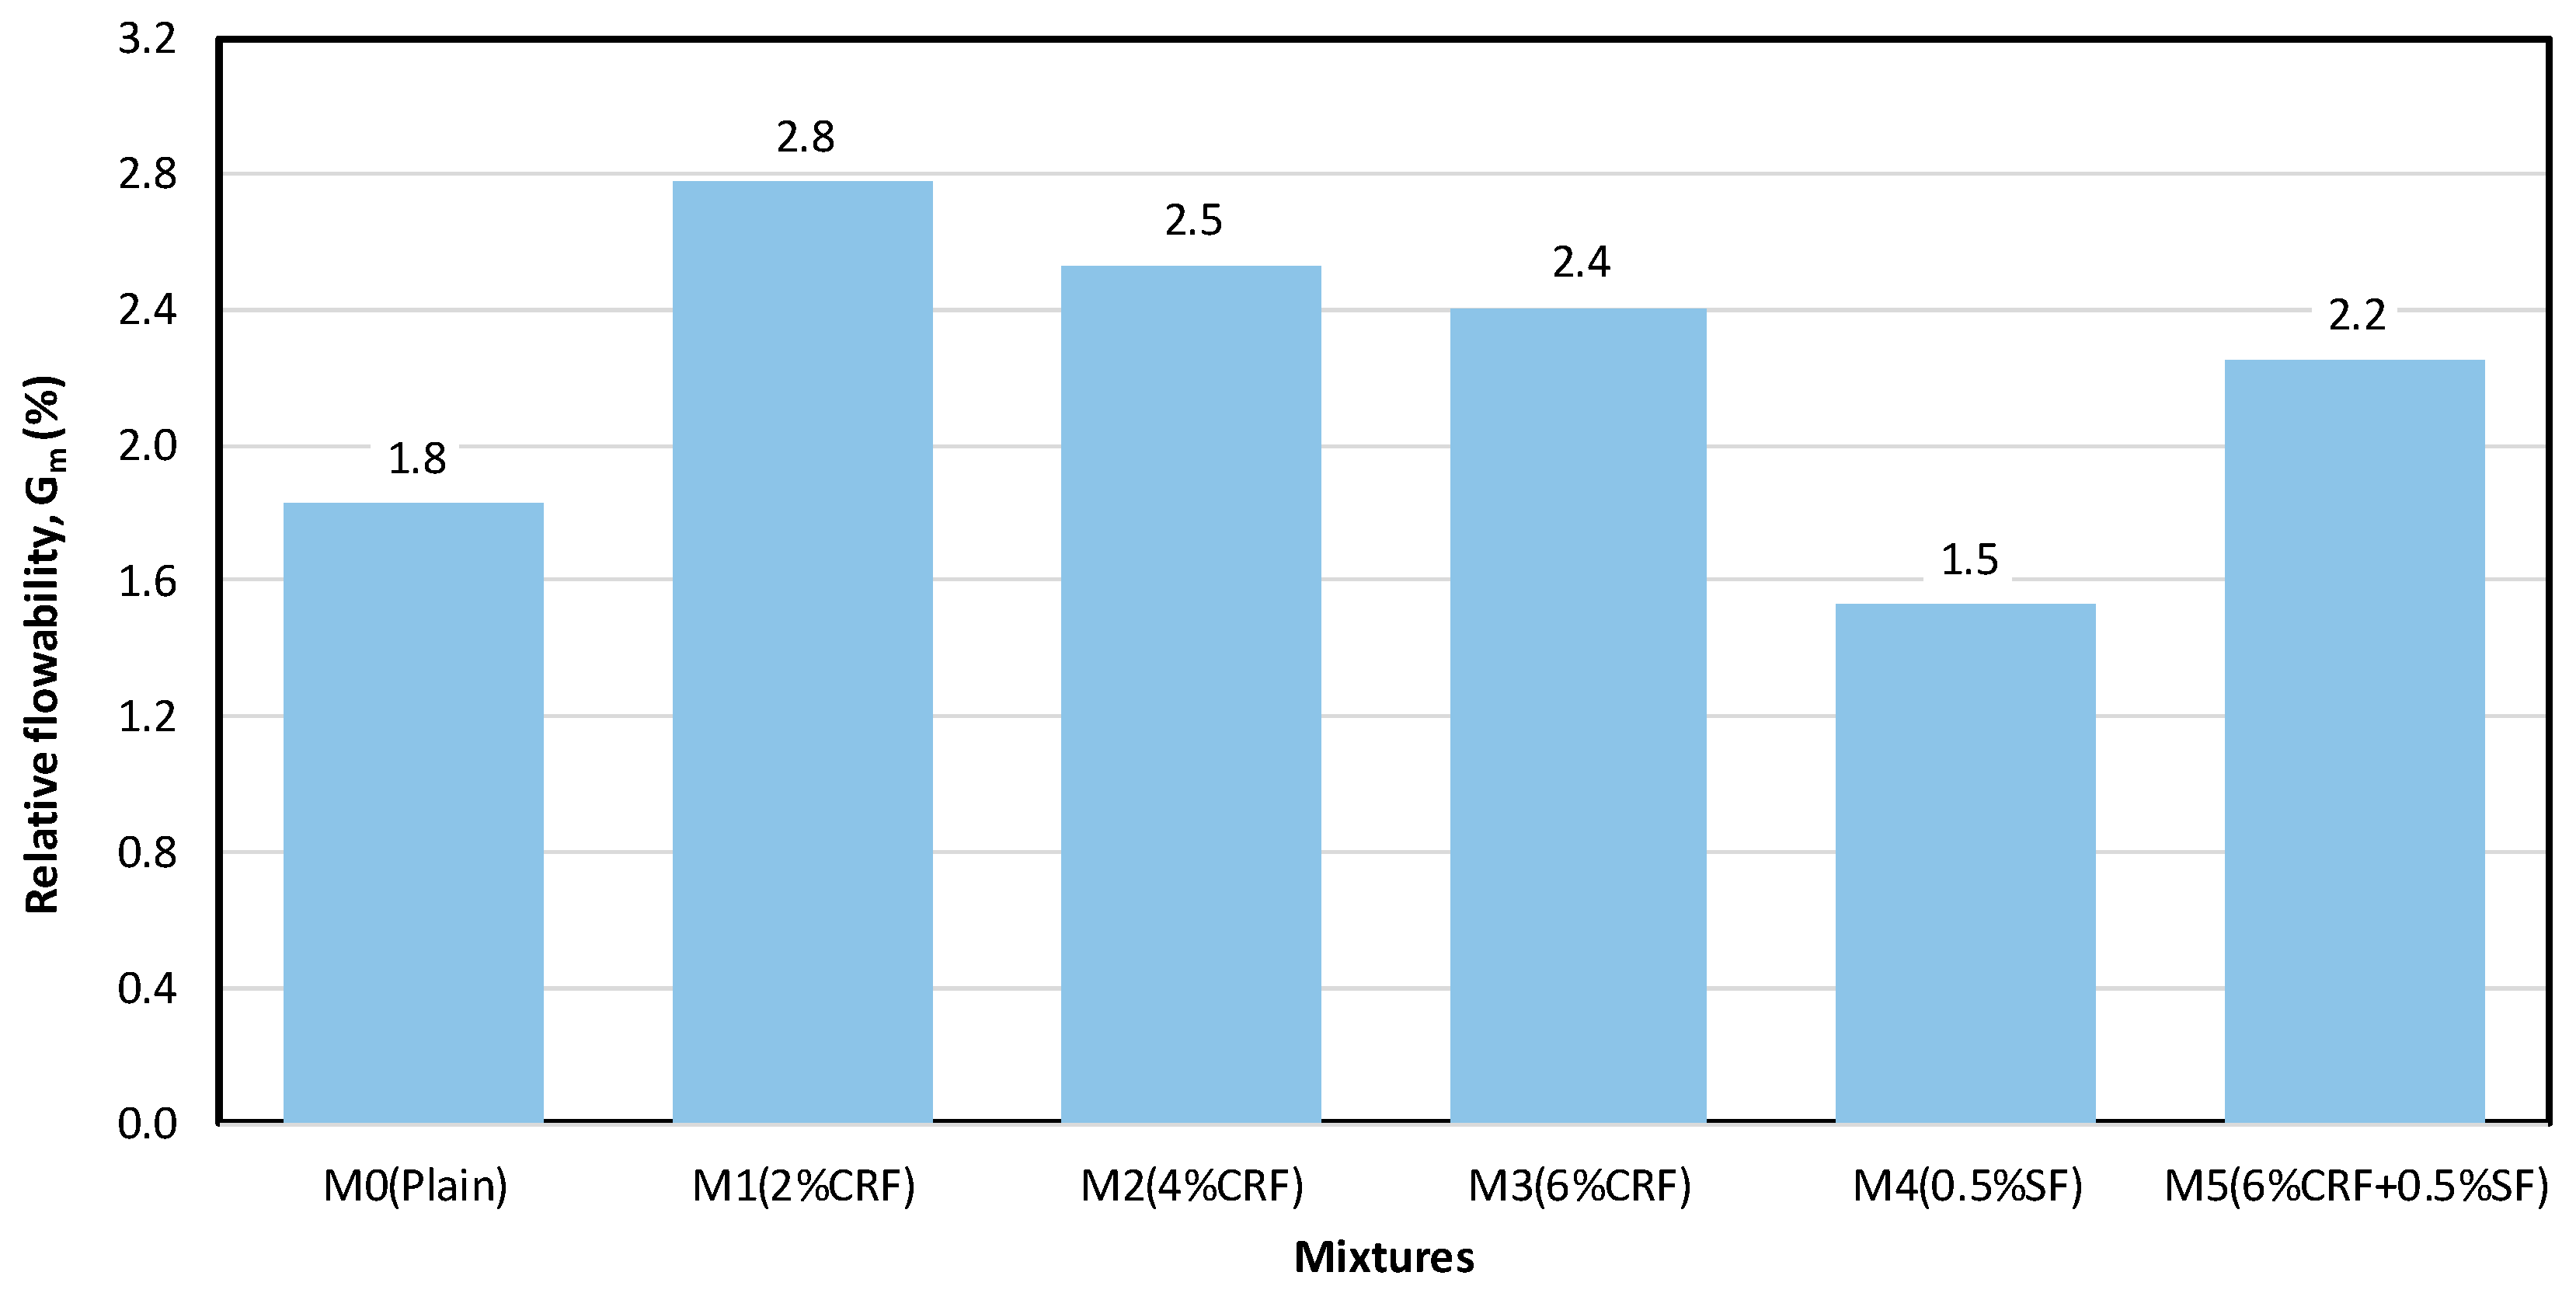
3.1.4. The Relationship between Flowability and CRF and SF Contents

To evaluate how the addition of fibers influences the flowability of the mixture, the flowability experiment has been conducted on a fresh mortar mixture immediately after the mixing procedure. As shown in Figure 6, the addition of fibers to the mixture influences the flowability of the mixture. For example, the flowability of mixture M4 containing SF is 0.3 points below that of control mixture M0, which means that the steel fiber seems to inhibit the flowability of the mixture. Since the shape and size of particles within a mixture always affect flowability, larger particles in the mixture will reduce the flowability and perfectly rounded particles will increase flowability. The size of SF incorporated in the mixture M4 is 35 mm, which is greater than the maximum size of sand used in the mixture (15 mm). Moreover, it should be noted that the steel fiber has an elongated shape and its tip at both ends is hooked. Therefore, the addition of SF causes a reduction of flowability of the mixture, as anticipated.
Figure 6 also presents the effect of CRF content on the flowability of the mixture. As the CRF content increases, the flowability of the mixture decreases. For instance, the flowability value of mixture M3 containing 6% CRF is 2.4%, while the mixture M2 with 2% CRF has 2.8% flowability. This result is due to the shape of CRF. The CRF has an elongated shape, and its average length is 15 mm. Thus, the unconventional and elongated shape of CRF reduces the flowability of mixtures.
Interestingly, mixtures incorporated with CRF exhibit greater flowability than plain mortar mixture M0. Such high flowability values may be caused by water absorption characteristics of CRF. During the mixing process, the aggregate can be capable of absorbing water relatively fast, while CRF requires a much longer time for water absorption to take place. For this reason, all mixtures containing CRF show higher flowability than control mixture M0. It should be noted that CRF was open air dried.
Finally, the combination mix M5 has greater flowability than control mixture M0 because of the water which offsets AC of 6.0% of CRF inside this mixture. Although this mixture M5 contains the same amount of CRF as mixture M3, its relative flowability is lower than that of mixture M3. This happens because of the steel fibers present in the combination mixture M5.

3.2. Evaluation of Mechanical Properties

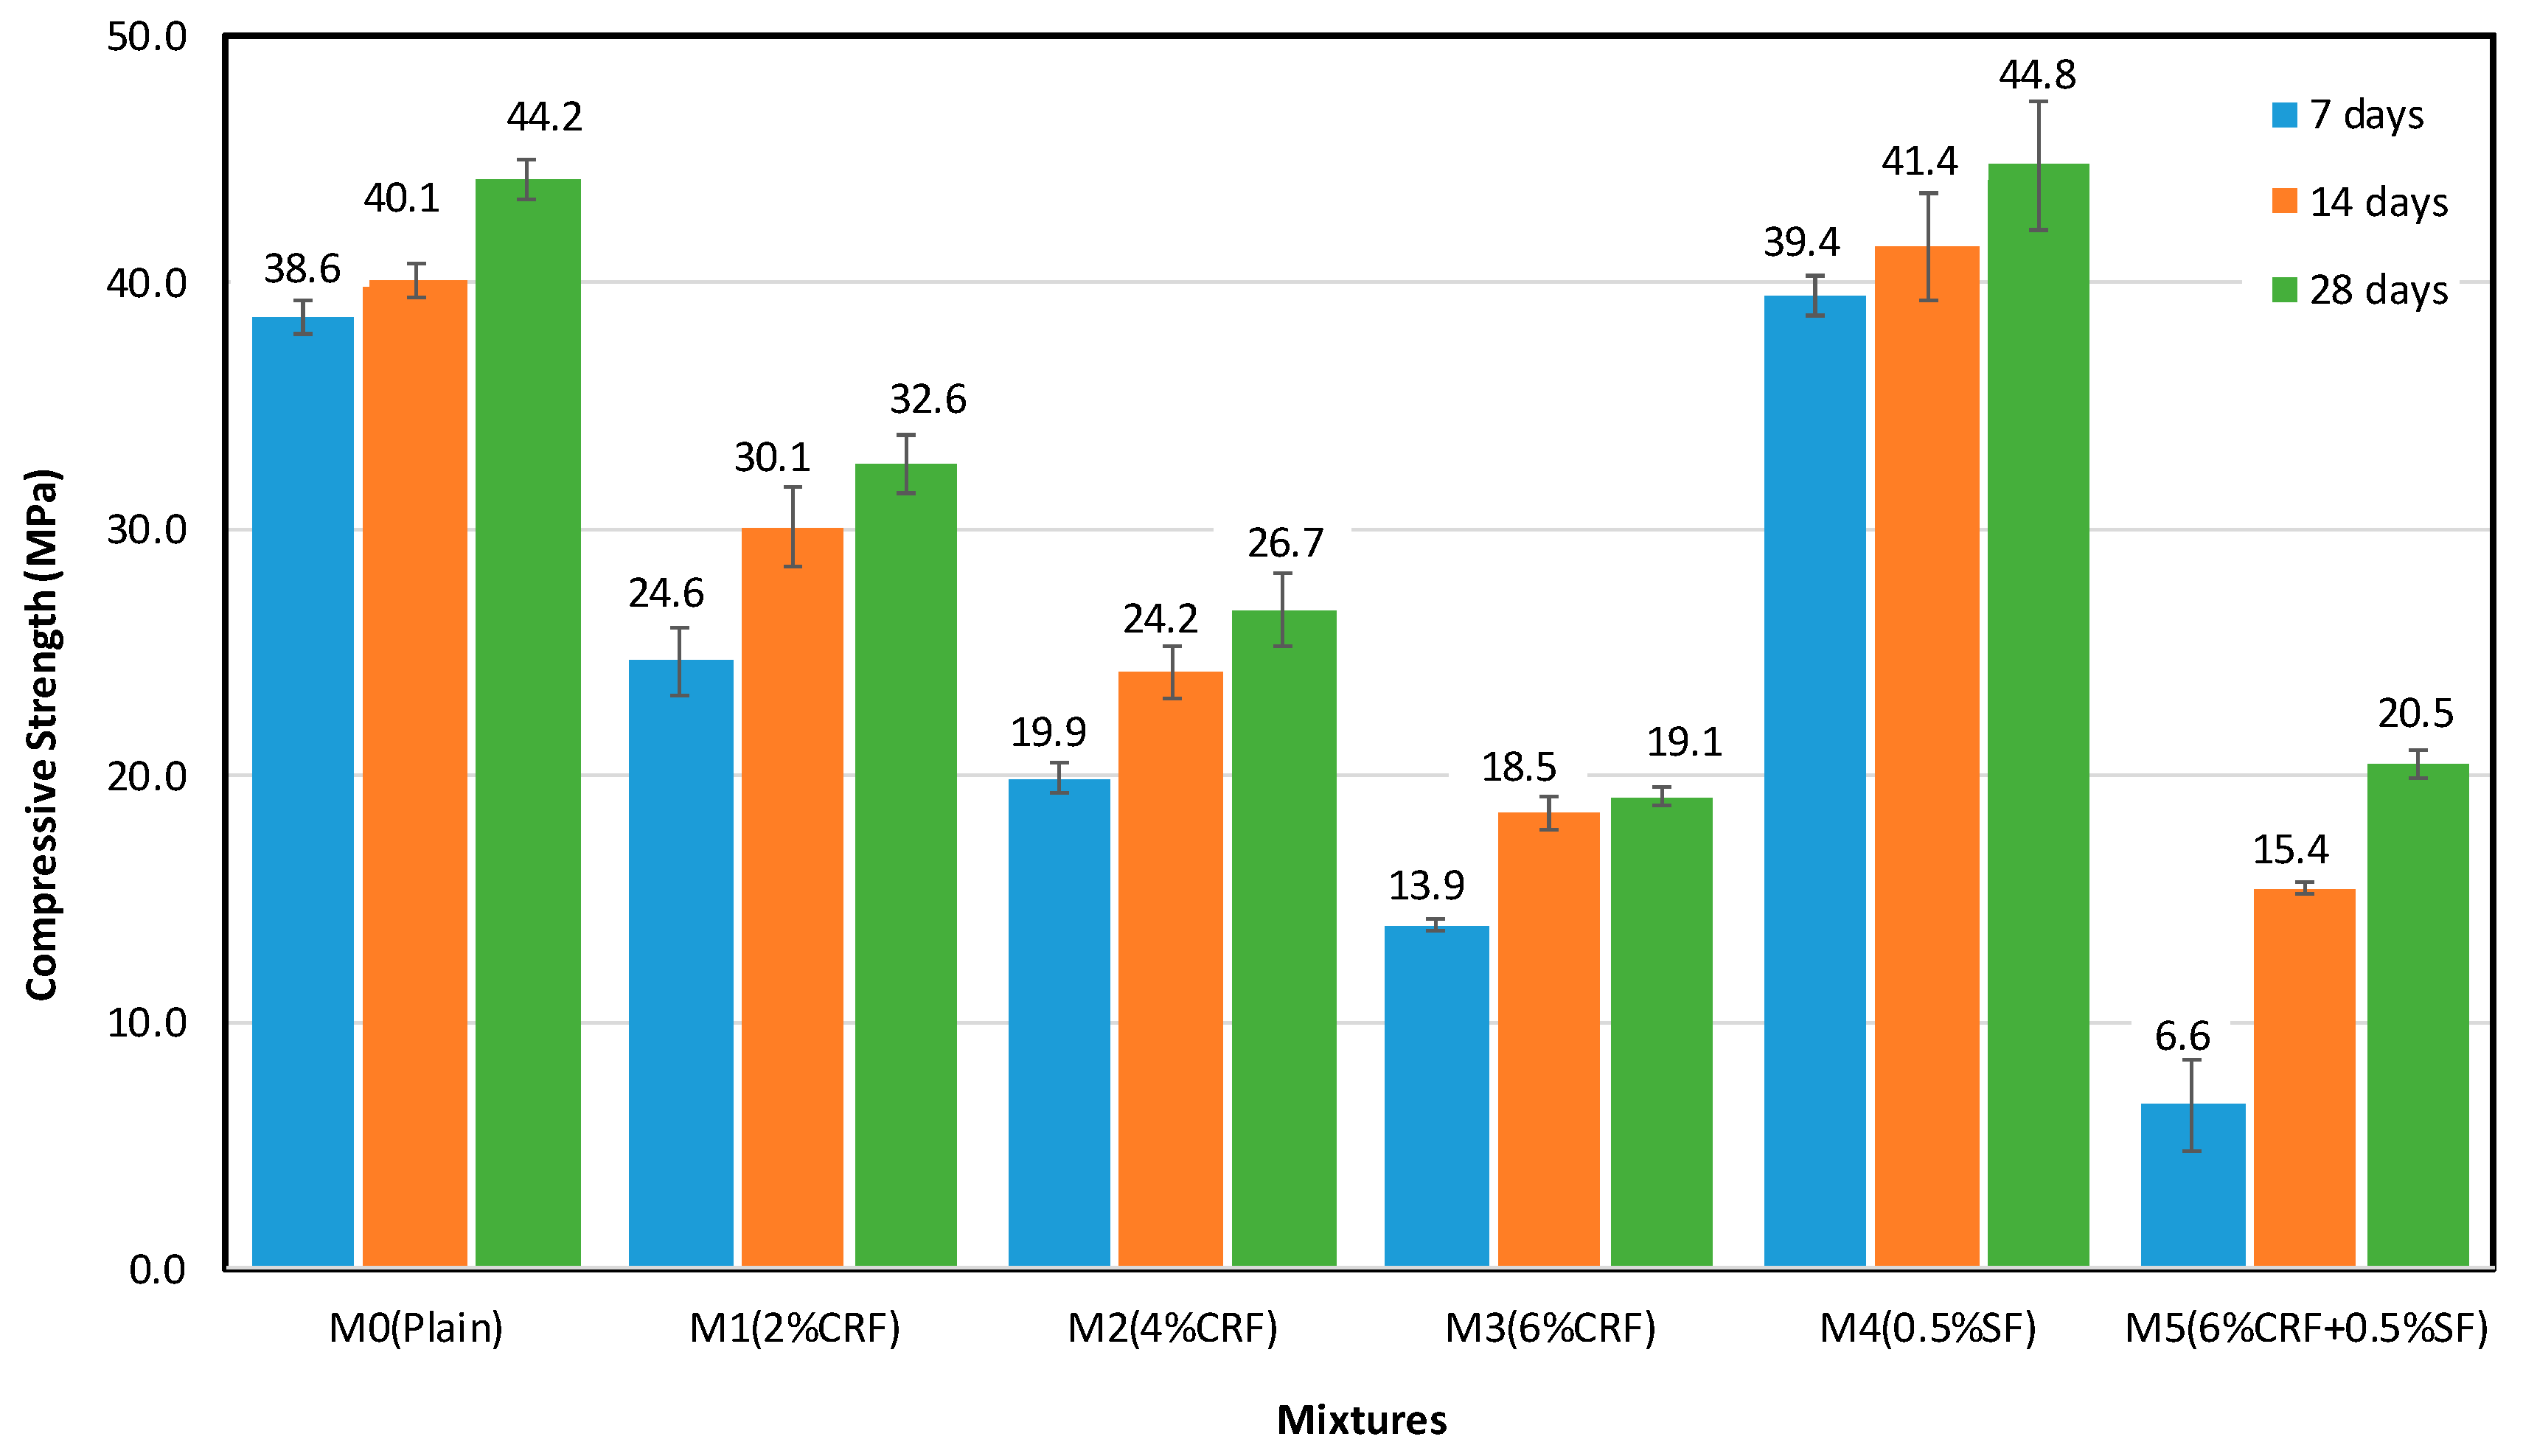
3.2.1. Compressive Strength of Mortar Mixture

Figure 7 shows the test results of the compressive strength of each mixture. In spite of the mixture type, the compressive strength of the mixture increased over time. The compressive strength of 28-day cured specimens is larger than that of 14-day cured ones, which, in turn, is larger than that of 7-day cured samples.
A mixture containing SF obtained the highest compressive strength of other mixtures. It seems that 35 mm long steel fibers with hooks at each end were capable of arresting the initial cracks inside the mortar matrix and therefore contribute additional resistance to compressive stress. This same effect, however, was not produced by shorter CRF without hooks, 15 mm. Compared to control mixture M0, the effect of SF on compressive strength development is minimal. Such insignificant strength improvement of M4 over the M0 mix may be attributed to the low content of SF and the slipping action between one steel fiber and another steel fiber due to the absence of steel to steel bonding. However, the likelihood of that is minimal because the mixture M4 only has a 0.5% volume fraction of SF.
As expected, the addition of CRF to the mixture proportionally induced the decrease of compressive strength. Therefore, the lowest 28-day strength (19.1 MPa) is associated with mixture M3 with CRF of 6.0% volume fraction. This value indicates a 57% strength reduction compared to the control mixture M0. This may be due to the interlocking strength between the aggregate and CRF, which is significantly lower than between the aggregate particles. Furthermore, with a higher fraction of CRF (e.g., 6.0%), there are more close concentrations of CRF with no bonding between CRF particles themselves. The CRF aggregate is aggregated into clumps that possess very weak stress resistance due to the slipping action between CRF particles. Another possible reason is the breaking of CRF under stress inside the sample. Although the strength of CRF itself was determined to be 112 MPa, it should be noted that this strength magnitude of CRF could be deteriorated inside the concrete matrix due to the water absorbed by CRF underwater curing over time. Additionally, strength is a function of porosity, as a higher porosity is associated with a lower strength of the material. From an earlier examination of porosity, it has been established that the addition of CRF increases the porosity of the mixture, resulting in a decrease in compressive strength.
Interestingly, the mixture combined with SF and CRF did not provide significant strength improvement. The mixtures M5 and M3 demonstrate compressive strength values of 20.5 MPa and 19.1 MPa at 28 days, respectively. Moreover, the compressive strength of mixture M5 at both 7 and 14 days was lower than that of mixture M3. This may be due to a slipping action between the steel fiber and CRF due to the absence of steel to CRF bonding. Unlike in the case of mix M4, discussed earlier, the hooking effect of SF is minimal and the probability of the slipping mechanism between CRF and SF is much higher for combination mixture M5. Because mixture M5 contains a substantially larger quantity of additives (0.5% SF and 6.0% CRF in volume fraction), this causes both fibers to aggregate into clumps that possess very weak stress resistance due to slipping action between SF and CRF and no bonding between steel and CRF, especially at an early age. Lastly, it is worth noting that the observed general trend of decreasing compressive strength corresponds well with the pattern of decreasing unit weight of relevant mixtures. Therefore, for each mixture, a lower unit weight indicates a lower compressive strength.

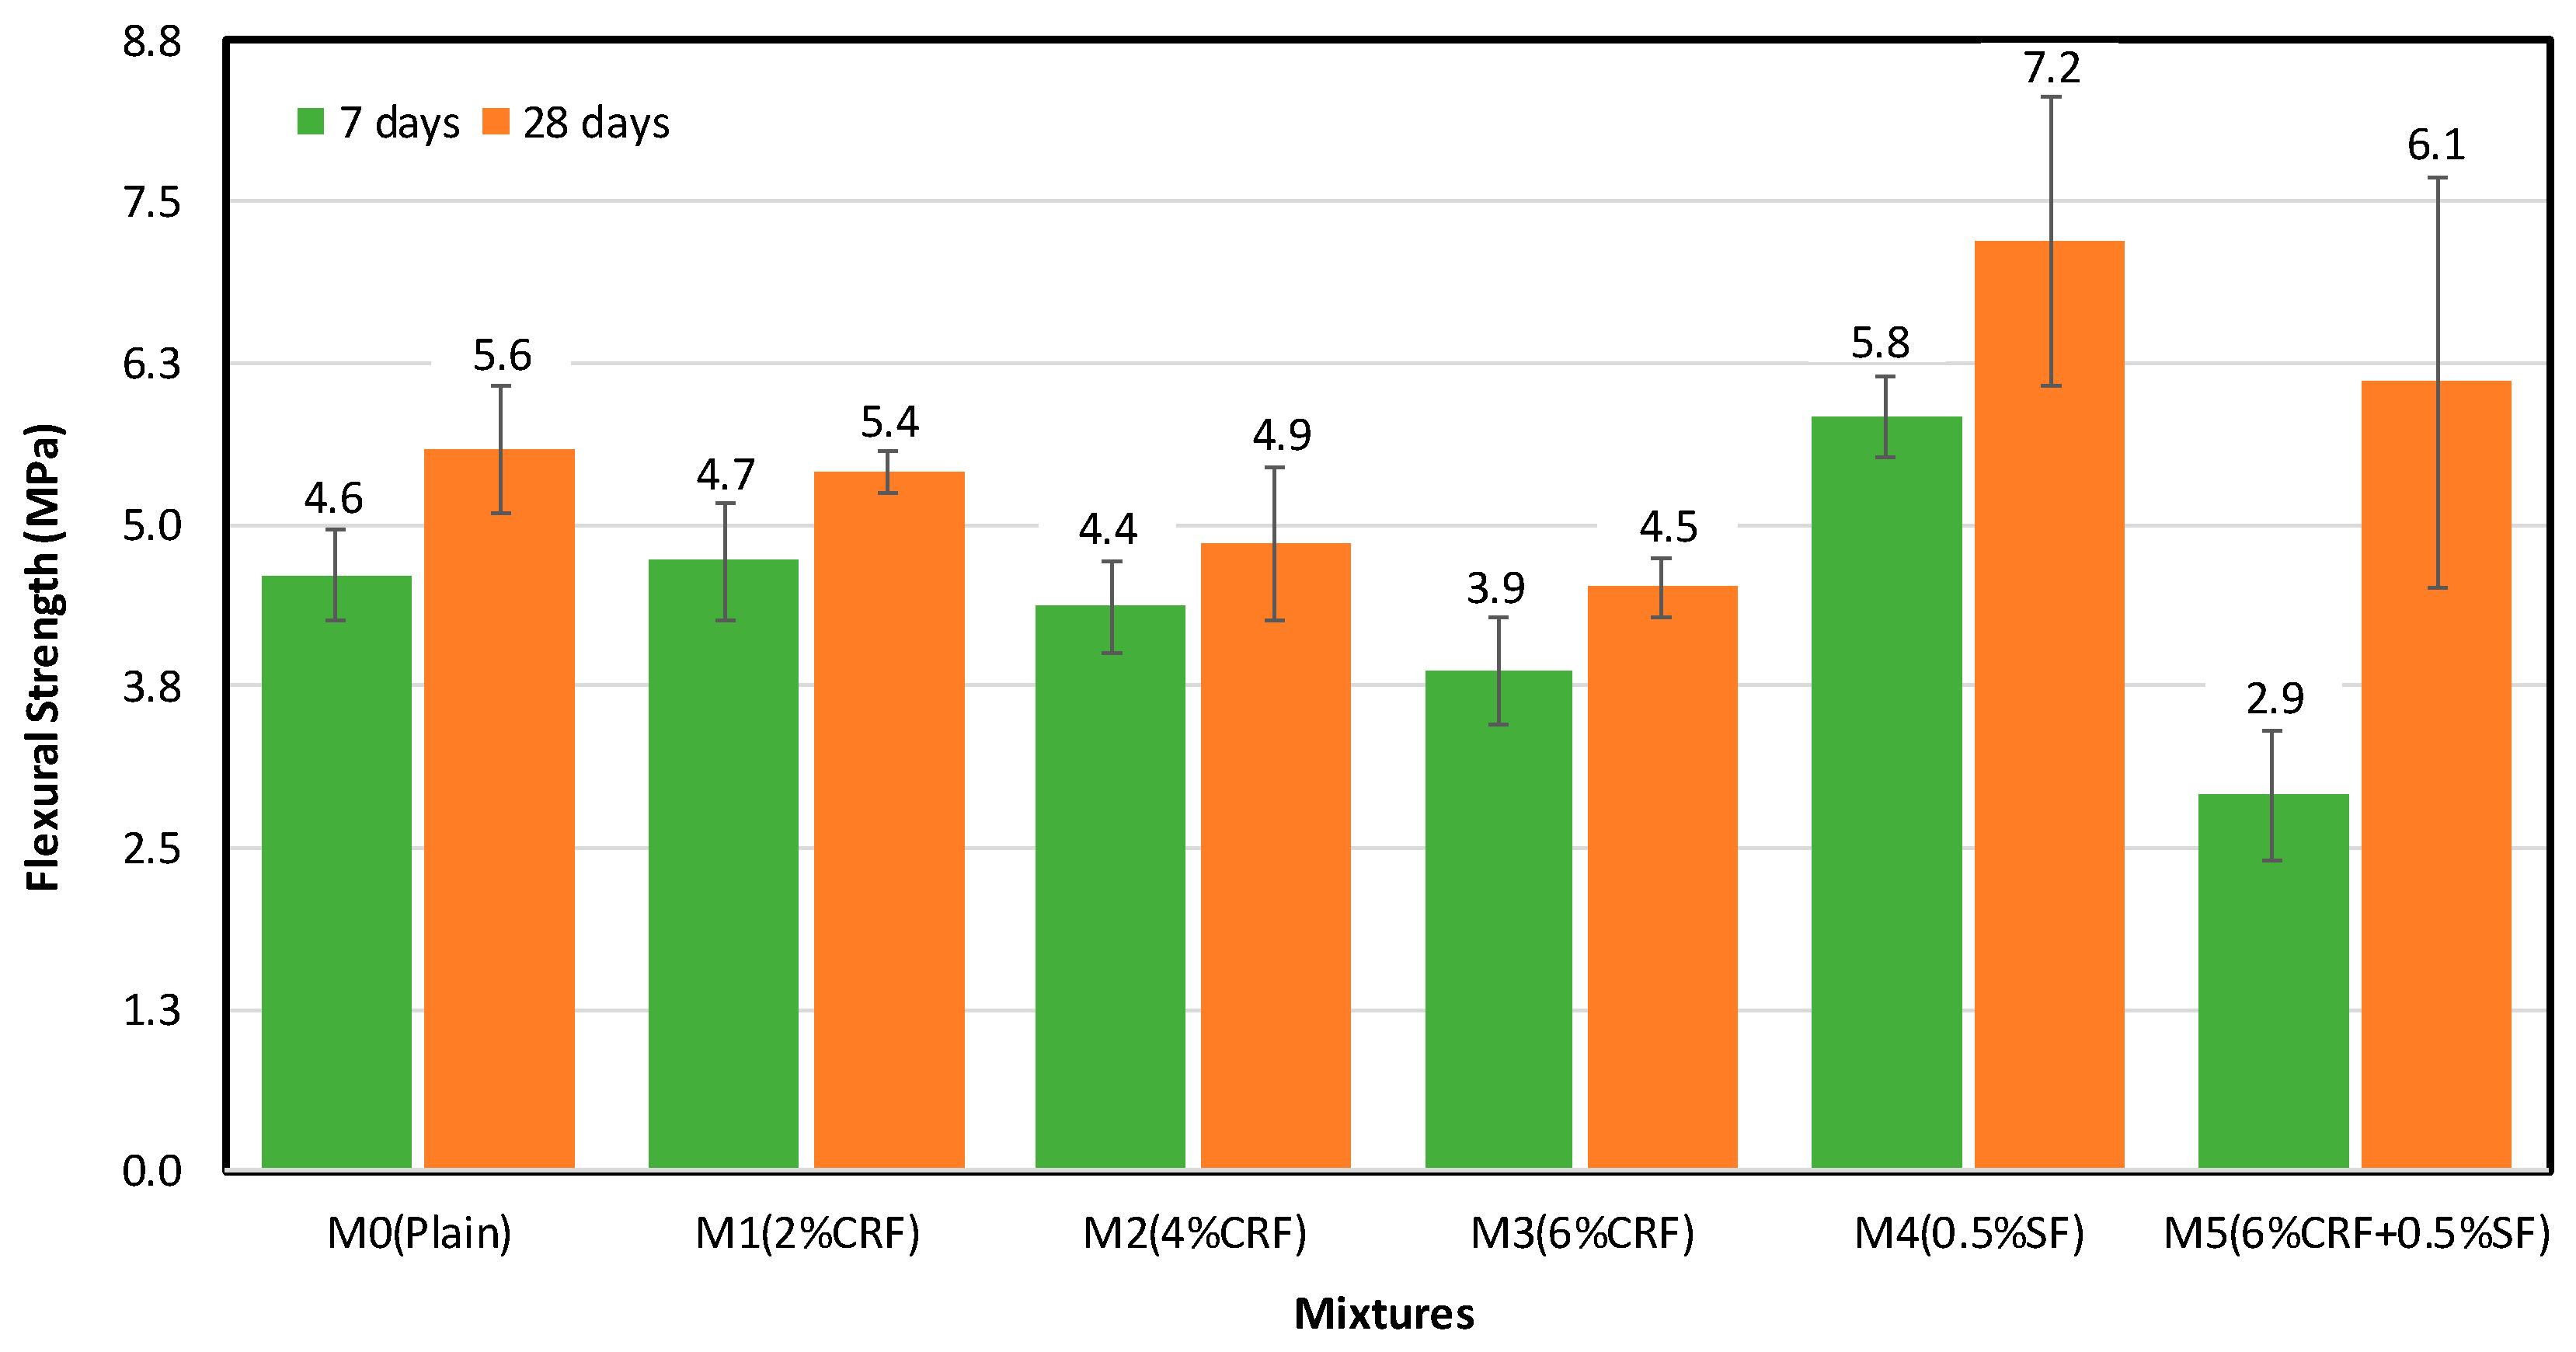
3.2.2. Flexural Strength of Mortar Mixture

Seven- and 28-day flexural strength results of all mixtures are given in Figure 8. As the hydration of concrete proceeds, the flexural strength of the mixture increases. Samples cured for 28 days exhibit higher strength values than samples cured for 7 days. This is a very similar trend as that shown by compression strength data, except for the 7-day strength of mixture M1, which shows a higher flexural strength than the control mixture M0. However, the strength difference between these two mixtures is 0.1 MPa.
Figure 8 also presents the effect of the addition of CRF on the flexural strength of the mixture. Similar to the compressive strength test results, the flexural strength of mixtures containing CRF proportionally decreases as the number of CRF increases, regardless of curing age. For example, control mixture M0 has a flexural strength of 5.6 MPa, while mixtures M1 through M3 have a flexural strength of 5.4 MPa, 4.9 MPa, and 4.5 MPa, respectively. It seems that there is no positive effect to increase the flexural strength using CRF, unlike with other fibers, such as steel fibers and plastic fibers. This result may be explained by similar reasons discussed in detail for compression strength: low aggregate to CRF bonding strength, clumps of CRF, higher porosity, and breaking of weak CRF. Interestingly, visual observation of the samples, as shown in Figure 9, indicates that there is no grip between the fibers and concrete matrix for a prevailing failure mode of beam specimen.
This may be the case because CRF is too short (15 mm) and does not have an effective means of grip, like the hooks on steel fibers. The short CRF has a small surface area which does not generate enough mechanical grip and/or physical interlocking between CRF and the aggregate. The unprocessed CRF does not possess the surface roughness for mechanical grip in the mortar matrix. Moreover, the untreated CRF has a weak chemical adhesive property to bond with the mortar matrix. Therefore, chemical and/or mechanical pretreatment may be recommended to improve the bonding and grip of CRF and the mortar matrix. Instead, this means that all of the surface areas of fibers create a large failure surface inside the material, which was nonexistent in the plain concrete. For this reason, beams containing CRF lose some flexural strength.
As expected, mixture M4 has the highest flexural strength of 7.2 MPa, which is 29% higher than that of control mixture M0 (5.6 MPa). This is explained by steel fibers arresting the initial cracks at fracture and thereby lending some of their strength to the composite. The strength of such a composite is therefore as high as the bond strength between steel fibers and the mortar matrix. The hooks on steel fibers significantly facilitate such a bond strength.
The combination mixture M5 containing 6% CRF and 0.5% SF shows a higher flexural strength than mixtures M0 and M3 at the 28-day point. This means that there may be a synergetic effect between the CRF and steel fiber inside the mortar mixture. The addition of steel fibers successfully compensated for the loss of strength accrued because of CRF.

3.3. Evaluation of Thermal Properties

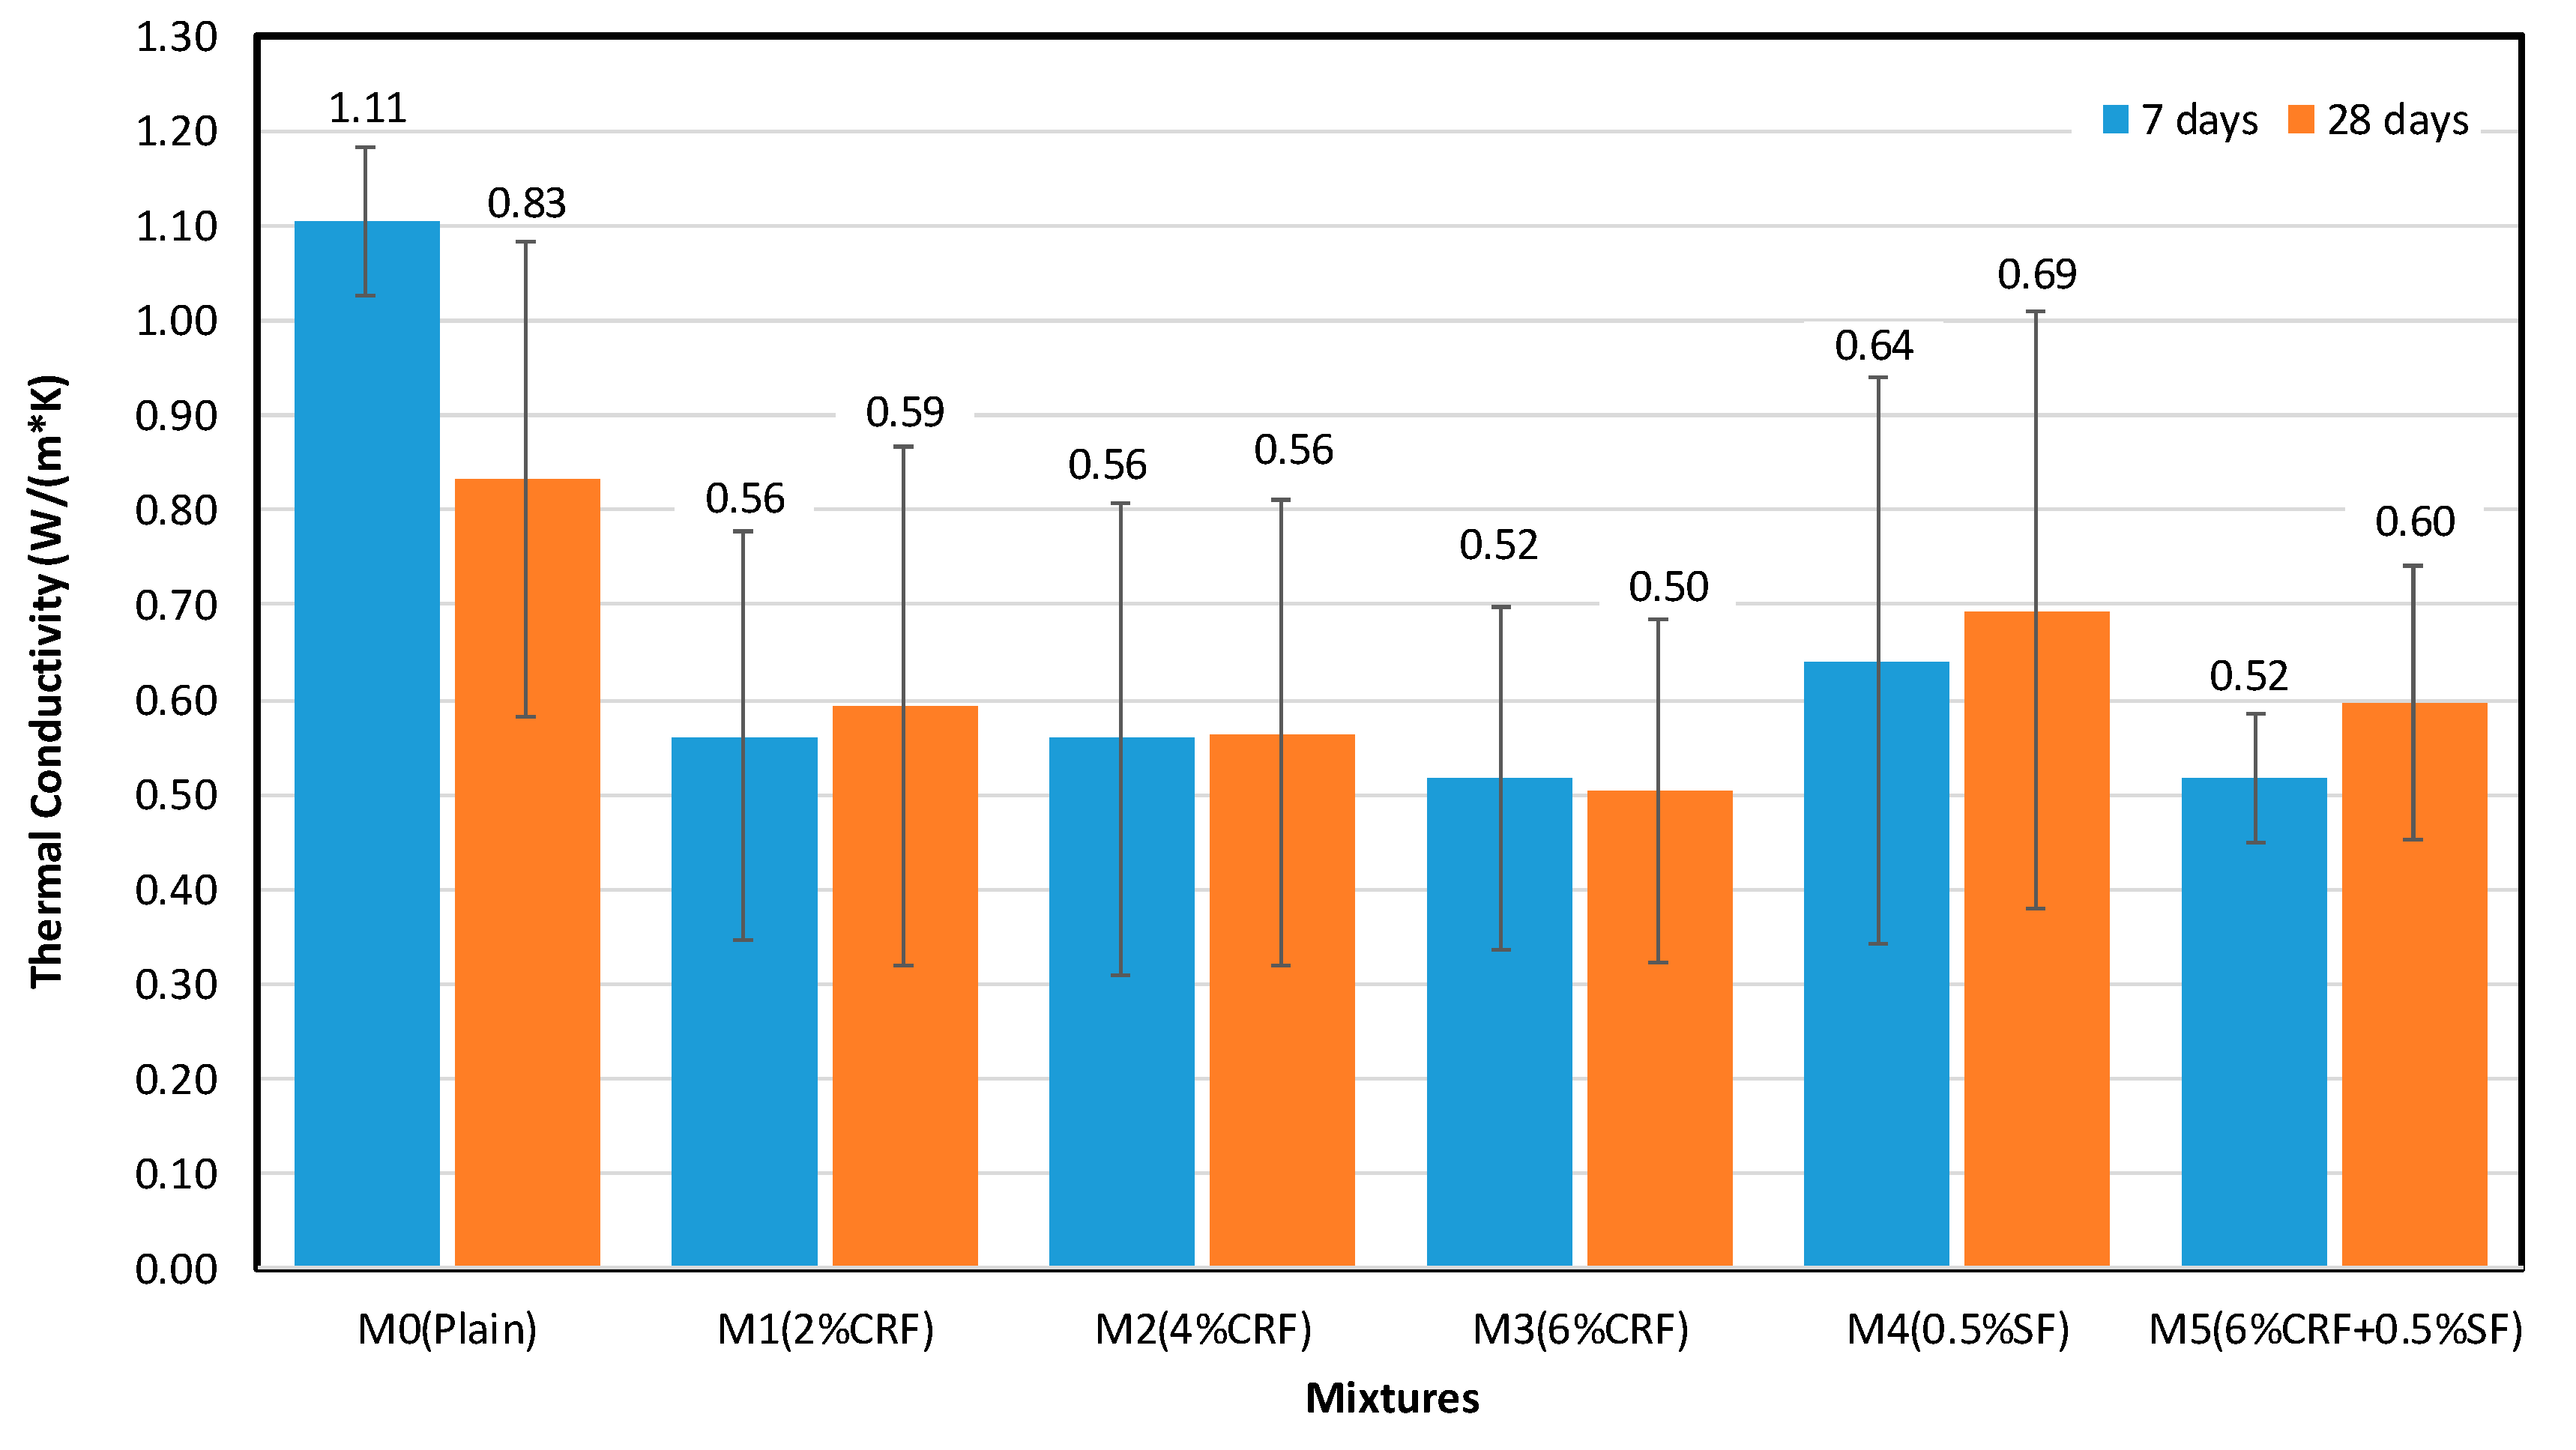
3.3.1. Thermal Conductivity of Mortar Mixture

The thermal property of the mortar mixture containing CRF was examined using the measurement of thermal conductivity (λ) values of plate samples for different mixtures at 7- and 28-day of curing. This λ value indicates the ability of construction material to keep heat energy inside or prevent it from leaving the structure. A smaller λ value would lower the heating load in the winter time and air conditioning load in the summer time on a building, therefore contributing to the sustainability benefit of the chosen material. The obtained λ values were used to calculate the total heat loss and heat transfer through a wall within a building in Astana.
The λ of different mortar mixtures at 7- and 28-days is presented in Figure 10. The plain mixture has a much higher λ than mixtures possessing CRF. For example, the control mixture M0 cured for 7 days has a λ of 1.11 W/(m·K), which is approximately two times more than that of all other mixtures at the same curing age. For CRF mixtures, the measurements of λ generally display the expected trend of decreasing thermal conductivity with a higher CRF content. Mixtures with CRF, M1, M2, and M3 exhibit lower λ values of 0.59 W/(m·K), 0.56 W/(m·K), and 0.50 W/(m·K) at 28 days, respectively. This result is in good agreement with published works using different agricultural materials: the higher the agricultural materials content, the lower the λ [38,39]. Especially, in the study of evaluating the hygrothermal performance of hempcrete for Ontario (Canada) buildings, Dhakal et al. [39] reported that this result was attributed to the fact that the addition of fibers in the concrete mixture improves the moisture retention and buffering, which lead to reducing the λ. They also reported that the λ values for hempcrete mixtures with hemp to binder ratios of 1:1, 1:1.5, and 1:2 were 0.074 W/m·K, 0.088 W/m·K, and 0.103 W/m·K, respectively. However, the improvement of λ in the mixture with CRF shown in Figure 10 is limited. It should be noted that the CRF content with a maximum of 6% was used by volume of fine aggregate in this study.
Figure 10 also shows the effect of curing age on the λ of different mortar mixtures. For the plain mixture, the λ of the sample cured for 28 days is lower than that cured for 7 days because of hydration. During the hydration process, liquid phase in the concrete is converted into solid phase, which leads to decreasing the λ of the mixture [40,41]. However, curing time appears to have some effect on the λ of mixtures containing CRF, but the trend is not conclusive. For some mixtures, a longer curing time is associated with a higher λ. For instance, mixture M3 shows a lower λ at a later curing age, while mixture M2 experiences no appreciable difference in λ between 7- and 28-day curing ages.

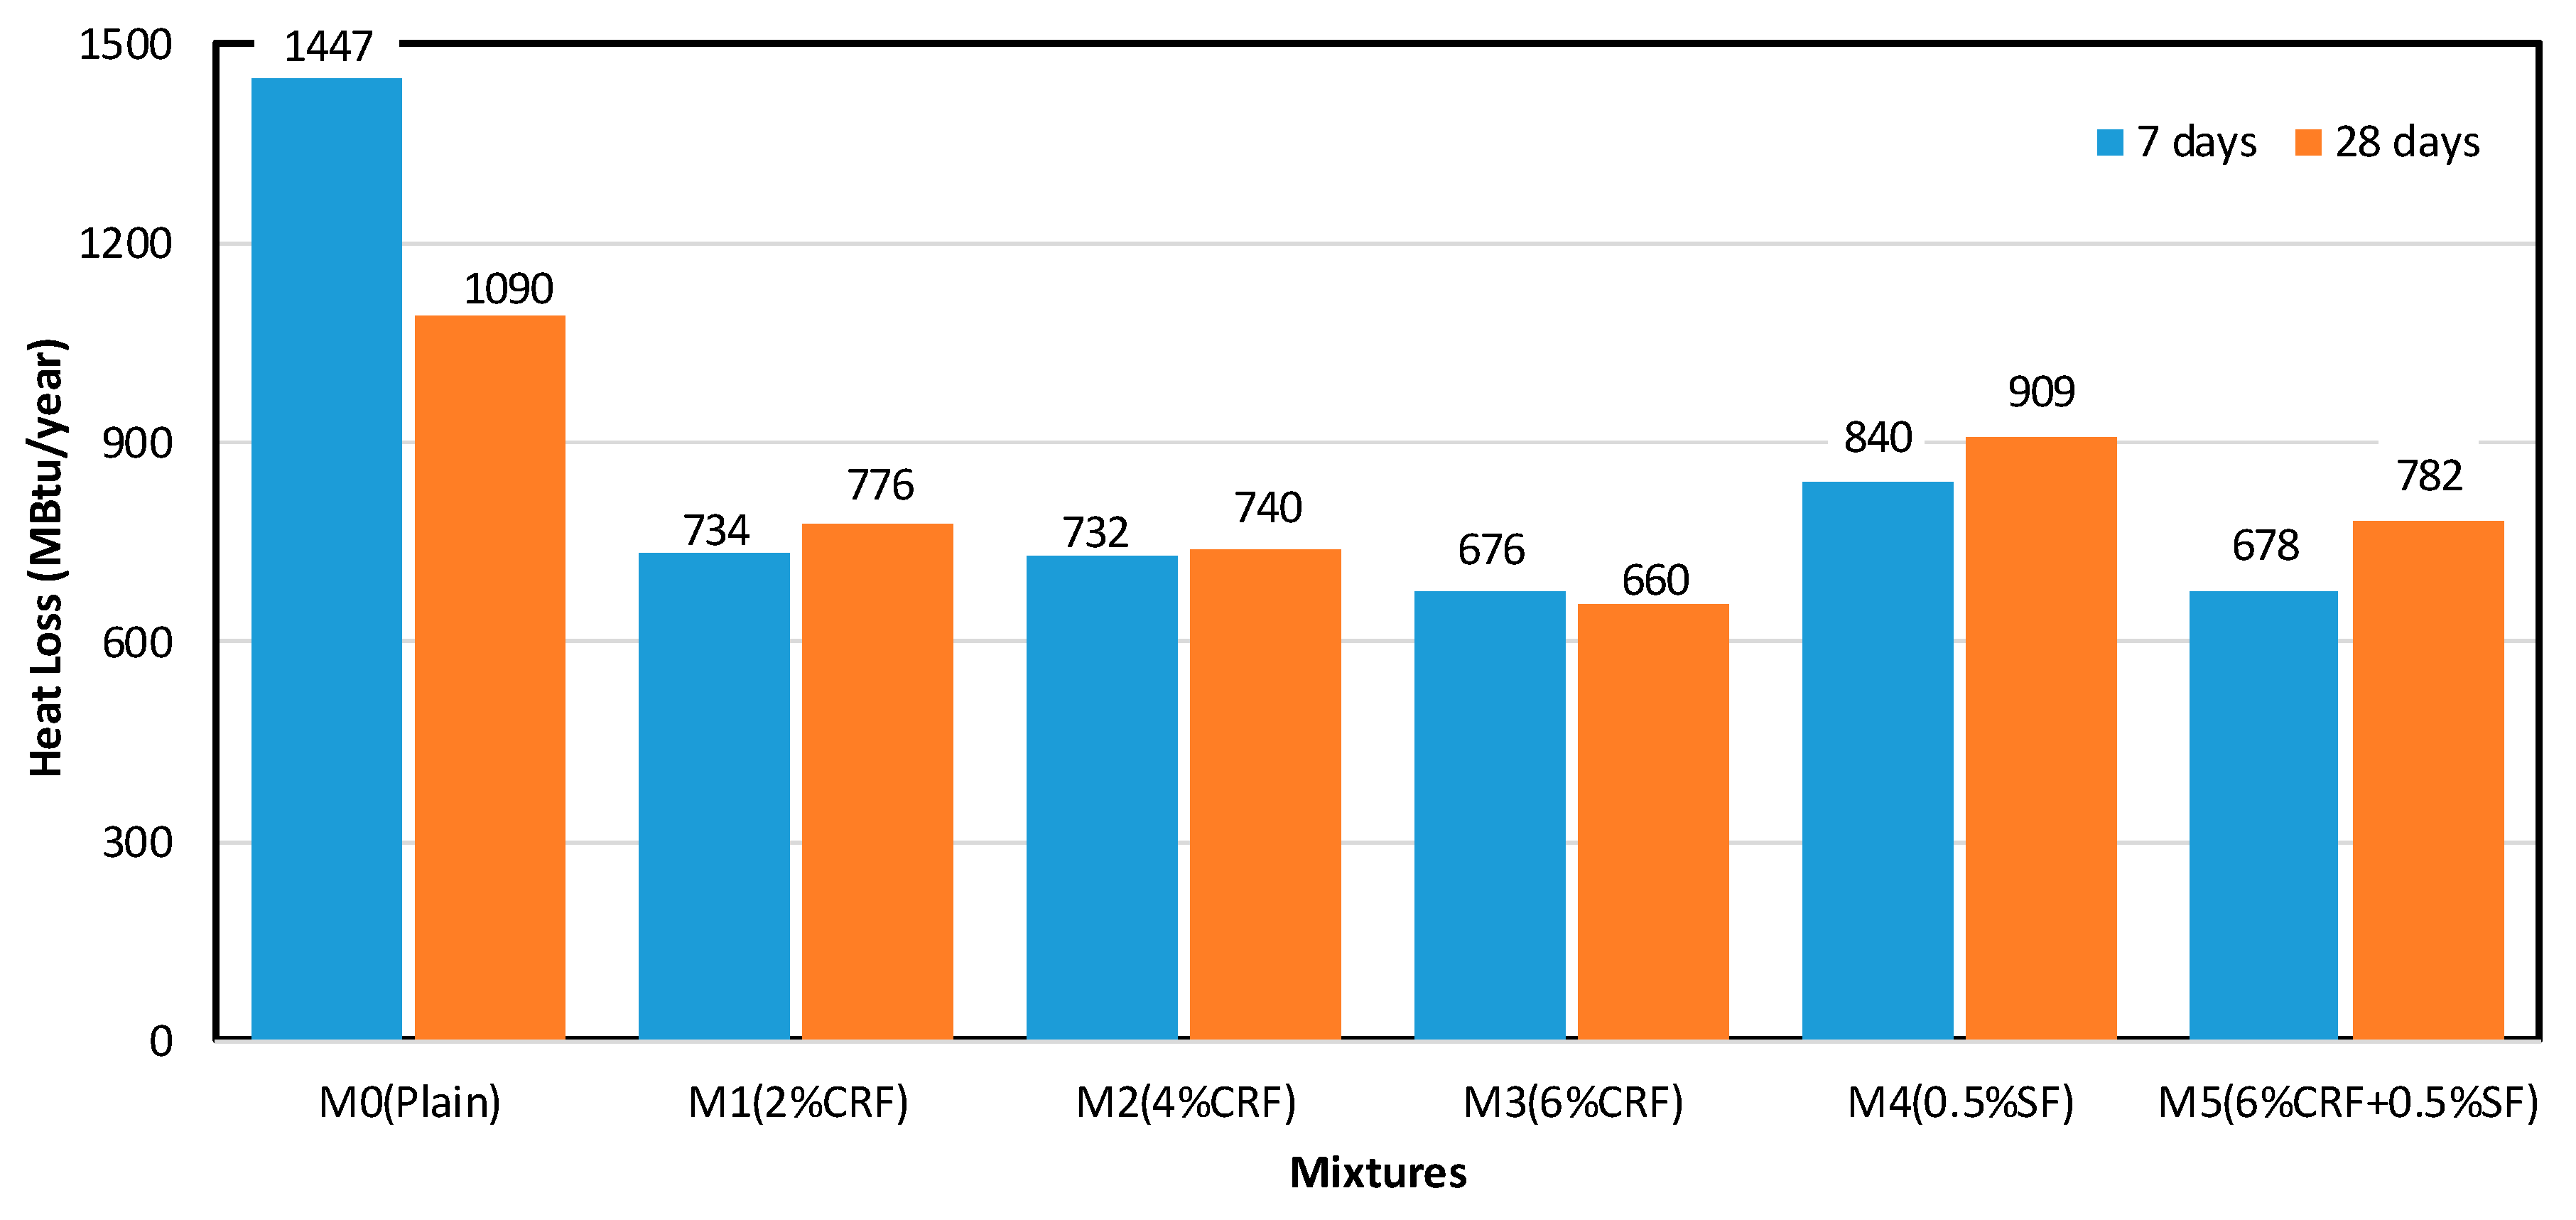
3.3.2. Evaluation of Heat Loss of Mixture

In the previous mechanical properties section, it was found that the use of CRF in the mortar mixture does not improve the compressive and flexural strengths compared to the plain mixture. However, in terms of strength, the mixtures containing CRF are still in a structural lightweight concrete category, which has 1840 kg/m3 and 17.0 MPa. To investigate more applications of CRF mixture (e.g., an insulating material), heat loss through the walls of a building was calculated. The concept of heat loss per degree day (HLPDD), which is the loss per day with one degree between inside and outside temperature, was used. The HLPDD was calculated using Equation (5).
Q = A × ( T i n s i d e T o u t s i d e ) R × 24 hr day
where, Q = heat loss per degree day; A = total wall area [ft2]; TinsideToutside = 1 °F; and R = thermal resistance [hr·ft2·F/Btu].
To obtain the thermal resistance value, Equation (6) was used.
R = l λ
where, R = thermal resistance; l = thickness of concrete layer [ft]; and λ = thermal conductivity [Btu·in/hr ft2·F].
A typical local building geometry is assumed for calculations of HLPDD and heat loss for the entire heating season for all six mixtures. The other condition includes a one story house and walls of the whole building made of the same material. As an example, the calculation procedure for mixture M3 containing 6% CRF is as follows:
According to ASHRAE Handbook Fundamentals [42], annual heating degree days (HDD65), which is used to calculate the amount of energy needed for residential space heating during the cold season in Astana, is equal to 10,291. A typical local building geometry and property of the material for calculations of HLPDD is presented in Table 3.
Using Equation (6):
R = 11.811 in . 3.58   Btu · in hr · ft 2 · F = 3.30   hr · ft 2 · F / Btu
Now, substituting all the values into Equation (5):
Q = 9020.16   ft 2 × 1 ° F 3.30   hr · ft 2 · F / Btu × 24   hr day = 65,672 Btu degree   day
To calculate the annual heat loss, the HLPDD is multiplied by the annual degree days in Astana.
Q = 65,672 Btu degree   day × 10,291 degree   day = 676   MBtu / year
The same principle was used to calculate the heat loss for other mixtures and the heat loss for one wall for all mixtures, which are summarized in Table 4 and Figure 11.
Figure 11 illustrates the annual heat loss of each mixture. The mixture M3 containing 6% CRF displays a 53% heat loss reduction compared to the control mixture. Therefore, the addition of CRF to the mixture is beneficial to save energy.

4. Discussion

As previously stated, agricultural by-products are typically used in the forms of ash, aggregate, and fiber when they are used as one of concrete’s components. Currently-reported and conducted research has evaluated agricultural by-products as potential SCMs (pozzolanic materials) for the cement/concrete system. For example, Adesanya and Raheem [43,44] determined that corn cob ash (CCA) can be used as an SCM in concrete because it contains an SiO2 content of more than 65% and an oxides combination of Al2O3 and SiO2 in the range of 70–75%. They found that the addition of CCA as a pozzolanic material in blended cement reduced the heat of hydration and permeability and increased the compressive strength and sulfate attack resistance.
However, this work evaluated how CRF affects the physical, mechanical, and thermal properties of a mortar mixture when it is added as a type of fiber. It was found that the flowability of the mixture decreased as the CRF content increased. This result is matched with other previous research, which used agricultural-based fiber. Ismail and Jaeel [32] reported that replacing the fine aggregate with giant reed fiber (GRF) reduced the slump value of concrete due to the non-uniform shapes of GRF resulting in less fluidity. The other research which incorporates jute fiber in concrete also showed the same reduction trend because of the nature of the moisture absorption of the hydrophilic jute fiber [24]. Therefore, workers should be careful about the loss of slump when agriculturally-based fiber is used in the concrete.
It was also found that the mechanical properties of mortar mixtures with CRF, including density, compressive strength, and flexural strength, were not as great as the mixture with SF concrete, but still met the mechanical property criteria of a structural lightweight concrete. One of the solutions to increase both compressive and flexural strengths is the combined use of CRF and SF, as shown in Figure 7 and Figure 8. Another alternative may be the combined use of common reed ash (CRA) and CRF. Ismail and Jaeel [32] reported that the mixture containing giant reed ash (GRA) had higher compressive and flexural strengths than plain concrete. They concluded that this result was attributed to the fact that the GRA has pozzolanic activity due to its high silica and alumina contents, resulting in additional calcium silicate hydrate (C–S–H) by reacting with calcium hydroxide occurring as a consequence of cement hydration. It is assumed that CRA has a similar chemical composition to GRA and presents the same pozzolanic effect to increase the strength. Therefore, if CRA and CRF are used together, there may induce a synergetic effect which compensates for the loss of strength due to the CRF.
Thermal properties of concrete are remarkably affected by various ingredients of concrete and concrete hardened properties, such as density and porosity [40]. In general, the concrete mixture with a low λ has a higher porosity and lower density. In other words, the higher the P/D, the lower the thermal conductivity. As presented in Figure 10, the λ of mixtures containing CRF decreased as the CRF content increased. This result can be explained by the porosity to density ratio (P/D). As presented in Table 5, while the 28-day porosity and density of the mixture containing 6% CRF are 23.80% and 2168.27 kg/m3, those properties of the mixture containing 2% CRF are 17.90% and 2249.78 kg/m3, respectively. In other words, the P/D of the former is 0.008, and the P/D of the latter is 0.011. The relationship between the λ and the P/D is shown in Figure 12. The R2 value as a regression analysis result is 67%. The relatively marginal R2 value may be attributed to the mixture containing 0.5% SF. It should be noted that the SF mixture has a low porosity, high density, and high λ compared to the CRF mixture.
Finally, the calculation of the annual heat loss of each mixture using the λ reveals that the incorporation of CRF into the cement matrix can produce a significant energy saving in heat loss for a typical building in Astana.
Based on the findings in this study, the addition of CRF to the mixture significantly improves the thermal performance of the mixture, but also has shortcomings, such as relatively weak mechanical properties compared to the plain mixture and the mixture with steel fiber. One of the solutions to overcome these shortcomings may be to modify the CRF characteristics. Ozerkan et al. [45] reported that some disadvantages of natural fiber, such as mechanical degradation, poor wettability, and high moisture absorption, can be overcome by the modification of CRF. They reduced the hydrophilic behavior of natural fiber, which induces poor adhesion between the fiber and matrix, by chemical treatment, using 0.173% Ca(OH)2 as the preferred pre-treatment.
It is recommended for future testing that the applicability of CRF for potential use in concrete is evaluated considering the following parameters: (1) the surface treatment of CRF to produce good contact with the cement paste; (2) proper length, shape, and structure of the fiber to generate an improved mechanical performance compared to other commercially available fibers in concrete; and (3) optimum amount of incorporation. In the case of surface treatment of CRF especially, it is necessary to conduct chemical composition analysis, setting time, drying shrinkage, and durability tests (sulfate attack, chloride resistance, alkali-silica reaction, etc.).

5. Conclusions

This study investigated the physical, mechanical, and thermal properties of mortar mixture containing CRF regarding porosity, compressive and flexural strengths, and thermal conductivity. The following conclusions were drawn based on the experiments and analysis results:
  • The incorporation of CRF in the mortar mixture proportionally reduced its unit weight and significantly increased its absorption capacity (AC) and porosity. Each 2.0% increase of CRF content reduced the unit weight by about 75 kg/m3 and elevated the AC by about 1.5% and porosity by about 3.5%.
  • As the CRF content increases, the flowability of the mixture decreases. Mixtures incorporated with CRF exhibit greater flowability than a plain mortar mixture.
  • The use of CRF in the mortar mixture did not improve the compressive and flexural strengths compared to the plain mixture. Adding 2.0% of CRF has no quantifiable effect on the flexural strength compared to the plain mixture, but the addition of more than 4% reduces the flexural strength.
  • The combined use of CRF and steel fiber generated a synergetic effect with a flexural strength superior to that of the plain mixture and other CRF mixtures.
  • The incorporation of CRF into mixtures has a considerably positive effect on its thermal performance. The thermal conductivity of mixtures containing CRF decreases two-fold compared to the plain mixture. It has been demonstrated with calculations that such low thermal conductivity causes a significant decrease in heat loss for a typical building in Astana.

Author Contributions

Data curation, T.M.; Formal analysis, C.-S.S. and T.M.; Funding acquisition, D.Z. and J.R.K.; Investigation, C.-S.S., D.L., and D.Z.; Methodology, C.-S.S. and D.L.; Project administration, J.R.K.; Supervision, C.-S.S., D.L., D.Z., and J.R.K.; Visualization, C.-S.S., T.M., and D.Z.; Writing—original draft, C.-S.S.; Writing—review & editing, C.-S.S., D.L., D.Z., and J.R.K.

Funding

This research was supported by the Nazarbayev University Research Fund under Grants #SOE2017003 and #SOE2017001. The authors are grateful for this support. Any opinions, findings, and conclusions or recommendations expressed in this material are those of the author(s) and do not necessarily reflect the views of the Nazarbayev University.

Conflicts of Interest

The authors declare no conflict of interest.

References

  1. Khabaz, A. Construction and design requirements of green buildings’ roofs in Saudi Arabia depending on thermal conductivity principle. Constr. Build. Mater. 2018, 186, 1119–1131. [Google Scholar] [CrossRef]
  2. Sobhy, I.; Brakez, A.; Benhamou, B. Analysis for thermal behavior and energy savings of a semi-detached house with different insulation strategies in a hot semi-arid climate. J. Green Build. 2017, 12, 78–106. [Google Scholar] [CrossRef]
  3. Yu, C.; Crump, D. A review of the emission of VOCs from polymeric materials used in buildings. Build. Environ. 1998, 33, 357–374. [Google Scholar] [CrossRef]
  4. Barreca, F.; Gabarron, A.M.; Yepes, J.A.F.; Pérez, J.J.P. Innovative use of giant reed and cork residues for panels of buildings in Mediterranean area. Resour. Conserv. Recycl. 2019, 140, 259–266. [Google Scholar] [CrossRef]
  5. Prusty, J.K.; Patro, S.K.; Basarkar, S.S. Concrete using agro-waste as fine aggregate for sustainable built environment—A review. Int. J. Sustain. Built Environ. 2015, 5, 312–333. [Google Scholar] [CrossRef]
  6. McCormick, K.; Kautto, N. The Bioeconomy in Europe: An Overview. Sustainability 2013, 5, 2589–2608. [Google Scholar] [CrossRef] [Green Version]
  7. Laborel-Préneron, A.; Aubert, J.E.; Magniont, C.; Tribout, C.; Bertron, A. Plant aggregates and fibers in earth construction materials: A review. Constr. Build. Mater. 2016, 111, 719–734. [Google Scholar] [CrossRef]
  8. Mehta, P.K.; Monteiro, P.J.M. Concrete: Microstructure, Properties, and Materials, 3rd ed.; McGraw-Hill: New York, NY, USA, 2005; pp. 306–307. ISBN 0071462899. [Google Scholar]
  9. Madandoust, R.; Ranjbar, M.M.; Moghadam, H.A.; Mousavi, S.Y. Mechanical properties and durability assessment of rice husk ash concrete. Biosyst. Eng. 2011, 110, 144–152. [Google Scholar] [CrossRef]
  10. Venkatanarayanan, H.K.; Rangaraju, P.R. Effect of grinding of low-carbon rice husk ash on the microstructure and performance properties of blended cement concrete. Cement. Concr. Compos. 2015, 55, 348–363. [Google Scholar] [CrossRef]
  11. Zareei, S.W.A.; Ameri, F.; Dorostkar, F.; Ahmadi, M. Rice husk ash as a partial replacement of cement in high strength concrete containing micro silica: Evaluating durability and mechanical properties. Case Stud. Constr. Mater. 2017, 7, 73–81. [Google Scholar] [CrossRef]
  12. Roselló, J.; Soriano, L.; Santamarina, M.P.; Akasaki, J.L.; Monzó, J.; Payá, J. Rice straw ash: A potential pozzolanic supplementary material for cementing systems. Constr. Build. Mater. 2017, 103, 39–50. [Google Scholar] [CrossRef]
  13. Cuthbertson, D.; Berardi, U.; Briens, C.; Berruti, F. Biochar from residual biomass as a concrete filler for improved thermal and acoustic properties. Biomass Bioenergy 2019, 120, 77–83. [Google Scholar] [CrossRef]
  14. Aldahdooh, M.A.A.; Bunnori, M.N.; MegatJohari, M.A. Development of green ultrahigh performance fiber reinforced concrete containing ultrafine palm oil fuel ash. Constr. Build. Mater. 2013, 48, 379–389. [Google Scholar] [CrossRef]
  15. Bamaga, S.O.; Hussin, M.W.; Ismail, M.A. Palm oil fuel ash: Promising supplementary cementing materials. J. Civ. Eng. 2013, 17, 1708–1713. [Google Scholar] [CrossRef]
  16. Salim, R.W.; Ndambuki, J.M.; Adedokun, D.A. Improving the bearing strength of sandy loam soil compressed earth block bricks using sugarcane bagasse ash. Sustainability 2014, 6, 3686–3696. [Google Scholar] [CrossRef]
  17. Shafigh, P.; Jumaat, M.Z.; Mahmud, H.; Alengaram, U.J. A new method of producing high strength oil palm shell lightweight concrete. Mater. Des. 2011, 32, 4839–4843. [Google Scholar] [CrossRef]
  18. Shafigh, P.; Jumaat, M.Z.; Mahmud, H. Oil palm shell as a lightweight aggregate for production high strength lightweight concrete. Constr. Build. Mater. 2011, 25, 1848–1853. [Google Scholar] [CrossRef]
  19. Gunasekaran, K.; Kumar, P.S.; Lakshmipathy, M. Mechanical and bond properties of coconut shell concrete. Constr. Build. Mater. 2011, 25, 92–98. [Google Scholar] [CrossRef]
  20. Gunasekaran, K.; Annadurai, R.; Kumar, P.S. Long term study on compressive and bond strength of coconut shell aggregate concrete. Constr. Build. Mater. 2012, 28, 208–215. [Google Scholar] [CrossRef]
  21. Binici, H.; Eken, M.; Dolaz, M.; Aksogan, O.; Kara, M. An environmentally friendly thermal insulation material from sunflower stalk, textile waste and stubble fibres. Constr. Build. Mater. 2014, 51, 24–33. [Google Scholar] [CrossRef]
  22. Mati-Baouche, N.; Baynast, H.D.; Lebert, A.; Sun, S.; Lopez-Mingo, C.J.S.; Leclaire, P.; Michaud, P. Mechanical, thermal and acoustical characterizations of an insulating bio-based composite made from sunflower stalks particles and chitosan. Ind. Crops. Prod. 2014, 58, 244–250. [Google Scholar] [CrossRef] [Green Version]
  23. Ataie, F. Influence of rice straw fibers on concrete strength and drying shrinkage. Sustainability 2018, 10, 2445. [Google Scholar] [CrossRef]
  24. Islam, M.; Ahmed, S.J. Influence of jute fiber on concrete properties. Constr. Build. Mater. 2018, 189, 768–776. [Google Scholar] [CrossRef]
  25. Ramakrishna, S.; Sundararajan, T. Impact strength of a few natural fibre reinforced cement mortar slabs: A comparative study. Cem. Concr. Compos. 2005, 27, 547–553. [Google Scholar] [CrossRef]
  26. Yan, L.; Chouw, N.; Huang, L.; Kasal, B. Effect of alkali treatment on microstructure and mechanical properties of coir fibres, coir fibre reinforced-polymer composites and reinforced-cementitious composites. Constr. Builld. Mater. 2016, 112, 168–182. [Google Scholar] [CrossRef]
  27. Zakaria, M.; Ahmed, M.; Hoque, M.M.; Hannan, A. Effect of jute yarn on the mechanical behavior of concrete composites. SpringerPlus 2015, 4, 1–8. [Google Scholar] [CrossRef]
  28. Berardi, U.; Iannace, G. Acoustic characterization of natural fibers for sound absorption applications. Build. Environ. 2015, 94, 840–852. [Google Scholar] [CrossRef]
  29. Köbbing, J.F.; Thevs, N.; Zerbe, S. The utilisation of reed (Phragmites australis): A review. Mires Peat 2013, 13, 1–14. [Google Scholar]
  30. Gabarrón, A.M.; Yepes, J.A.F.; Pérez, J.J.P.; Serna, J.M.B.; Arnold, L.C.; Medrano, F.J.S. Increase of the flexural strength of construction elements made with plaster (calcium sulfate dihydrate) and common reed (Arundo donax L.). Constr. Build. Mater. 2014, 66, 436–441. [Google Scholar] [CrossRef]
  31. Bołtryk, M.; Pawluczuk, E. Properties of a lightweight cement composite with an ecological organic filler. Constr. Build. Mater. 2014, 51, 97–105. [Google Scholar] [CrossRef]
  32. Ismail, Z.Z.; Jaeel, A.J. A novel use of undesirable wild giant reed biomass to replace aggregate in concrete. Constr. Build. Mater. 2014, 67, 68–73. [Google Scholar] [CrossRef]
  33. American Society for Testing and Materials. Standard Test Method for Tensile Properties of Single Textile Fibers; ASTM D3822-01; ASTM International: West Conshohocken, PA, USA, 2001. [Google Scholar]
  34. American Society for Testing and Materials. Standard Test Method for Flow of Hydraulic Cement Mortar; ASTM C1437-15; ASTM International: West Conshohocken, PA, USA, 2015. [Google Scholar]
  35. American Society for Testing and Materials. Standard Test Method for Density, Absorption, and Voids in Hardened Concrete; ASTM C642-13; ASTM International: West Conshohocken, PA, USA, 2013. [Google Scholar]
  36. American Society for Testing and Materials. Standard Test Method for Compressive Strength of Hydraulic Cement Mortars; ASTM C109/C109M-16a; ASTM International: West Conshohocken, PA, USA, 2016. [Google Scholar]
  37. American Society for Testing and Materials. Standard Test Method for Flexural Strength of Concrete (Using Simple Beam with Center-Point Loading); ASTM C293/C293M-16; ASTM International: West Conshohocken, PA, USA, 2016. [Google Scholar]
  38. Collet, F.; Pretot, S. Thermal conductivity of hemp concretes: Variation with formulation, density and water content. Constr. Build. Mater. 2014, 65, 612–619. [Google Scholar] [CrossRef] [Green Version]
  39. Dhakaf, U.; Berardi, U.; Gorgolewski, M.; Richman, R. Hygrothermal performance of hempcrete for Ontario (Canada) buildings. J. Clean. Prod. 2017, 142, 3655–3664. [Google Scholar] [CrossRef]
  40. Ulykbanov, A.; Sharafutdinov, E.; Chung, C.-W.; Zhang, D.; Shon, C.-S. Performance-based model to predict thermal conductivity of non-autoclaved aerated concrete through linearization approach. Constr. Build. Mater. 2019, 196, 555–563. [Google Scholar] [CrossRef]
  41. Krause, P. Thermal conductivity of the curing concrete. Arch. Civ. Eng. Environ. 2008, 1, 67–74. [Google Scholar]
  42. ASHRAE. 2017 ASHRAE Handbook-Fundamentals. American Society of Heating, Refrigerating, and Air-Conditioning Engineers, USA; ASHRAE: Atlanta, GA, USA, 2017. [Google Scholar]
  43. Adesanya, D.A.; Raheem, A.A. Development of corn cob ash blended cement. Constr. Build. Mater. 2009, 23, 347–352. [Google Scholar] [CrossRef]
  44. Adesanya, D.A.; Raheem, A.A. A study of the permeability and acid attack of corn cob ash blended cements. Constr. Build. Mater. 2010, 24, 403–409. [Google Scholar] [CrossRef]
  45. Ozerkan, N.G.; Ahsan, B.; Mansour, S.; Iyengar, S.R. Mechanical performance and durability of treated palm fiber reinforced mortars. Int. J. Sustain. Built Environ. 2013, 2, 131–142. [Google Scholar] [CrossRef] [Green Version]
Figure 1. Fiber-reinforced mixtures: (a) mixing procedure; (b) mixture samples for hardened property test.
Sustainability 11 00903 g001
Figure 2. Equipment to measure thermal conductivity: (a) Test setup; (b) test specimen.
Sustainability 11 00903 g002
Figure 3. Fresh and hardened unit weights of each mixture.
Sustainability 11 00903 g003
Figure 4. Absorption capacity of each mixture.
Sustainability 11 00903 g004
Figure 5. Porosity of each mixture.
Sustainability 11 00903 g005
Figure 6. Relative flowability of each mixture.
Sustainability 11 00903 g006
Figure 7. Compressive strength of each mixture.
Sustainability 11 00903 g007
Figure 8. Flexural strength of each mixture.
Sustainability 11 00903 g008
Figure 9. Cross-section of a beam specimen after a flexural strength test.
Sustainability 11 00903 g009
Figure 10. Thermal conductivity of different mixtures.
Sustainability 11 00903 g010
Figure 11. Annual heat loss (MBtu/year).
Sustainability 11 00903 g011
Figure 12. Relationship between thermal conductivity and porosity density ratio.
Sustainability 11 00903 g012
Table 1. Properties of common reed fiber and steel fiber.
Type and Shape of FiberLength (l, mm)Diameter (d, mm)Aspect Ratio (l/d)Density (g/cm3)Tensile Strength (N/mm2)Picture of Fiber
CRF151.212.50.54112 Sustainability 11 00903 i001
Hooked-end SF350.55657.751050 Sustainability 11 00903 i002
Table 2. Mixture proportions of mixtures containing fibers (kg/m3).
MixtureCementWaterW/CAggregateCRFSF
M0 (Plain)476245.30.45162700
M1 (2%CRF)476268.10.45157410.70
M2 (4%CRF)476290.90.45152121.40
M3 (6%CRF)476313.70.45146832.10
M4 (0.5%SF)476245.10.451614039
M5 (6%CRF + 0.5%SF)476313.50.45145532.139
Table 3. A local building geometry and property of materials.
ComponentValue
Floor height3.4 m (11.155 ft)
The perimeter of the building300 m (984.252 ft)
Area of fenestration181.25 m (594.652)
Total area of building *838.75 m2 (9020.16 ft2)
The thickness of the concrete layer300 mm (11.811 in.)
The thermal conductivity of mixture M30.516 W/m·K (3.58 Btu·in/hr ft2·F)
* Total area of building = floor height × perimeter of the building—an area of fenestration.
Table 4. Heat loss for one wall for all mixtures.
Mixtureλ (W/m·K)λ (Btu·in/hr ft2·F)R (hr ft2·F/Btu)Q (Btu/day)Q (MBtu/year)
M0 (Plain)1.1067.671.54140,6561447
M1 (2%CRF)0.5613.893.0371,371734
M2 (4%CRF)0.5593.883.0471,121732
M3 (6%CRF)0.5163.583.3065,672676
M4 (0.5%SF)0.6424.452.6581,621840
M5 (6%CRF + 0.5%SF)0.5183.593.2965,880678
Table 5. Density to porosity ratio of mixtures.
Mixtureλ (W/m·K)Density (g/cm3)PorosityPorosity/Density
7-Day28-Day7-Day28-Day7-Day28-Day7-Day28-Day
M0 (Plain)1.1060.8332478.112308.8813.7013.800.0060.006
M1 (2%CRF)0.5610.5932249.782249.5119.0017.900.0080.008
M2 (4%CRF)0.5590.5652200.392213.1620.8020.400.0090.009
M3 (6%CRF)0.5160.5042157.992168.2724.4023.800.0110.011
M4 (0.5%SF)0.6420.6942329.482326.6315.6014.700.0070.006
M5 (6%CRF + 0.5%SF)0.5180.5982172.052186.7627.8024.600.0130.011

