Analysis of Pavement Condition Survey Data for Effective Implementation of a Network Level Pavement Management Program for Kazakhstan


Abstract
:1. Introduction
2. Background
3. Methodology
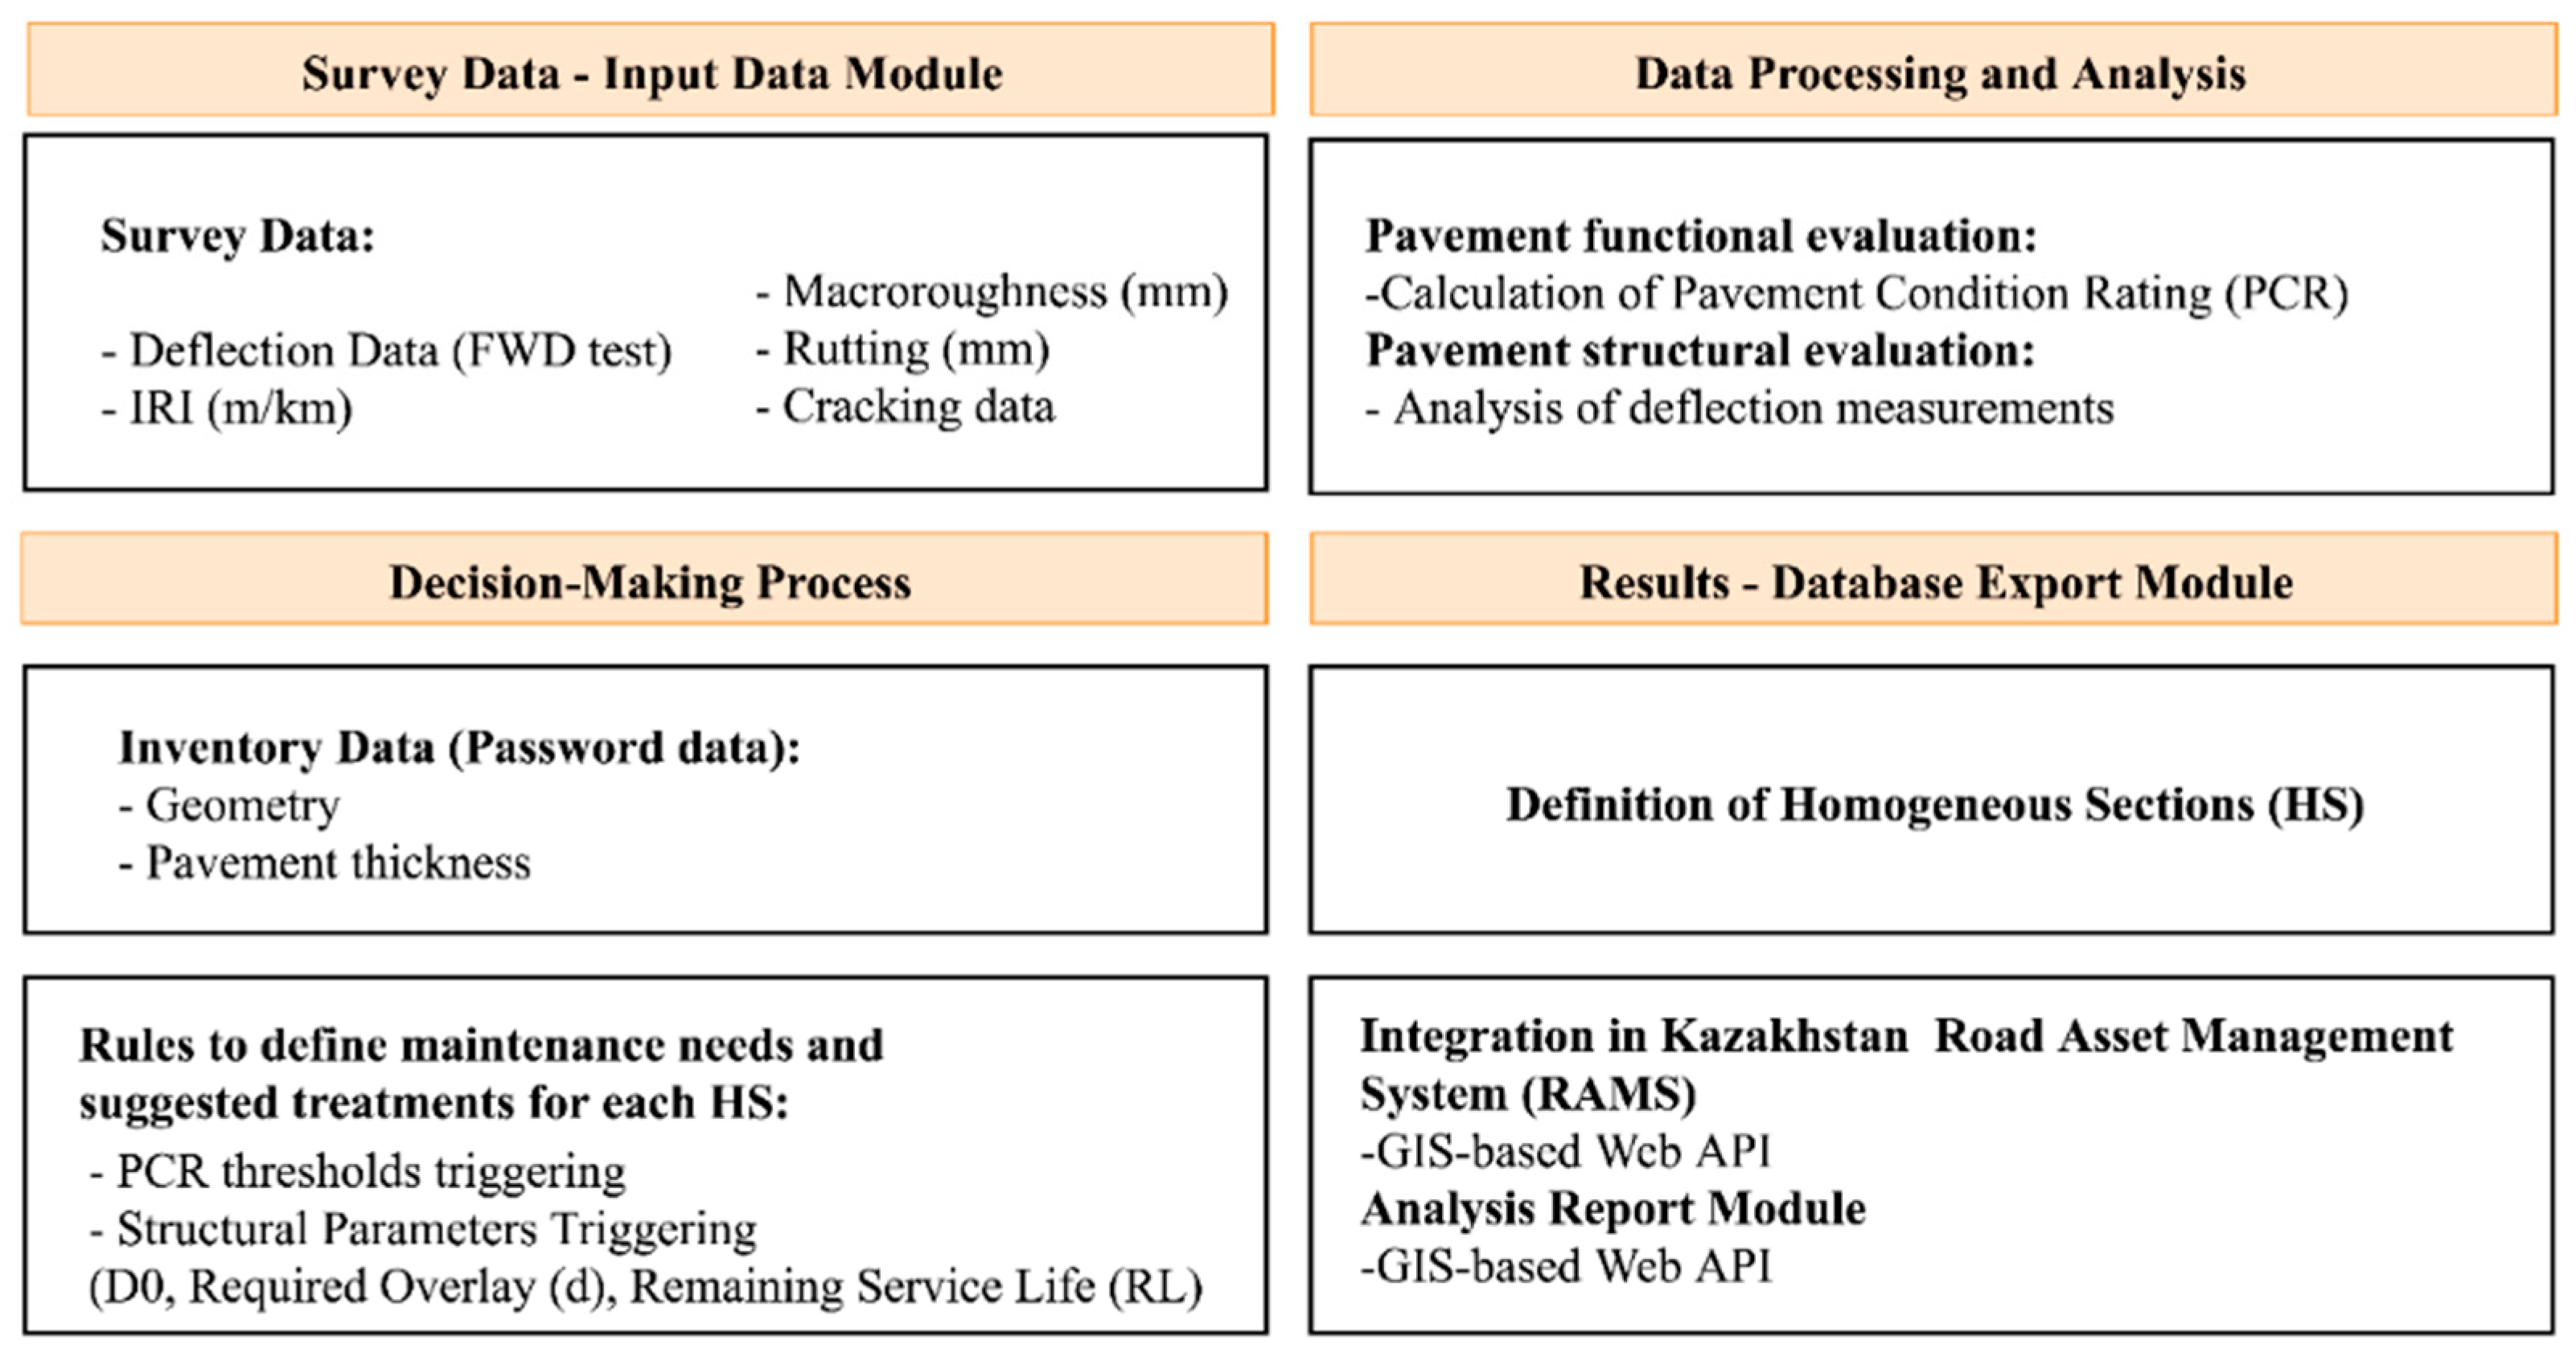
3.1. Overview
- the integration of collected survey data, and their relation to the inventory data available through the application of an LRS;
- the analysis of survey data using the PCR, the study of deflection tests using the SCI and the definition of criteria for the definition of homogeneous sections of study;
- the interpretation of rules to design maintenance and rehabilitation strategies for the homogeneous sections of the analysis; and
- the development of procedures to report the results of the analysis using Geographic Information System tools and exporting the data into the RAMS to perform a strategic analysis.
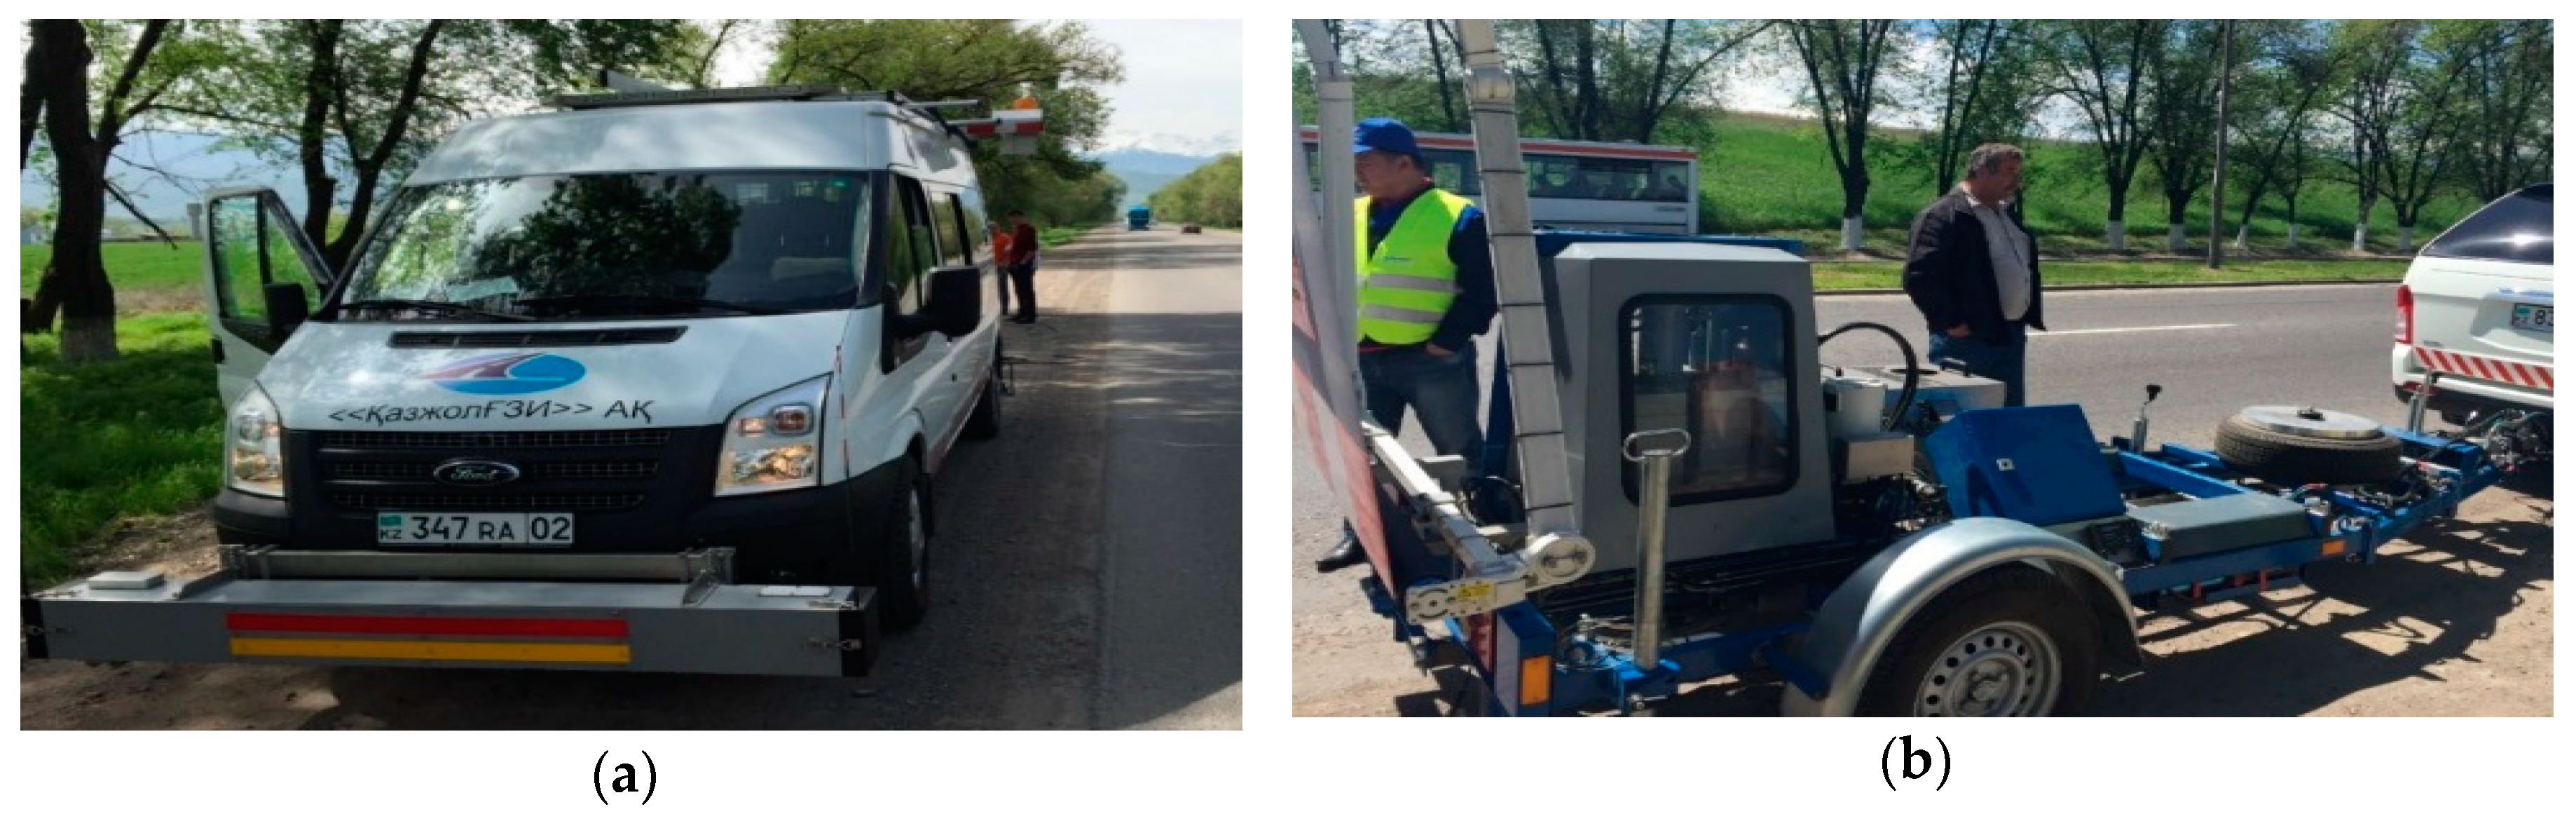
3.2. Data Collection
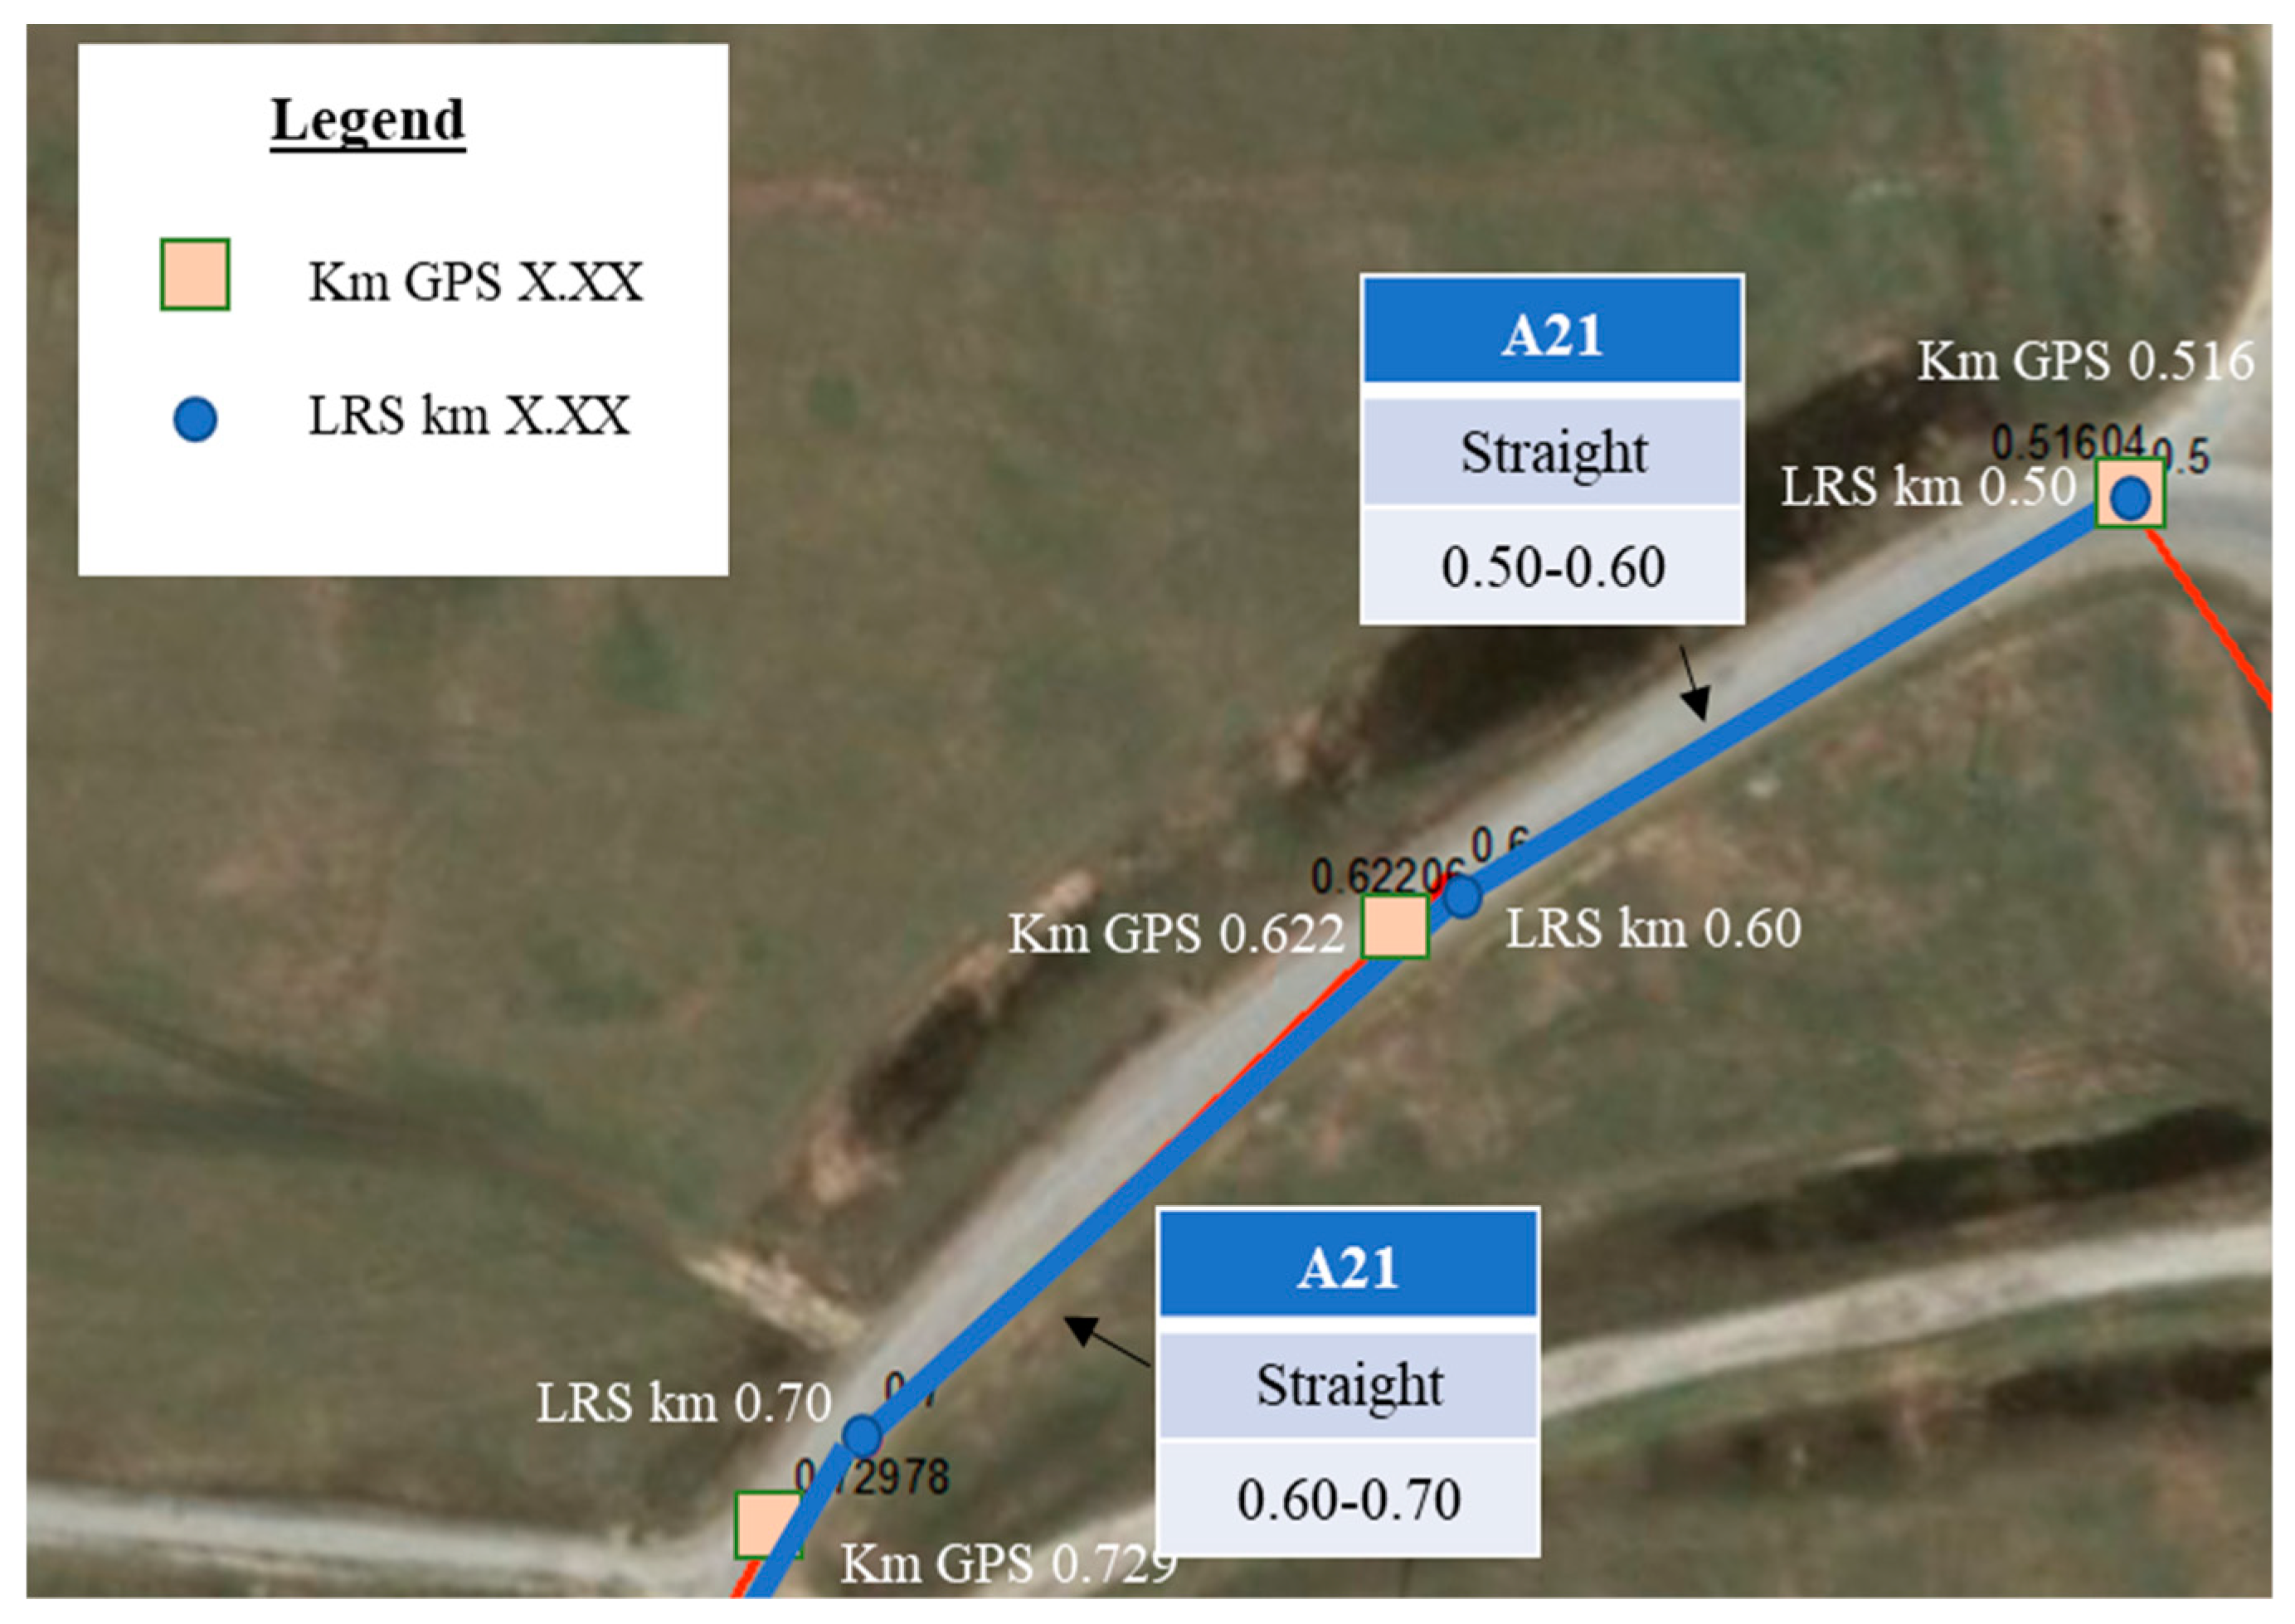
3.3. Data Processing: Linear Referencing System and Spatial Positioning Merging Procedures
3.4. Data Analysis: Pavement Functional Evaluation
3.5. Data Analysis: Traffic Data
3.6. Data Analysis: Deflection Data
- Normalize pavement FWD deflection data to standard 40 kN load deflections, (8):where = deflections at the fixed sensors at a 40 kN standard load; = stress in the plate for the standard load; = measured stress in the plate for the tested peak load.
- Determine the deflection at an offset of 1.5·HP from the FWD load application; this required the interpolation among the deflection that was measured at the fixed sensors positions (9):where Dx = Deflection at Rx; DA, DB, DC = deflections at the closest fixed sensor position; RA, RB, RC = offsets of the closest sensors to Point x; x = point for which the deflection is determined. HP = pavement depth–the thickness of all layers above the subgrade.
- Determine the structural index SIP of the pavement as follows (10):where: SIP = Structural Index of the Pavement defined according to Rohde [18], D0 = peak deflection under the standard 40-KN (9000-lb.) FWD (microns), and D1.5 Hp = deflection at 1.5 times the pavement total depth HP (microns).
- Determine the existing SNeff, as in Equation (11):where: SNeff = effective structural number expressed in inches (in.); for asphalt pavements k1 = 0.4728; k2 = −0.4810; and k3 = 0.7581; SIP = Structural Index of the Pavement in microns; and HP = total pavement thickness (mm).
4. Results
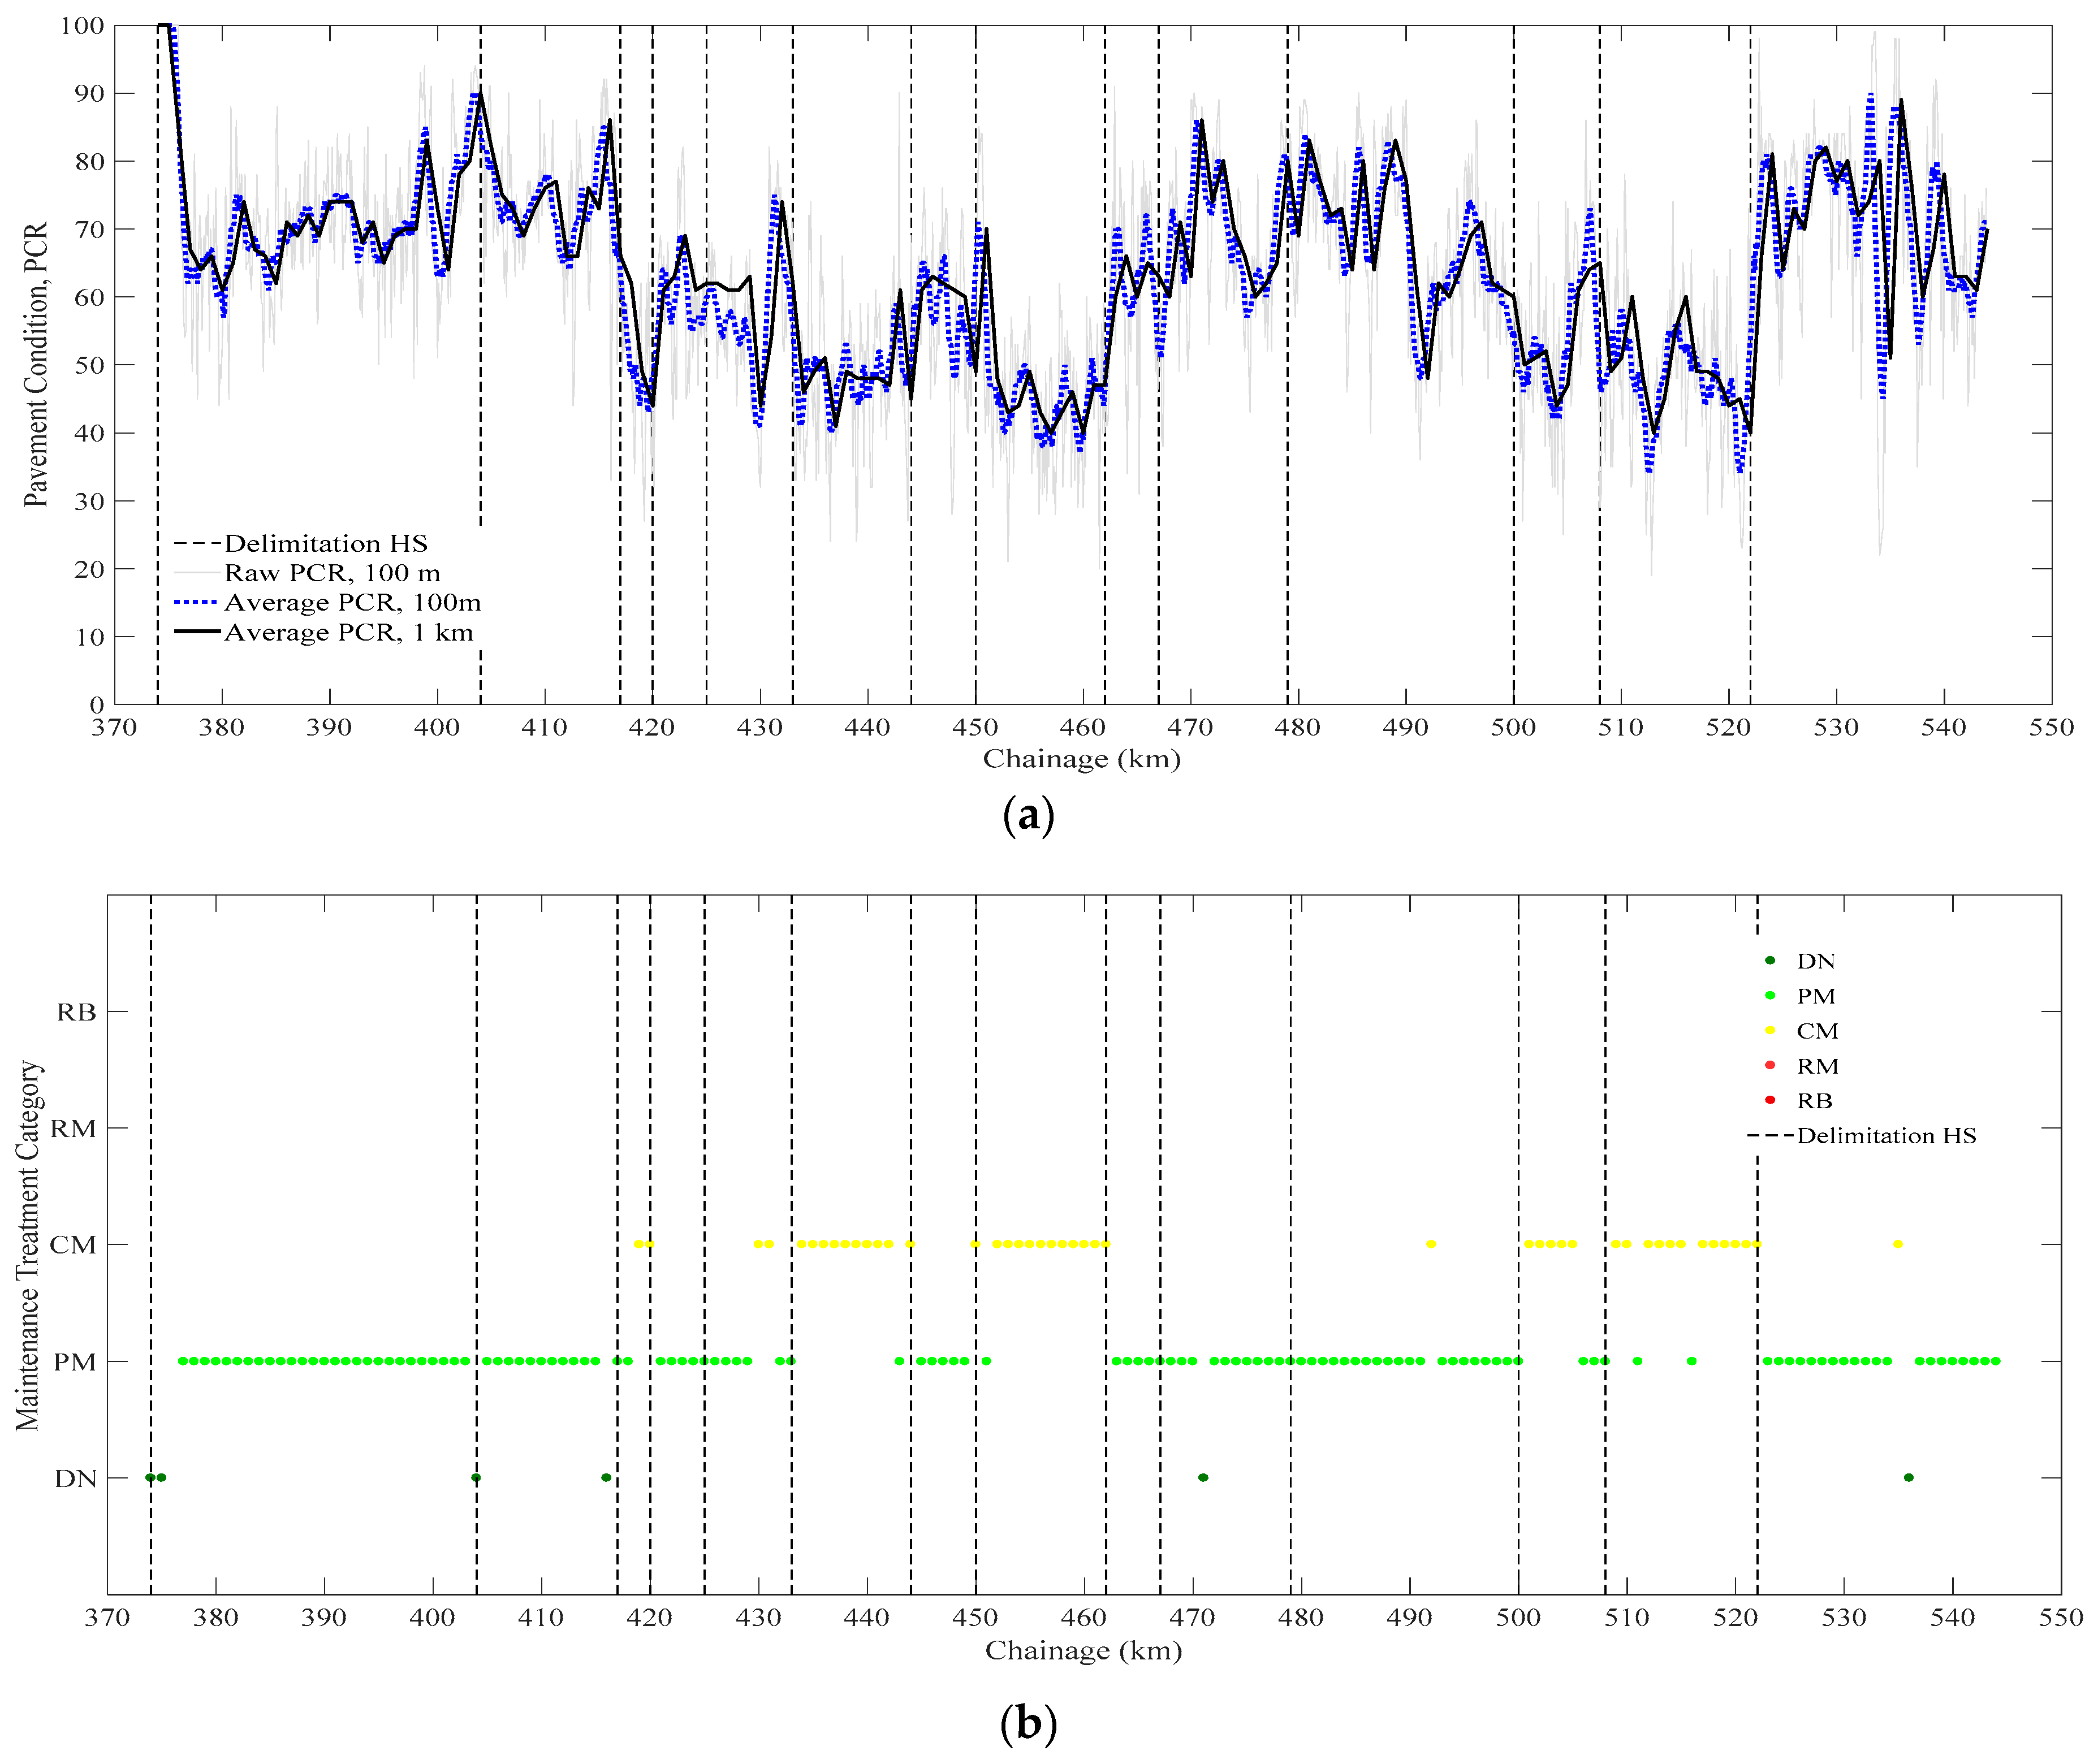
4.1. Definition of Pavement Homogeneous Section Criteria
4.2. Decision-Making Process
5. Conclusions
- The pavement survey at the network level involves a high quantity of data. The use of the data for cost-effective PMS strategies requires specific procedures and rules to integrate them into a structured database. LRS and GPS merging data procedures are essential for further analyses.
- The use of the PCR, to give an overall score of the pavement functional condition, would be valid for deciding pavement needs at the network level, and it can be used as a first screening tool for identifying the most suitable pavement maintenance treatment in pavement sections. However, deflection measurements at the network level enhance pavement decision-making because they can help discriminate, among the pavement sections that the PCR states are in good condition, those in need of structural maintenance treatments.
- The definition of rules for the designing of maintenance and rehabilitation strategies for the homogeneous sections would support the decision-making process at the network level. The proposed approach through pavement condition indicators provides information for the prediction of the maintenance and rehabilitation strategies of road segments. The indicators can estimate the expected benefits of maintenance treatments that are to be performed on the network.
- The proposed approach leads to the implementation of a PMS for the national network of Kazakhstan, but it is still an early project that would evolve with further pavement inspections on the network. At the moment, it provides a glimpse of the current state of the network, which needs to be calibrated to the country’s local conditions (construction practices and procurement contracting).
Author Contributions
Funding
Acknowledgments
Disclaimer
Conflicts of Interest
References
- Mačiulis, A.; Vasiliauskas, A.V.; Jakubauskas, G. The impact of transport on the competitiveness of national economy. Transport 2009, 24, 93–99. [Google Scholar] [CrossRef]
- Flintsch, G.W.; McGhee, K.K. Quality Management of Pavement Condition Data Collection; National Academies Press: Washington, DC, USA, 2009; Synthesis 401. [Google Scholar]
- Shahin, M.Y. Pavement Management for Airports, Roads, and Parking Lots, 2nd ed.; Springer Publishing Company: New York, NY, USA, 2005. [Google Scholar]
- ASTM. ASTM D6433-18, Standard Practice for Roads and Parking Lots Pavement Condition Index Surveys; ASTM International: West Conshohocken, PA, USA, 2018. [Google Scholar]
- Papagiannakis, A.; Gharaibeh, N.; Weissmann, J.; Wimsatt, A. Pavement Scores Synthesis. College Station, TX: Texas Transportation Institute. 2009. Available online: https://static.tti.tamu.edu/tti.tamu.edu/documents/0-6386-1.pdf (accessed on 19 May 2018).
- Wolters, A.S.; Zimmerman, K.A. Research of Current Practices in Pavement Performance Modeling; FHWA-PA-2010-007-080307; Pennsylvania Department of Transportation: Harrisburg, PA, USA, 2010. Available online: https://trid.trb.org/view/919191 (accessed on 19 May 2018).
- Vavrik, W.R.; Evans, L.D.; Stefanski, J.A.; Sargand, S. PCR Evaluation–Considering Transition from Manual to Semi-Automated Pavement Distress Collection and Analysis. 2013. Available online: https://trid.trb.org/view/1260427 (accessed on 19 May 2018).
- Pierce, L.M.; McGovern, G.; Zimmerman, K.A. Practical Guide for Quality Management of Pavement Condition Data Collection. 2013. Available online: https://trid.trb.org/view/1265581 (accessed on 19 May 2018).
- FHWA. Pavement Distress Identification Manual for the National Park Service Road Inventory Program; United States. Federal Highway Administration. Office of Infrastructure Research and Development: McLean, VA, USA, 2009. Available online: http://www.wistrans.org//mrutc/files/Distress-ID-Manual.pdf (accessed on 19 May 2018).
- Flora, W.F. Development of a Structural Index for Pavement Management: An Exploratory Analysis; Purdue University: West Lafayette, IN, USA, 2009. [Google Scholar]
- Bryce, J.M.; Flintsch, G.W.; Katicha, S.W.; Diefenderfer, B.K.; Sarant, A. Development of Pavement Structural Capacity Requirements for Innovative Pavement Decision-Making and Contracting: Phase II; Virginia Transportation Research Council: Charlottesville, VA, USA, 2016; Available online: http://www.virginiadot.org/vtrc/main/online_reports/pdf/16-r20.pdf (accessed on 19 May 2018).
- Katicha, S.W.; Ercisli, S.; Flintsch, G.W.; Bryce, J.M.; Diefenderfer, B.K. Development of Enhanced Pavement Deterioration Curves; VTRC 17-R7; Virginia Transportation Research Council Charlottesville: Virginia, VA, USA, 2016. [Google Scholar]
- Katicha, S.W.; Flintsch, G.W.; Shrestha, S.; Thyagarajan, S. Demonstration of Network Level Structural Evaluation with Traffic Speed Deflectometer. In Final Report. Prepared for the Federal Highway Administration; USDOT: Blacksburg, VA, USA, 2017. [Google Scholar]
- Shrestha, S.; Katicha, S.W.; Flintsch, G.W.; Thyagarajan, S. Application of Traffic Speed Deflectometer for Network-Level Pavement Management. Transp. Res. Rec. 2018. [Google Scholar] [CrossRef]
- Rada, G.R.; Nazarian, S.; Visintine, B.A.; Siddharthan, R.; Thyagarajan, S. Pavement Structural Evaluation at the Network Level. 2016. Available online: https://www.fhwa.dot.gov/publications/research/infrastructure/pavements/15074/15074.pdf (accessed on 19 May 2018).
- Hossain, M.; Chowdhury, T.; Chitrapu, S.; Gisi, A.J. Network-level pavement deflection testing and structural evaluation. J. Test. Eval. 2000, 28, 199–206. [Google Scholar]
- AASHTO. AASHTO Guide for Design of Pavement Structures; AASHTO: Washington, DC, USA, 1993; Volume 1. [Google Scholar]
- Rohde, G.T. Determining Pavement Structural Number from FWD Testing. Transportation Research Record 1994. Available online: https://trid.trb.org/view/415076 (accessed on 19 May 2018).
- Zhang, Z.; Claros, G.; Manuel, L.; Damnjanovic, I. Evaluation of the pavement structural condition at network level using Falling Weight Deflectometer (FWD) data. In Proceedings of the 82nd Transportation Research Board meeting, Washington, DC, USA, 12–16 January 2003. [Google Scholar]
- Bryce, J.M.; Flintsch, G.W.; Katicha, S.W.; Diefenderfer, B.K. Developing a network-level structural capacity index for asphalt pavements. J. Transp. Eng. 2012, 139, 123–129. [Google Scholar] [CrossRef]
- Zhang, Z.; Manuel, L.; Damnjanovic, I.; Li, Z. Development of a New Methodology for Characterizing Pavement Structural Condition for Network-level Applications. Texas Dept. of Transportation, Austin, TX 2003. Available online: https://pdfs.semanticscholar.org/6f91/8ac20e5a7f99dca2d50b12eab6a3e750f363.pdf (accessed on 19 May 2018).
- Gerber, A.D.; Miller, T.D.; Richardson, M.J. Implementation and Calibration of a Laser Crack Measurement System for the Delaware Department of Transportation’s Pavement Management Program. 2018. Available online: https://trid.trb.org/view/1496710 (accessed on 19 May 2018).
- Rydholm, T.C.; Luhr, D.R. Visualizing pavement management data at the project level. In Proceedings of the 9th international conference on managing pavement assets (ICMPA9), Washington, DC, USA, 18–21 May 2015. [Google Scholar]
- Maser, K.; Schmalzer, P.; Shaw, W.; Carmichael, A. Integration of Traffic Speed Deflectometer and Ground-Penetrating Radar for Network-Level Roadway Structure Evaluation. Transp. Res. Rec. J. Transp. Res. Board 2017, 55–63. [Google Scholar] [CrossRef]
- Tsunokawa, K.; Ul-Islam, R. Pitfalls of HDM-4 strategy analysis. Intern. J. Pavement Eng. 2007, 8, 67–77. [Google Scholar] [CrossRef]
- Kim, D.Y.; Chi, S.; Kim, J. Selecting Network-Level Project Sections for Sustainable Pavement Management in Texas. Sustainability 2018, 10, 686. [Google Scholar] [CrossRef]
- Chi, S.; Hwang, J.; Arellano, M.; Zhang, Z.; Murphy, M. Development of network-level project screening methods supporting the 4-year pavement management plan in Texas. J. Manag. Eng. 2012, 29, 482–494. [Google Scholar] [CrossRef]
- FHWA. Transportation Asset Management Case Studies; Data Integration: The Virginia Experience; FHWA: Washington, DC, USA, 2005.
- Bennett, C.R.; De Solminihac, H.; Chamorro, A.; Flintsch, G.W. Data Collection Technologies for Road Management. 2006. Available online: https://openknowledge.worldbank.org/handle/10986/11776 (accessed on 19 May 2018).
- Bonin, G.; Folino, N.; Loprencipe, G.; Oliverio Rossi, G.; Polizzotti, S.; Teltayev, B. Development of a Road Asset Management System in Kazakhstan. In Proceedings of the TIS 2017 International Congress on Transport Infrastructure and Systems, Rome, Italy, 10–12 April 2017; pp. 10–12. [Google Scholar]
- Archondo-Callao, R. Applying the HDM-4 Model to Strategic Planning of Road Works. 2008. Available online: https://openknowledge.worldbank.org/handle/10986/17419 (accessed on 19 May 2018).
- Pavemetrics. Available online: http://www.pavemetrics.com/applications/road-inspection/laser-crack-measurement-system/ (accessed on 5 May 2018).
- ASTM. ASTM E950/E950M-09, Standard Test Method for Measuring the Longitudinal Profile of Traveled Surfaces with an Accelerometer-Established Inertial Profiling Reference; ASTM International: West Conshohocken, PA, USA, 2018. [Google Scholar]
- Zhou, G.; Wang, L.; Wang, D.; Reichle, S. Integration of GIS and data mining technology to enhance the pavement management decision making. J. Transp. Eng. 2009, 136, 332–341. [Google Scholar] [CrossRef]
- Flintsch, G.W.; Dymond, R.; Collura, J. Pavement Management Applications using Geographic Information Systems; National Academies Press: Washington, DC, USA, 2004; Synthesis 335. [Google Scholar]
- ASTM. ASTM E1926-08, Standard Practice for Computing International Roughness Index of Roads from Longitudinal Profile Measurements; ASTM International: West Conshohocken, PA, USA, 2015. [Google Scholar]
- Loprencipe, G.; Pantuso, A. A Specified Procedure for Distress Identification and Assessment for Urban Road Surfaces Based on PCI. Coatings 2017, 7, 65. [Google Scholar] [CrossRef]
- Loprencipe, G.; Pantuso, A.; Mascio, P.D. Sustainable Pavement Management System in Urban Areas Considering the Vehicle Operating Costs. Sustainability 2017, 9, 453. [Google Scholar] [CrossRef]
- Watanatada, T. The Highway Design and Maintenance Standards Model: User’s Manual for the HDM-III Model; Johns Hopkins University Press: Baltimore, MD, USA, 1987; Volume 2. [Google Scholar]
- Huang, Y.H. Pavement Analysis and Design. 2004. Available online: https://www.amazon.com/Pavement-Analysis-Design-Yang-Huang/dp/0131424734 (accessed on 19 May 2018).
- Lukanen, E.O.; Stubstad, R.; Briggs, R. Temperature Predictions and Adjustment Factors for Asphalt Pavements; FHWA: Washington, DC, USA, 2000.


| Suggested Maintenance Treatment Category | Rating Category | IRI Value Range (m/km) | RCI Value Range |
|---|---|---|---|
| Do Nothing (DN) | Excellent | <2.5 | 85–100 |
| Preventive Maintenance (PM) | Good | 2.5–3.0 | 60–85 |
| Corrective Maintenance (CM) | Fair | 3.0–4.0 | 40–60 |
| Restorative Maintenance (RM) | Poor | 4.0–5.0 | 26–40 |
| Rehabilitation (RB) | Very Poor | >5.0 | <26 |
| Vehicle Category | GCM | Axles | Axle 1 | Axle 2 | Axle 3 | Axle 4 | Axle 5 | Axle 6 | ESALF |
|---|---|---|---|---|---|---|---|---|---|
| Light loads and minibuses | <3.5 t | 2 | S * | S * | - | - | - | - | 0.0013 |
| Bus medium, 20–40 seats | 8 t | 2 | S 2.4 | D 5.6 | - | - | - | - | 0.239 |
| Bus heavy, more than 40 seats | 15 t | 2 | S 4.5 | D 10.5 | - | - | - | - | 2.958 |
| Single trucks, less than 2 t | 2 t | 2 | S 0.6 | S 1.4 | - | - | - | - | 0.002 |
| Single trucks, from 2 to 5 t | 5 t | 2 | S 1.5 | S 3.5 | - | - | - | - | 0.037 |
| Single trucks, from 5 to 10 t | 10 t | 2 | S 3.0 | D 7.0 | - | - | - | - | 0.584 |
| Single trucks, from 5 to 10 t | 10 t | 3 | S 2.6 | TN 3.7 | TN 3.7 | - | - | - | 0.139 |
| Single trucks, from 10 to 20 t | 20 t | 4 | S 4.2 | S 5.0 | TN 5.4 | TN 5.4 | - | - | 1.017 |
| Road-trains with trailer, type 1 | 25 t | 4 | S 5.25 | S 6.25 | TN 6.75 | TN 6.75 | - | - | 2.482 |
| Road-trains with trailer, type 2 | 25 t | 5 | S 4.0 | S 5.25 | S 5.25 | TN 5.25 | TN 5.25 | - | 1.403 |
| Road-trains with trailer, type 3 | 25 t | 5 | S 4.0 | S 5.25 | D 5.25 | TN 5.25 | TN 5.25 | - | 1.174 |
| Road-trains with trailer, type 4 | 25 t | 6 | S 3.0 | D 4.75 | D 4.75 | S 3.0 | D 4.75 | D 4.75 | 0.712 |
| Truck tractors with semitrailer, type 1 | 14 t | 3 | S 4.2 | S 4.2 | D 5.6 | - | - | - | 0.550 |
| Truck tractors with semitrailer, type 2 | 20 t | 4 | S 4.2 | D 5.0 | TN 5.4 | TN 5.4 | - | - | 0.828 |
| Truck tractors with semitrailer, type 3 | 30 t | 5 | S 4.2 | D 6.6 | TR 6.4 | TR 6.4 | TR 6.4 | - | 2.077 |
| Truck tractors with semitrailer, type 4 | 38 t | 4 | S 7.22 | D 10.26 | D 10.26 | TN 10.26 | - | - | 10.752 |
| Truck tractors with a semitrailer, type 5 | 38 t | 5 | S 6.84 | TN 7.79 | TN 7.79 | TN 7.79 | TN 7.79 | - | 5.687 |
| Truck tractors with a semitrailer, 123 | 38 t | 6 | S 4.94 | TN 6.94 | TN 6.94 | TR 6.46 | TR 6.46 | TR 6.46 | 3.203 |
| Tractors, Light loads with trailer type 1 | 3 t | 3 | S 0.7 | S 1.3 | S 1.0 | - | - | - | 0.002 |
| Tractors, Heavy with trailer type 2 | 10 t | 4 | S 1.0 | S 2.0 | TN 3.5 | TN 3.5 | - | - | 0.101 |
| Cat. | Pavement Treatment Category | PCR Rating Scale Values | d (cm) Rating Scale Values | Pavement Condition Indicators | Pavement Maintenance Category Treatment Description |
|---|---|---|---|---|---|
| DN | Do Nothing (DN) | 85–100 | ≤3 | Pavement surface is in excellent condition and only minor distresses are detected. | Do Nothing |
| PM | Preventive Maintenance (PM) | 60–85 | 4–7 | The shape of the pavement is OK but may be suffering from minor cracking and crazing on the surface and occasional patch repairs. | Preventive Maintenance Surface Treatment (Chip Seal, Slurry Seal, Micro-surfacing) |
| CM | Corrective Maintenance (CM) | 40–60 | 8–13 | The pavement is sound but needs to be re-profiled, with a strengthening of the surfacing layers. The surface may be cracked and crazed in limited locations. | Mill and AC Overlay (5 cm) |
| RM | Restorative Maintenance (RM) | 26–40 | 13–20 | Failure of the pavement top layers - not deep-seated but may include some local surface failures and a few isolated deep-seated failures. | Full depth recycling of 20 cm with the addition of new material (50% of crushed stone, 7% of bitumen); with AC overlay |
| RB | Rehabilitation (RB) | <26 | >20 | Deep-seated failure of the pavement as evidenced by extensive cracking, shoving and rutting of the surface. | Reconstruction. Mill, Break, compaction of the subgrade, and Seat and AC Overlay |
| Chainage HS | Thickness (cm) | PCR | SNeff | SNreq | D (cm) | RL (years) | PCR Trigger | Structural Trigger | Final Decision |
|---|---|---|---|---|---|---|---|---|---|
| 374–404 | 24 | 73 | 2.81 | 3.30 | 5 | 19 | PM | PM | PM |
| 404–417 | 23 | 73 | 2.90 | 3.20 | 3 | 16 | PM | PM | PM |
| 417–420 | 17 | 54 | 2.51 | 2.79 | 3 | 13 | CM | DN | CM |
| 420–425 | 17 | 63 | 2.36 | 3.01 | 6 | 5 | PM | PM | PM |
| 425–433 | 20 | 58 | 2.30 | 3.20 | 8 | 3 | CM | CM | CM |
| 433–444 | 20 | 49 | 2.29 | 3.22 | 8 | 3 | CM | CM | CM |
| 444–450 | 20 | 61 | 2.29 | 3.36 | 10 | 2 | PM | CM | CM |
| 450–462 | 20 | 48 | 2.11 | 3.09 | 9 | 3 | CM | CM | CM |
| 462–467 | 20 | 62 | 2.18 | 3.20 | 9 | 4 | PM | CM | CM |
| 467–479 | 20 | 70 | 2.16 | 4.45 | 20 | 1 | PM | RM | RM |
| 479–500 | 32 | 68 | 3.98 | 3.98 | 3 | 30 | PM | DN | PM |
| 500–508 | 15 | 54 | 2.17 | 4.18 | 18 | 3 | CM | RM | RM |
| 508–522 | 13 | 50 | 1.92 | 3.20 | 11 | 1 | CM | CM | CM |
| 522–544 | 13 | 69 | 2.05 | 2.80 | 7 | 5 | PM | PM | PM |
© 2019 by the authors. Licensee MDPI, Basel, Switzerland. This article is an open access article distributed under the terms and conditions of the Creative Commons Attribution (CC BY) license (http://creativecommons.org/licenses/by/4.0/).
Share and Cite
Pantuso, A.; Loprencipe, G.; Bonin, G.; Teltayev, B.B. Analysis of Pavement Condition Survey Data for Effective Implementation of a Network Level Pavement Management Program for Kazakhstan. Sustainability 2019, 11, 901. https://doi.org/10.3390/su11030901
Pantuso A, Loprencipe G, Bonin G, Teltayev BB. Analysis of Pavement Condition Survey Data for Effective Implementation of a Network Level Pavement Management Program for Kazakhstan. Sustainability. 2019; 11(3):901. https://doi.org/10.3390/su11030901
Chicago/Turabian StylePantuso, Antonio, Giuseppe Loprencipe, Guido Bonin, and Bagdat Burkhanbaiuly Teltayev. 2019. "Analysis of Pavement Condition Survey Data for Effective Implementation of a Network Level Pavement Management Program for Kazakhstan" Sustainability 11, no. 3: 901. https://doi.org/10.3390/su11030901