Application of Acoustic Emission to Estimation of Strata Denudation: A Case Study from the Ordos Basin, China

1
Key Laboratory of Shale Gas and Geoengineering, Institute of Geology and Geophysics, Chinese Academy of Sciences, Beijing 100029, China
2
College of Earth and Planetary Sciences, University of Chinese Academy of Sciences, Beijing 100049, China
3
College of Architecture and Civil Engineering, Beijing University of Technology, Beijing 100124, China
*
Author to whom correspondence should be addressed.
Sustainability 2019, 11(3), 861; https://doi.org/10.3390/su11030861
Submission received: 26 December 2018
/
Revised: 25 January 2019
/
Accepted: 1 February 2019
/
Published: 7 February 2019
Abstract
:This paper presents a method for reconstructing denudation in sedimentary basins. The principle of this method is to use the Kaiser effect involving the acoustic emission (AE) of rock samples under a uniaxial load test. Based on the proposed method, the denudation thickness since the Late Cretaceous period in the southeastern margin of the Ordos Basin in China was estimated. The results showed that the denudation increased gradually from the northwest (1600 m a.s.l) to the southeast (1800 m a.s.l) of the study area. A comparison of the denudation results with those obtained from other methods illustrated that the AE method was reliable and easy to use. Finally, using computer simulation, we analyzed the influence of strata denudation and ground topography on the current in situ stress. The results suggested that due to the denudation, the horizontal stress played a dominant role in the distribution of the in situ stress of the study area, but the in situ stress could be reduced by the uplifted movement of the ground. The analysis could facilitate future applications of the AE method and improve understanding of the basin stress field.
1. Introduction
Structural uplift and stratigraphic denudation are common geological phenomena in the evolution of sedimentary basins. The intensity and regional difference of strata denudation reflect the active progress of tectonic and sedimentary environments. Denudation has an important impact on the formation and migration of oil and gas [1,2,3,4], which are the most important basic resources for sustainable socio-economic development. Strong denudation even changes the in situ stress. Therefore, reconstruction of this denudation is of great significance for basin evolution research, hydrocarbon evaluation and in situ stress assessment.
The uncertainty of geological conditions and incomplete geological data make it difficult to estimate the denudation of strata. Commonly used methods to reconstruct denudation can be divided into the following types: (1) The geological method, including the stratigraphic contrast method, the sedimentation rate method, and the sedimentation fluctuation process analysis method [5,6,7,8]; (2) the geochemical method, including the vitrinite reflectance method, the fluid warp body method, the apatite fission track method, and the cosmogenic nuclides analysis method [9,10,11,12]; (3) the geophysical method, including the logging curve method and the seismic stratigraphy method [13]. It is necessary to select the most appropriate method based on the basin evolution history and existing geological data.
For some basins, fundamental limitations have resulted in limited available methods. Taking the Ordos Basin as an example, the seismic stratigraphy method is not applicable because the basin is covered with loess. Moreover, due to the large amount of denudation of the Late Cretaceous and the large variation of sedimentary facies, the geothermal index and the mudstone compaction-trend extrapolation methods are not suitable [10,14]. At present, few methods of reconstructing the basin’s denudation have been reported [15,16,17]. Therefore, in order to provide the necessary accuracy, new denudation measurement needs to be explored.
In this study, a method based on the Kaiser effect involving acoustic emission (AE) will be proposed, and the mechanism and theory of this method will be discussed. Using this method, the denudation since the Late Cretaceous in the southeastern margin of the Ordos Basin will be computed. Based on the computed results, the influence of denudation and ground topography on the in situ stress of the basin will be analyzed by numerical simulation.
2. Analytical Methods
2.1. Principal of Acoustic Emission to Estimate the Denudation
Many solid materials emit weak acoustic signals under stress [18]. Based on this feature, the AE testing technique is widely used for material damage detection [19,20,21,22,23]. Joseph Kaiser found that if a specimen was once subjected to stress, then it will only have AE activity when the applied load is higher than the largest previous load of stress [24]. This phenomenon is known as the Kaiser effect, which indicates that materials have the ability to accumulate, to retain and, under certain conditions, to reproduce information on the stresses experienced in the past [22,25]. As a geological body, the Kaiser effect of the rock mass reflects its stress environment in the geological history [26,27,28,29]. The Kaiser effect takes place in rocks and materials subjected to cyclic loading/unloading. By field directional sampling and an indoor uniaxial loading test, the historical maximum stress in that direction can be retrieved.
As shown in Figure 1a, 0–0′ is the original surface before the uplift and denudation. For a certain depth below ground (generally deeper than 1000 m), it could be assumed that the rock mass is in a hydrostatic stress state [30,31]. The in situ stress at point A is
where σh0 and σv0 are the horizontal and vertical stresses, respectively, H is the buried depth of point A before denudation, and γ is the unit depth of gravity of the overlying stratum. In this study, γ is equal to 0.027 MPa/m [30,31].
After the formation is lifted and denuded, the current surface becomes 1–1′. For vertical sampling at point A, the stress calculated by AE is recorded as σk (Figure 1b). The inclination angles of the formation before and after the denudation are θ and θ0, respectively. The deflection angle β of the formation is
Then σk can be obtained by:
According to Equation (1) and Equation (3):
The denudation thickness of the overlying strata at point A is:
where h is the buried depth of point A after denudation, which is equal to the sampling depth.
Studies on the basin evolution in the investigated area indicate that β is approximately equal to 0° [32]. Therefore, Equation (5) can be simplified as:
2.2. Influence of Stratum Denudation on In Situ Stress
The uplift and denudation of the formation changes the stress in the rock mass. However, the relative variation amplitudes of σV and σh are different, resulting in a change in the lateral pressure coefficient λ. Assuming the horizontal strain εh is equal to zero and the vertical stress σV is always equal to the weight of the overlying rock mass during the denudation, according to the generalized Hooke’s law, the εh can be obtained by:
where E and μ are the Young’s modulus and Poisson’s ratio of the rock mass, respectively. Then we have:
According to Equation (8), the amounts of stress change after denudation are:
where Δσh and Δσv are the changes in horizontal stress and vertical stress caused by denudation, respectively.
According to Equation (1), Equation (9) and Equation (10), the current σV and σh are:
According to Equation (11) and Equation (12), the current λ is:
The study area is dominated by sedimentary rocks like sandstone so the value of μ would be set to 0.3, according to the laboratory tests. Then Equation (13) can be simplified as:
It can be inferred from Equation (14) that for a certain point underground, the greater the thickness of the upper formation denudation, the higher the current lateral pressure coefficient is.
3. Characteristics of the Study Area
3.1. Geography and Tectonics
The study area is located in the southeast of the Ordos Basin (Figure 2), which is the second largest sedimentary basin in China [33]. It covers an area of 370,000 km2 with its main body slopes to the northwest [34]. Affected by long-term erosion and cutting of rivers, the study area has formed landscapes with undulations and gullies (Figure 3a). The topography of the study area gradually changed from the loess gullies in the north to the mountains in the south (Figure 3b).
The Ordos Basin is a Mesozoic landlocked depression basin formed under the influence of the Indo-China movement and is one of the most stable and complete tectonic units in China [36,37,38]. Studies on basin evolution indicate that the formation has not rotated much in history but currently has a dip angle of 2–3°. Therefore, the formation deflection angle β in the study area should be 0°.
Since the Mesozoic period, the Ordos Basin has experienced four unconformity uplifts and denudation events marked by stratigraphic unconformity interfaces [39,40]. The most intense uplift and denudation event occurred at the end of the Cretaceous period, resulting in the denudation thickness in most parts of the basin, much thicker than that of resedimentary strata [15]. Combined with the sedimentary background of the study area, the stratum denudation thickness estimated by the AE method in this study is equal to that since the end of the Cretaceous.
3.2. Engineering Situation
The samples used in the AE test were collected from an under-construction railway project in the investigated area. The railway runs northwest across the Loess Plateau with an average altitude of 1000 m. Affected by the terrain, some sections had tunnels with an average depth of 100–300 m. The in situ stress tests were carried out in three different tunnels by hydraulic fracturing, and the results are shown in Table 1 (data came from [41]). In the depth of the tunnel, the field was dominated by horizontal stress and the direction of principal compressive stress was NEE. ZK1 and ZK2 lay in the mountain area with steep terrain and an average λ of 1.7, whereas ZK3 was in the loess gully area with an average λ of 2.7.
4. Sampling and Test Methods
Nine samples were collected at four different locations in the study area. Among them, samples ZK1, ZK2, and ZK3 were cores from drilled boreholes in the tunnel, and YC4 was obtained from the surface outcrop. All the samples were sandstone from the Yanchang Formation, Triassic system. They were cut into cylinders with a size of 50 mm × 100 mm (Figure 4), with the long axis of the cylinder vertically downward. In order to reduce the influence of rock sample defects on the judgment of the Kaiser point, rock blocks with homogenous or no obvious cracks were selected.
The AE tests were carried out at the Institute of Acoustic, Chinese Academy of Sciences. The experiment instruments mainly included the PCI-2 AE signal acquisition system developed by the Physical Acoustic Corporation, and the electro-hydraulic servo loading system developed by the GCTS Company. Throughout the experiment, the loading system applied a load to the sample, while the PCI-2 recorded the AE signal from the sample during the loading. The experiment is shown in Figure 5.
Experiments by Yoshikawa and Mogi revealed no or very little influence of the loading rate on the Kaiser effect in rocks [42], so it was set to a normal rate of 0.02 mm/min in this study. In order to ensure the acquisition of a complete and reliable AE signal, two AE probes were installed at the surface of the sample. In addition, the amplitude threshold of the AE was set to 45 dB to reduce the influence of noise on the Kaiser point determination.
5. Results and Discussion
5.1. Thickness of Denudation
In this study, the inflection (change of slope) in the curve, “cumulative AE versus time”, was assumed as the Kaiser point (the intersection of the pink dotted line and the red curve in Figure 6). The dependency of hit rate versus time was used as an auxiliary judgement to make the inflection easier to discriminate. The hit rate means the number of signals received per second, in this study. The stress value corresponding to the Kaiser point was assumed to be the “memorized” stress σk. The cumulative curves and frequency histograms of the AE signals are shown in Figure 6. Some AE activities were detected at stresses below the “memorized” stress σk, which is probably due to the frictional movement along the existing microcracks or the noise generated by the loading system. When the peak (“memorized”) stress value was attained, the AE activity increased dramatically.
For most samples, the Kaiser effect-measured stress can be recognized by the inflection of the cumulative curve or frequency histogram. However, for some samples without an obvious Kaiser effect, it is necessary to combine the stress–time curves for comprehensive determination (Figure 7). In this experiment, samples ZK1 and ZK3 both showed a sharp increase in the AE events at many different times. Points of ZK1-1(a), ZK1-2(b), and ZK3-1(a) all appeared before the failure of the samples. These points indicate signs of the large-scale rupture of the test piece, and not the Kaiser points. Meanwhile, for the samples from the same location, the Kaiser point should be approximate, so ZK1-2(a) is not the Kaiser point either.
The results of denudation thickness are shown in Table 2. The values of the Kaiser effect stress of the nine samples range from 42.5 MPa to 55.0 MPa, and the average denudation thickness of nine samples ranges from 1574.1 m to 1794.4 m. Among the samples, ZK3 has the largest amount of denudation thickness, which is 1794.4 m, while YC4 has the smallest amount of denudation thickness at 1574.1 m. Taking the locations of the samples into account, the denudation thickness decreases gradually from southeast to northwest in the study area. However, it is not overlooked that there are abnormal denudation areas like ZK3.
Many attempts have been made to reconstruct the denudation in the investigated area (Table 3). The denudation thickness obtained by the vitrinite reflectance since the Middle Jurassic was 1800–2000 m [17]. The denudation thicknesses obtained by the stratigraphic comparison and apatite fission track since the Late Cretaceous were 1600–1800 m and 1500–2000 m, respectively [15,16]. The results of previous studies are similar, and the denudation obtained by vitrinite reflectance was slightly larger due to the older geological age. The denudation computed by AE in this study was 1574–1794 m. In contrast to the methods presented up to now in the basin, the AE method did not rely on logging data or on the assumption that key parameters were required, but directly computed the denudation thickness through experimentation. It seems that the AE method is easier to use and more applicable.
5.2. Effect of Denudation on In Situ Stress
Based on the estimated denudation thickness, the theoretical value of the current lateral pressure coefficient λ was calculated, as shown in Table 4. The measured value of the current lateral pressure coefficient λ′ by the hydraulic fracturing method is also listed in Table 4 for comparison. The value of λ is 4.0–8.3 with an average value of 6.1, and the value of λ′ is 1.2–3.5 with an average value of 2.3. Both the analytical value and measured value indicate that the lateral pressure coefficient increases due to the influence of strata uplift and denudation. However, compared with the measured results, the analytical value is much larger.
The key assumption of the theoretical derivation is that the current surface is horizontal and somewhat different from the actual terrain. The current surface of the study area is undulating, and ZK1, ZK2 and ZK3 are all located on the topographic abrupt-change zone. For further studies on the impact of topography on in situ stress, a numerical simulation by FLAC3D was adopted to analyze the process of strata denudation.
Five models were built to analyze the influence of ground fluctuation on stress by setting the arc surface at different angles (Figure 8). The numerical models were 3200 m wide. In order to ensure the same denudation thickness above the model center, the heights of different models were varied. The mechanics of the model was homogeneous elastic and the elastic modulus E = 30 GPa, Poisson’s ratio μ = 0.3 and the bulk density γ = 27 kN/m3. The generalized Hooke’s law was adopted as the governing equation to ensure the comparability between numerical simulation and theoretical calculation. The normal displacement of the lower and surrounding boundary was constrained, and the upper boundary was a free surface. The rock mass was assumed to be in a hydrostatic stress state before the denudation, and the vertical stress and horizontal stress increased linearly with depth. The denudation of the upper strata was simulated by excavation.
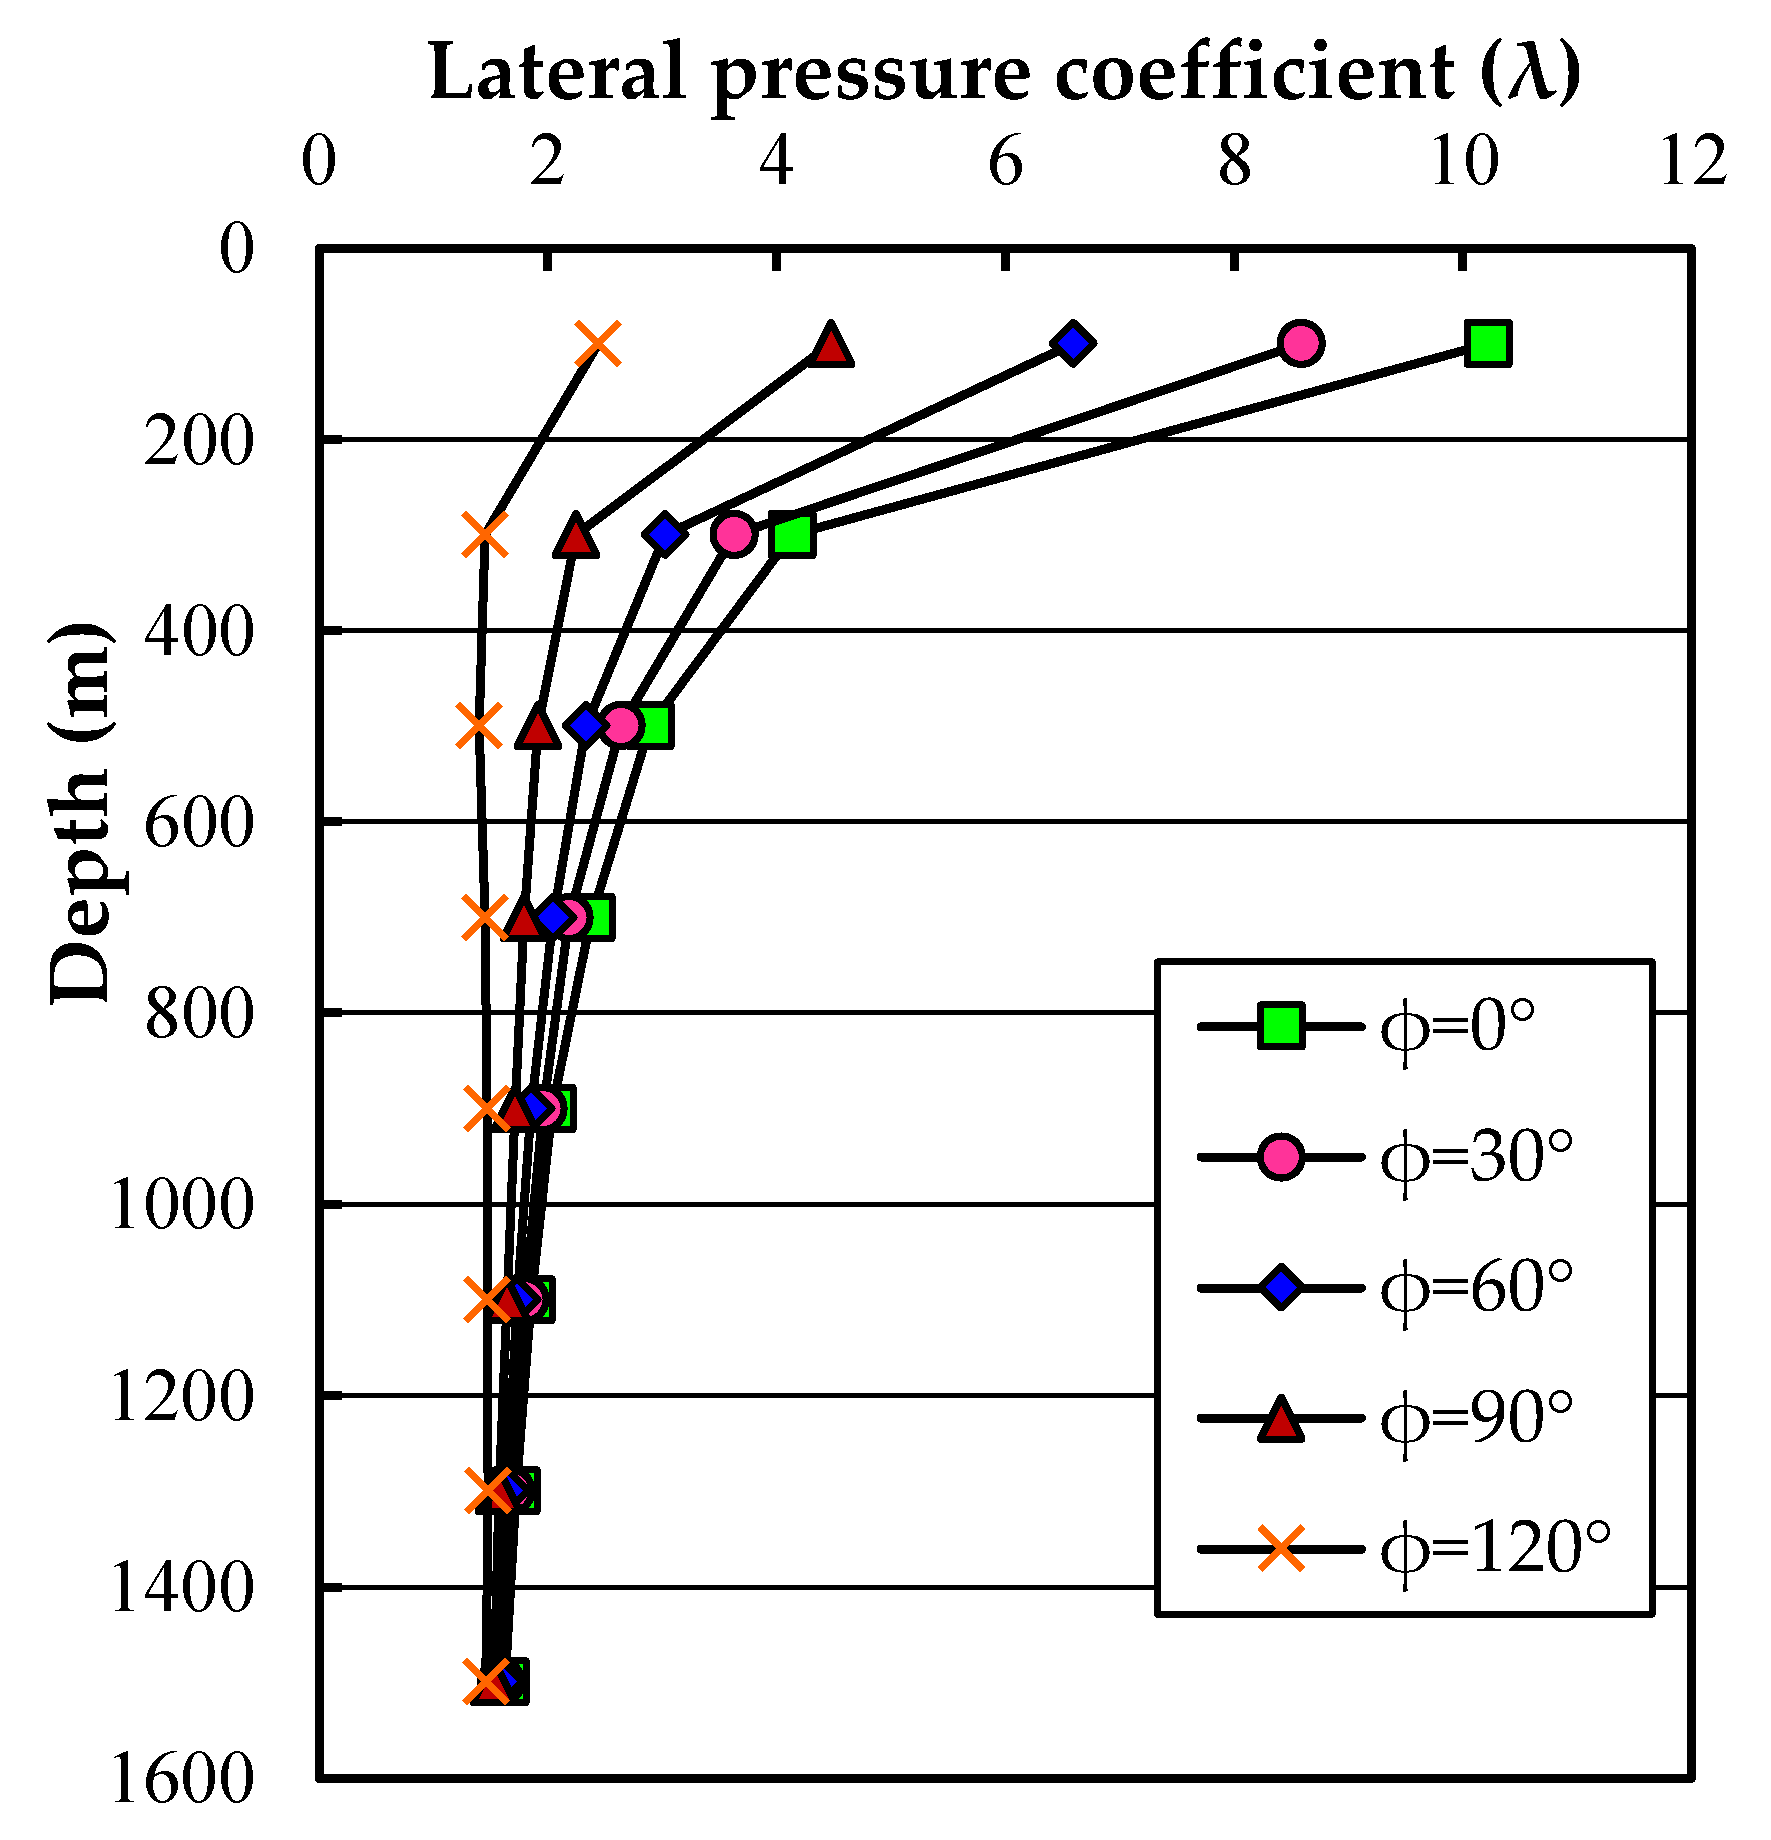
The simulation results are shown in Figure 9. When φ = 0°, the values of λ at depths of 135 m, 200 m and 310 m are 7.4, 5.6 and 4.0, respectively. The results are very close to the theoretical values (Table 3). When the value of φ is constant, the value of λ decreases as the buried depth increases. The closer to the ground, the greater change in λ. When the buried depth exceeds 1000 m, the value of λ is approximately 1.4. As the value of φ increases, the amplitude of ground uplift increases and the value of λ decreases at the same depth. When the value of φ increases to 120°, the values of λ at depths of 135 m, 200 m, and 300 m decrease to 1.9, 1.6, and 1.5, respectively. In this case, the numerical simulation results are close to the measured results, indicating that the topographical terrain is an important cause of the difference in the value of λ. Therefore, in the measured results, the ground height difference of ZK1 and ZK2 is large, so the value of λ is small. Conversely, the ground height difference of ZK3 is small, so the value of λ is large.
6. Conclusions
A method of computing the denudation thickness in sedimentary basins using the Kaiser effect was proposed. The mechanism and theory of the method was discussed. The method was simple and applicable to basins without large strata deflection.
The method was applied to reconstruct the denudation of the Ordos Basin, and the results were in good agreement with the reported values.
The influence of denudation and ground topography on the current basin’s in situ stress field was discussed. From the discussion, the reason for the difference of the measured lateral pressure coefficient in the investigated area was revealed.
In future research, investigation of the evolutionary history of the basin should be conducted for a better understanding of the values computed by the AE method. Furthermore, the combination of the proposed method and other methods is recommended to provide more reliable results.
Author Contributions
Methodology, S.W. and Y.S.; Field Investigation, S.W. and Y.S.; Experimentation, S.W. and Y.L.; Writing-Original Draft Preparation, S.W.; Writing-Review & Editing, S.W., Y.S. and Y.L.
Funding
We appreciate financial support by the National Natural Science Foundation of China (NSFC) (Nos. 41602327 and 41772320), the Strategic Priority Research Program of the Chinese Academy of Sciences (No. XDB10030100) and the Chinese Special Funds for Major State Basic Research Project under Grant No. 2014CB046901.
Acknowledgments
The author would like to thank Changjiang River Scientific Research Institute of Changjiang Water Resources Commission and China Railway Design Corporation to provide the rock samples and in situ stress test results.
Conflicts of Interest
The authors declare no conflict of interest.
References
- Hedberg, H.D. Relation of methane generation to undercompacted shales, shale diapirs, and mud volcanoes. AAPG Bull. 1974, 58, 661–673. [Google Scholar]
- Levine, J.R. Coalification: The Evolution of Coal as Source Rock and Reservoir Rock for Oil and Gas: Chapter 3; AAPG: Tulsa, OK, USA, 1993. [Google Scholar]
- Littke, R.; Urai, J.L.; Uffmann, A.K.; Risvanis, F. Reflectance of dispersed vitrinite in Palaeozoic rocks with and without cleavage: Implications for burial and thermal history modeling in the Devonian of Rursee area, northern Rhenish Massif, Germany. Int. J. Coal Geol. 2012, 89, 41–50. [Google Scholar] [CrossRef]
- Tissot, B.; Durand, B.; Espitalie, J.; Combaz, A. Influence of nature and diagenesis of organic matter in formation of petroleum. AAPG Bull. 1974, 58, 499–506. [Google Scholar]
- de Souza, V.L.; Rodrigues, K.R.; Pedroza, E.H.; Melo, R.T.d.; Lima, V.L.d.; Hazin, C.A.; de Almeida, M.G.; Nascimento, R.K.D. Sedimentation Rate and 210Pb Sediment Dating at Apipucos Reservoir, Recife, Brazil. Sustainability 2012, 4, 2419–2429. [Google Scholar] [CrossRef] [Green Version]
- Galloway, W.E. Genetic stratigraphic sequences in basin analysis I: Architecture and genesis of flooding-surface bounded depositional units. AAPG Bull. 1989, 73, 125–142. [Google Scholar]
- Guidish, T.; Kendall, C.S.C.; Lerche, I.; Toth, D.; Yarzab, R. Basin evaluation using burial history calculations: An overview. AAPG Bull. 1985, 69, 92–105. [Google Scholar]
- Van Hinte, J. Geohistory analysis--application of micropaleontology in exploration geology. AAPG Bull. 1978, 62, 201–222. [Google Scholar]
- Bierman, P.; Steig, E.J. Estimating rates of denudation using cosmogenic isotope abundances in sediment. Earth Surf. Process. Landf. 1996, 21, 125–139. [Google Scholar] [CrossRef]
- Dow, W.G. Kerogen studies and geological interpretations. J. Geochem. Explor. 1977, 7, 79–99. [Google Scholar] [CrossRef]
- Gallagher, K. Evolving temperature histories from apatite fission-track data. Earth Planet. Sci. Lett. 1995, 136, 421–435. [Google Scholar] [CrossRef]
- Katz, B.; Pheifer, R.; Schunk, D. Interpretation of discontinuous vitrinite reflectance profiles. AAPG Bull. 1988, 72, 926–931. [Google Scholar]
- Yin, T. A multi-information method for computing erosional thickness. Pet. Explor. Dev. 1992, 19, 42–47. [Google Scholar]
- Magara, K. Compaction and Fluid Migration; Elsevier: Amsterdam, The Netherlands, 1978; Volume 9. [Google Scholar]
- Chen, R.; Luo, X.; Chen, Z.; Yu, J.; Yang, Y. Restoration of burial history of four periods in Ordos Basin. Acta Pet. Sin. 2006, 27, 43–47. [Google Scholar]
- Liu, W.; Qin, M.; Qi, F.; Xiao, S.; Wang, Z. Analysis on the Meso-Neozoic subsidence and uplift history of the periphery of Ordos basin using apatite fission track. Uranium Geol. 2008, 24, 221–227. [Google Scholar]
- Ren, Z.; Zhang, S.; Gao, S.; Cui, J.; Xiao, Y.; Xiao, H. Tectonic thermal history and its significance on the formation of oil and gas accumulation and mineral deposit in Ordos Basin. Sci. China Ser. D Earth Sci. 2007, 50, 27–38. [Google Scholar] [CrossRef]
- Goodman, R.E. Subaudible noise during compression of rocks. Geol. Soc. Am. Bull. 1963, 74, 487–490. [Google Scholar] [CrossRef]
- Haider, M.F.; Giurgiutiu, V. A Helmholtz Potential Approach to the Analysis of Guided Wave Generation During Acoustic Emission Events. J. Nondestruct. Eval. Diagn. Progn. Eng. Syst. 2018, 1, 021002. [Google Scholar] [CrossRef]
- Haider, M.F.; Giurgiutiu, V. Analysis of axis symmetric circular crested elastic wave generated during crack propagation in a plate: A Helmholtz potential technique. Int. J. Solids Struct. 2018, 134, 130–150. [Google Scholar] [CrossRef]
- Hamstad, M. Frequencies and amplitudes of AE signals in a plate as a function of source rise time. In Proceedings of the 29th European Conference on Acoustic Emission Testing, Vienna, Austria, 8–10 September 2010; pp. 8–10. [Google Scholar]
- Lavrov, A. The Kaiser effect in rocks: Principles and stress estimation techniques. Int. J. Rock Mech. Min. Sci. 2003, 40, 151–171. [Google Scholar] [CrossRef]
- Zelenyak, A.-M.; Hamstad, M.A.; Sause, M.G. Modeling of acoustic emission signal propagation in waveguides. Sensors 2015, 15, 11805–11822. [Google Scholar] [CrossRef]
- Kaiser, J. Erkenntnisse und Folgerungen aus der Messung von Geräuschen bei Zugbeanspruchung von metallischen Werkstoffen. Arch. Eisenhüttenwes. 1953, 24, 43–45. [Google Scholar] [CrossRef]
- Kurita, K.; Fujii, N. Stress memory of crystalline rocks in acoustic emission. Geophys. Res. Lett. 1979, 6, 9–12. [Google Scholar] [CrossRef]
- Sun, B.; Ding, Y.; Shao, Z.; Zhou, X.; Wang, X. Application of acoustic emission technique in determination of fossil and present-day stresses in oil fields. J. Geomech. 1996, 2, 11–17. [Google Scholar]
- Xu, J.; Dai, J. Application of acoustic emission in the study of the number of Cenozoic tectonic phases in the Dongying Subbasin. J. Geomech. 2004, 10, 172–178. [Google Scholar]
- Yuanchen, D. Discussion on paleostress measurement by AE method. J. Geomech. 2000, 6, 45–52. [Google Scholar]
- Michihiro, K.; Fujiwara, T.; Yoshioka, H. Study on estimating geostresses by the Kaiser effect of AE. In Proceedings of the 26th US Symposium on Rock Mechanics (USRMS), Shanghai, China, 26–28 May 2006. [Google Scholar]
- Brown, E.; Hoek, E. Trends in relationships between measured in-situ stresses and depth. Int. J. Rock Mech. Min. Sci. 1975, 211–215. [Google Scholar] [CrossRef]
- Jing, F.; Sheng, Q.; Zhang, Y.; Luo, C.; Liu, Y. Research on distribution rule of shallow crustal geostress in China mainland. Chin. J. Rock Mech. Eng. 2007, 26, 2056–2062. [Google Scholar]
- Zhang, H.; He, Z.; Jin, X.; Zhang, P.; Meng, Z. Tectonic Evolution and Coal Accumulation of the Ordos Basin; Geological Publishing House: Beijing, China, 2005. [Google Scholar]
- Dai, J.; Li, J.; Luo, X.; Zhang, W.; Hu, G.; Ma, C.; Guo, J.; Ge, S. Stable carbon isotope compositions and source rock geochemistry of the giant gas accumulations in the Ordos Basin, China. Organ. Geochem. 2005, 36, 1617–1635. [Google Scholar] [CrossRef]
- Jiang, Z.; Mao, Z.; Shi, Y.; Wang, D. Multifractal Characteristics and Classification of Tight Sandstone Reservoirs: A Case Study from the Triassic Yanchang Formation, Ordos Basin, China. Energies 2018, 11, 2242. [Google Scholar] [CrossRef]
- Wang, J.; Liu, C.; Guo, Z.; Zhang, D. Sedimentary response of regional tectonic transformation in Late Triassic Yanchang period at the central and southern Ordos Basin. Earth Sci. Front. 2015, 22, 194–204. [Google Scholar]
- Huang, J. On Major Tectonic Forms of China; National Geological Survey of China under the Ministry of Economic Affairs: Taipei, Taiwan, 1945.
- Yang, Y.; Li, W.; Ma, L. Tectonic and stratigraphic controls of hydrocarbon systems in the Ordos basin: A multicycle cratonic basin in central China. AAPG Bull. 2005, 89, 255–269. [Google Scholar] [CrossRef]
- Li, S. Vortex structure and other problems relating to the compounding of geotectonic systems of northwestern China. Acta Geol. Sin. 2014, 34, 339–410. [Google Scholar]
- Zhao, M.; Behr, H.-J. Vitrinite reflectance in Triassic with relation to geothermal history of Ordos Basin. Acta Pet. Sin. 2007, 17, 15–23. [Google Scholar]
- Liu, C.; Zhao, H.; Wang, F. Attributes of the Mesozoic structure on the west margin of the Ordos Basin. Acta Geol. Sin. 2005, 79, 737–747. [Google Scholar]
- CRSRI. Menghua Railway In-Situ Stress Test Report; Changjiang River Scientific Research Institute of Changjiang Water Resources Commission: Wuhan, China, 2018. [Google Scholar]
- Yoshikawa, S.; Mogi, K. Experimental studies on the effect of stress history on acoustic emission activity—A possibility for estimation of rock stress. J. Acoust. Emiss. 1989, 8, 113–123. [Google Scholar]
Figure 1.
Acoustic emission (AE) to reconstruct strata denudation. (a) Schematic diagram of strata denudation and (b) vertical sampling and strata deflection after denudation.
Figure 1.
Acoustic emission (AE) to reconstruct strata denudation. (a) Schematic diagram of strata denudation and (b) vertical sampling and strata deflection after denudation.
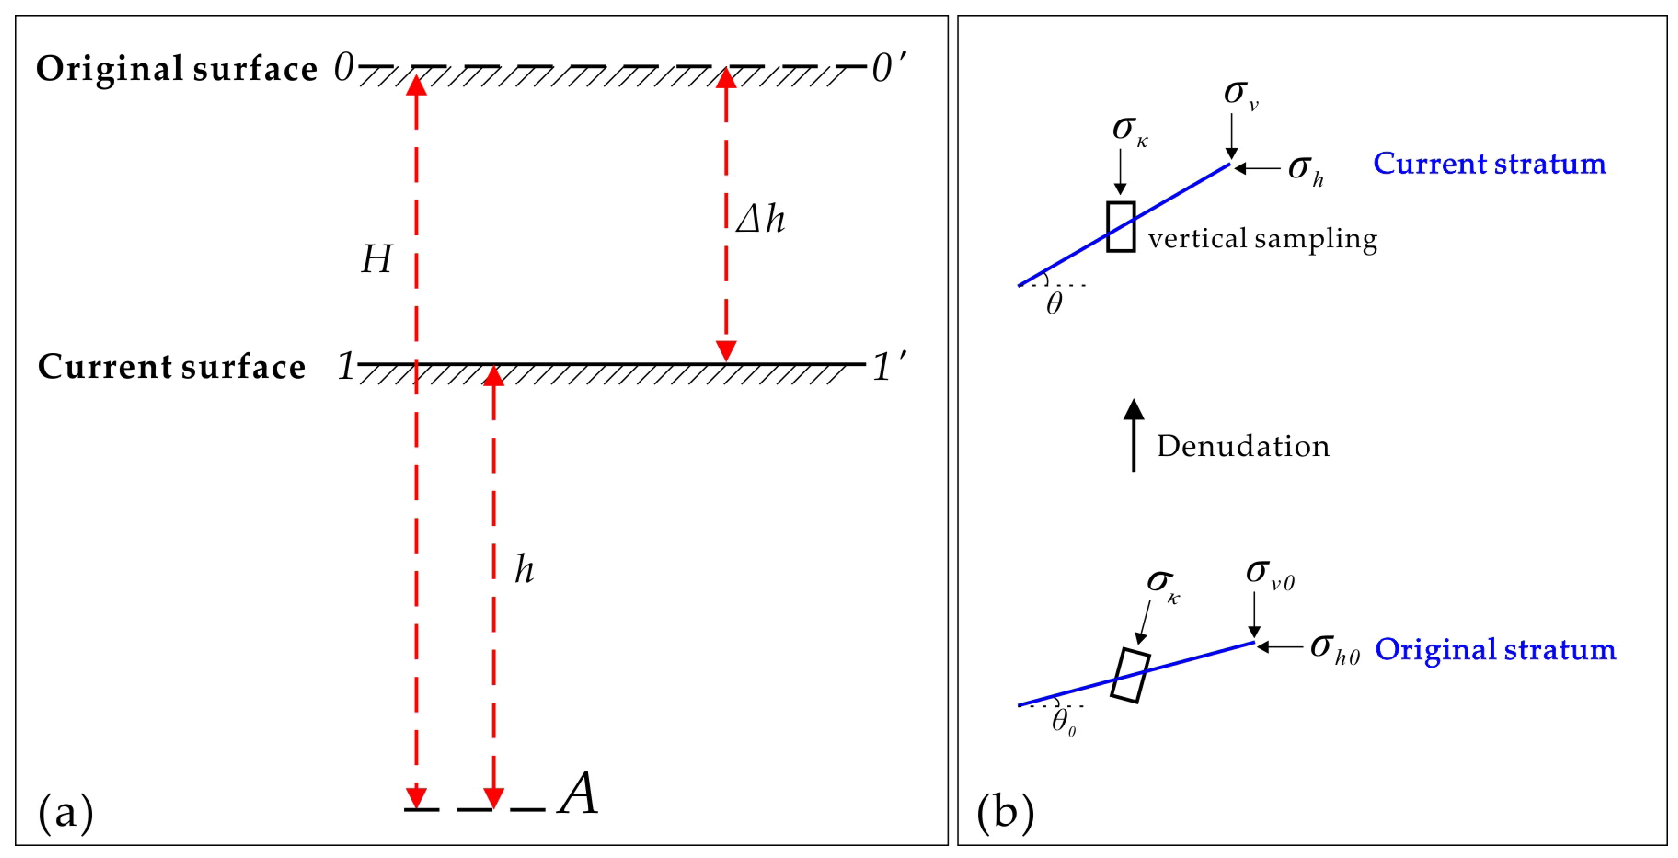
Figure 2.
Tectonic map of the Ordos Basin (modified from Reference [35]).
Figure 2.
Tectonic map of the Ordos Basin (modified from Reference [35]).

Figure 3.
Topographic map of the study area. (a) Planar topographic map and (b) profile map of the line AA′.
Figure 3.
Topographic map of the study area. (a) Planar topographic map and (b) profile map of the line AA′.
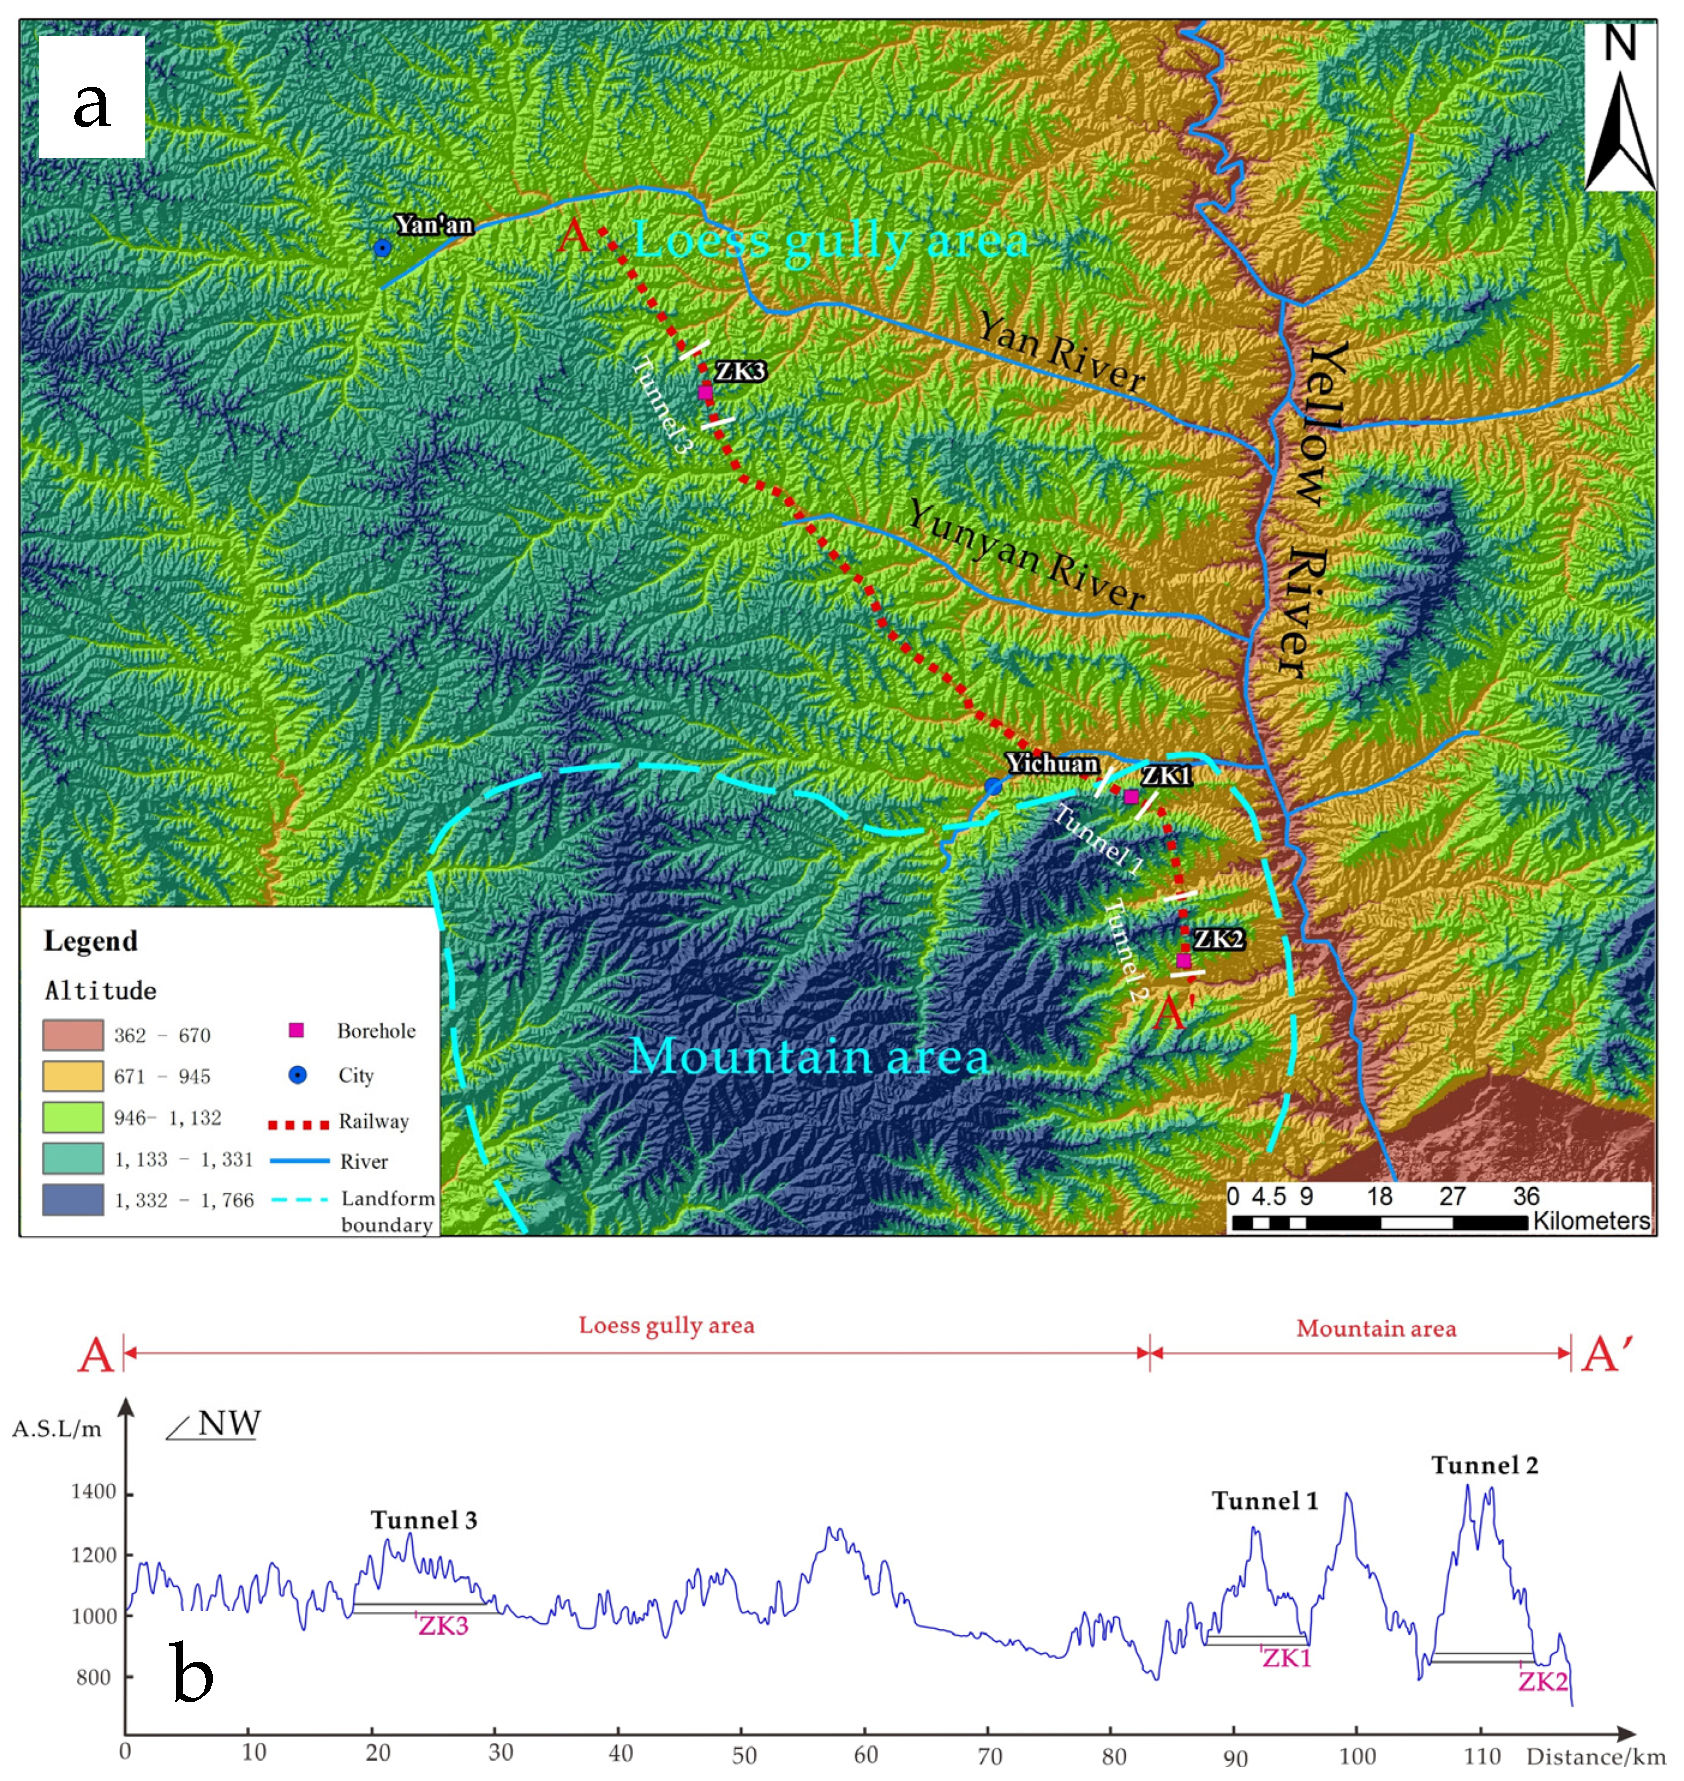
Figure 4.
Photos of some samples, (a) before the test and (b) after the test.
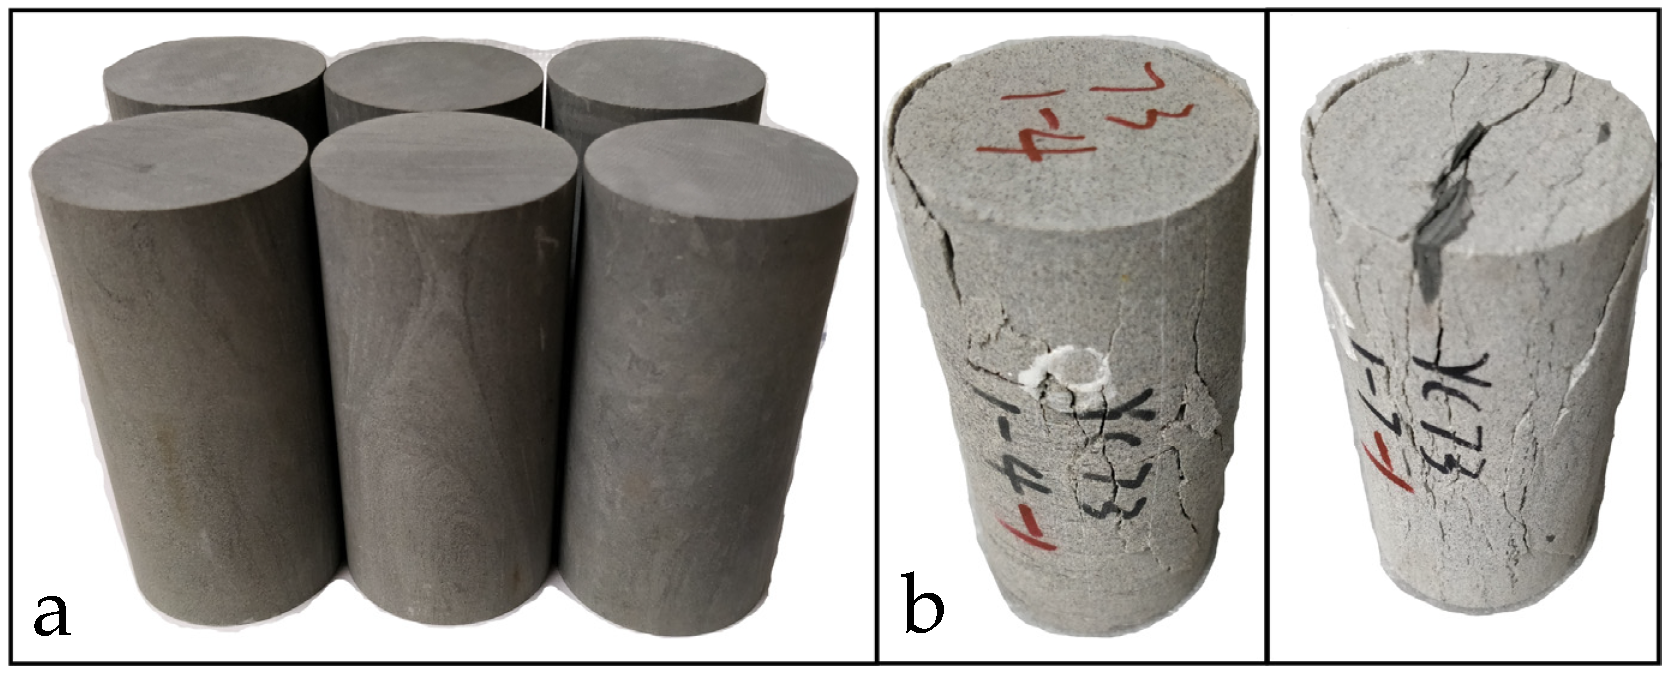
Figure 5.
The uniaxial compression and AE test device. (a) Photo of the device and (b) schematic diagram of the device.
Figure 5.
The uniaxial compression and AE test device. (a) Photo of the device and (b) schematic diagram of the device.
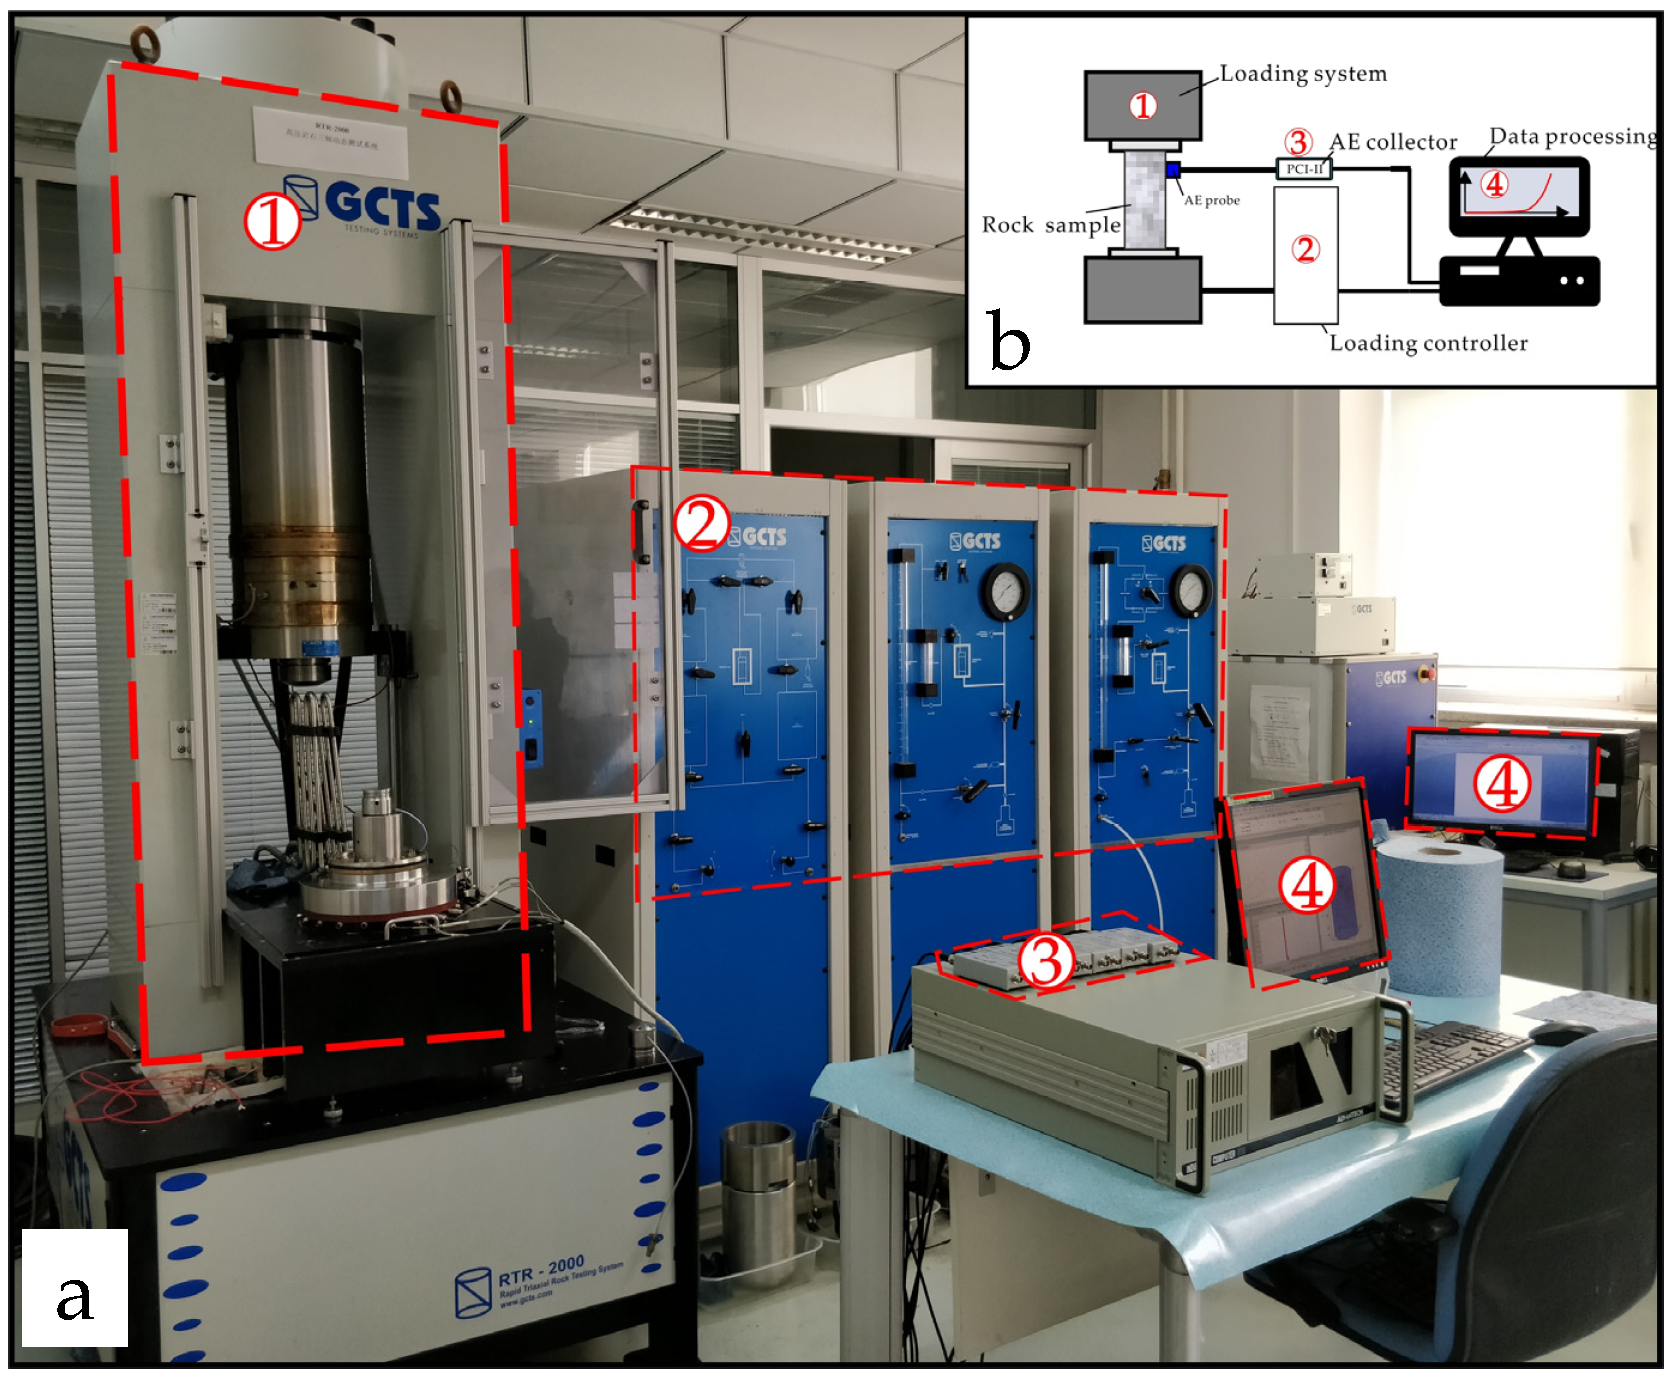
Figure 6.
The cumulative curves and histograms of AE events.
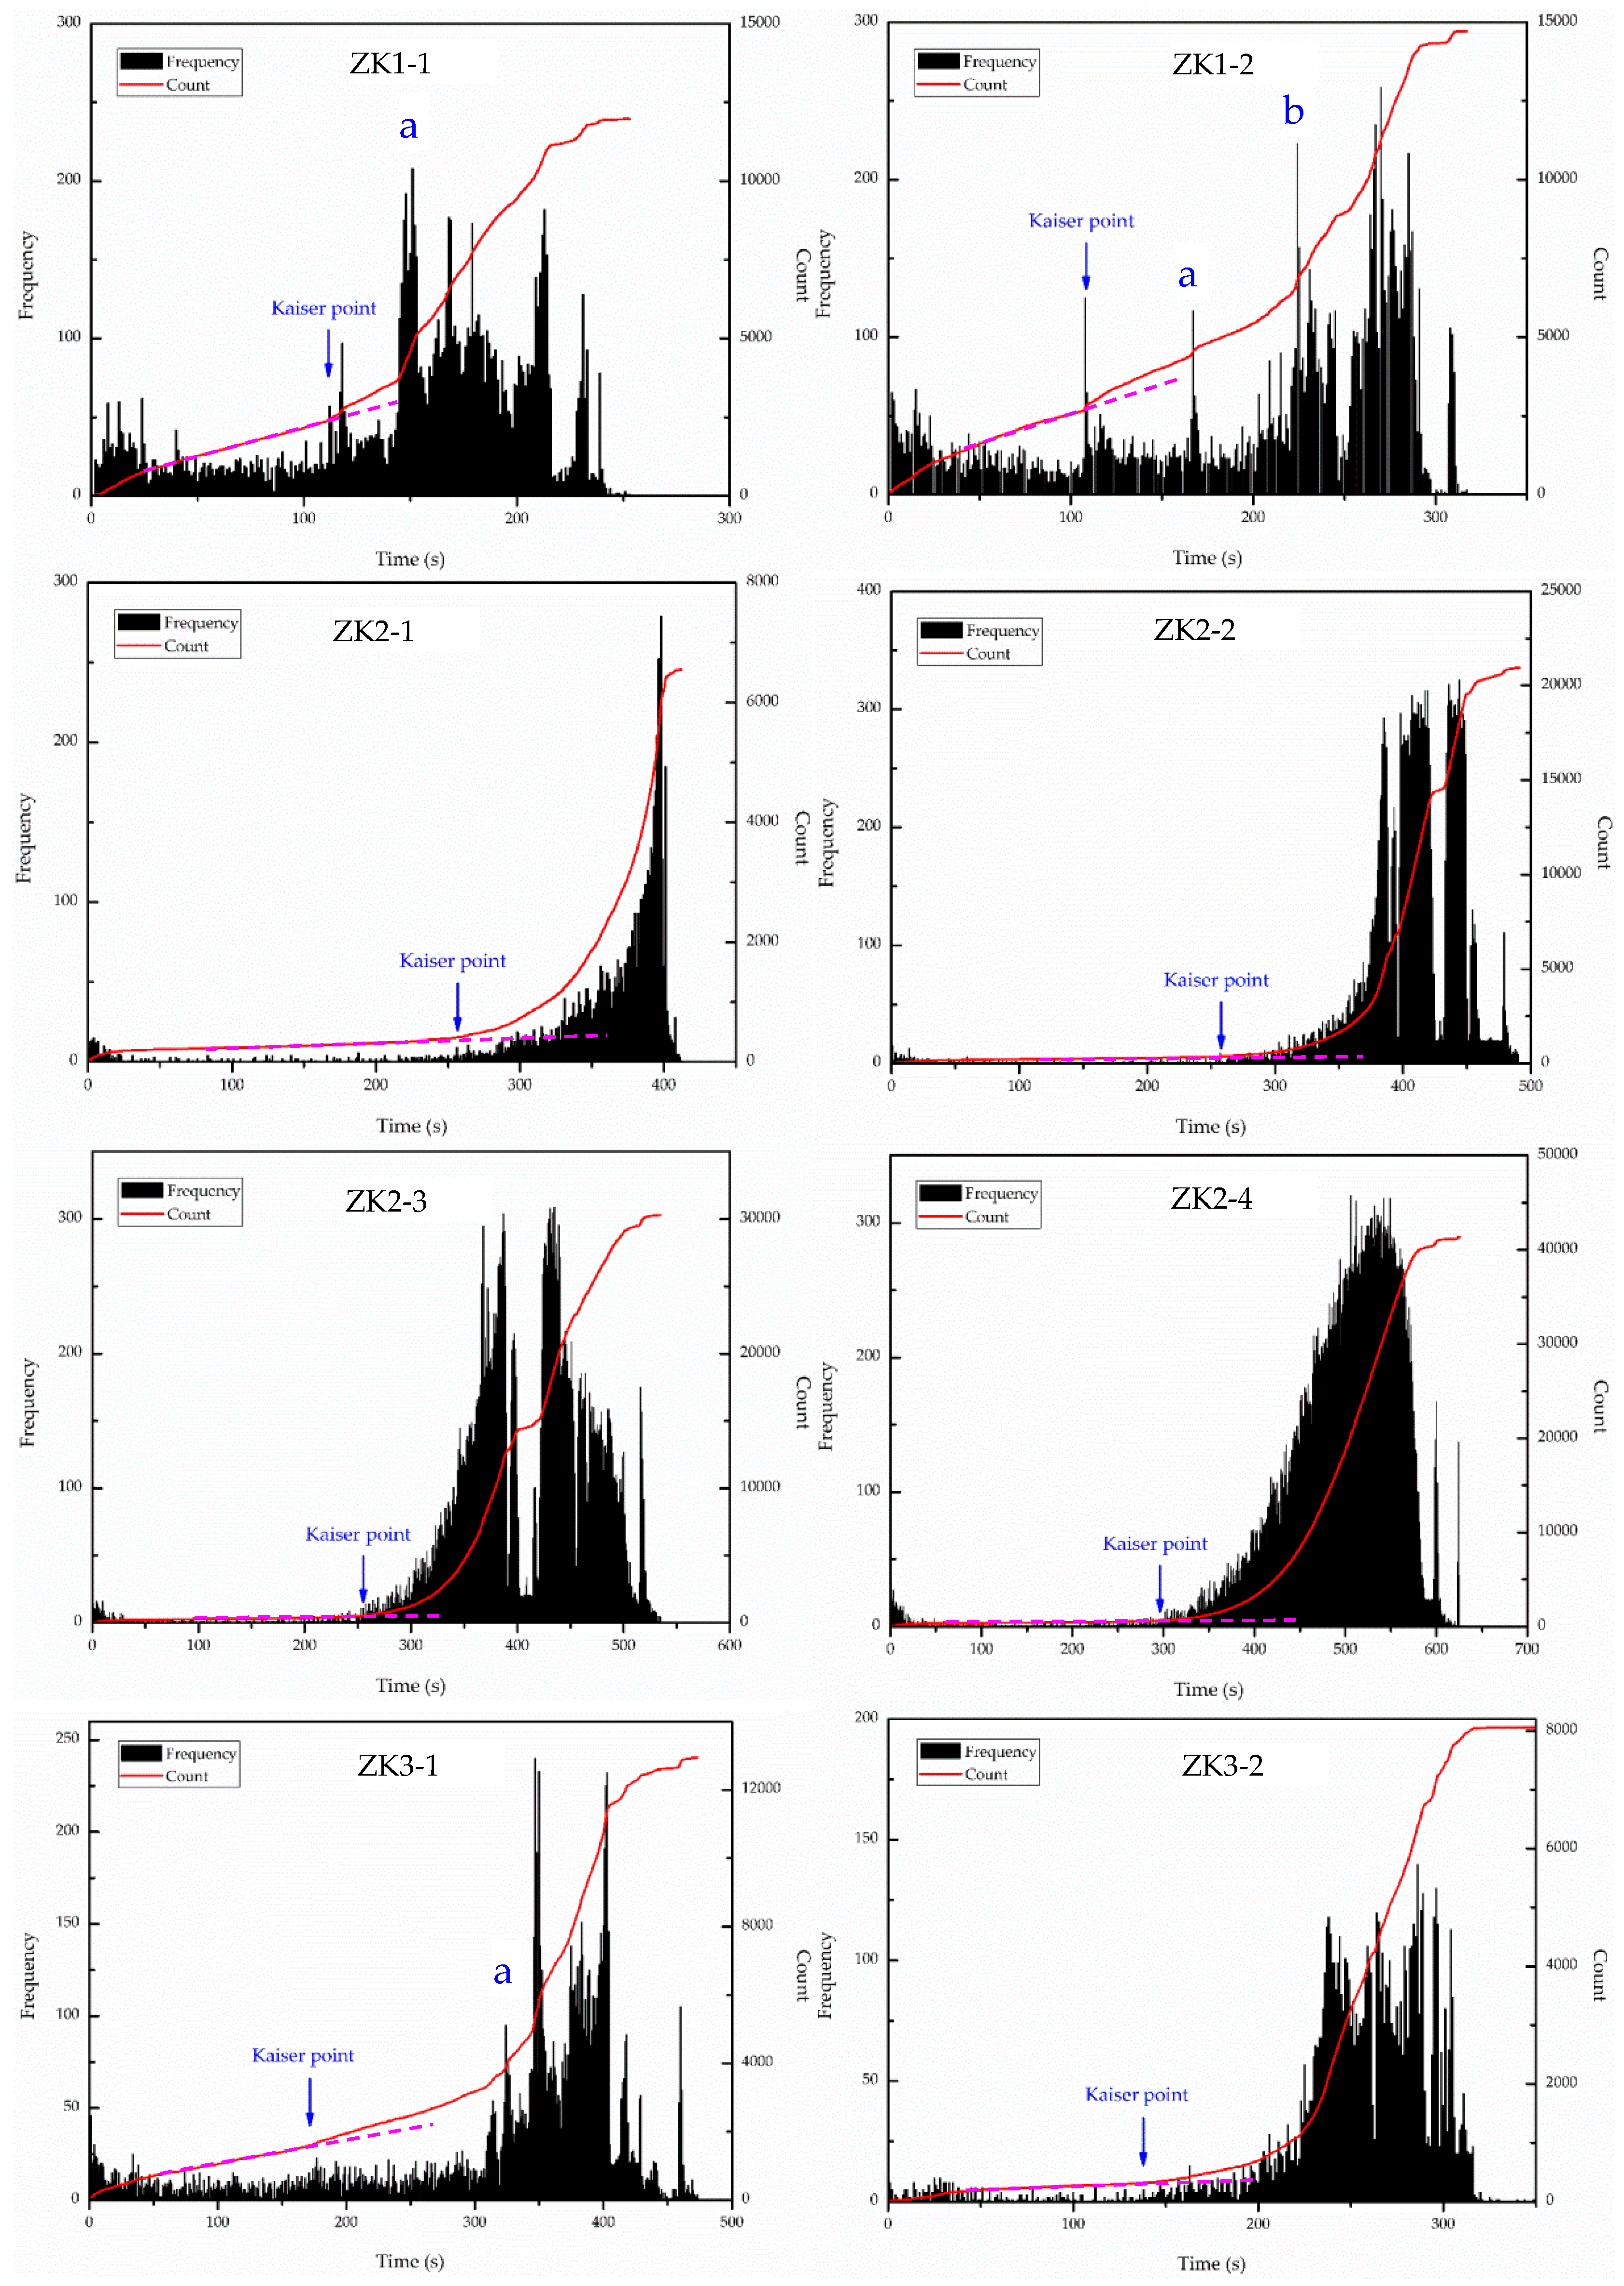
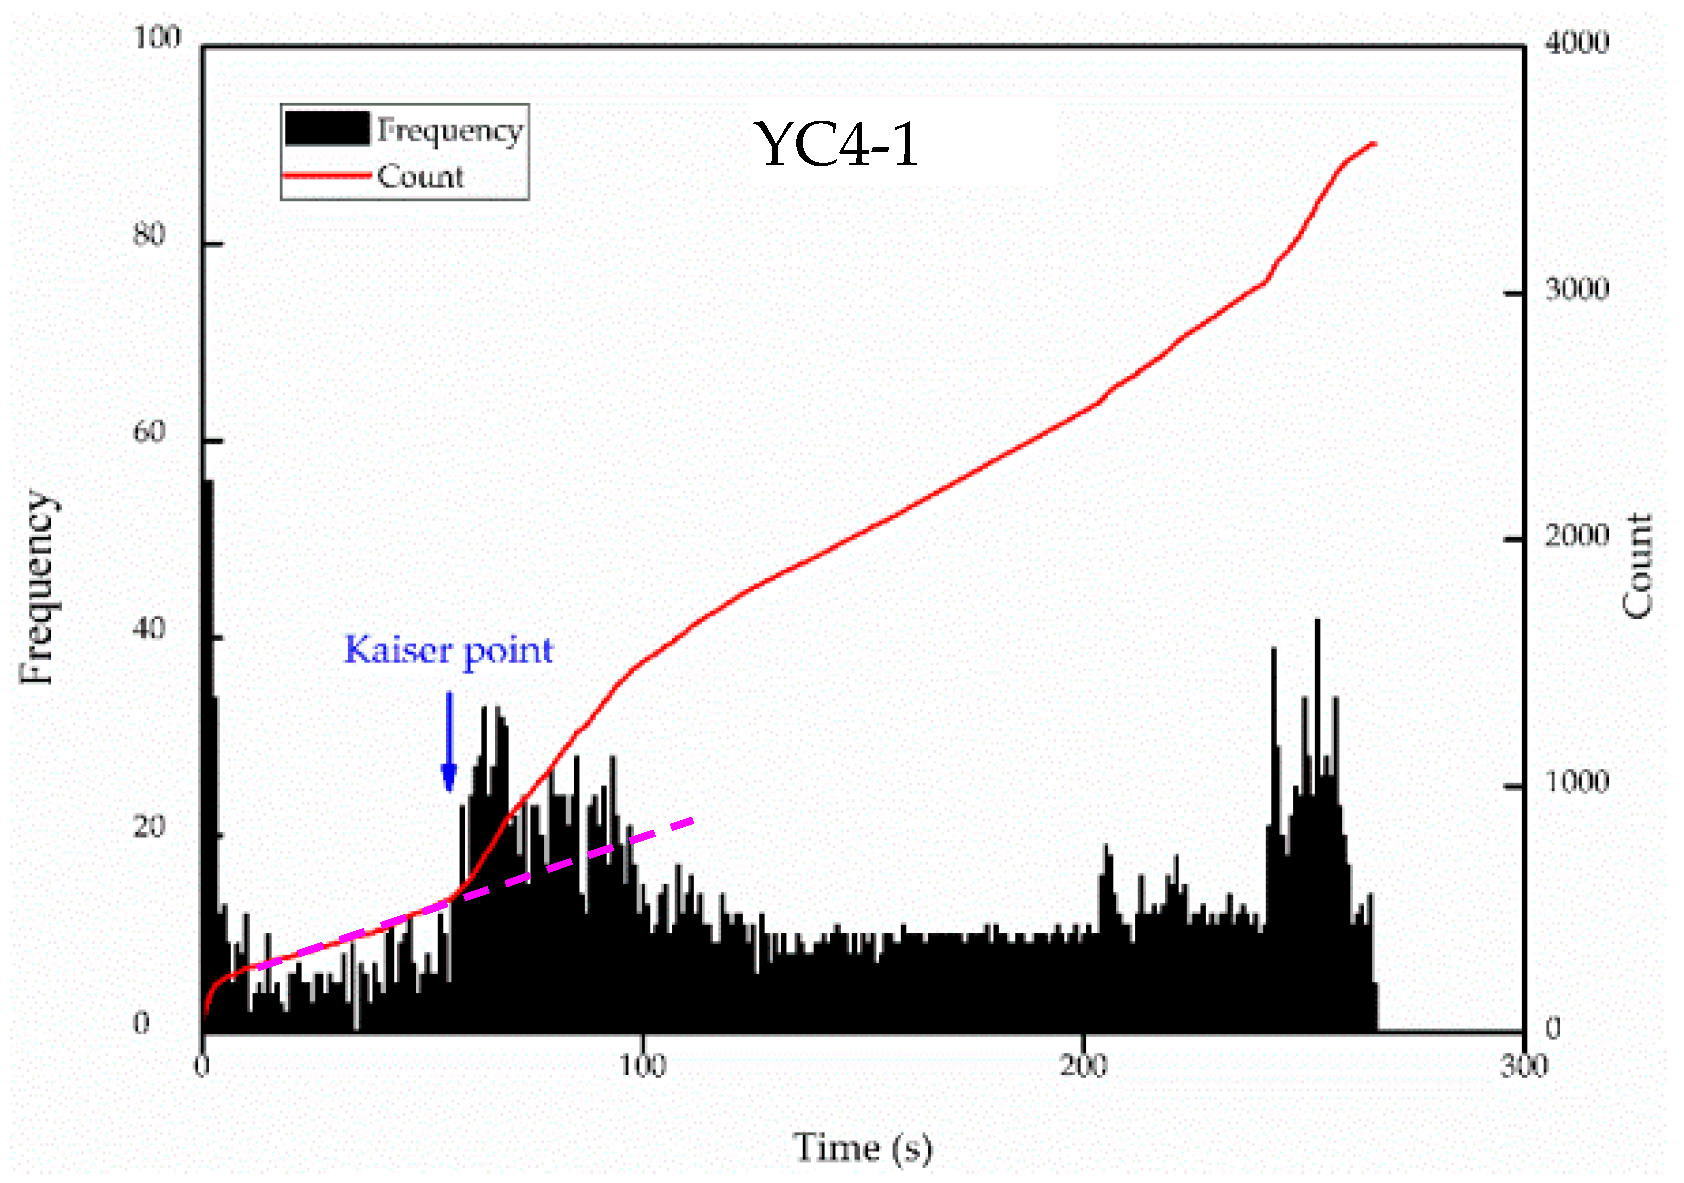
Figure 7.
The stress–time curves of uniaxial compression test.
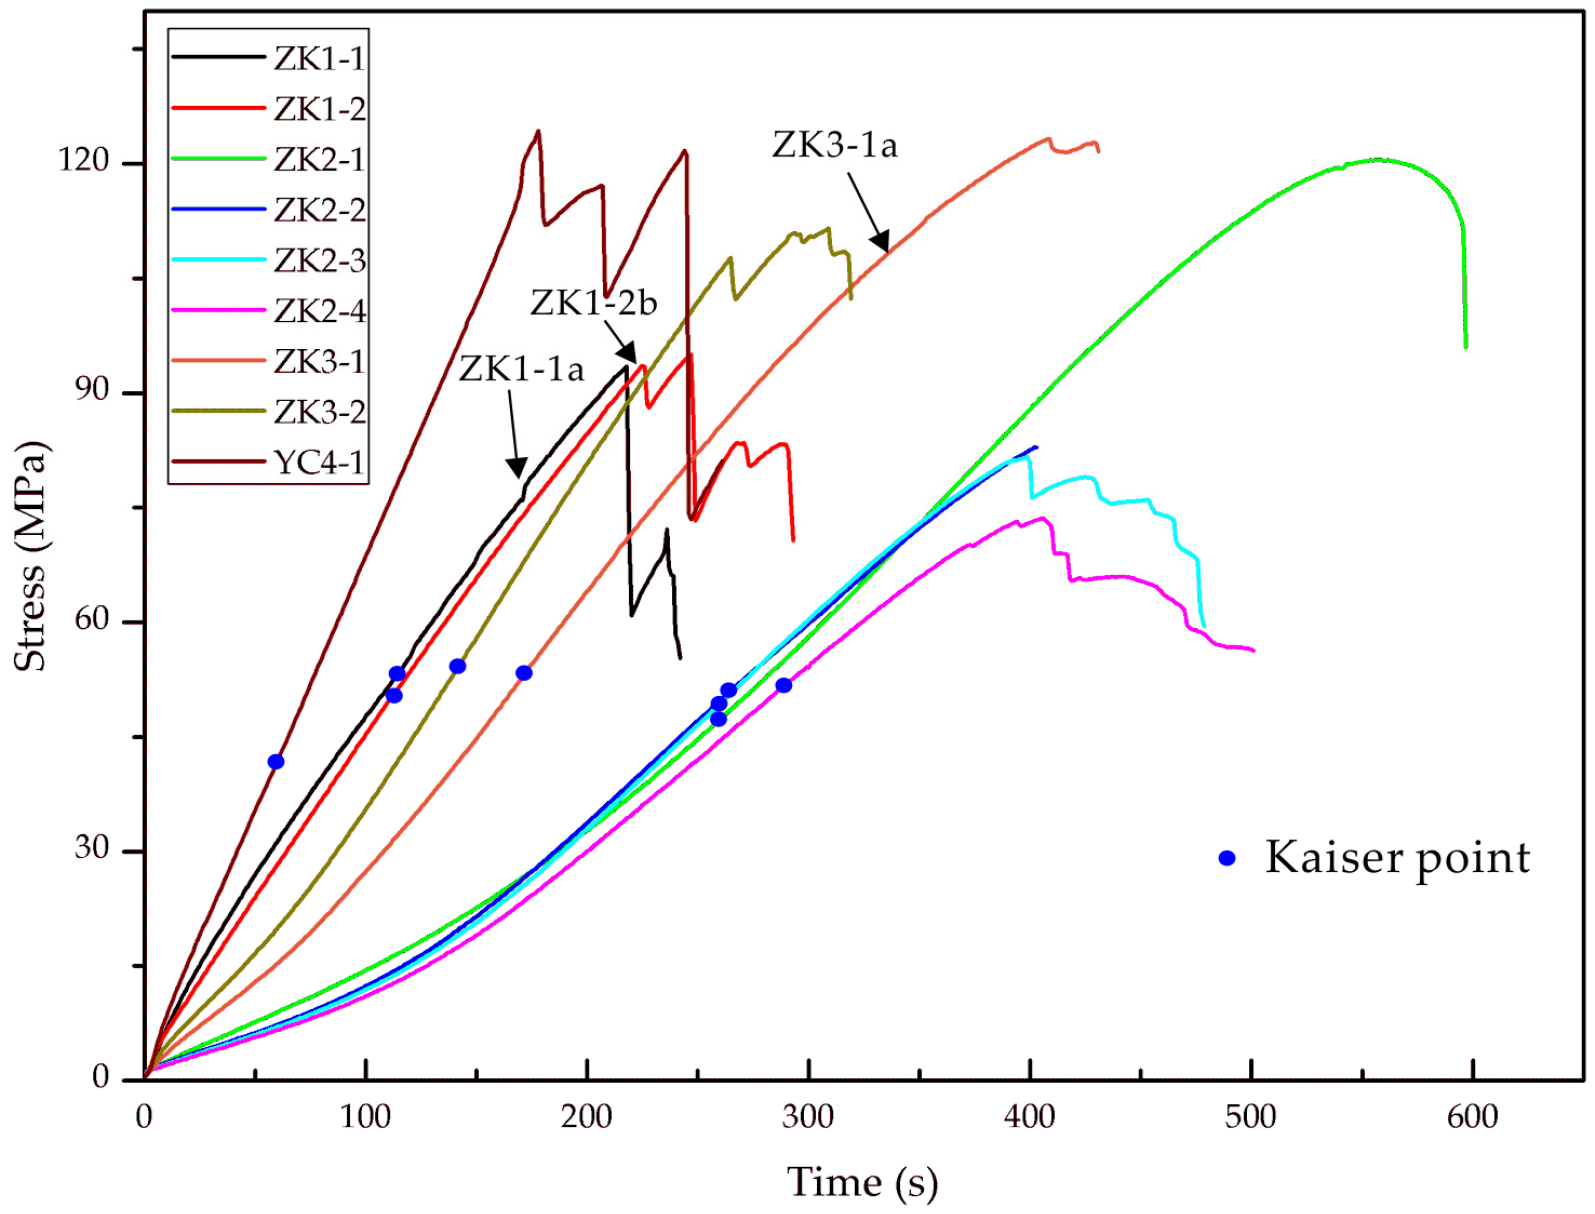
Figure 8.
The numerical models with different ground arc angles.
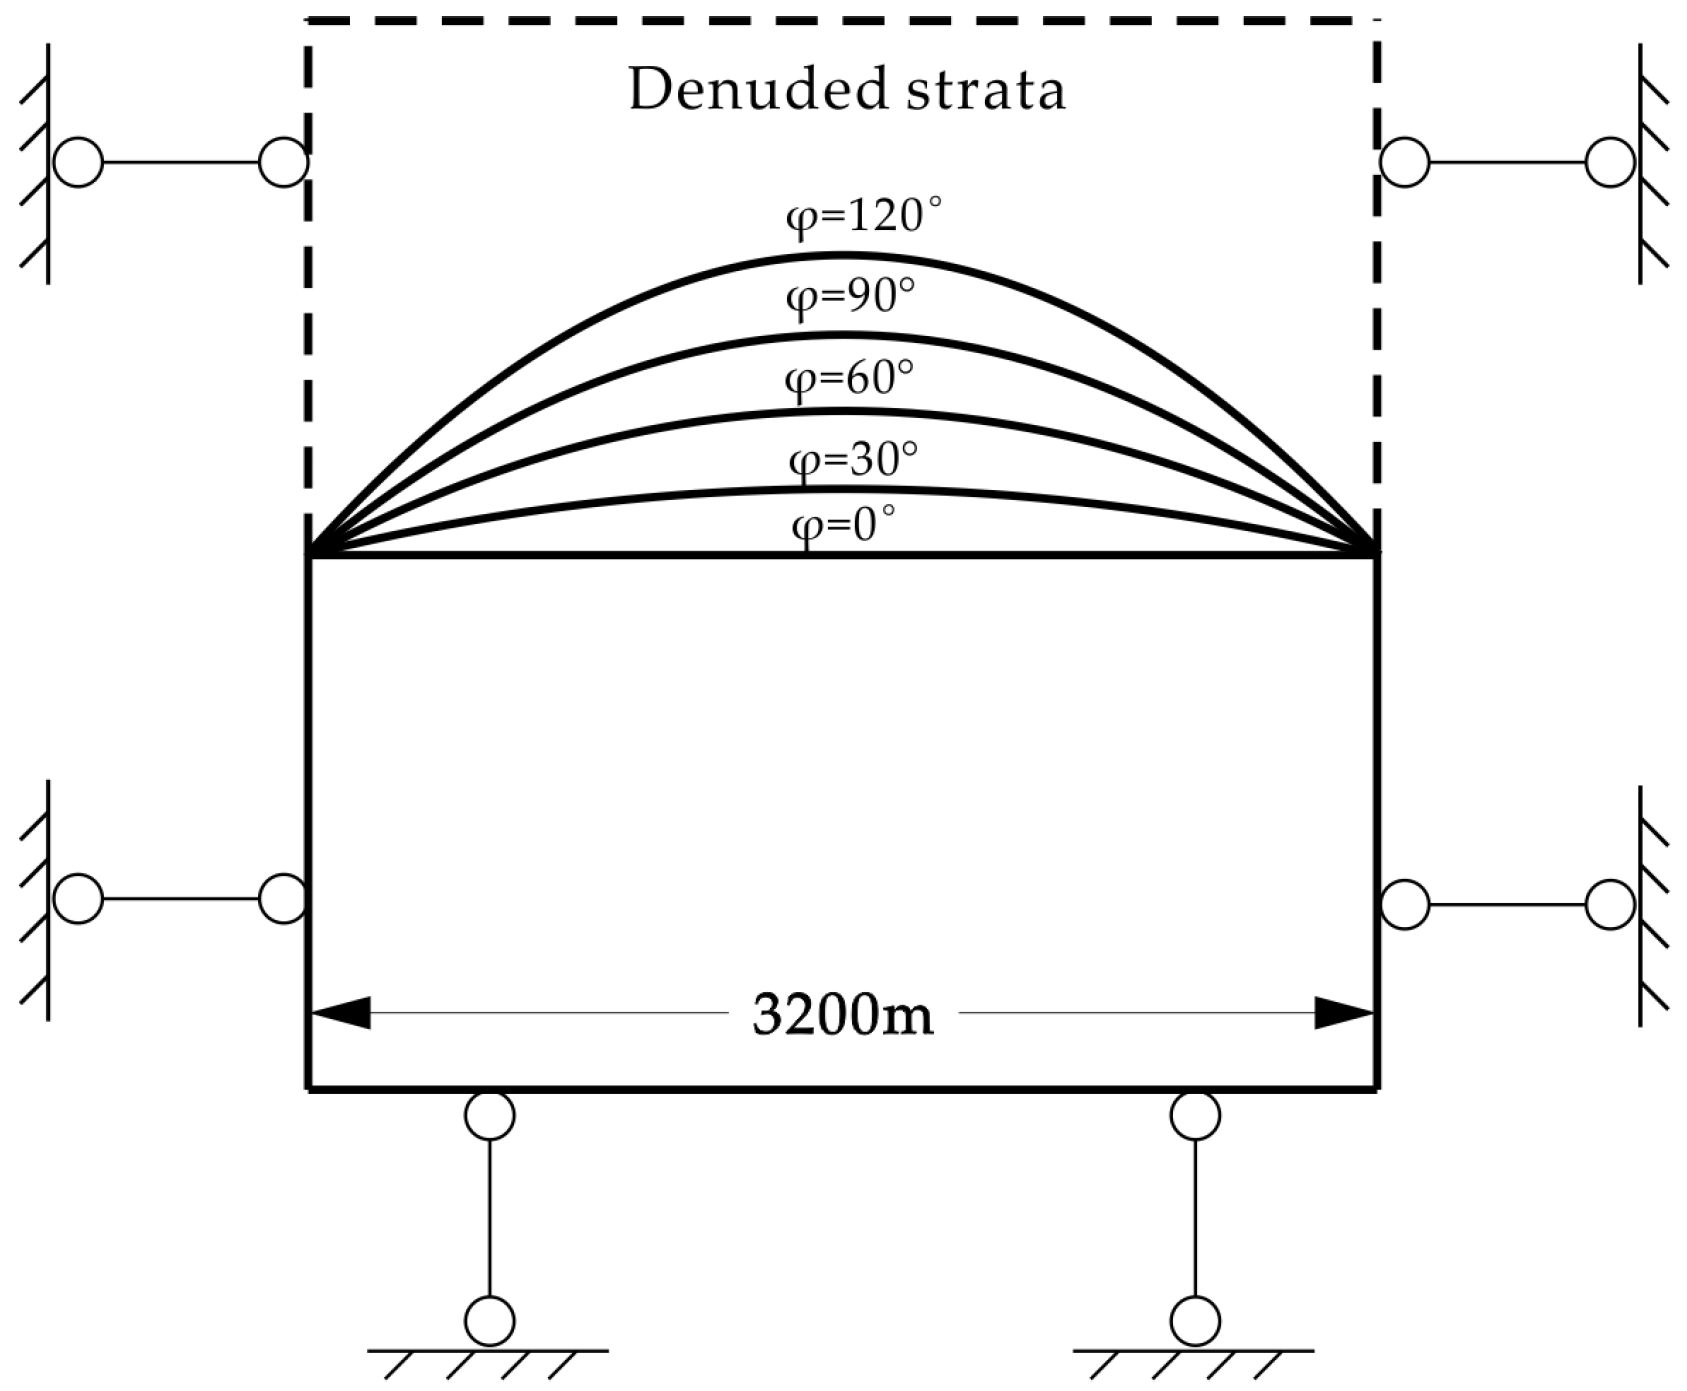
Figure 9.
The lateral pressure coefficients versus depth of five models.

Table 1.
Hydraulic fracturing test results (data came from Reference [41]).
Table 1.
Hydraulic fracturing test results (data came from Reference [41]).
| Site No. | Buried Depth | σH | σh | σv | λ=σH/σv | αH |
|---|---|---|---|---|---|---|
| /m | /MPa | /MPa | /MPa | /° | ||
| ZK1 | 290 | 12.9–15.8 | 7.4–9.4 | 7.8–8.8 | 1.7–1.9 | N79°E |
| ZK2 | 110 | 4.9–6.5 | 2.7–4.9 | 3.2–3.9 | 1.5–1.9 | N75°E |
| ZK3 | 180 | 13.4–15.9 | 8.7–9.6 | 4.9–5.9 | 2.6–2.8 | N74°E |
Table 2.
The strata denudation estimated by AE.
| Sample ID | Kaiser Point /s | Memorized Stress /MPa | H /m | h /m | Δh /m | Average Δh /m |
|---|---|---|---|---|---|---|
| ZK1-1 | 115 | 53.3 | 1977.8 | 290.0 | 1687.8 | 1608.1 |
| ZK1-2 | 109 | 49.1 | 1818.5 | 1528.5 | ||
| ZK2-1 | 260 | 50.0 | 1851.9 | 135.0 | 1716.9 | 1722.4 |
| ZK2-2 | 265 | 50.6 | 1874.1 | 1739.1 | ||
| ZK2-3 | 260 | 45.0 | 1666.7 | 1531.7 | ||
| ZK2-4 | 290 | 55.0 | 2037.0 | 1902.0 | ||
| ZK3-1 | 172 | 53.4 | 1977.8 | 200.0 | 1727.8 | 1794.4 |
| ZK3-2 | 142 | 54.3 | 2011.1 | 1761.1 | ||
| YC4-1 | 60 | 42.5 | 1574.1 | 0.0 | 1574.1 | 1574.1 |
Table 3.
Denudation thickness at the southeastern margin of the Ordos Basin measured by different methods.
Table 3.
Denudation thickness at the southeastern margin of the Ordos Basin measured by different methods.
| Methods | Geological Ages | Values/m |
|---|---|---|
| Vitrinite reflectance [17] | Middle Jurassic | 1800–2000 |
| Stratigraphic comparison [15] | Late Cretaceous | 1600–1800 |
| Apatite fission track [16] | Late Cretaceous | 1500–2000 |
| Acoustic emission (this study) | Late Cretaceous | 1574–1794 |
Table 4.
Theoretical and measured values of the lateral pressure coefficient.
| Site ID | Depth /m | λ | λ′ |
|---|---|---|---|
| ZK1 | 310 | 4.0 | 1.7–1.9 |
| ZK2 | 135 | 8.3 | 1.5–1.9 |
| ZK3 | 200 | 6.1 | 2.6–2.8 |
© 2019 by the authors. Licensee MDPI, Basel, Switzerland. This article is an open access article distributed under the terms and conditions of the Creative Commons Attribution (CC BY) license (http://creativecommons.org/licenses/by/4.0/).
Share and Cite
MDPI and ACS Style
Wei, S.; Shang, Y.; Li, Y. Application of Acoustic Emission to Estimation of Strata Denudation: A Case Study from the Ordos Basin, China. Sustainability 2019, 11, 861. https://doi.org/10.3390/su11030861
AMA Style
Wei S, Shang Y, Li Y. Application of Acoustic Emission to Estimation of Strata Denudation: A Case Study from the Ordos Basin, China. Sustainability. 2019; 11(3):861. https://doi.org/10.3390/su11030861
Chicago/Turabian StyleWei, Siyu, Yanjun Shang, and Yanyan Li. 2019. "Application of Acoustic Emission to Estimation of Strata Denudation: A Case Study from the Ordos Basin, China" Sustainability 11, no. 3: 861. https://doi.org/10.3390/su11030861
Note that from the first issue of 2016, this journal uses article numbers instead of page numbers. See further details here.