Article

Local Perception of Drivers of Land-Use and Land-Cover Change Dynamics across Dedza District, Central Malawi Region

by
Maggie G. Munthali
1,*,
Nerhene Davis
1,
Abiodun M. Adeola
2,3,
Joel O. Botai
1,2,4,
Jonathan M. Kamwi
5,
Harold L. W. Chisale
6 and
Oluwagbenga O. I. Orimoogunje
7
1
Department of Geography, Geoinformatics and Meteorology, University of Pretoria, Private Bag X20, Pretoria 0028, South Africa
2
South African Weather Service (SAWS), Private Bag X097, Pretoria 001, South Africa
3
School for Health Systems and Public Health, University of Pretoria, Pretoria 0002, South Africa
4
School of Agricultural, Earth and Environmental Sciences, University of KwaZulu-Natal, Westville Campus, Private Bag X54001, Durban 4000, South Africa
5
Department of Agriculture and Natural Resources Sciences, Namibia University of Science and Technology, 13 Jackson Kaujeua Street, Private Bag 13388, Windhoek 9000, Namibia
6
Department of Forestry, Lilongwe University of Agriculture and Natural Resources, Bunda Campus, P.O Box 219, Lilongwe, Malawi
7
Department of Geography, Obafemi Awolowo University, Ile-Ife 220005, Nigeria
*
Author to whom correspondence should be addressed.
Sustainability 2019, 11(3), 832; https://doi.org/10.3390/su11030832
Submission received: 24 December 2018 / Revised: 25 January 2019 / Accepted: 31 January 2019 / Published: 5 February 2019

Abstract

:
Research on Land Use and Land Cover (LULC) dynamics, and an understanding of the drivers responsible for these changes, are very crucial for modelling future LULC changes and the formulation of sustainable and robust land-management strategies and policy decisions. This study adopted a mixed method consisting of remote sensing and Geographic Information System (GIS)-based analysis, focus-group discussions, key informant interviews, and semi-structured interviews covering 586 households to assess LULC dynamics and associated LULC change drivers across the Dedza district, a central region of Malawi. GIS-based analysis of remotely sensed data revealed that barren land and built-up areas extensively increased at the expense of agricultural and forest land between 1991 and 2015. Analysis of the household-survey results revealed that the perceptions of respondents tended to validate the observed patterns during the remotely sensed data-analysis phase of the research, with 57.3% (n = 586) of the respondents reporting a decline in agricultural land use, and 87.4% (n = 586) observing a decline in forest areas in the district. Furthermore, firewood collection, charcoal production, population growth, and poverty were identified as the key drivers of these observed LULC changes in the study area. Undoubtedly, education has emerged as a significant factor influencing respondents’ perceptions of these drivers of LULC changes. However, unsustainable LULC changes observed in this study have negative implications on rural livelihoods and natural-resource management. Owing to the critical role that LULC dynamics play to rural livelihoods and the ecosystem, this study recommends further research to establish the consequences of these changes. The present study and future research will support decision makers and planners in the design of tenable and coherent land-management strategies.

1. Introduction

Land-use and land-cover (LULC) change has become a key research-priority area, attracting much interest from the global scientific community since the 1970s [1,2,3]. Particularly, the attention on LULC dynamics occurring at the local scale has arisen due to an inherent ecosystem, and socioeconomic impact at the national, regional, and even global level [4,5]. Natural causes and anthropogenic activities are responsible for LULC dynamics changes globally, with the latter overriding natural causes [6,7]. These changes are described by complex multitemporal and scale interactions of social, demographic, economic, institutional, and environmental factors [8,9,10,11]. These changes have serious socioeconomic and environmental impact on rural livelihoods in many regions of Sub-Saharan Africa (SSA) [12]. In some parts of the SSA region, population growth, high poverty levels, settlements, fuelwood, charcoal production, and agricultural expansion were reported as contributory factors for LULC changes [13,14,15,16,17,18]. More research with regard to location, nature, magnitude, extent, and rate of land-use and land-cover dynamics is still required in the context of SSA, where high population growth coupled with infertile land and overexploitation of other natural resources such water and forests is prevailing [19].
Malawi’s economy is entirely dependent on agriculture and other related sectors, especially forests and fisheries. Due to its reliance on rain-fed agriculture and exposure to floods and droughts, Malawi is among southern Africa’s most climate-change-vulnerable countries [20]. Almost 85% of Malawi’s population live in rural and marginalized areas, and approximately 80% of this population entirely depend on natural-resource endowments for their subsistence, household income, and livelihoods [21,22,23,24]. The high dependence on natural resources such as land, forests, and water puts pressure on these resources, leading to overexploitation, forest degradation, and deforestation [25,26]. Recent studies have revealed that deforestation and forest degradation in Malawi are due to uncontrolled firewood collection, infrastructure development, agriculture expansion, illegal charcoal production, shifting cultivation, urbanization, high population, and tobacco-curing by smallholder farmers and estate owners [23,26].
Like any other country in the Sub-Saharan Africa (SSA) region, Malawi’s LULC has experienced rapid and extensive changes over the past decades due to significant transformations caused by human–environment interactions [27]. Despite the fact that few studies on LULC changes have been done in Malawi, research on the factors contributing to these changes at the national and even local level remains scant. Thus, few studies have explained LULC change dynamics at the national level [28,29,30,31,32]. Studies on LULC dynamics and the associated drivers on the local scale are vital for seeking viable, feasible, appropriate, and coherent natural-resource management strategies. Several researchers have emphasized that understanding LULC drivers is a perplexing question in global science, and these drivers are still a contentious issue; further research is indispensable [33,34,35]. The causes of LULC changes are intricate and dynamic, and they vary from one place to another [36]. In other words, globally identified drivers of LULC changes are location-specific, varying from region to region depending on the socioeconomic and biophysical factors prevailing that location. It is worth noting that LULC change drivers are also time-specific. For instance, a driver identified 10 years ago may not be valid in recent times if remedial solutions are put in place by the actors. It is, therefore, impossible to generalize that LULC trends/changes occurring on a broader spatial scale and the drivers influencing these changes are inherent landscapes [35,37]. Examination of LULC driver dynamics is a requisite as far as resolving environmental and socioeconomic challenges, biodiversity conservation, reduction and management of LUCC changes impacts and consequences at local, national, regional and global level is concerned [38,39].
It is worthwhile noting that inclusive research on the drivers and impacts of LULC dynamics in Dedza is beneficial to readily comprehend the inter-relationships between locals and natural resources. Any management intervention strategies to properly address the drivers of LULC changes and the development of sustainable land-use systems in the study area should begin with local empirical evidence and understanding the underlying drivers of changing LULC. A profound understanding of the complex interdependence between LULC changes and rural livelihoods, together with the coping strategies that local communities use to address such changes, are fundamental for decision-making by policymakers, planners, and other stakeholders [13]. Estimating the rate, nature, type, and pattern of LULC changes in any landscape, as well as understanding factors that influence these changes, are also essential for projecting future changes [40,41].
Remote-sensing (RS) and GIS technologies only identify the nature, extent, and rate of LULC changes on the landscape; however, they do not provide an explanation about the underlying causes of LULC dynamics on the landscape [42,43]. Despite this, RS has demonstrated its effectiveness and applicability in investigating the relationship that exists between people and the environment in which they live [44]. Therefore, this study aims at quantifying LULC changes and assessing the local perceptions of drivers of LULC change between 1991 and 2015 in Dedza. Thus, the study captured local communities’ perceptions of LULC change trends and the drivers of these changes in the study area. Some researchers have reported that observed LULC dynamics on any landscape is a reflection of aggregated decisions at the household level in response to policy and an institutional environment over a period of time [45,46,47]. The findings of this study are envisioned to form the basis for a robust understanding of the LULC change dynamics that planners, environmentalists, decision-makers, and other stakeholders could use in formulating sound management and environmental planning strategies, or guidelines for the maintenance of ecosystem services, and conservation and utilization of natural resources in Dedza or alternative districts with similar settings.

2. Materials and Methods

2.1. Study Area

The study was conducted in Dedza, located in the central region of Malawi, bordering Lilongwe district, Ntcheu to the south, Mangochi to the east, Salima to the northeast, and Mozambique to the west (Figure 1). The district covers a geographical area of about 362,400 ha [48,49]. Physiography is characterized by uplands and lowlands with uneven terrain. The district is divided into three topographic zones, namely, the Lilongwe plain (altitude, 1100–1300 m), the Dedza highlands (1200–2200 m), and the Dedza escarpments (1000–1500 m). The district has a subtropical highland climate [50]. Mean annual temperatures are relatively low and fluctuate between 14 and 21 °C, with an average temperature of 15.5 °C (the coldest months are June and July, while November is the hottest month). Rainfall occurs between the months of November and March, with a mean annual rainfall ranging from 800 to 1200 mm. The district has experienced climate-related disasters and extreme events such as floods and droughts [51]. The district is characterized by generally ferruginous soils that are deep and brown to reddish in color [52]. Clay and sandy loam soils are predominant in the study area [49,53].
Agriculture is the major land use in Dedza, with major crops grown in the area being maize (Zea mays), Irish potatoes (Solanum tuberosum), sweet potatoes (Ipomoea batatas), groundnuts (Arachis hypogaea L.), beans (Phaseolus vulgaris L), and soybeans (Glycine max). Rice and cotton are also grown along the lakeshore and valleys. People in the district also keep livestock comprising of cattle, goats, pigs, sheep, and poultry. The economy and livelihoods of the majority of the communities of the study area are primarily based on natural resources, especially land, forests, and water [49,51]. Other economic activities and sources of livelihood strategies include small and medium enterprises (SMEs), arts and crafts, quarrying, and fishing. The district has three land-tenure systems, namely, government land, customary land, and private-leasehold land. Dedza has an estimated population of 624,445, with an annual population growth rate of 2.6% [51]. It is one of the most densely populated districts in Malawi, with a population density of 172 persons per km2 compared to the national average of 139 persons per km2. The average family size in the studied landscape is 6 persons against the national average of 4.4 persons per household.

2.2. Data Acquisition and Preprocessing

Geospatial and remote-sensing data are reliable sources for understanding and ascertaining the drivers of LULC changes of any landscape [54]. In this study, change-detection analysis using multiple sets of spatiotemporal Landsat images for 1991, 2001, and 2015 was used to establish LULC changes in Dedza. Table 1 summarizes the characteristics of the multitemporal satellite data used in this research. ArcGIS 10.6 and ERDAS IMAGINE 9.3 software were used to perform standard image-processing techniques, including extraction, geometric correction or georeferencing, atmospheric correction, topographic correction, layer stacking (band selection and combination), image enhancement, and subsetting (clipping). The three images were also registered to a common Universal Transverse Mercator (UTM) co-ordinate system, Zone 36S, with World Geocoded System (UTM WGS 84) projection parameters.

2.3. Image Classsification and Land-Use and Land-Cover Dynamics

Images were classified using hybrid classification that combines supervised and unsupervised classification algorithms. The two methods were used to reduce spectral reflectance noise, especially singling out agricultural land from built-up areas and bare land. A Maximum Likelihood Classification (MLC) algorithm was performed for each image (Equations (1) and (2)). Studies have shown that MLC is the most common, successful, and widely adopted classification algorithm [55,56,57,58]. A classification scheme of 6 classes was developed based on physiographical knowledge of the study area, supporting ancillary data, researchers’ prior local knowledge, and visual interpretation using the historical function of Google Earth. The 6 LULC classes were categorized as water bodies, wetlands, agricultural land, forest, built-up areas and barren land (Table 2). A stratified random sampling method was employed to collect 221 points for accuracy assessment. Google Earth images were used to extract the reference data. Accuracy assessment was determined using the kappa coefficient, overall accuracy, producer and user accuracy, which were derived from the error (confusion) matrix as discussed in References [59,60]. In order to continue with LULC analysis, the 2015 LULC map was subjected to a minimum of 85% overall accuracy as recommended by References [61,62]. The classified 2015 images were used as reference to classify historical images. In this case, the used signatures for the 2015 images were superimposed on older images. Considerations were made to ensure that the images were captured at comparable phenological dates during the study period. In addition, historical images (1991 and 2001) were further visually interpreted, taking into account image tone, texture, shape, and class patterns.
LULC change analysis was determined using a post-classification comparison (PCC) technique, and this resulted in a cross-tabulation (transition) matrix. The LULC change-transition matrix was computed using the overlay procedure in ArcGIS in order to quantify the area converted from a particular LULC class to another LULC category during the study period. The annual rate of change was also determined using the procedure by References [63,64,65]. Equation (1) provides a benchmark for comparing LULC changes that are not sensitive to differing periods between study periods.
r = ( 1 t 2 t 1 ) × l n (   S 2 S 1   )
where r is the annual rate of change for each class, and   S 1   and   S 2 are areas of each LULC class at t 1 and t 2 , respectively.

2.4. Primary and Secondary Data-Collection Tools

2.4.1. Household Surveys

Face-to-face interviews in the form of key informant interviews, focus-group discussions guided by a checklist, and semi-structured household questionnaires were used in this study. The questionnaires were comprised of both open- and closed-ended questions to gather information about the perceptions of the local communities on LULC changes, and the drivers of these changes in Dedza during the studied period (1991 to 2015). A questionnaire was preferred for this study as it provides insight into the drivers of LULC changes [66]. The study employed a random sampling method to select respondents for the household interviews. The structured questionnaire was first pretested in 20 households in the Traditional Authority (TA) of Kaphuka (but not included in the sampled households for this study); then, modifications were made before the actual interviews of the sampled households. The questionnaire was administered to 586 households from 23 October 2017 to 10 November 2017 from 4 TAs, namely, Senior Chief Kachindamoto, Inkosi Kaphuka, Senior Chief Kachere, and TA Kasumbu. Additionally, the questionnaire was administered to respondents who (i) were aged 20 years and above, (ii) had lived in the respective area for at least 10 years, and (iii) were implicit decision-makers in the household, and/or, in the absence of a family head, it was made with appropriate representative and knowledgeable member of the household. The questionnaire had 7 sections covering the socioeconomic characteristics of the household, perceptions of local communities on LULC changes, and their causes (Appendix A). Each household interview lasted between 30 and 60 minutes.

2.4.2. Focus-Group Discussions and Key Informant Interviews

Focus-group discussions (FGDs) and key informant interviews were carried out to triangulate the obtained information from the household interviews and gain an in-depth and detailed understanding of local people’s perceptions on LULC changes that had taken place in the studied landscape, and the associated underlying causes perceived to have contributed to the changes. A total of 4 FGDs were carried out in 4 TAs targeting the Area Development Committees (ADCs) where household interviews were conducted in the same period. FGDs facilitated by the researcher were carried out according to the procedure proposed by Reference [67], and were guided by a checklist of questions related to LULC changes and their driving forces. Each FGD consisted of 10–15 people and lasted between 120 and 180 minutes. A purposive sampling method was used to identify key informants based on their knowledge on the study area. In this study, key informants were exclusively technical members from the Dedza district council that were familiar with the issues in the study area. These technical members included the district commissioner, and researchers and officers from agriculture, natural-resource, and environmental institutions and organizations.

2.5. Other Datasets

Other data used in this study were climate (temperature and rainfall) data from 1991 to 2015, which were obtained from the Malawi Department of Climate Change and Meteorological Services (DCCMS) under the Ministry of Natural Resources, Energy, and Mining. Population data were obtained from the National Statistical Office of Malawi (NSO). Population estimations before 1991 and after 2008 were calculated by extrapolating the closest census data and annual growth rates using the formula adopted by Reference [14]:
P 2 = P 1 e r t
where P 1 and P 2 are total populations at Times 1 and 2, respectively; e = exponential population constant; t = number of years between two census enumerations; and r = annual population growth rate.

2.6. Statistical Analysis

The study used a combination of data-analytical approaches and techniques including GIS-based processing, descriptive statistics, and regression analysis. LULC change analyses were done using ArcGIS, QGIS, and ERDAS Imagine software. The socioeconomic data derived from the questionnaire were entered, processed, coded, and analyzed using Statistical Package for Social Sciences (SPSS) version 20 and subsequently subjected to further analysis. Descriptive-statistics analysis was used to describe socioeconomic variables of the households and summarize their responses and ranking of drivers of LULC changes. Ranking the drivers of LULC changes perceived by respondents (household surveys) was computed with the principle of weighted average using the ranking index adopted by References [68,69]:
I n d e x = R n C 1 + R n 1 C 2 + R 1 C n R n C 1 + R n 1 C 2 + R 1 C n
where R n = value given for the least-ranked level (for example, if the least rank is the 10th, then R n = 10, R n 1 = 9, R 1 = 1; C n = counts of the least ranked level (in the above example, the count of the 10th rank = C n , and the count of the 1st rank = C 1 ).
Data collected through FGDs and key informant interviews were qualitatively analyzed [70]. A nonparametric test (Pearson’s chi-square) was used to ascertain the differences/associations between socioeconomic variables and respondent perceptions on drivers of LULC changes. Logistic-regression analysis was performed to identify the key drivers of LULC changes in Dedza at the household level (Equation (6)). By determining the drivers of LULC changes at the household level, the dependent variable was local people’s perception of drivers for LULC changes and/or the perceived drivers identified, while independent variables included socioeconomic characteristics, such as age, gender, family size, education, and land-holding size. Logistic analysis at the household level estimated the probability of the effects of the independent variables on the dependent variables [66]:
L o g i t   ( Y ) = α + β 1 X 1 + β 2 X 2 + β 3 X 3 + + β n X n
where Y = dependent variable indicating the likelihood that Y = 1, α = the intercept, β 1 β n n = coefficients of associated independent variables, and X 1 X n = independent variables.

3. Results

3.1. Accuracy Assessment

Accuracy assessment based on error (confusion matrices) showed an overall accuracy of 91.86%, with a kappa coefficient of 0.866 (Table 3). There were slight differences in user and producer accuracies of individual classes but the results of the datasets showed higher overall accuracy. These results provided a fundamental platform for subsequent analysis of LULC changes.

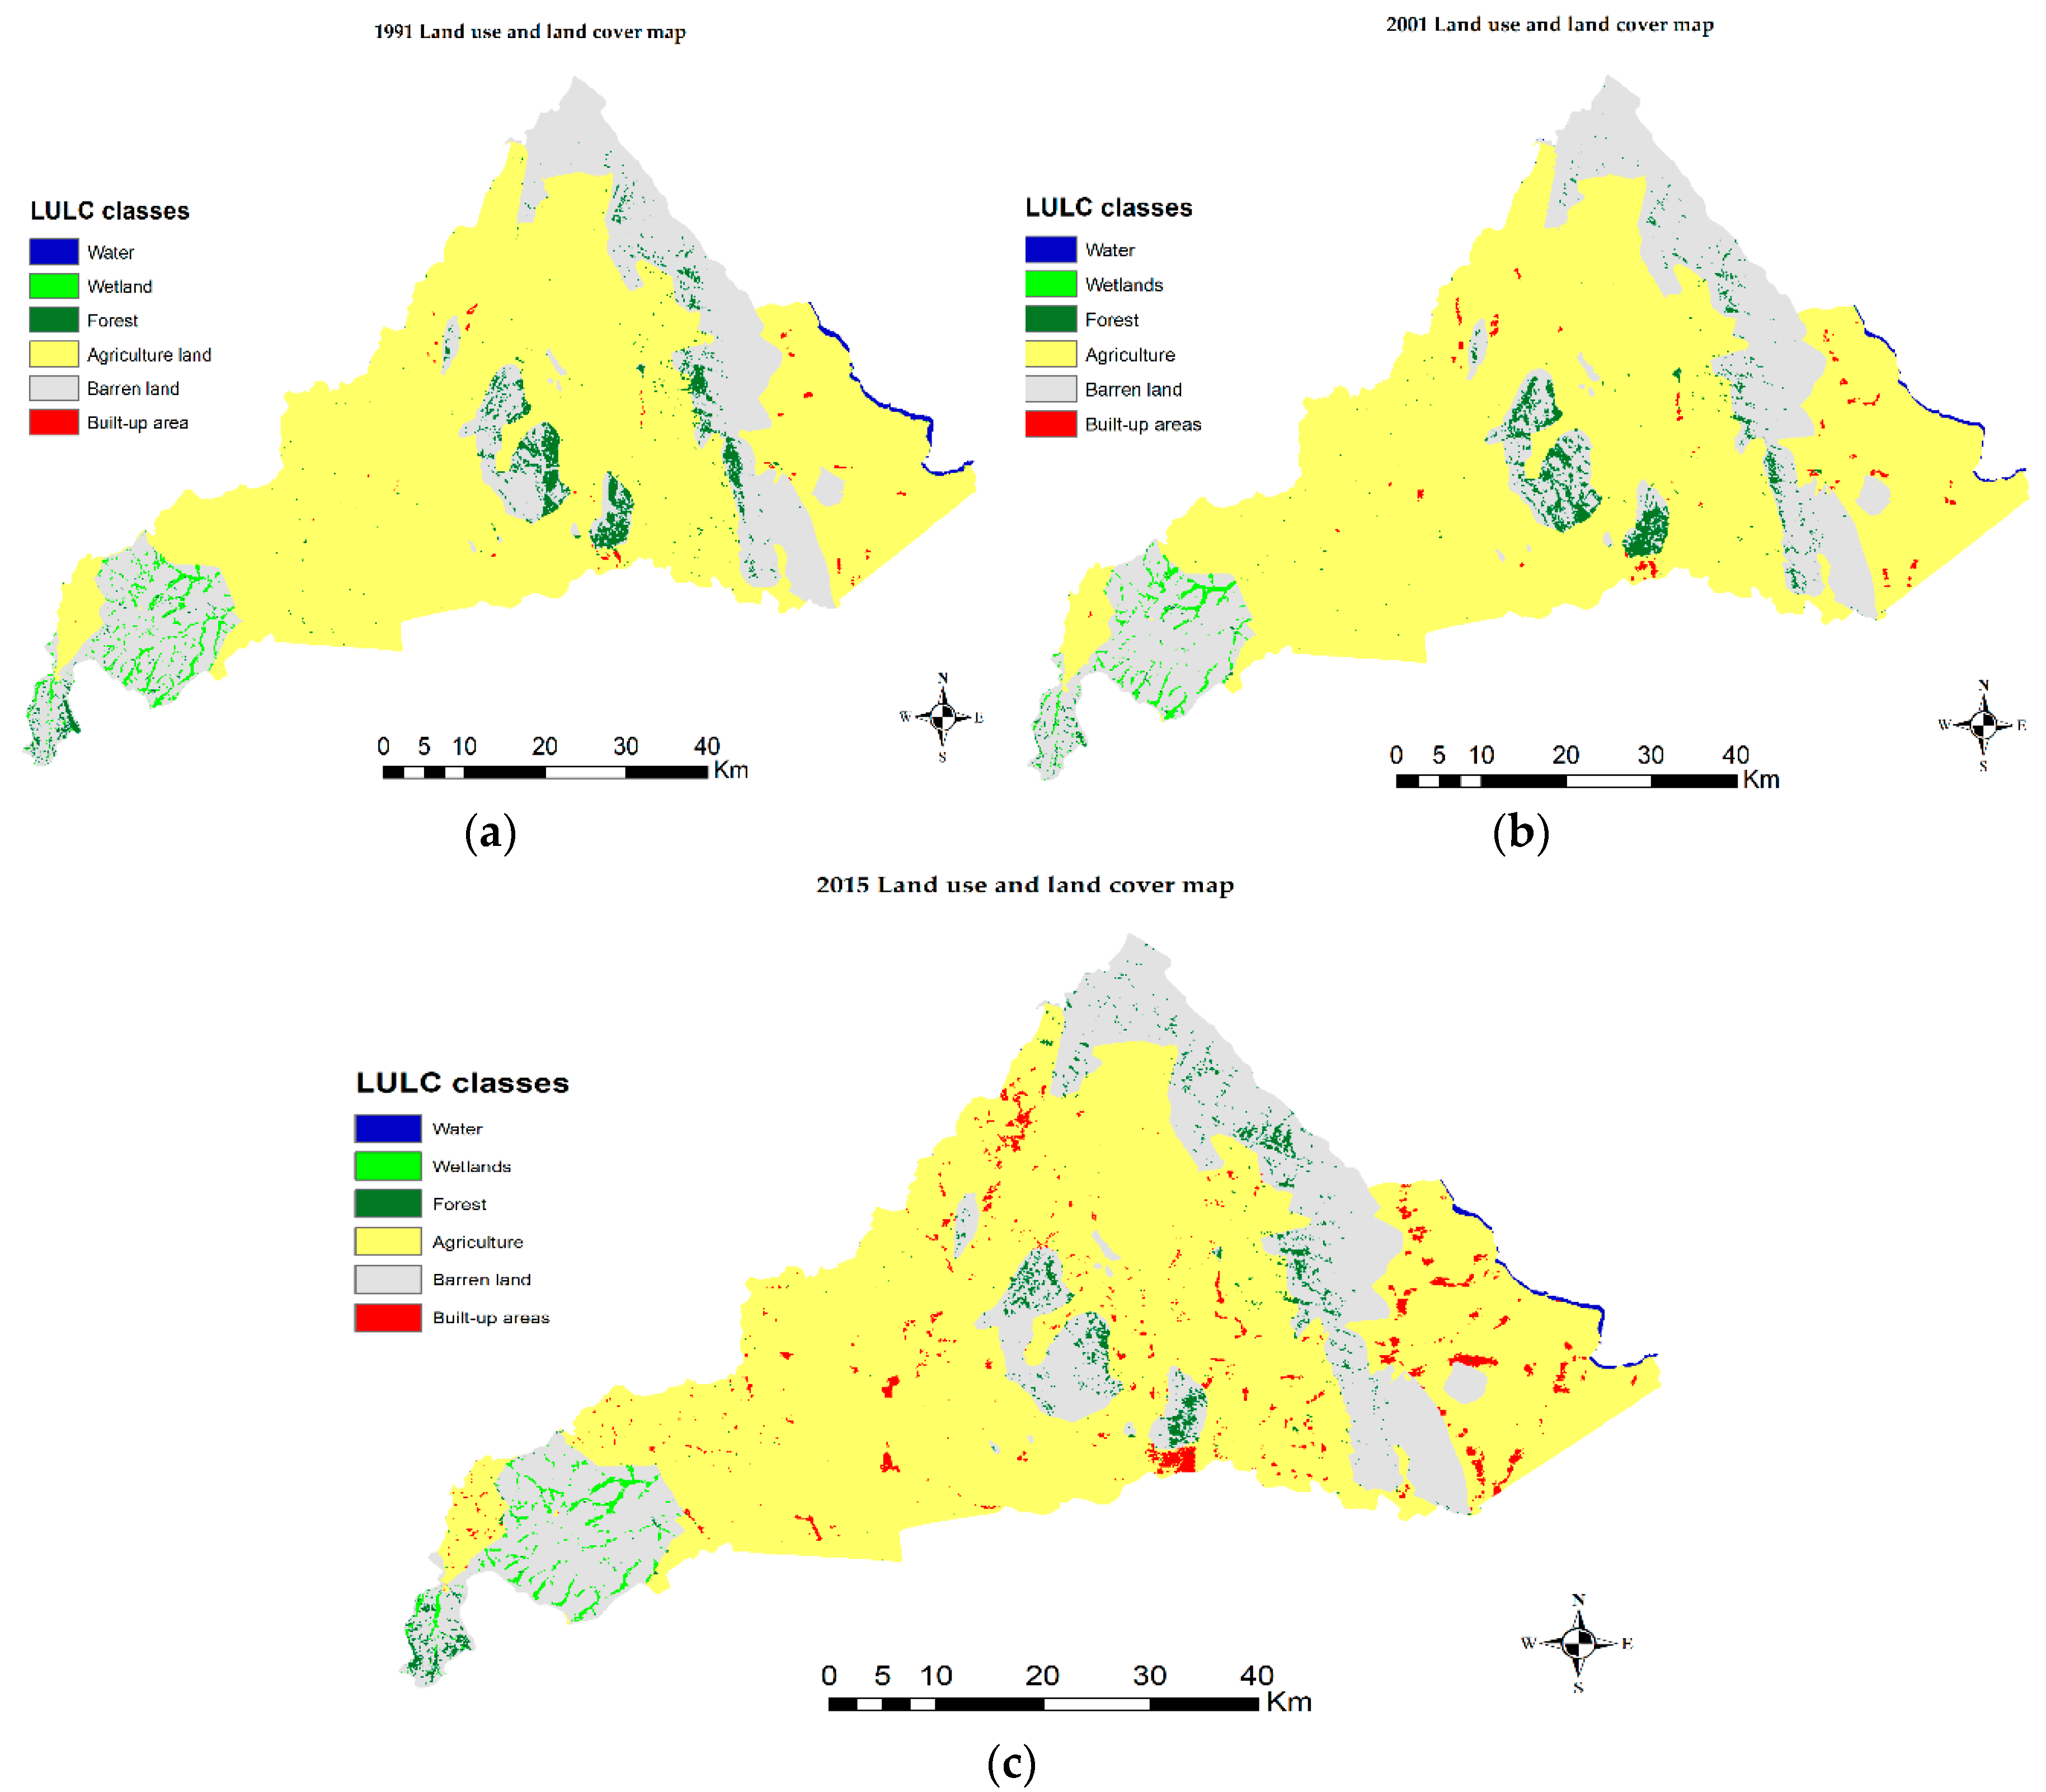
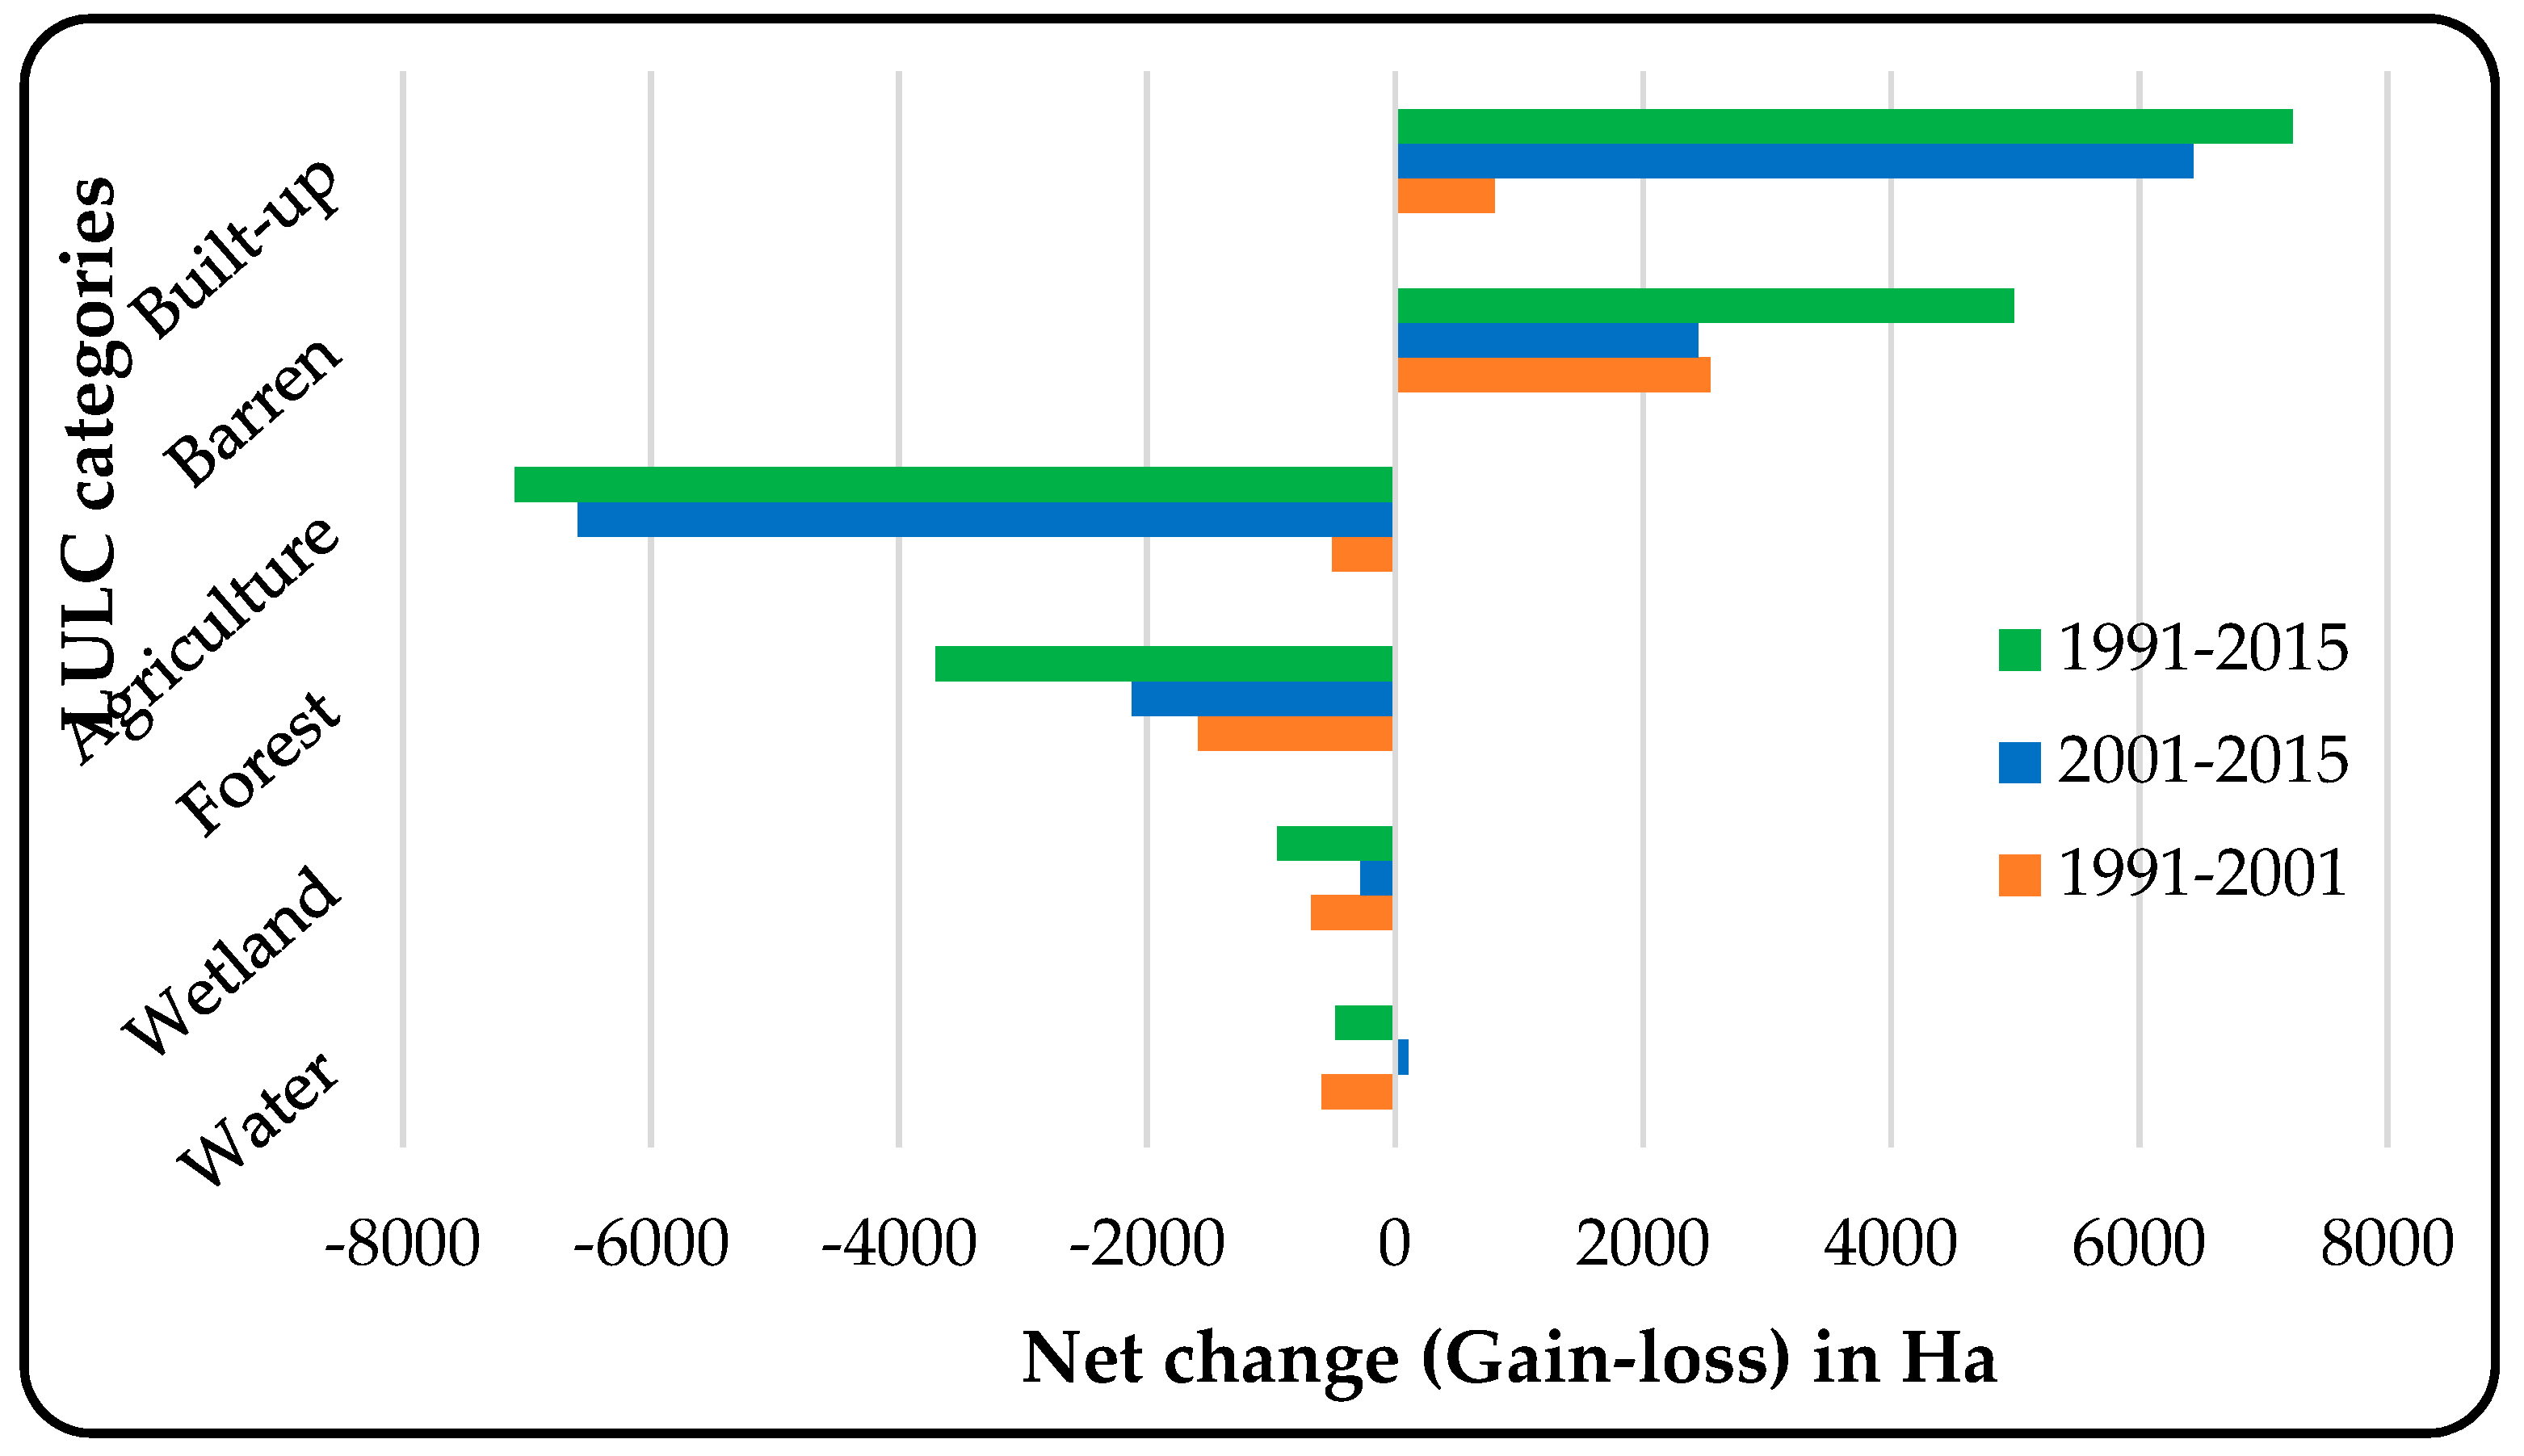
3.2. Land-Use and Land-Cover Change Dynamics

Figure 2 shows the spatial representation of LULC types from 1991 to 2015. The proportionate coverage area of each of the six classes extracted in Dedza from 1991 to 2015 of LULC change trends are summarized in Table 4 and Figure 3. At the beginning of the study period (1991), agricultural land was the most dominant LULC, covering 71.3% of the total studied area, followed by barren land (24.53%), forest (2.64%), wetlands (0.96%), water (0.37%), and built-up areas (0.2%) (Table 4). The trend continued up to 2015 except for built-up areas. During the studied period (1991–2015), built-up areas substantially expanded almost tenfold (i.e., 950%) and barren land slightly increased, from 24.53% to 25.85%. Conversely, agriculture land, forest, wetlands, and water bodies drastically decreased in the same period (Figure 5). The highest net loss was in agricultural land, followed by forest land. Despite these transformations, changes did not occur at equal rates. Results revealed that the area occupied by water bodies decreased by 34.8%, wetlands by 26.1%, forests by 37.2%, and agricultural land by 2.6% between 1991 and 2015. Built-up areas and barren land increased at an annual rate of 9.8% and 0.22% yr−1. On the other hand, forests experienced strong loss at an annual rate of 1.94% yr−1; followed by agricultural land, wetlands, and water declining at a corresponding rate of change of 0.11%, 1.26%, and 1.78% yr−1, respectively.

3.3. Land-Use and Land-Cover Change (Transition) Matrix

Table 5 shows the cross-tabulation change matrix for the changed areas and their corresponding percentages from one LULC class to another in comparison with the total area of each LULC class from 1991 to 2015. Despite the fact that all LULC classes have undergone changes in the study area, the degree of these changes was inherently different. Conversions occurred across the whole study area. During the study period, 96.03% of agricultural land remained unchanged, followed by barren land (93.72%), built-up areas (86.20%), water bodies (64.39%), wetlands (50.8%), and forest (30.23%). This clearly indicates that forest experienced the highest conversion with almost 70% of its total area converted to barren land (61.48%) and the rest to other LULC classes. The majority of agricultural land was converted to built-up areas (7244.91 ha) and barren land (2,960.01 ha), while the majority of barren land was converted to forest (2,803.86 ha) and agricultural land (2,162.61 ha). Even though built-up areas did not change much, almost 7244 ha were gained from agricultural land (7244.91 ha).

3.4. Socioeconomic and Demographic Characteristics of Sampled Households

The socioeconomic and demographic attributes of the sampled households are presented in Table 6. The results revealed that the age of the respondents ranged from 20 to 97 years, with an average of 39.2 years. About 93.3% of the interviewees lived in the study area throughout the studied period. The majority (78.7%) of the respondents were married, about 63.3% of the sampled households were female, and 71.7% of the households were male-headed. The results also indicated that household size ranged from one person to 13 people, with an average of 5.6 persons. It is also worth noting that a larger proportion (96.1%) of the interviewees owned land, with 5.9% being landless. The farm size of the respondents varied from 0.25 to 13 acres, with an average of 2.32 acres. With respect to their education status, 77.8% of the respondents were literate (64.3% and 13.5% attended primary and secondary school, respectively), and 22.2% had never attended school. Approximately 82% of the sampled households were engaged in farming activities, and a small portion of the respondents (18%) were involved in on-farm activities, such as businesses, professional work, and craft work. The mean household income of the respondents was USD721.30 (MK 286,843.26) per year. Farming was ranked as the most important source of income in Dedza. Income from self-employment opportunities, such as businesses, handcraft, and trade, were ranked second, followed by piece works or occasional jobs, Village Loan Savings (VLS), full-time private/government employment, sale of forest produce, and renting out land.

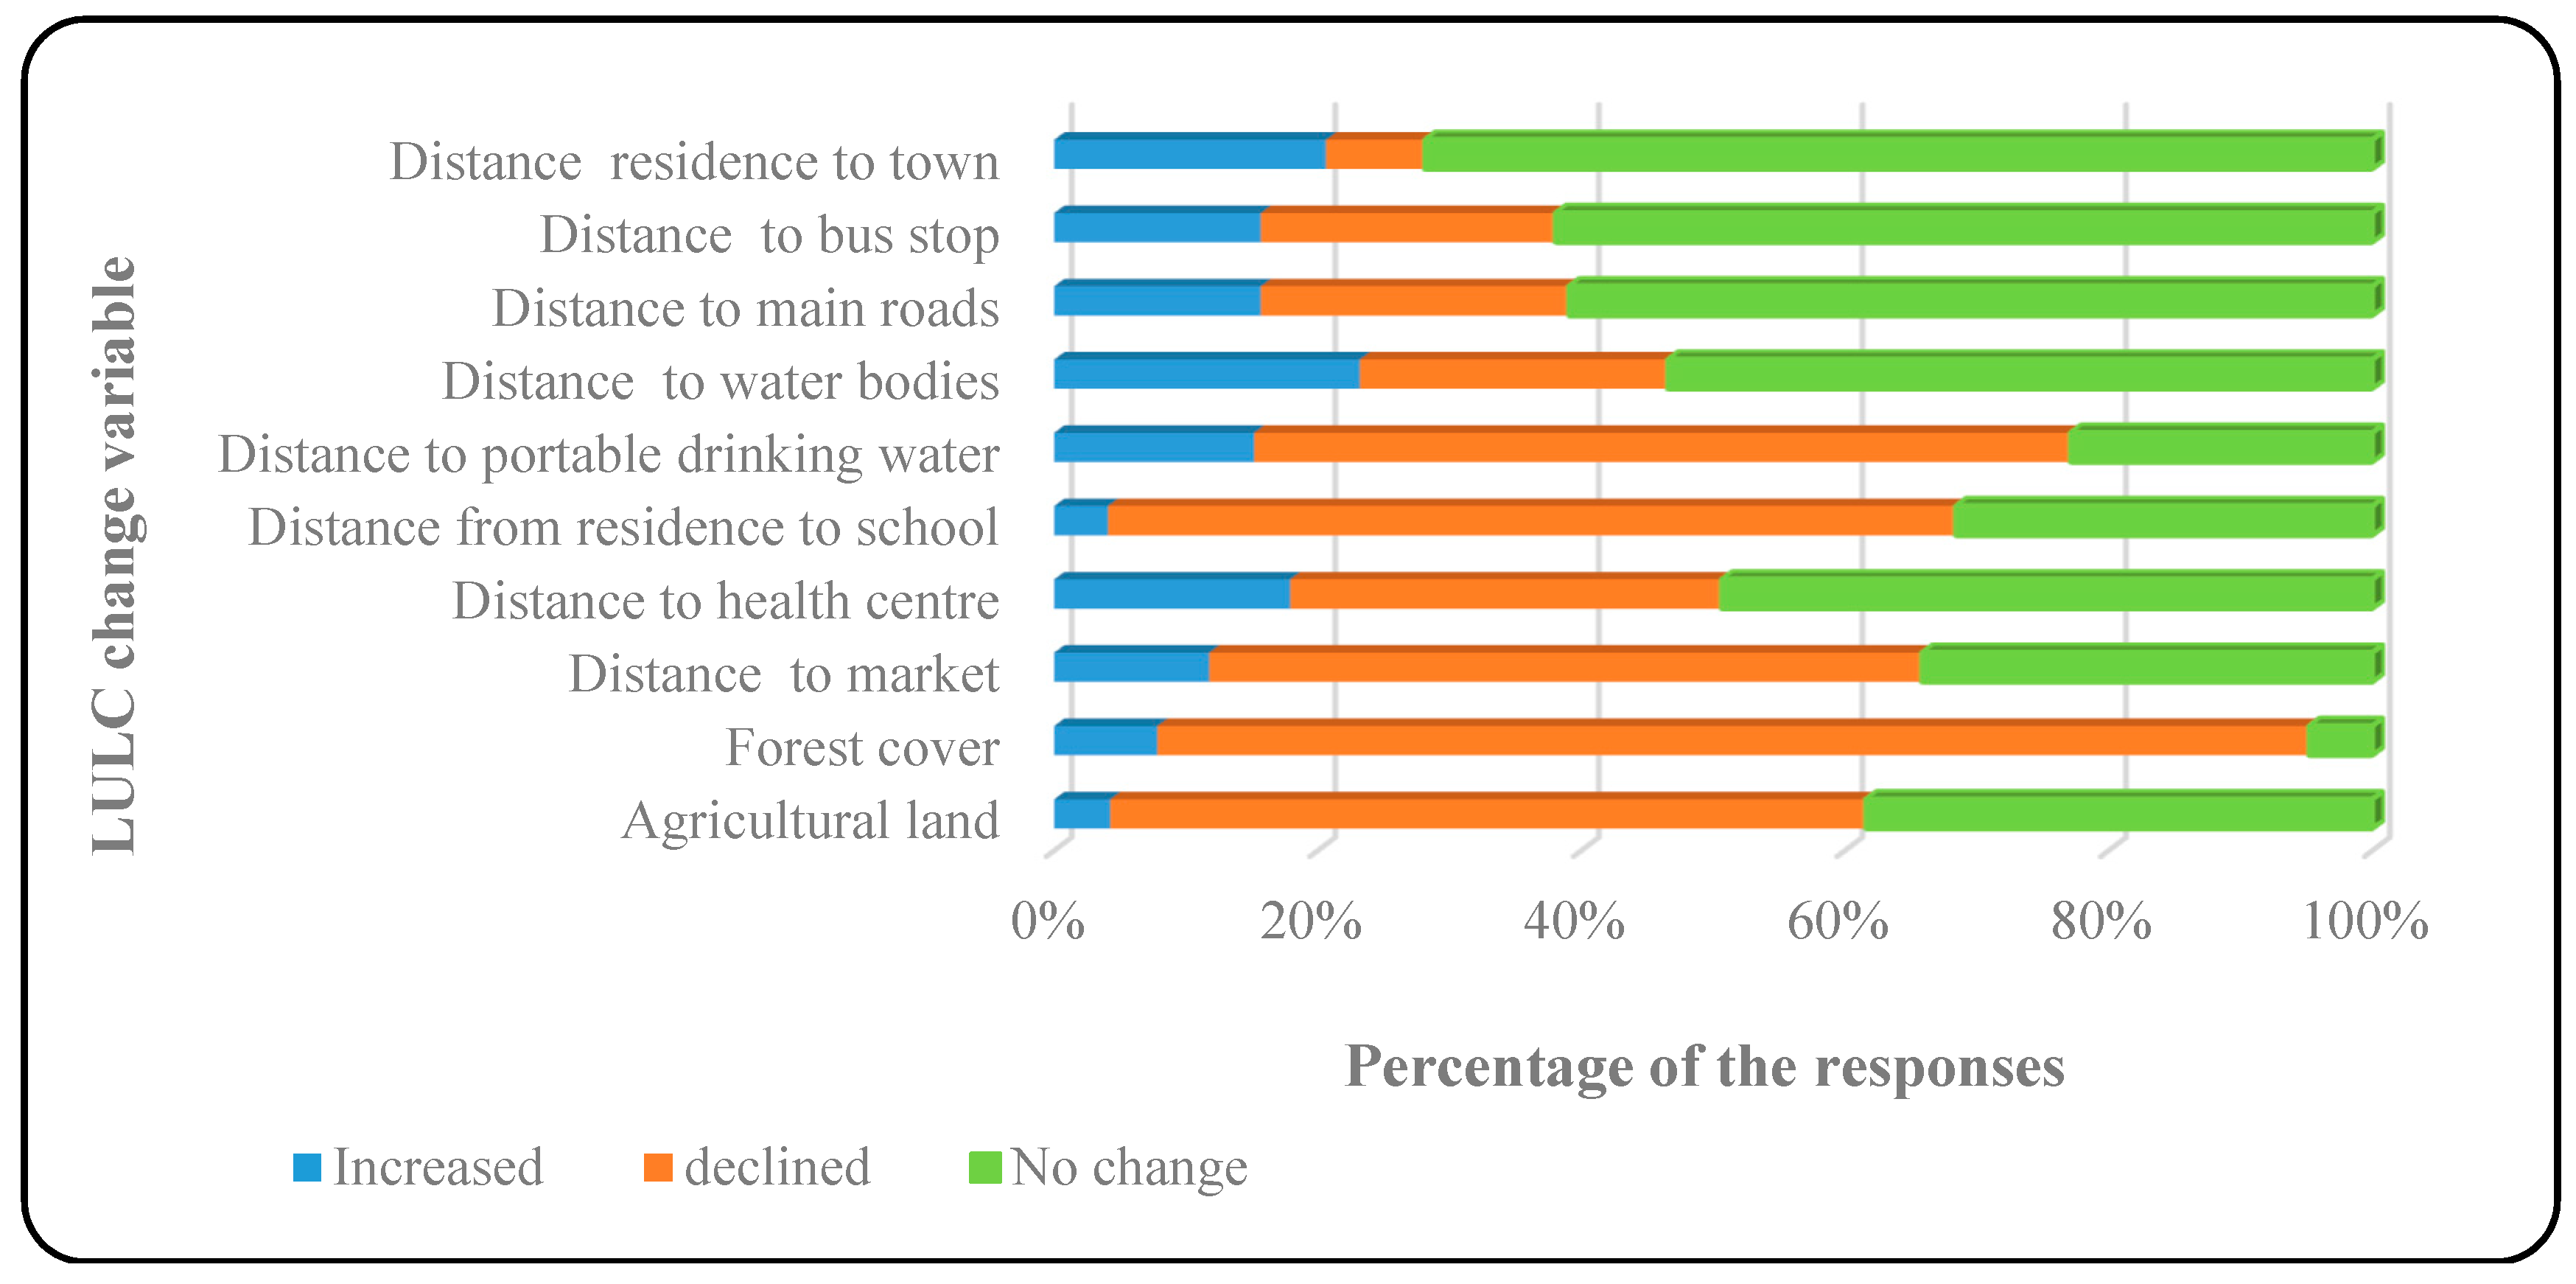
3.5. Local-Community Perceptions on Observed Trends of LULC Changes and Proximity to Infrastructure

Significant differences were found among the interviewed households in perceptions regarding LULC changes and distance to different infrastructures such as main roads, health centers, schools, and towns (p < 0.001). Respondents perceived that agricultural land and forest cover significantly declined (p < 0.001) in the studied landscape. Results shows that 57.3% and 87.4% of local communities correctly perceived that agricultural land and forest, respectively, had declined (Figure 4). Almost half of the respondents (53.4%) perceived that distance from water bodies remained the same over the studied period. Conversely, distance to infrastructures such as main roads, health centers, bus stops, and towns remained unchanged except for distance to markets and schools, which significantly declined (p < 0.001). Key informants from different institutions and FGDs also correctly perceived that agricultural land and forest cover drastically declined from 1991 to 2015.

3.6. Ranked Drivers of LULC Changes

The respondents identified 24 factors (12 proximate drivers and 12 underlying drivers) as important drivers contributing to LULC changes in Dedza, especially during the period under review (Table 7 and Table 8). Fuelwood collection, charcoal production, timber, construction, and agriculture expansion were the top five ranked proximate drivers of LULC changes in the study area, with fire collection and charcoal production ranked first and second, respectively (Table 7). Similar results were also revealed during key informant interviews and FGDs in which firewood collection, charcoal production, settlements, and agricultural expansion were identified as the main causes of LULC in the study area.
With respect to underlying causes of LULC drivers in the study area, the interviewed households identified population growth as the most important underlying driver contributing to LULC, followed by poverty, lack of financial resources, lack of law enforcement, and demand for timber (Table 8). With regard to population growth, respondents (98%) perceived that population had increased over studied period. FGDs and key informant interviews indicated poverty, population growth, unreliable rainfall, poor access to alternative-energy supply, lack of alternative livelihood strategies, and the high cost of agricultural inputs as the main underlying causes of LULC changes. To confirm the community’s perception on population growth and unreliable rainfall, population and rainfall data from 1991 to 2015 was analyzed. Population increased from 456,919 in 1991 to 743,868 in 2015 (Figure 5). Observed rainfall data between 1991 and 2015 were consistent with the local communities’ perceptions, as indicated by declining unreliable rainfall (Figure 6).

3.7. Household-Level Logistic Regression of Perceived Drivers of LULC Changes

Results revealed that education level negatively and significantly affected (p < 0.05) high perceptions of local communities on firewood collection, agricultural expansion, poverty, and population growth as LULC drivers in Dedza (Table 9). Charcoal production and settlements were not significantly influenced by age, gender, education level, land-holding size, and household size.

4. Discussion

4.1. Land-Use and Land-Cover Change Dynamics

The post-classification comparison results for change-detection analysis and the change matrix from 1991 to 2015 revealed the extent of LULC changes occurring in different LULC classes throughout the study period. Dedza experienced substantial and increased rates of LULC changes between 1991 and 2015. Agricultural and barren land are the major LULC classes accounting for almost 96% of the total landscape in both 1991 and 2015. Most agricultural land, forest land, and water bodies from 1991 were intensively converted to built-up areas, barren land, and agricultural land, respectively. Recently, agricultural land in Dedza was developed for residential, commercial, and business purposes. The expansion rate of built-up areas on other LULC categories increased following the development of residential areas for commercial, academic, and business purposes. Barren land expanded at the expense of forest land and wetlands. The presence of major roads in the study area accelerated the expansion of built-up areas and exploitation of resources. Communities in the study area also correctly perceived that built-up areas and barren land had increased over the past years, with a decline in agricultural land, rivers, wetlands, and forest land. Additionally, as observed during field visits, demand for agricultural land and wetlands to be converted to residential land, and also land prices for these lands, had increased over the past years. Additionally, the use of older respondents (≥20 years) provided an accurate historical narrative of LULC changes in the study area, confirming the results of the observed LULC changes interpreted from remotely sensed data in the period of 1991–2015. Similar findings of other researchers showed that LULC changes occurred in related settings. For example, woodlands declined by 88.5%, while urban areas increased by 143% between 1984 and 2013 in the Likangala River catchment in Malawi [32]. Increased built-up areas and reduction in forest land and fresh water of the Upper Shire River Catchment of Malawi was also reported [28]. Contrary to the findings in this study, both authors found an increase in agricultural land in their study areas. It was reported that 20,747 hectares of forest land were lost between 1990 and 2008 in Malawi’s Dzalanyama Forest Reserve, of which 64% of forest land was lost between 2000 and 2008 [29]. A recent study revealed that built-up areas increased by about tenfold at the expense of grasslands, shrub-bush land, and woodlands in the Central Rift Valley of Ethiopia between 1973 and 2014 [71]. Similar observations of the expansion in built-up areas, accompanied by a decline in forest land and agricultural land, were also made by other studies [15,29,40,43,69,72]

4.2. Drivers of LULC Changes

The research findings, based on the household surveys, FGDs, and key informant interviews, pointed to local communities perceiving firewood collection, charcoal production, agricultural expansion, settlements, and timber as the important proximate drivers of LULC changes in Dedza. These proximate drivers were triggered by high poverty levels, population growth, unreliable rainfall, lack of law enforcement by government, poor access to an alternative-energy supply, and high cost of agricultural input.
The majority of the local communities felt that population growth increased during the study period. Indeed, the population of Dedza has increased by 28% since 1998. This is also confirmed by the results of the population model used in this study, which simulated an increase in population for the studied period in Dedza from 1991 to 2015 [48]. Household surveys, FGDs, and key informants perceived that the rapid increase of the population in the study area was largely due to high fertility rates, early marriages, high birth rates, reduced mortality, polygamy, immigration, and illiteracy. Dedza shares its border with Mozambique, and during the war, economic instability, and the drought crisis, people from Mozambique would migrate to Dedza to survive. Earlier studies in Malawi also found population pressure as one of the drivers of LULC changes [32,73]. In other parts of the world, population growth was also reported as the main driver of LULC changes [14,16,17,18,74]
Firewood collection and charcoal production are the top two important proximate drivers of LULC changes in Dedza between 1991 and 2015. This is also directly associated with the use of three-stone open-fire stoves by 88.2% of the interviewees, while the rest use charcoal stoves for cooking. This kind of domestic cooking stove enables households to use more firewood, thereby exacerbating deforestation and forest degradation. The use of three-stone open-fire stoves results in indoor-air pollution, which severely impacts human health, particularly the vulnerable populace, such as children and women. These results are also directly connected with the wide use of biomass as the main source of energy for the majority of the Malawi population. The use of charcoal and fuelwood for energy in the district is triggered by high poverty levels and low coverage of electricity and alternative sources of energy. Approximately 90% of Malawi’s population relies on charcoal and firewood for energy [48,75]. This explains the forest-cover loss in the study area between 1991 and 2015. Proximity of Dedza to Lilongwe, the capital of Malawi, offers a market for forest products, and this exacerbates the collection of illegal firewood and the charcoal produced for harvested poles and timber for construction from government forest reserves in Dedza. The persistence of electricity blackouts (load shedding 8 to 24 hours) in Malawi (evidenced in Appendix B) also encourages the overdependence of local communities and urban dwellers on charcoal and firewood in order to meet increased demand in urban and rural areas. The inefficient production and unsustainable use of biomass energy sources in Malawi adversely contributes to environmental degradation, such as high deforestation, desertification, and soil erosion.
Among the perceived important drivers indirectly contributing to LULC changes in Dedza is poverty. Local communities are unable to buy agricultural inputs due to high poverty levels, high cost of agricultural inputs, and lack of financial resources. The majority of the local communities in the district are characterized by high levels of poverty and lack of alternative livelihood sources. Harvesting and selling of forest produce and products such as poles, timber, firewood, and charcoal are among the sources of income for most of the communities in the study area. Local communities living in Dedza and the surrounding districts are also forced to clear forests for additional cultivated land or to sustain their livelihoods as an immediate and quick source of income. As perceived by key informants and through focus-group discussions, Dedza rainfall has been very variable. The rural communities in Dedza depend on the sales of forest produce as a common survival strategy in the case of land degradation, decline or failure of crop production, soil infertility, frequent and prolonged droughts, and unreliable rainfall. Overdependence and unsustainable extraction of natural resources without alternative economic strategies, such as forests, land, and water, results in serious environmental problems including soil erosion, biodiversity loss and disintegration, natural-resource depletion, water and air pollution, deforestation, and forest degradation. The results of this study resonate with other similar studies in Africa where high poverty levels were reported as the contributory factors for LULC changes [14,15,76,77]. This study has further revealed that, among main socioeconomic determinants, the education level of rural communities significantly affected their perceptions toward LULC drivers in the study area.

5. Conclusions

The study has examined LULC changes using multitemporal remotely sensed images in conjunction with household surveys, FGDs, and key informant interviews to establish their drivers in Dedza during the period of 1991–2015. There was a substantial decline in forest land, agricultural land, wetlands, and water, while built-up areas and barren land drastically increased over the studied period. Firewood collection, charcoal production, population growth, and poverty were ranked as the important drivers perceived by local communities to be responsible for LULC dynamics in the studied area. The findings also depict that education level significantly affected interviewees’ perceptions toward some of the drivers of LULC changes. The drivers identified in this study can be used as a tool for land-use planning, as well as input for modelling future LULC changes for the development of effective land-management strategies, guidelines, and policies for informed decision-making in Dedza and other districts with similar settings in Malawi. Appropriately tenable strategies and policies are urgently needed in the study area to address or avert undesirable LULC changes taking place in Dedza. Based on these results, the study recommends further studies to investigate the impact and consequences of these LULC changes on the rural livelihoods of the studied area so that landscape-management decisions and strategies are made based on scientific findings.

Author Contributions

M.G.M is the lead author. She designed the research, analyzed the data and wrote the original draft paper. N.D, J.O.B and A.M.A supervised, reviewed and edited the work. H.L.W.C. assisted in data collection and reviewing the paper. J.M.K and O.O.I.O. reviewed and edited the paper.

Funding

This research was funded by Organization for Women in Science for the Developing World (OWSD), Schlumberger Foundation through Faculty for the Future Program, National Research Foundation of South Africa (NRF) (UID: 102056) and University of Pretoria.

Acknowledgments

This research study was supported by the Organization for Women in Science for the Developing World (OWSD), University of Pretoria, the National Research Foundation (NRF) of South Africa, and the Schlumberger Foundation through its Faculty for the Future Program. We would also like to thank the Malawi Department of Forestry, the Malawi Department of Climate Change and Meteorological Services, and the NSO for the ancillary data used in this study. Vote of thanks to technical members of Dedza district council, chiefs and local communities who participated in this household survey and enumerators who tirelessly assisted with data collection.

Conflicts of Interest

The authors declare no conflict of interest.

Appendix A. Household Questionnaire

Enumerator: …………………………………Date of Interview: …………………
Respondent ID: ………………………………. Questionnaire No: …………………………
T/A……………………… GVH ……………………Village: …………………………….
A. HOUSEHOLD CHARACTERISTICS AND HUMAN ASSETS
1. (a) Age of respondent___________________
(b) Sex of respondent
Male  Female  
(c) Marital status
Single  Divorced  
Married  Widowed  
Separated  Refused to answer  
(d) Head of the household
Male  Female  
(e) What is the size of your household? _________
(f) Family size by age group and gender
Age groupMaleFemaleTotal
≤17
18–30
31–50
>50
(g) What is your occupation? (CHOOSE ONLY ONE THAT APPLIES)
Farmer   Construction    Other (Specify)
Business   Craft work   
Housewife    Student   
Professional   Domestic work   
(h) What is the highest level of your education?
No formal educationPrimarySecondaryPostsecondaryTertiaryOther (specify)
                  
(i) Ethnic group
ChewaNgoniYaoLomweOthers (Specify)
                 
(j) How long have you lived in this community?
<10 years11–20 years>20 years
       
(l) If less than 20 years in Qn (j), where did you live before (Village/Traditional Authority/District)?
………………………………………………………………………………………………….
(m) What was the reason for migration?
FarmingMarriageEmploymentOthers (Specify)
              
2. What is your household’s main sources of income? (CHECK ALL THAT APPLY and rank them on a scale of 1 to 5, where 1= least important and 5 = most important)
SourceTickDegree of ImportanceEstimated income
Farming (crop and animals)
Full-time private/government employment
Selling of forest produce (e.g. charcoal, firewood, timber, poles)
Piece-work (occasional jobs)
Self-employed (business, trade, handicraft)
Renting out land
Village saving loans/bank Mkhonde
Other (specify)
3. What type of domestic cooking stove does the family use for cooking?
Three-stone open fire   Charcoal stove   Chitetezo Mbaula    Kerosene Stove    Other (specify)   
4. What type of energy source do you use for the following activities?
(a) Cooking
Charcoal   Fuelwood   Paraffin (kerosene)   Crop residues   Briquettes   Other (specify)   
(b) Lighting
Electricity   Candles   Paraffin (kerosene)    Fuelwood   Solar panel    Other (specify)   
5(a) Which energy source would you prefer for all of your household’s energy needs?
Charcoal    Fuelwood    Paraffin (kerosene)   Solar   Electricity   Other (specify)    
(b) Why do you prefer this source of energy?
Convenient   Cheap   Easily accessible    No choice    Other (specify)    
6. What is your average monthly energy needs in terms of the following?
Fuelwood (no. of head loads collected)………………………………………...
Electricity (MK)………………………………………...
Charcoal (no. of 50 kg bags)………………………………………...
Crop residues (kg)………………………………………...
Paraffin (liters)………………………………………...
Other (specify)………………………………………...
B. POPULATION VS. LAND-USE AND LAND-COVER CHANGES
7(a). Do you think the population of your community has increased over the past 25 years?
Yes   No   
(b) If YES, what do you think have caused the population increase?
High fertility    Immigration   Both high fertility and immigration   Other (Specify)    
8 (a). Do you think that more land will be needed as your family grows?
Yes   No   
(b) If YES, how much extra land do you think you will need when you have a new family member?
0.5 acres   1 acre    2 acres    > 2 acres   Don’t know   
9. What kind of land would you clear when your family size increases?
Forest   Fallow land    Grazing land   Other (specify)    
C. AGRICULTURE VS. LAND-USE AND LAND-COVER CHANGES
10. List the major crops easily grown in your community (Start with the most important crops).
(i) ………………………………………. (ii) …………………………………….
(iii) ……………………………………... (iv) ……………………………………
11. Indicate the number of farms you have, and their size, purpose, and distance from home.
Farm landSize (acres)Purpose/Use (consumption, sale, or both)Distance from home
Farm 1
Farm 2
Farm 3
Farm 4
Farm 5
Total
12 (a). Has crop production declined or increased over the past 25 years in your community?
Declined   Increased   Stayed the same   No idea   
(b) If you indicated that crop production has declined, which, in your opinion, are the main reasons for this decline in crop production? (CHECK THE ONE THAT APPLIES)
Soil infertility  Unreliable rainfall  Pests and diseases  Limited land  
Lack of improved seed   Lack of agricultural inputs  Lack of knowledge and skills   inadequate labor  
Fluctuating markets/prices   Lack of money for inputs  Other      
FOREST VS LAND-USE AND LAND-COVER CHANGES
13 (a) Do you know of any forests in your area?
Yes   No    Name them:__________
(b) If YES, how do you think these forests came into existence?
Natural   Man-made    Both    
14. What has happened to forest cover in your community over the past few years?
IncreasedDeclinedNo change
          
HOUSEHOLD ACCESS TO INFRASTRUCTURE AND SERVICES
15. How has the distance to the following changed?
Access to nearestDecreasedIncreasedConstant (unchanged)
Markets
Health centers
Schools
Portable drinking water
Water sources (e.g. river/stream)
Main Roads
Bus stop
Town
PROXIMATE AND UNDERLYING CAUSES (DRIVERS) OF LULC CHANGES
16. What do you think are the causes of land-use and land-cover changes in your area (RANK ON A SCALE OF 1 TO 5; 5 = least important and 1 = most important).
Proximate causeRank
 12345
Firewood     
Charcoal production     
Timber     
Construction     
Agriculture expansion     
Bush fires     
Settlements     
Firewood     
Others (Specify)     


 Rank
Underlying Causes12345
Poverty     
Population growth     
Lack of financial resources     
Lack of law enforcement     
Demand for timber     


Thank you for your time!

Appendix B. Example of Load Shedding by ESCOM in Malawi

Sustainability 11 00832 i001

References

  1. Turner, B.L.; Lambin, E.F.; Reenberg, A. The emergence of land change science for global environmental change and sustainability. Proc. Natl. Acad. Sci. USA. 2007, 104, 20666–20671. [Google Scholar] [CrossRef] [PubMed]
  2. Kennedy, R.E.; Townsend, P.A.; Gross, J.E.; Cohen, W.B.; Bolstad, P.; Wang, Y. Adams, Remote sensing change detection tools for natural resource managers: Understanding concepts and tradeoffs in the design of landscape monitoring projects. Remote Sens. Environ. 2009, 113, 1382–1396. [Google Scholar] [CrossRef]
  3. Altaweel, M.R.; Alessa, L.N.; Kliskey, A.D.; Bone, C.E. Monitoring land use: Capturing change through an information fusion approach. Sustainability 2010, 2, 1182–1203. [Google Scholar] [CrossRef]
  4. Malhi, Y.; Roberts, J.T.; Betts, R.A.; Killeen, T.J.; Li, W.; Nobre, C.A. Climate change, deforestation, and the fate of the Amazon. Science 2008, 319, 169–172. [Google Scholar] [CrossRef] [PubMed]
  5. Miao, L.; Zhu, F.; He, B.; Ferratm, M.; Liu, Q.; Cao, X.; Cui, X. Synthesis of China’s land use in the past 300 years. Glob. Environ. Chang. 2013, 100, 224–233. [Google Scholar] [CrossRef]
  6. Burka, A. Land Use /Land Cover Dynamics in Prosopis juliflora invaded area of Metehara and the Surrounding Districts Using Remote Sensing and GIS Techniques. Master’s Thesis, Addis Ababa University, Addis Ababa, Ethiopia, 2008. [Google Scholar]
  7. Lamichhane, B.B. Dynamics and Driving Forces of Land Use/Forest Cover Change and Indication of Climate Change in a Mountain Sub-watershed of Gorkha. Master’s Thesis, Tribhuvan University, Institute of Forestry, Kirtipur, Nepal, 2008. [Google Scholar]
  8. Geist, H.J.; Lambin, E.F. Proximate causes and underlying driving forces of tropical deforestation. Bioscience 2002, 52, 143–150. [Google Scholar] [CrossRef]
  9. Lambin, E.F.; Turner, B.L.; Geist, H.J.; Agbola, S.B.; Angelsen, A.; Bruce, J.W.; Coomes, O.T.; Dirzo, R.; Fischerh, G.; Folke, C.; et al. The causes of land-use and land-cover change: Moving beyond the myths. Glob. Environ. Chang. 2001, 11, 261–269. [Google Scholar] [CrossRef]
  10. Falcucci, A.; Maiorano, L.; Ciucci, P.; Garton, E.O.; Boitani, L. Land-cover change and the future of the Apennine brown bear: A perspective from the past. J. Mammal. 2008, 89, 1502–1511. [Google Scholar] [CrossRef]
  11. Li, X.Y.; Ma, Y.J.; Xu, H.Y.; Wang, J.H.; Zhang, D.S. Impact of land use and land cover change on environmental degradation in Lake Qinghai watershed, northeast of Qinghai-Tibet Plateau. Land Degrad. Dev. 2009, 20, 69–83. [Google Scholar] [CrossRef]
  12. Maitima, J.M.; Olson, J.M.; Mugatha, S.M.; Mugisha, S.; Mutie, T. Land use changes, impacts and options for sustaining productivity and livelihoods in the basin of lake Victoria. J. Sustain. Dev. Afr. 2010, 12, 3. [Google Scholar]
  13. Kamwi, J.M.; Chirwa, P.W.C.; Manda, S.O.M.; Graz, F.P.; Katsch, C. Livelihoods, land use and land cover change in the Zambezi Region, Namibia. Popul. Environ. 2015, 36, 1–24. [Google Scholar] [CrossRef]
  14. Kindu, M.; Schneider, T.; Teketay, T.; Knoke, T. Drivers of land use/land cover changes in Munessa-Shashemene landscape of the south-central highlands of Ethiopia. Environ. Monit. Assess. 2015, 187, 452. [Google Scholar] [CrossRef] [PubMed]
  15. Mdemu, M.; Kashaigili, J.J.; Lupala, J.; Levira, P.; Liwenga, E.; Nduganda, A.; Mwakapuja, F. Dynamics of land use and land cover changes in the Pugu and Kazimzumbwi Forest Reserves. In Proceedings of the 1st Climate Change Impacts, Mitigation and Adaptation Programme Scientific Conference, Dar es Salaam, Tanzania, 2–3 January 2012; pp. 54–77. [Google Scholar]
  16. Hamandawana, H.; Nkambwe, M.; Chanda, R.; Eckardt, F. Population driven changes in land use in Zimbabwe’s district of Masvingo province: Some lessons from recent history. Appl. Geogr. 2005, 25, 248–270. [Google Scholar] [CrossRef]
  17. Gashaw, T.; Bantider, A.; Mahari, A. Population dynamics and land use/land cover changes in Dera District, Ethiopia. Glob. J. Biol. Agric. Health Sci. 2014, 3, 137–140. [Google Scholar]
  18. Mekuyie, M.; Jordaan, A.; Melka, J. Land-use and land-cover changes and their drivers in rangeland-dependent pastoral communities in the southern Afar Region of Ethiopia. Afr. J. Range Forage Sci. 2018, 35, 33–43. [Google Scholar] [CrossRef]
  19. Bassett, T.J.; Zueli, K.B. Environmental discourses and the Ivorian Savanna. Ann. Am. Assoc. Geogr. 2000, 90, 67–95. [Google Scholar] [CrossRef]
  20. SADC National Vulnerability Assessment Committee (NVAC). SADC Regional Vulnerability Assessment and Analysis Synthesis Report 2016: State of Food Insecurity and Vulnerability in the Southern African Development Community. In Proceedings of the Regional Vulnerability Assessment and Analysis (RVAA) Annual Dissemination Forum, Pretoria, Africa, 6–10 June 2016; Available online: https://www.sadc.int/files/4514/5750/7502/2015_SADC_Regional_Vulnerability_Assessment_Report_-_compressed.pdf (accessed on 23 August 2018).
  21. Fisher, M. Household welfare and forest dependence in Southern Malawi. Environ. Dev. Econ. 2004, 9, 135–154. [Google Scholar] [CrossRef]
  22. Jumbe, C.B.; Angelsen, A. Forest dependence and participation in CPR management: Empirical evidence from forest co-management in Malawi. Ecol. Econ. 2007, 62, 661–672. [Google Scholar] [CrossRef]
  23. Kambewa, P.; Utila, H. Malawi’s Green Gold: Challenges and Opportunities for Small and Medium Forest Enterprises in Reducing Poverty; IIED Small and Medium Forestry Enterprise Series no. 24; Chancellor College, Forest Research Institute of Malawi and International Institute for Environment and Development: London, UK, 2008. [Google Scholar]
  24. Yaron, G.; Mangani, R.; Mlava, J.; Kambewa, P.; Makungwa, S.; Mtethiwa, A.; Munthali, S.; Magoola, W.; Kazembe, J. Economic Analysis of Sustainable Natural Resource Use in Malawi; Ministry of Finance and Development Planning: Lilongwe, Malawi, 2011.
  25. Kalaba, K.F.; Chirwa, P.; Syampungani, S.; Ajayi, C.O. Contribution of agroforestry to biodiversity and livelihoods improvement in rural communities of southern African regions. In Tropical Rainforests and Agroforests under Global Change; Springer: Berlin/Heidelberg, Germany, 2010; pp. 461–476. [Google Scholar]
  26. Mauambeta, D.D.C.; Chitedze, D.; Mumba, R.; Gama, S. Status of Forests and Tree Management in Malawi; A Position Paper Prepared for the Coordination Union for Rehabilitation of the Environment (CURE): Blantyre, Malawi, 2010. [Google Scholar]
  27. Haack, B.; Mahabir, R.; Kerkering, J. Remote sensing-derived national land cover land use maps: A comparison for Malawi. Geocarto Int. 2014, 30, 270–292. [Google Scholar] [CrossRef]
  28. Palamuleni, L.G.; Annegarn, H.J.; Landmann, T. Land cover mapping in the Upper Shire River catchment in Malawi using Landsat satellite data. Geocarto Int. 2010, 25, 503–523. [Google Scholar] [CrossRef]
  29. Munthali, K.G.; Murayama, Y. Land use/cover change detection and analysis for Dzalanyama forest reserve, Lilongwe, Malawi. Procedia-Soc. Behav. Sci. 2011, 21, 203–211. [Google Scholar] [CrossRef]
  30. Munthali, K.G.; Murayama, Y. Modeling Deforestation in Dzalanyama Forest Reserve, Lilongwe, Malawi: A Multi-Agent Simulation Approach. GeoJournal 2014, 80, 1–15. [Google Scholar] [CrossRef]
  31. Jagger, P.; Perez-Heydrich, C. Land use and household energy dynamics in Malawi. Environ. Res. Lett. 2016, 11, 125004. [Google Scholar] [CrossRef] [PubMed]
  32. Pullanikkatil, D.; Palamuleni, L.G.; Ruhiiga, T.M. Land use/land cover change and implications for ecosystems services in the Likangala River Catchment, Malawi. Phys. Chem. Earth 2016, 93, 96–103. [Google Scholar] [CrossRef]
  33. Geist, H.J.; Lambin, E.F. What Drives Tropical Deforestation? A Meta-Analysis of Proximate and nderlying Causes of Deforestation Based on Subnational Case Study Evidence; LUCC Report Series no. 4; LUCC International Project Office: Louvain-la-Neuve, Belgium, 2001. [Google Scholar]
  34. Chowdhury, R.R. Household land management and biodiversity: Secondary succession in a forest-agriculture mosaic in southern Mexico. Ecol. Soc. 2007, 12, 2. [Google Scholar]
  35. Beilin, R.; Lindborg, R.; Stenseke, M.; Pereira, H.M.; Llausàs, A.; Slätmo, E.; Cerqueira, Y.; Navarro, L.; Rodrigues, P.; Reichelt, N.; et al. Analysing how drivers of agricultural land abandonment affect biodiversity and cultural landscapes using case studies from Scandinavia, Iberia and Oceania. Land Use Policy 2014, 36, 60–72. [Google Scholar] [CrossRef]
  36. Li, X.; Wang, Y.; Li, J.; Lei, B. Physical and socioeconomic driving forces of land-use and land-cover changes: A case study of Wuhan City, China. Discret. Dyn. Nat. Soc. 2016. [Google Scholar] [CrossRef]
  37. Bewket, W. Land cover dynamics since the 1950s in Chemoga watershed, Blue Nile Basin, Ethiopia. Mt. Res. Dev. 2002, 22, 263–269. [Google Scholar] [CrossRef]
  38. Foley, J.A.; DeFries, R.; Asner, G.P.; Barford, C.; Bonan, G.; Carpenter, S.R.; Chapin, F.S.; Coe, M.T.; Daily, G.C.; Gibbs, H.K.; et al. Global consequences of land use. Science 2005, 309, 570–574. [Google Scholar] [CrossRef]
  39. DeFries, R.; Eshleman, K.N. Land-use change and hydrologic processes: A major focus for the future. Hydrol. Process. 2004, 18, 2183–2186. [Google Scholar] [CrossRef]
  40. Dewan, A.M.; Yamaguchi, Y. Using Remote Sensing and GIS to Detect and Monitor and Use and Land Cover Change in Dhaka Metropolitan of Bangladesh during 1960–2005. Environ. Monit. Assess. 2009, 150, 237–249. [Google Scholar] [CrossRef] [PubMed]
  41. Serneels, S.; Lambin, E.F. Proximate causes of land-use change in Narok district, Kenya: A spatial statistical model. Agric. Ecosyst. Environ. 2001, 85, 65–81. [Google Scholar] [CrossRef]
  42. Wondie, M.; Schneider, W.; Melesse, A.M.; Teketay, D. Spatial and temporal land cover changes in the Simen Mountains National Park, a world heritage site in north western Ethiopia. Remote Sens. 2011, 3, 752–766. [Google Scholar] [CrossRef]
  43. Kindu, M.; Schneider, T.; Teketay, D.; Knoke, T. Land use/land cover change analysis using object-based classification approach in Munessa-Shashemene landscape of the Ethiopian highlands. Remote Sens. 2013, 5, 2411–2435. [Google Scholar] [CrossRef]
  44. Gatrell, J.D.; Jensen, R.R. Sociospatial applications of remote sensing in urban environments. Geogr. Compass 2008, 2, 728–743. [Google Scholar] [CrossRef]
  45. Perz, S.G. Household demographic factors as life cycle determinants of land use in the Amazon. Popul. Res. Policy Rev. 2001, 20, 159–186. [Google Scholar] [CrossRef]
  46. Lambin, E.F.; Geist, H.J.; Lepers, E. Dynamics of land use and land-cover change in tropical regions. Annu. Rev. Energy Environ. 2003, 28, 205–241. [Google Scholar] [CrossRef]
  47. Browder, J.O.; Pedlowski, M.; Summers, P.M. Land use patterns in the Brazilian Amazon: Comparative farm-level evidence from Rondônia. Hum. Ecol. 2004, 32, 197–224. [Google Scholar] [CrossRef]
  48. Government of Malawi. Population and Housing Census 2008; National Statistics Office: Zomba, Malawi, 2008.
  49. Government of Malawi. Dedza District Socio Economic Profile: 2013–2018; A Report by Dedza District Council: Dedza, Malawi, 2013.
  50. Kottek, M.; Grieser, J.; Beck, C.; Rudolf, B.; Rubel, F. World map of the Köppen-Geiger climate classification updated. Meteorologische Zeitschrift 2006, 15, 259–263. [Google Scholar] [CrossRef]
  51. Government of Malawi. Dedza District State of Environment and Outlook; A Report by Dedza District Council: Dedza, Malawi, 2010.
  52. Government of Malawi. Dedza Social—Economic Profile; A Report by Dedza District Council: Blantyre, Malawi, 1999.
  53. Government of Malawi. Dedza Town Assemble Urban Social Economic Profile; Ministry of Local Government, Capital Hill: Lilongwe, Malawi, 2012.
  54. Hansen, M.C.; DeFries, R.S.; Townshend, J.R.G.; Sohlberg, R. Global Land Cover Classification at 1 km Spatial Resolution Using a Classification Tree Approach. Int. J. Remote. Sens. 2000, 21, 1331–1364. [Google Scholar] [CrossRef]
  55. Yuan, F.; Sawaya, K.E.; Loeffelholz, B.C.; Bauer, M.E. Land cover classification and change analysis of the Twin Cities (Minnesota) Metropolitan Area by multitemporal Landsat remote sensing. Remote Sens. Environ. 2005, 98, 317–328. [Google Scholar] [CrossRef]
  56. Manandhar, R.; Odeh, I.O.A.; Ancev, T. Improving the Accuracy of Land Use and Land Cover Classification of Landsat Data using Post-classification Enhancement. Remote. Sens. 2009, 1, 330–344. [Google Scholar] [CrossRef]
  57. Prakasam, C. Land use and land cover change detection through remote sensing approach: A case study of Kodaikanal Taluk, Tamil Nadu. Int. J. Geomat. Geosci. 2010, 1, 150–158. [Google Scholar]
  58. Rawat, J.S.; Biswas, V.; Kumar, M. Changes in land use/land cover using geospatial techniques: A case study of Ramnagar town area, district Nainital Uttarakhand, India. Egypt. J. Remote Sens. Space Sci. 2013, 16, 111–117. [Google Scholar] [CrossRef]
  59. Liu, C.; Frazier, P.; Kumar, L. Comparative assessment of the measures of thematic classification accuracy. Remote Sens. Environ. 2007, 107, 606–616. [Google Scholar] [CrossRef]
  60. Congalton, R.; Green, K. Assessing the Accuracy of Remotely Sensed Data: Principles and Practices, 2nd ed.; Taylor and Francis Group: Abingdon, UK, 2009. [Google Scholar]
  61. Anderson, J.R. A Land Use and Land Cover Classification System for Use with Remote Sensor Data: Geological Survey Professional Paper 964; US Government Printing Office: Washington, DC, USA, 1976.
  62. Kamusoko, C.; Aniya, M. Land use/cover change and landscape fragmentation analysis in the Bindura District, Zimbabwe: Land Degradation and Development. Land Degrad. Dev. 2007, 18, 221–233. [Google Scholar] [CrossRef]
  63. Puyravaud, J.P. Standardizing the Calculation of the Annual Rate of Deforestation. Forest. Ecol. Mana. 2003, 177, 593–596. [Google Scholar] [CrossRef]
  64. Teferi, E.; Bewket, W.; Uhlenbrook, S.; Wenninger, J. Understanding recent land use and land cover dynamics in the source region of the Upper Blue Nile, Ethiopia: Spatially explicit statistical modeling of systematic transitions. Agric. Ecosyst. Environ. 2013, 165, 98–117. [Google Scholar] [CrossRef]
  65. Batar, A.K.; Watanabe, T.; Kumar, A. Assessment of Land-Use/Land-Cover Change and Forest Fragmentation in the Garhwal Himalayan Region of India. Environment 2017, 4, 34. [Google Scholar] [CrossRef]
  66. Lesschen, J.P.; Verburg, P.H.; Staal, S.J. Statistical Methods for Analysing the Spatial Dimension of Changes in Land Use and Farming Systems; International Livestock Research Institute: Nairobi, Wageningen, 2005; p. 80. [Google Scholar]
  67. Hennink, M.M. International Focus Group Research. In A Handbook for the Health and Social Sciences. Cambridge; Cambridge University Press: Cambridge, UK, 2007; Volume 103. [Google Scholar]
  68. Musa, L.; Peters, K.; Ahmed, M. On farm characterization of Butana and Kenana cattle breed production systems in Sudan. Livest. Res. Rural Dev. 2006, 18, 1277–1288. [Google Scholar]
  69. Solomon, N.; Birhane, E.; Tadesse, T.; Treydte, A.C.; Meles, K. Carbon stocks and sequestration potential of dry forests under community management in Tigray, Ethiopia. Ecol. Process. 2017, 6, 20. [Google Scholar] [CrossRef]
  70. Hsieh, H.; Shannon, S.E. Three approaches to qualitative content analysis. Qual. Res. 2005, 15, 1277–1288. [Google Scholar] [CrossRef] [PubMed]
  71. Abera, D.; Kibret, K.; Beyene, S. Tempo-spatial land use/cover change in Zeway, Ketar and Bulbula sub-basins, Central Rift Valley of Ethiopia. Lakes Reserv. Sci. Policy Manag. Sustain. Use 2018, 1–17. [Google Scholar] [CrossRef]
  72. Meneses, B.M.; Reis, E.; Pereira, S.; Vale, M.J.; Reis, R. Understanding Driving Forces and Implications Associated with the Land Use and Land Cover Changes in Portugal. Sustainability 2017, 9, 351. [Google Scholar] [CrossRef]
  73. Bone, R.A.; Parks, K.E.; Malcolm, D.H.; Tsirinzeni, M.; Willcock, S. Deforestation since independence: A quantitative assessment of four decades of land-cover change in Malawi. South. For. J. For. Sci. 2017, 79, 269–275. [Google Scholar] [CrossRef]
  74. Kidane, Y.; Stahlmann, R.; Beierkuhnlein, C. Vegetation dynamics, and land use and land cover change in the Bale Mountains, Ethiopia. Environ. Monit. Assess. 2012, 184, 7473–7489. [Google Scholar] [CrossRef] [PubMed]
  75. Gamula, G.E.T.; Hui, L.; Peng, W. An Overview of the Energy Sector in Malawi. Energy Power Eng. 2013, 5, 8–17. [Google Scholar] [CrossRef]
  76. Haller, T.; Galvin, M.; Meroka, P.; Alka, J.; Alvarez, A. Who Gains from Community Conservation? Intended and Unintended Costs and Benefits of Participative Approaches in Peru and Tanzania. J. Environ. Dev. 2008, 17, 118–144. [Google Scholar] [CrossRef]
  77. Ariti, A.T.; van Vliet, J.; Verburg, P.H. Land-use and land-cover changes in the Central Rift Valley of Ethiopia: Assessment of perception and adaptation of stakeholders. Appl. Geogr. 2015, 65, 28–37. [Google Scholar]
Figure 1. Map of Dedza district, central region of Malawi.
Sustainability 11 00832 g001
Figure 2. LULC maps for (a) 1991, (b) 2001, and (c) 2015.
Sustainability 11 00832 g002
Figure 3. Net change in LULC classes between 1991 and 2015.
Sustainability 11 00832 g003
Figure 4. Respondent perceptions of observed trends at the landscape level.
Sustainability 11 00832 g004
Figure 5. Population growth in Dedza from 1991 to 2015.
Sustainability 11 00832 g005
Figure 6. Annual rainfall for Dedza from 1991 to 2015.
Sustainability 11 00832 g006
Table 1. Detailed information on Landsat images used in this study.
SatelliteSensorPath/RowSpatial Resolution (m)Spectral BandsDate of AcquisitionSource
Landsat 5TM168/070301, 2, 3, 4, 5, and 716/09/1991USGS
Landsat 7ETM+168/070301, 2, 3, 4, 5, and 719/09/2001USGS
Landsat 8OLI168/070302, 3, 4, 5, 6, and 718/09/2015USGS
Table 2. Land-use land-cover (LULC) classes used in this study.
LULC ClassDescription
Water bodiesRivers, permanent open water, lakes, ponds, reservoirs.
WetlandPermanent and seasonal grasslands along lake, river, and streams, marshy land and swamps.
Agricultural landAll cultivated and uncultivated agricultural lands areas, such as farmlands, crop fields including fallow lands/plots, and horticultural lands.
ForestProtected forests, plantations, deciduous forests, mixed forest lands, and forests on customary land.
Built-up areasResidential, commercial and service, industrial, socioeconomic infrastructure, and mixed urban and other urban, transportation, roads, and airports.
Barren landAreas around and within forest-protected areas with no or very little vegetation cover, including exposed soils, stock quarry, rocks, landfill sites, and areas of active excavation.
Table 3. Accuracy-assessment results for the 2015 LULC change map.
Referenced Data
Classified imageClassWaterWetlandForestAgricultureBarrenBuilt-UpRow TotalUser Accuracy (%)
Water100000010100
Wetland0910001090
Forest01190002095
Agriculture0021252513493.3
Barren00503203786.5
Built-up0002081080
Column Total101001273413221
Producer’s accuracy (%)1009070.498.494.161.5
Overall accuracy = 91.86%, Kkappa coefficient = 0.866.
Table 4. LULC change trends and annual rate of change of the study area.
LULC Class19912015LULC Changes (1991–2015) (%)Annual Change Rate (1991–2015) (%)
Area (Ha)%Area (Ha)%
Water1380.600.37899.550.24−0.13−1.78
Wetland3626.730.962680.290.71−0.25−1.26
Forest9939.152.646237.631.66−0.98−1.94
Agriculture267,977.4371.3260,879.3169.41−1.89−0.11
Barren92,185.3824.5397,174.6225.851.320.22
Built-up761.670.27999.562.131.939.8
Total area375,870.96100375,870.96100
Table 5. LULC change matrix from 1991 to 2015.
LULC ClassUnitWaterWetlandsForestAgricultureBarrenBuilt-UpTotal 1991
Water(ha)889.025.310.00484.920.001.351380.60
(%)64.390.380.0035.120.000.10100
Wetlands(ha)0.721842.4830.9640.141712.340.093626.73
(%)0.0250.800.851.1147.210.00100
Forest(ha)1.0853.283004.56737.196,110.1932.859939.15
(%)0.010.5430.237.4261.480.33100
Agriculture(ha)8.4616.38397.98257,349.692960.017244.91267,977.43
(%)0.000.010.1596.031.102.70100
Barren(ha)0.27762.842803.862162.6186,391.9963.8192,185.38
(%)0.000.833.042.3593.720.07100
Built-up(ha)0.000.000.27104.760.09656.55761.67
(%)0.000.000.0413.750.0186.20100
Total 2015 899.552680.296237.63260,879.3197,174.627999.56375,870.96
Note: Bold numbers on the diagonal represent unchanged LULC proportions from 1991 to 2015 and their corresponding percentages, while others are the areas changed from one class to another.
Table 6. Sampled household characteristics in the studied landscape (N = 586).
Household AttributeValue
Mean household age (years)39.2
Gender (female, %)63.3
Head of the family (male, %)71.7
Marital status (married, %)78.7
Education (literate, %)77.8
Occupation (Farmer, %)81.6
Mean household size (no.)5.6
Mean land holding size (acres)2.32
Ethnic group (Chewa, %)50.7
Mean income (MK/year*)286,843.26
Sources of income (farming, rank)1
Domestic stove used for cooking (three-stone open fires, %)88.2%
Note: * Malawi currency at the time of the study, 1 USD = 721.30.
Table 7. Perceived proximate drivers of LULC changes in the studied area.
LULC Proximate DriverNo. of Respondent Per RankWeightIndexRank
12345
Firewood collection23116649161220100.2901
Charcoal production16910261271215020.2172
Timber22579764367930.1143
Construction28676935136980.1014
Agriculture expansion25394742315370.0775
Bush fires18285551445130.0746
Settlements19283523103680.0537
Traditional medicine961025301790.0268
Poles798911140.0169
Burning bricks510654970.01410
Tobacco farming51071071130.01611
Shifting cultivation01120110.00212
Table 8. Perceived underlying drivers of LULC changes in the study area.
LULC Underlying DriverNo. of Respondent Per RankWeightIndexRank
12345
Poverty126819249890.3331
Population growth1277415439870.3322
Lack of financial resources252410442630.0893
Lack of law enforcement13182811112540.0864
Demand for timber9108661270.0435
Weak government policies255125740.0256
Poor access to alternative-energy supply0410113710.0247
High cost of agriculture inputs031176650.0228
Weak leadership at all levels08253510.0179
urbanization06101280.00910
Poor marketing structures04620380.01311
Political interferences11008230.00812
Table 9. Socioeconomic determinants influencing respondents on perceived drivers of LULC changes.
Perceived DriverIndependent VariableEstimateStd. ErrorWaldp-ValueLower BoundUpper Bound
Firewood collectionAge0.0070.0061.2870.257−0.0050.020
Household size−0.0210.0440.2330.630−0.1070.065
Land holding size−0.0480.0401.4580.227−0.1250.030
Gender (1 = Male)0.4650.2702.9560.086−0.0650.995
Education (1 = Never attended)−1.2220.4318.0470.005−2.066−0.378
Education (2 = Primary, 1–8)−0.8560.2978.2800.004−1.439−0.273
Charcoal productionAge−0.0090.0071.6520.199−0.0230.005
Household size0.0070.0470.0210.886−0.0860.099
Land holding size0.0450.0560.6420.423−0.0650.155
Gender (1 = Male)0.3360.3091.1840.277−0.2690.941
Education (1 = Never attended)0.3220.4760.4560.499−0.6121.255
Education (2 = Primary, 1–8)0.2090.3250.4120.521−0.4280.845
Agricultural expansionAge0.0150.0102.2210.136−0.0050.034
Household size−0.1010.0702.0930.148−0.2370.036
Land holding size0.0710.0710.9860.321−0.0690.210
Gender (1 = Male)−0.2260.4350.2700.603−1.0790.627
Education (1 = Never attended)−1.8390.8065.2080.022−3.418−0.259
Education (2 = Primary, 1–8)−2.2500.64912.0190.001−3.521−0.978
SettlementsAge0.0030.0120.0790.778−0.0200.026
Household size−0.0470.0810.3410.560−0.2060.112
Land holding size0.1050.0841.5720.210−0.0590.270
Gender (1 = Male)0.0260.4400.0030.954−0.8360.887
Education (1 = Never attended)−0.4080.7510.2950.587−1.8811.065
Education (2 = Primary, 1–8)−0.8820.4903.2330.072−1.8430.079
PovertyAge0.0060.0100.4300.512−0.0130.026
Household size−0.0720.0651.2080.272−0.1990.056
Land holding size0.0080.0810.0110.917−0.1500.167
Gender (1 = Male)−0.4360.4650.8810.348−1.3470.475
Education (1 = Never attended)1.6000.6506.0500.0140.3252.875
Education (2 = Primary, 1–8)0.9160.3975.3140.0210.1371.695
Population growthAge−0.0080.0090.6630.415−0.0260.011
Household size0.0380.0690.3080.579−0.0970.173
Land holding size−0.0080.0520.0230.878−0.1090.093
Gender (1 = Male)0.4600.4581.0070.316−0.4381.358
Education (1 = Never attended)−1.4100.6594.5750.032−2.703−0.118
Education (2 = Primary, 1–8)−0.5410.4311.5750.209−1.3850.304

