Classification of Driving Fatigue in High-Altitude Areas


College of Highway Engineering, Chang’an University, Xi’an 710064, China
*
Author to whom correspondence should be addressed.
Sustainability 2019, 11(3), 817; https://doi.org/10.3390/su11030817
Submission received: 19 December 2018
/
Revised: 28 January 2019
/
Accepted: 31 January 2019
/
Published: 4 February 2019
Abstract
:Driving fatigue is one of the main causes of traffic accidents. Thus, to prevent traffic accidents and ensure traffic safety, the properties of driving fatigue at the wheel must be determined. The Qinghai–Tibet Plateau in China is known for its high elevation, causing hypoxia, and presence of severely cold areas; all these easily lead to fatigue during driving. This, in turn, seriously affects the traffic safety on the high-altitude highway. Therefore, the factors leading to driving fatigue and the influence of high-altitude on driving fatigue affecting the driver must be further studied. In this study, we classified and quantified driving fatigue according to the driving fatigue degree. We determined three levels of driving fatigues (i.e., mild, moderate, and severe fatigues) to present their influence on drivers. Our study shows that in this high-altitude area, drivers became fatigued within a significantly shorter time.
1. Introduction
In 2013, 1.25 million road traffic deaths were recorded worldwide. With the growth of the population and of motorization, the amount of road traffic deaths are said to increase further [1]. Driving fatigue is not only a direct cause of traffic accidents but also leads to the most vicious accidents. In the UK, Maycock [2] determined that 7% of motor vehicle accidents could be attributed to fatigue. Fletcher [3] determined that almost 40% of traffic accidents in North America were caused by driving fatigue. Recent studies show that the costs of fatigue-related accidents in the US amount to $31.1 billion [4]. All these studies show that researchers have fully realized the importance of preventing driving fatigue for ensuring road safety.
Williamson et al. [5] defined driving fatigue as a state of reduced mental alertness, which impairs the performance of cognitive and psychomotor tasks, including driving. Many factors, such as the natural environment, the driver’s mental status, road traffic environment, and vehicle characteristics, could influence driving fatigue. In particular, the natural environment is the most important factor in some extreme areas, including high-altitude areas.
In the Tibetan Plateau, the average elevation exceeds 4500 m. In addition, the natural environment is abominable; the climate is extreme; winters are long, cold, dry, and windy; and the extreme lowest temperature of the day is −48.1 °C. All these factors play a major role in influencing a driver. The current studies have not considered these extreme conditions in the designing and management of this area.
Drivers are unaware of driving fatigue, which decreases their ability to drive safely [6,7]. Therefore, we must measure and quantify driving fatigue. Previous studies have proposed several methods for measuring driving fatigue, these include performance, perceptual, electrophysiological, psychological, and biochemical measurements [8].
Some studies have used the measurement of heart rate for measuring driving fatigue. Riemersma et al. [9] found that drivers’ heart rate decreased when driving for a long time during the night; this was verified by Lal and Craig [10]. Harris et al. [11] determined that heart rate variability (HRV) and the feeling of fatigue are both associated with deterioration in driving.
Furthermore, O’Hanlon [12] found changes in HRV among drivers with long test drives. Hartley and Arnold [13] found that the changes in HRV could be used for indicating driving fatigue. The importance of utilizing HRV as a physiological parameter to assess fatigue for purposes of developing fatigue counter-measurement systems was explored by Lal et al. [14]. Patel et al. [15] used HRV as a measure for determining driving fatigue under laboratory conditions and determined that it showed a 90% accuracy.
This paper proposes a method to quantify and classify driving fatigue according to HRV. In addition, we propose a driving fatigue standard based on elevation.
2. Methodology
2.1. Participants
Ten healthy volunteers (five females and five males) with an age range between 19 to 36 years (mean age of 23.9, standard deviation (SD) of 4.9) participated in this experiment. All subjects had driving licenses (mean of 2 years, SD of 3.2) and were asked to abstain from alcohol and smoking for 24 h and from caffeine-based drinks for 12 h before participating. All participants slept at least 7 h before being evaluated (mean of 7.2 h and SD of 1.2). To avoid the confounding influence of circadian rhythm [16,17] or any diurnal variation [18], all experimental sessions were conducted between 9 a.m. and 12 p.m.
2.2. Instruments
We used the CTM-3000E, which is a non-contact speedometer camera, to display real-time test data. It was deployed with the test vehicle to record real-time speed and distance. In addition, we used the PM-60A, a cardiotachometer and oximeter, to record the heartbeat rate and degree of blood oxygen saturation. Moreover, a portable GPS was used to record the elevation.
2.3. Procedures
We chose G214, a first-class highway with K145 + 000 − K795 + 000 as the experiment road, and evaluated it from 2000 to 5000 m. We chose four sections of the road with different elevations: Section 4 (K570 + 000 − K610 + 000) with an elevation of 4500–5000 m, Section 3 (K536 + 000 − K564 + 000) with an elevation of 4000–4500 m, Section 2 (K290 + 000 − K225 + 000) with an elevation of 3500–4000 m, and Section 1 (K225 + 000 − K180 + 000) with an elevation of 3000–3500 m. 80% of the all four sections are composed by straight lines and large radius of a circular curves. They have the same road alignment conditions. The longitudinal slope is not greater than 4%. The experiment was performed between 9 a.m. and 12 p.m. to ensure the same road traffic condition. The roadside landscape was monotonous with only grasslands and no landmarks. The experimental vehicle used was the Jinbei Granse multipurpose vehicle.
Before initiating the experiment, we recorded the driver’s heartbeat rate and degree of blood oxygen saturation for 30 min, and helped participants get acquainted with the experimental environment and devices. We also ensured that the participants were not stressed before performing the experiment. The experiment was then started and took 1 h each time for completion. We recorded all the data automatically while observing the state of the driver and enquiring about their state of mind.
2.4. Data Collection
HRV is the measure of variations in a heartbeat and is calculated by processing the time series of R–R interval in an electrocardiogram (ECG) signal (see Figure 1). Thus, we translated the ECG signals to R–R intervals for further analysis. The procedure is as follows (see Figure 2):
- (1)
- Process the ECG data obtained in the experiment to its corresponding R–R interval series with different elevations,
- (2)
- Calculate the standard deviation of NN intervals (SDNN) and mean of R–R interval series every 30 s, N is the number of R–R interval in 30 s, that is:
- (3)
- Calculate the variable coefficient of RR interval series, that is, RRVC, every 30 s:
Before driving, a driver showed a certain amount of fatigue, which we termed as the before driving fatigue (BDF). In addition, the driving fatigue defined as the fatigue due to the driving process is termed as the DFC, and the total amount of fatigue is termed as the fatigue cumulant (FC). All these factors are derived as follows:
We used the total driving fatigue degree (TDFD) and the DFD to represent the fatigue generated in the driving process:
Through the aforementioned procedure, we obtained the data for the elevation of 3000–3500 m. Table 1 partially illustrates the driver fatigue parameter statistics in 3000–3500 m, from 0–35.5 min. The changing tendency of parameters was stable after 35.5 min.
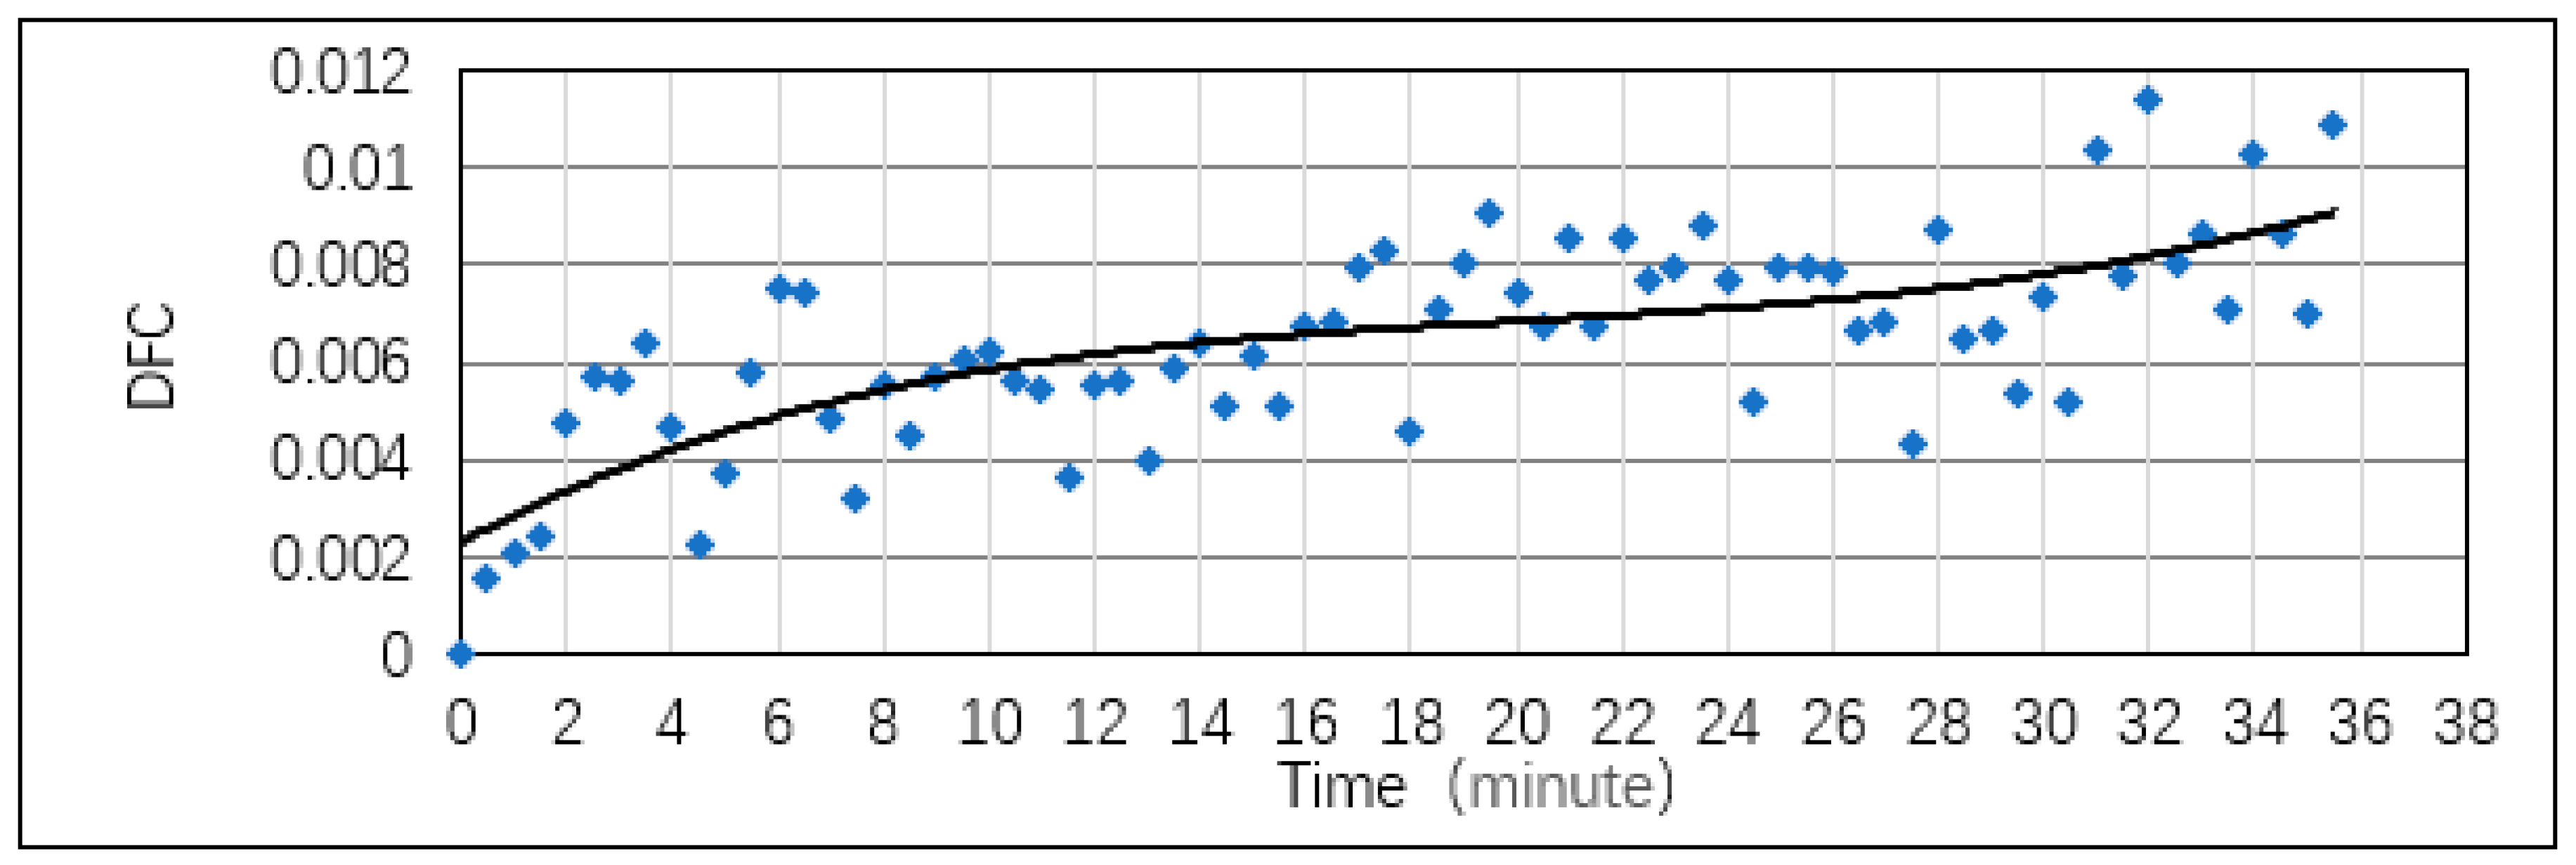
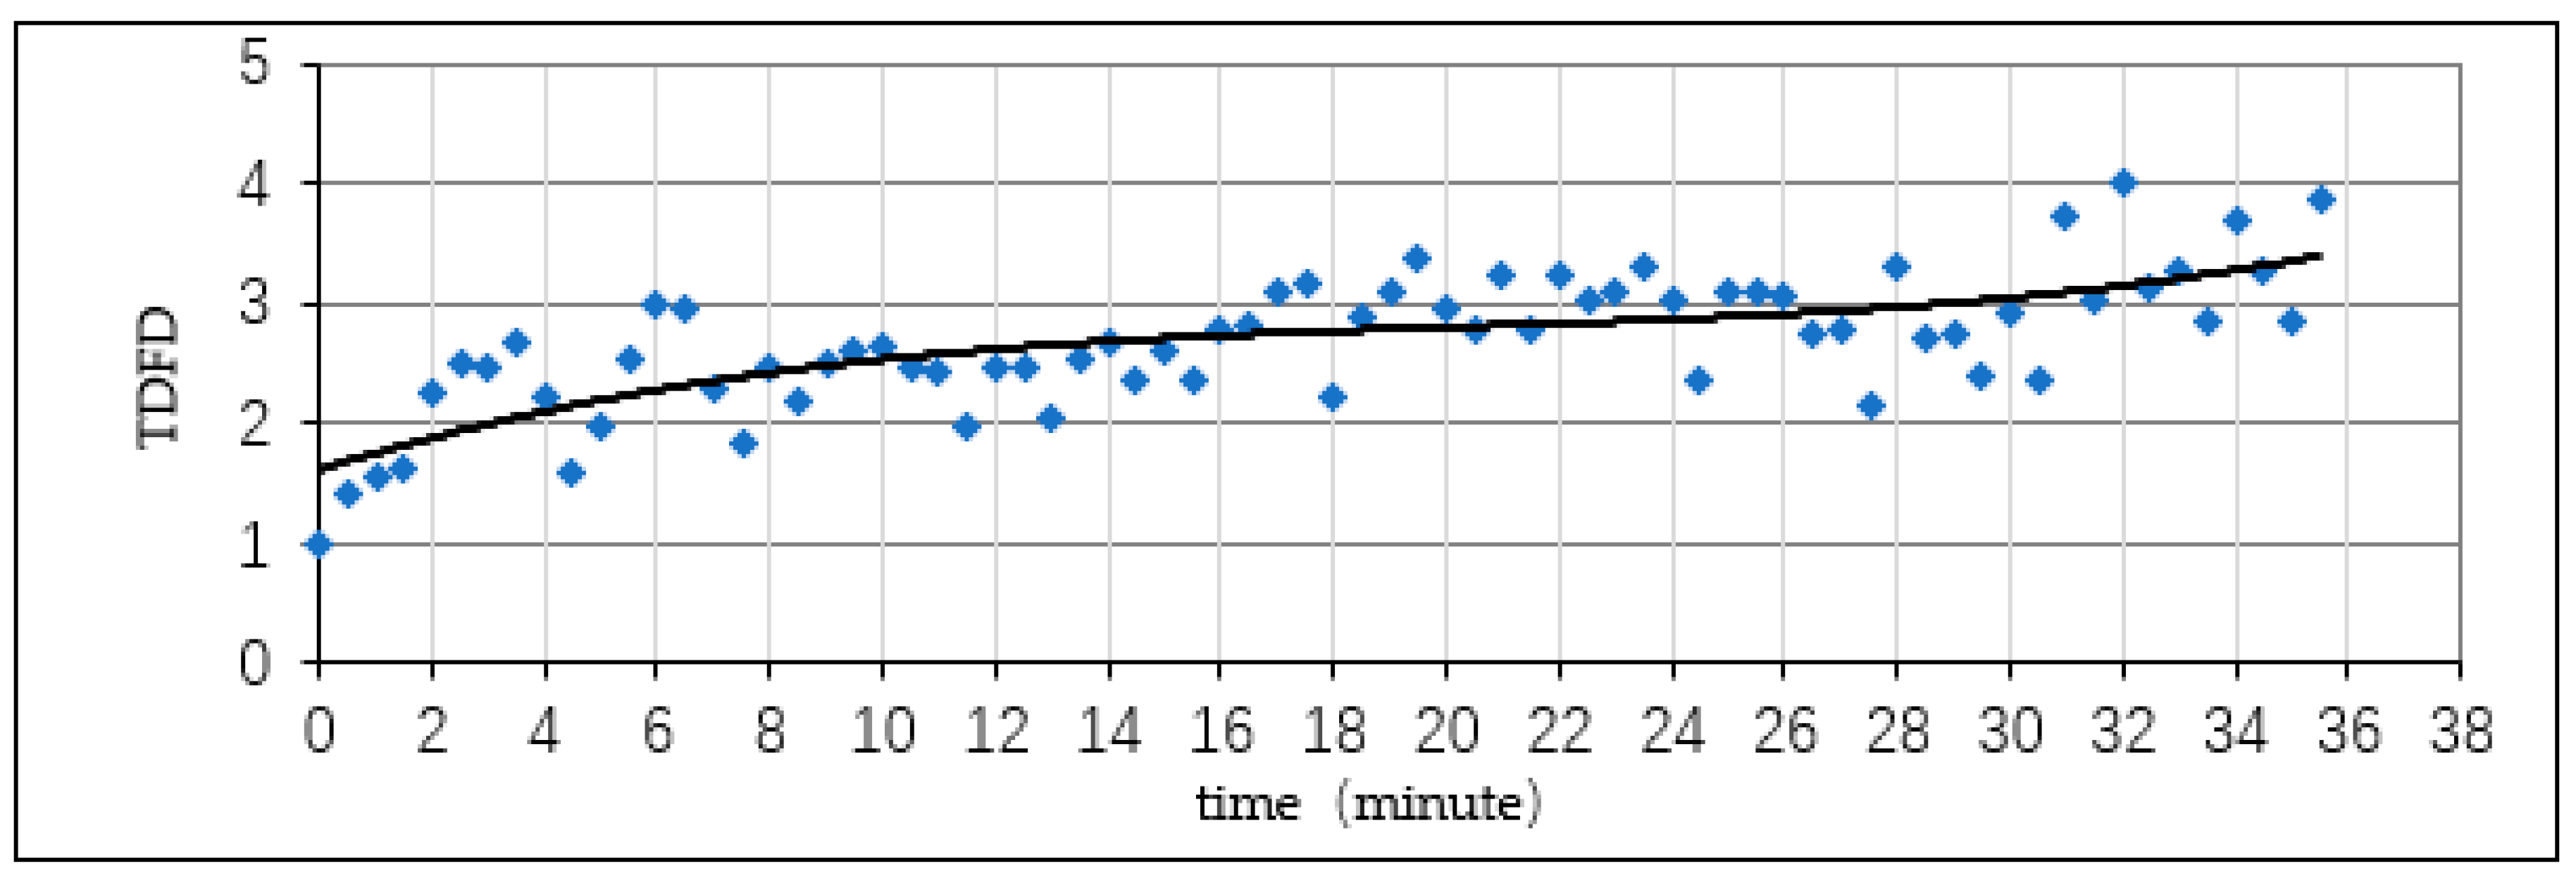
Figure 3, Figure 4 and Figure 5 show that in the 3000–3500 m interval, DFC increased with time. This increase accelerated at 0–15 min, became more moderate at 15–29 min, and sharply accelerated again after 29 min. According to the drivers’ subjective response during the experiment, most of them showed evident characteristics of driving fatigue, such as yawning, sore, or heavy eyes, after 32 min. Therefore, the driving fatigue could be categorized into three levels as mild, moderate, and severe by incorporating the DFD and the subjective performance of drivers. This reaction of the driver was the same as the data obtained from the inflection points on the curves. When the driver was mildly fatigued, the TDFD was 2.61 and DFD was 1.61; for moderate fatigue, the TDFD was 2.76 and DFD was 1.76; and for severe fatigue, the TDFD was 3.86 and DFD was 2.86.
Based on the regression analysis, during the elevation of 3000–3500 m, we calculated the relational model between the DFC and T as follows, where T is time:
and coefficient of determination .
We used Pearson’s correlation coefficient to assess the correlation of driving time with the index we used.
At 3000–3500 m, a significant correlation was observed between the DFC and time (driving time) (see Table 2).
Based on the regression analysis, we calculated the relational model between the TDFD and T in the 3000–3500 m elevation as follows:
And .
At the 3000–3500 m elevation, a significant correlation was observed between the DFD and time (driving time) (see Table 3).
Based on the regression analysis, we calculated the relational model between the DFD and T at the 3000–3500 m elevation.
.
In the 3000–3500 m elevation, a significant correlation was observed between the TDFD and time (driving time) (see Table 4).
3. Results
As shown in the chart, with increasing elevation, the driving fatigue accumulated faster. A higher elevation implies lesser oxygen in the air, thus leading to hypoxia, which in turn causes driving fatigue. This shows that elevation greatly influenced driving fatigue. With higher altitude, the influence was more significant (see Table 5, Figure 6). The use of this method effectively quantifies and classifies driving fatigue.
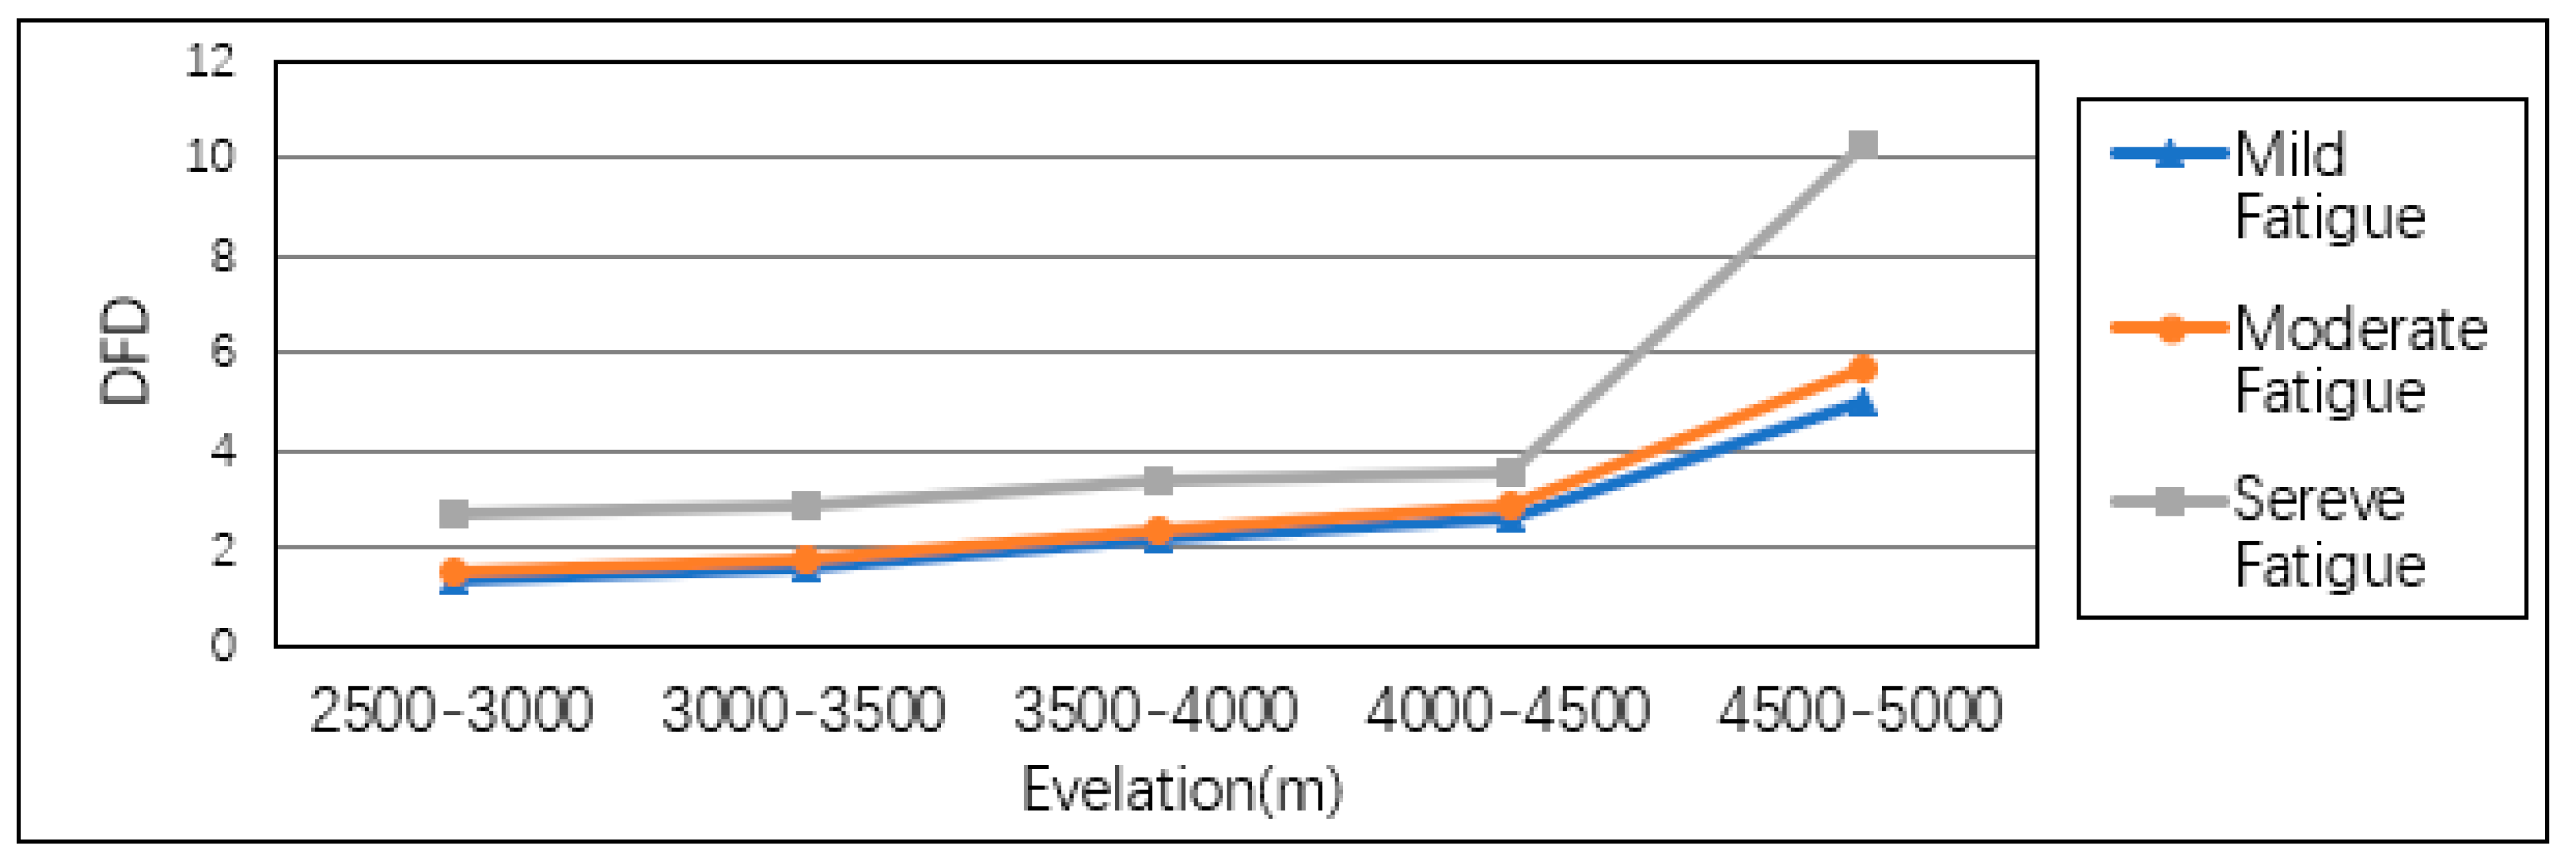
To analyze the DFD and TDFD, we determined that in high altitude areas (above 3000 m), driving fatigue was more critical than in a normal area. Furthermore, the two indexes show a significant change in areas above 4000 m, implying that the driving fatigue in this area was generated and accumulated at an extremely fast rate (see Figure 7 and Figure 8). Researchers should also consider altitude as an important factor in the design and management of a highway.
4. Conclusions
In this paper, we showed the classification of driving fatigue in high-altitude areas, based on the DFD at different elevations. The driving fatigue was divided into three levels: mild, moderate, and severe fatigues. We determined that a high elevation greatly influenced driving fatigue; drivers reached the third level of fatigue faster with increasing elevation. We used RRVC as a parameter to quantify the driving fatigue as the DFD. The results showed that driving safety was affected at the mild fatigue level. Thus, some measures should be taken to prevent driving fatigue. Merat et al. [19] used three engineering treatments to alleviate the symptoms of fatigue. Further research should be conducted to resolve these symptoms more completely.
Author Contributions
Methodology, H.R.; supervision, J.X.; writing—original draft, Z.D.; writing—review and editing, M.L.
Funding
This research was funded by the National Key Research and Development Program of China (Grant no. 2016YFC0802208) and the Natural Science Foundation of Shaanxi Province (Grant no. 2017JQ5122).
Acknowledgments
This research was supported in part by the Natural Science Foundation of Shaanxi Province (No. 2017JQ5122), the National Key Research and Development Program of China (No. 2016YFC0802208).
Conflicts of Interest
The authors declare no conflict of interests.
References
- World Health Organization. Global Status Report on Road Safety 2015; World Health Organization: Geneva, Switzerland, 2015. [Google Scholar]
- Maycock, G. Sleepiness and driving: The experience of UK car drivers. Accid. Anal. Prev. 1997, 29, 453–462. [Google Scholar] [CrossRef]
- Fletcher, A.; McCulloch, K.; Baulk, S.D.; Dawson, D. Countermeasures to driver fatigue: A review of public awareness campaigns and legal approaches. Aust. N. Z. J. Public Health 2005, 29, 471–476. [Google Scholar] [CrossRef] [PubMed]
- Shahly, V.; Berglund, P.A.; Coulouvrat, C.; Fitzgerald, T.; Hajak, G.; Roth, T.; Shillington, A.C.; Stephenson, J.J.; Walsh, J.K.; Kessler, R.C. The associations of insomnia with costly workplace accidents and errors: Results from the America Insomnia Survey. Arch. Gen. Psychiatry 2012, 69, 1054–1063. [Google Scholar] [CrossRef] [PubMed]
- Williamson, A.M.; Feyer, A.; Friswell, R. The impact of work practices on fatigue in long distance truck drivers. Accid. Anal. Prev. 1996, 28, 709–719. [Google Scholar] [CrossRef]
- Di Stasi, L.L.; Renner, R.; Catena, A.; Cañas, J.J.; Velichkovsky, B.M.; Pannasch, S. Towards a driver fatigue test based on the saccadic main sequence: A partial validation by subjective report data. Transp. Res. Part C Emerg. Technol. 2012, 21, 122–133. [Google Scholar] [CrossRef]
- Dawson, D. Fatigue research in 2011: From the bench to practice. Accid. Anal. Prev. 2012, 45, 1–5. [Google Scholar] [CrossRef] [PubMed]
- Lal, S.K.; Craig, A. A critical review of the psychophysiology of driver fatigue. Biol. Psychol. 2001, 55, 173–194. [Google Scholar] [CrossRef]
- Riemersma, J.B.J.; Sanders, A.F.; Hildervanck, C.; Gaillard, A.W. Performance decrement during prolonged night driving. In Vigilance: Theory, Operational Performance and Physiological Correlates; Mackie, R., Ed.; Plenum Press: New York, NY, USA, 1977; pp. 41–58. [Google Scholar]
- Lal, S.K.L.; Craig, A. Driver Fatigue: Psychophysiological effects. In Proceedings of the Fourth International Conference on Fatigue and Transportation, Fremantle, Australia, 19 March 2000. [Google Scholar]
- Harris, W.; Mackie, R.R.; Abrams, C.; Buckner, D.N.; Harabedian, A.; O’Hanlon, J.F.; Starks, J.R. A study of the Relationship Among Fatigue, Hours of Service and Safety of Operations of Truck- and Bus-Drivers; Human Factors Research Inc.: Carlsbad, CA, USA, 1972. [Google Scholar]
- O’Hanlon, J.F. Heart Rate Variability; A New Index of Drivers’ Alertness: Fatigue; Human Factors Research Inc.: Carlsbad, CA, USA, 1971. [Google Scholar]
- Hartley, L.R.; Arnold, P.K. Indicators of fatigue in truck drivers. Appl. Ergon. 1994, 25, 143–156. [Google Scholar] [CrossRef]
- Lal, S.; Craig, A.; Boord, P.; Kirkup, L.; Nguyen, H. Development of an algorithm for an EEG-based driver fatigue countermeasure. J. Saf. Res. 2003, 34, 321–328. [Google Scholar] [CrossRef]
- Patel, M.; Lal, S.K.L.; Rossiter, P.; Kavanagh, D. Applying neural network analysis on heart rate variability data to assess driver fatigue. Expert Syst. Appl. 2011, 38, 7235–7242. [Google Scholar] [CrossRef]
- Lenne, M.G.; Triggs, T.J.; Redman, J.R. Time of day variation in driving performance. Accid. Anal. Prev. 1997, 29, 431–437. [Google Scholar] [CrossRef]
- Williamson, A.; Lombardi, D.A.; Folkard, S.; Stutts, J.; Courtney, T.K.; Connorf, J.L. The link between fatigue and safety. Accid. Anal. Prev. 2011, 43, 498–515. [Google Scholar] [CrossRef] [PubMed]
- Grace, P.M.; Stanford, T.; Gentgall, M.; Rolan, P.E. Utility of saccadic eye movement analysis as an objective biomarker to detect the sedative interaction between opioids and sleep deprivation in opioid-naïve and opioid-tolerant populations. J. Psychopharmacol. 2010, 1631–1640. [Google Scholar] [CrossRef] [PubMed]
- Merat, N.; Jamson, A.H. The effect of three low-cost engineering treatments on driver fatigue: A driving simulator study. Accid. Anal. Prev. 2013, 50, 8–15. [Google Scholar] [CrossRef] [PubMed]
Figure 1.
Interval.
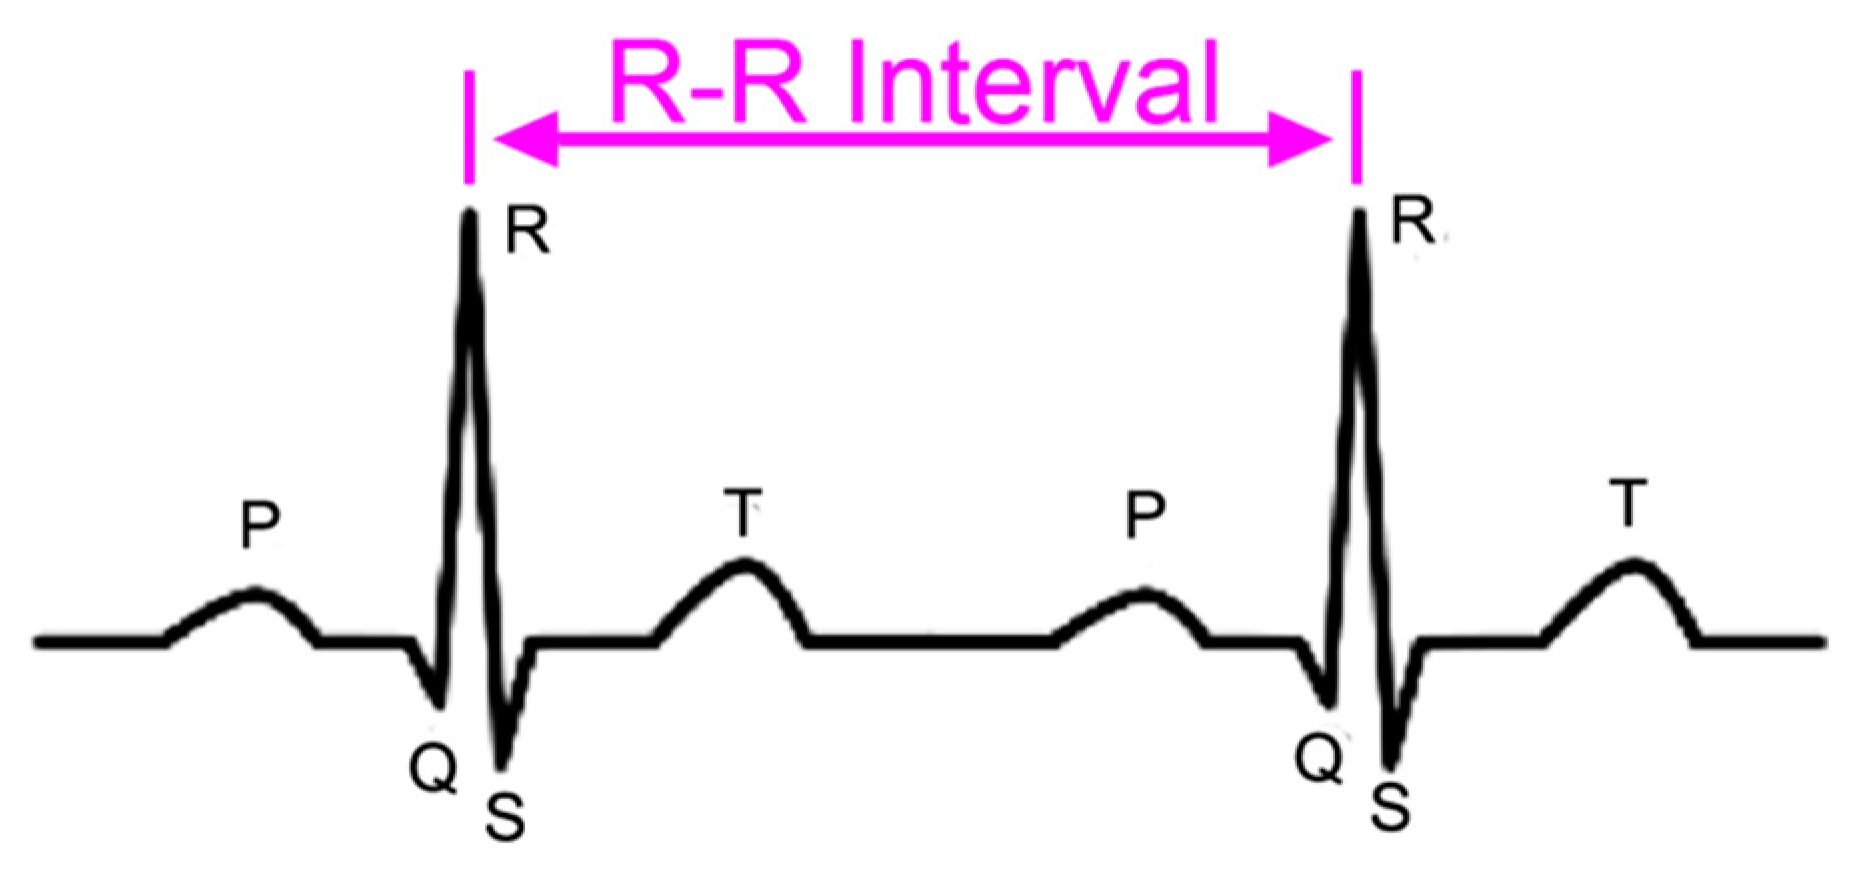
Figure 2.
The procedure for calculating the driving fatigue degree (DFD).

Figure 3.
DFC in 3000–3500 m.

Figure 4.
TDFD in 3000–3500 m.

Figure 5.
DFD in 3000–3500 m.
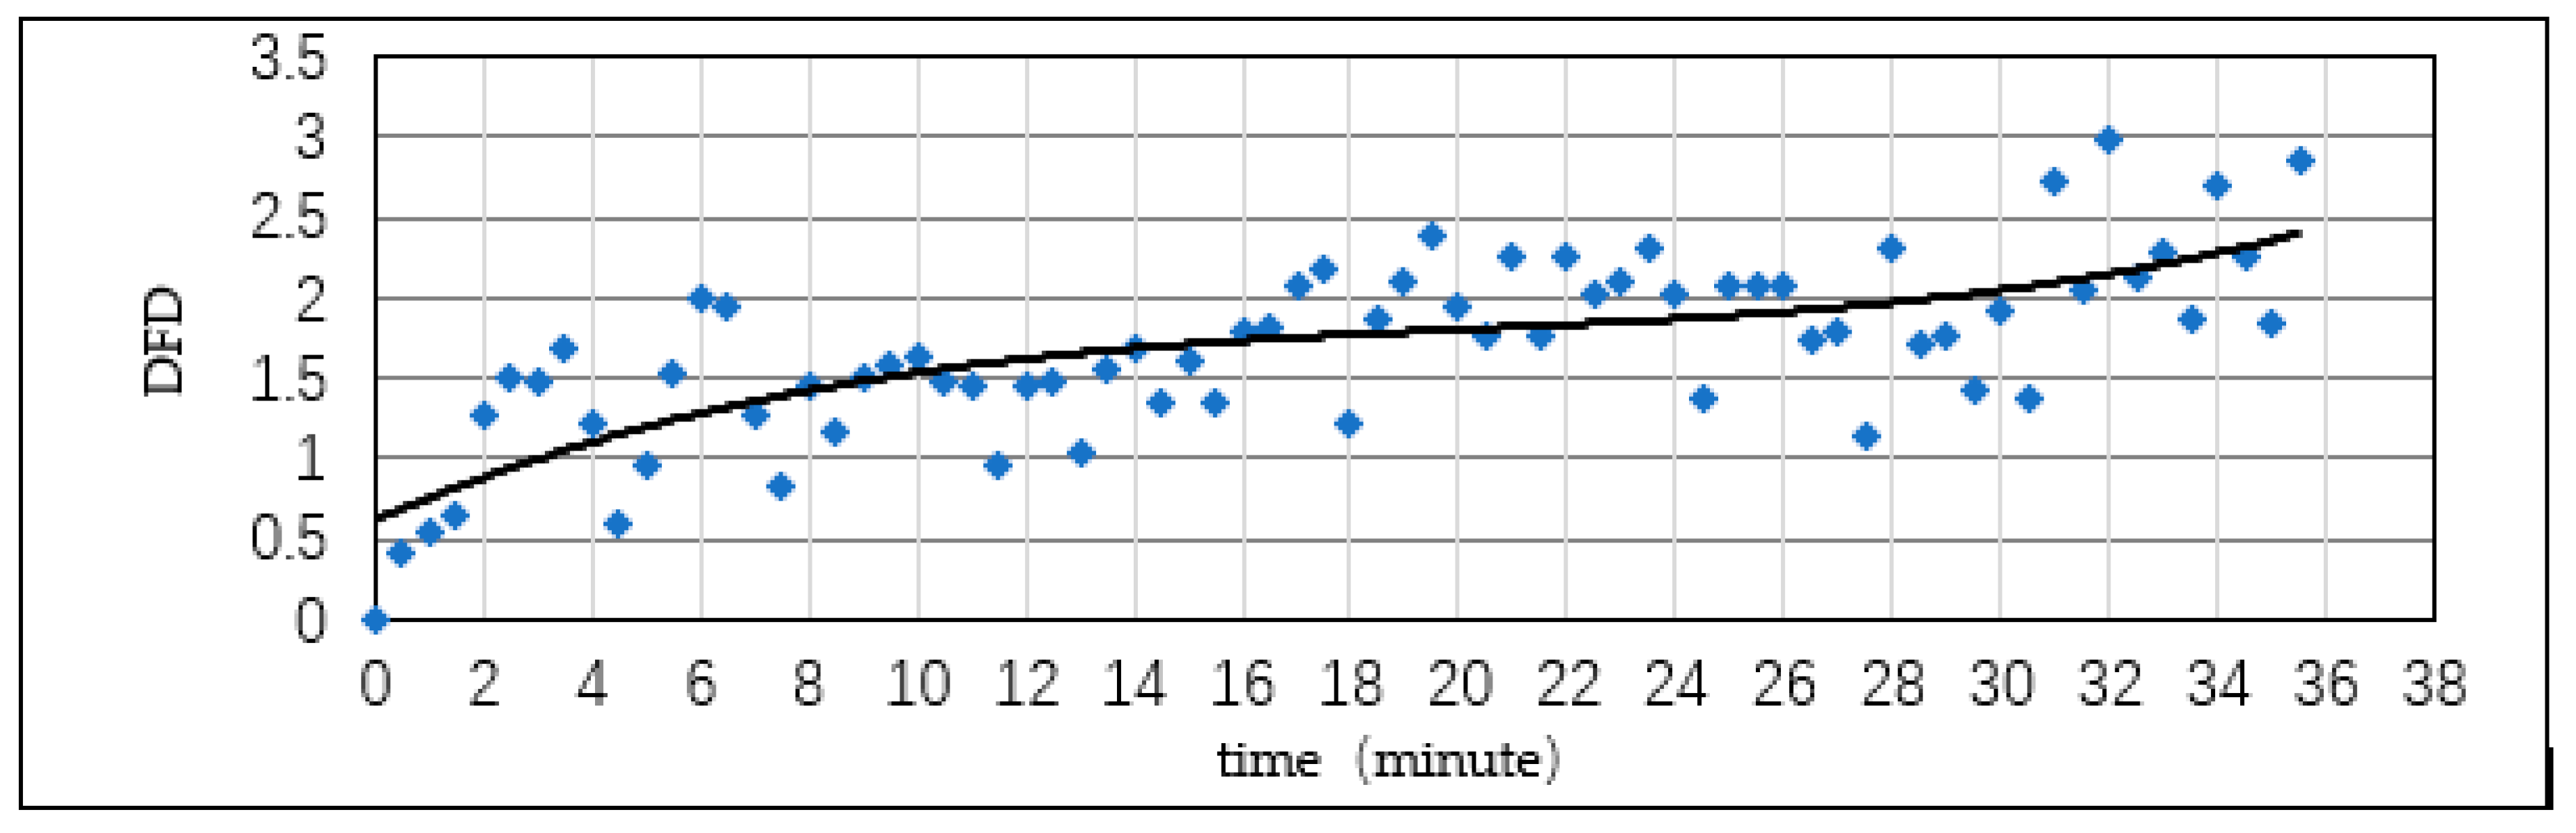
Figure 6.
Driver fatigue time with altitude variation.
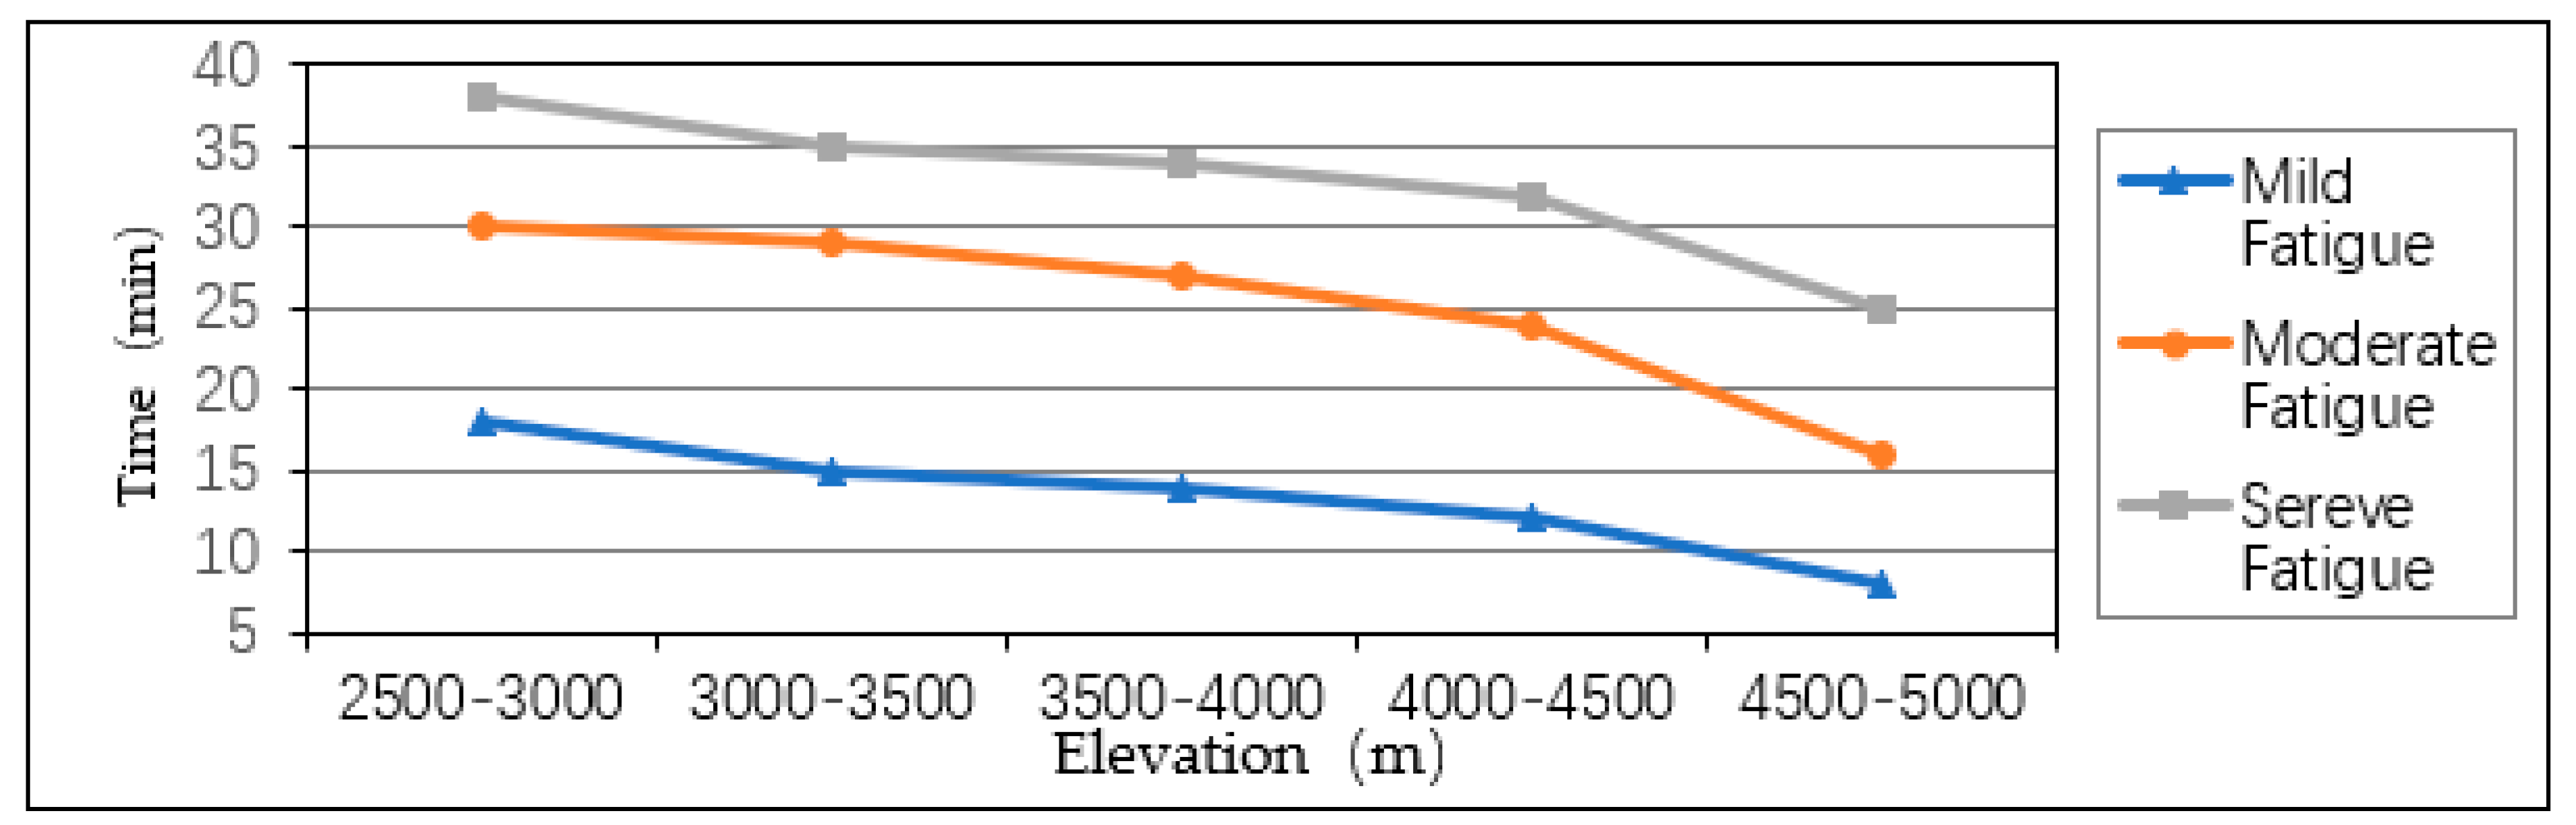
Figure 7.
TDFD with altitude variation.
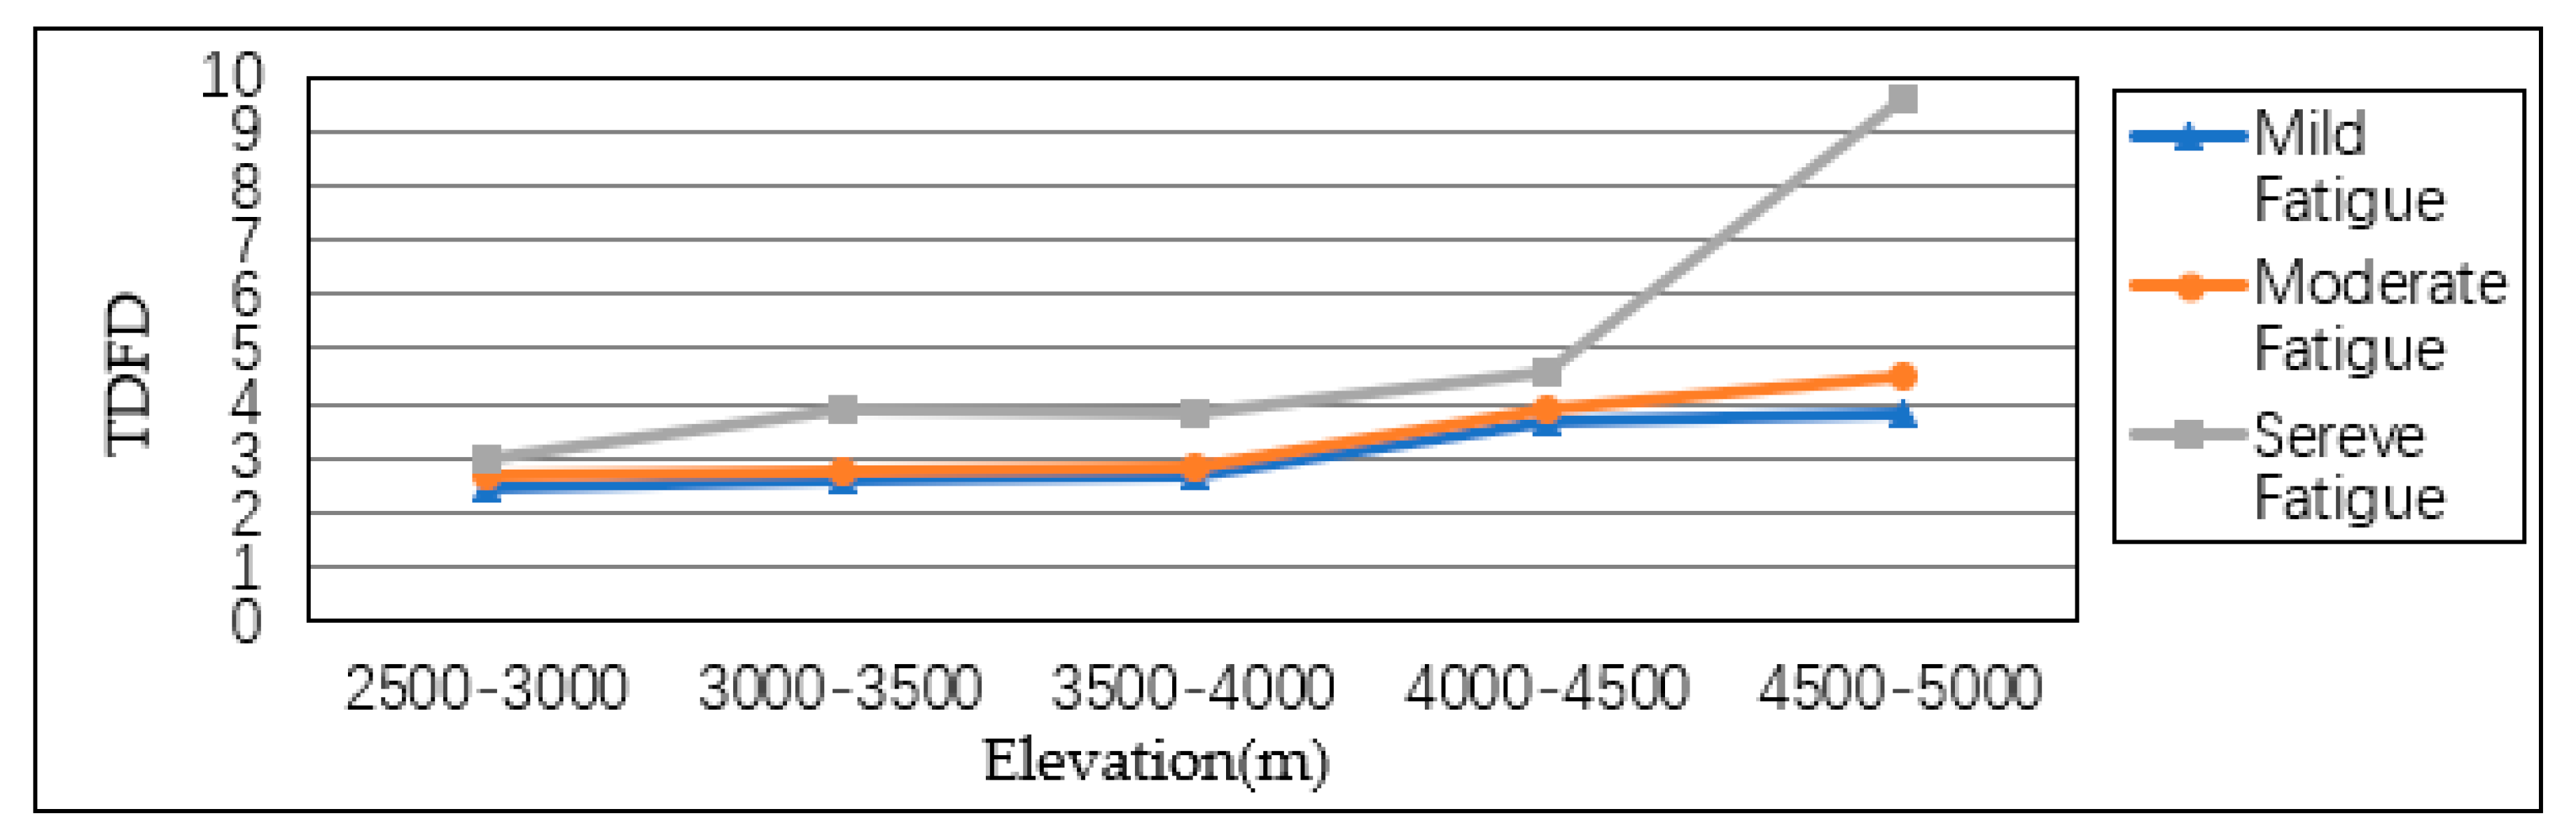
Figure 8.
TDFD with altitude variation.

Table 1.
Driver fatigue parameter statistics (3000–3500 m).
| Time (min) | SDNN (ms) | M (ms) | RRVC | DFC | TDFD | DFD | |
|---|---|---|---|---|---|---|---|
| Resting | 1.12199 | 556.8667 | 0.002015 | 0.003802 | |||
| Initial | 0 | 3.53244 | 607.2667 | 0.005817 | 0 | 1 | 0 |
| 0.5 | 4.36759 | 592.6 | 0.00737 | 0.001553 | 1.408526 | 0.408526 | |
| 1 | 4.55313 | 576.4 | 0.007899 | 0.002082 | 1.547673 | 0.547673 | |
| 1.5 | 4.82232 | 584.3333 | 0.008253 | 0.002436 | 1.640633 | 0.640633 | |
| 2 | 5.93392 | 559.8667 | 0.010599 | 0.004782 | 2.257709 | 1.257709 | |
| 2.5 | 6.48636 | 562.7667 | 0.011526 | 0.005709 | 2.501537 | 1.501537 | |
| 3 | 6.57991 | 576.4333 | 0.011415 | 0.005598 | 2.472348 | 1.472348 | |
| 3.5 | 6.98936 | 570.7667 | 0.012246 | 0.006429 | 2.690837 | 1.690837 | |
| 4 | 5.90353 | 563.1 | 0.010484 | 0.004667 | 2.227507 | 1.227507 | |
| 4.5 | 4.54404 | 564.2 | 0.008054 | 0.002237 | 1.588362 | 0.588362 | |
| 5 | 5.42461 | 570.4333 | 0.00951 | 0.003693 | 1.971234 | 0.971234 | |
| 5.5 | 6.62211 | 571.2 | 0.011593 | 0.005776 | 2.519287 | 1.519287 | |
| 6 | 7.66159 | 573.3 | 0.013364 | 0.007547 | 2.985012 | 1.985012 | |
| 6.5 | 7.51617 | 567.1667 | 0.013252 | 0.007435 | 2.955585 | 1.955585 | |
| 7 | 6.04176 | 566.2 | 0.010671 | 0.004854 | 2.276622 | 1.276622 | |
| 7.5 | 5.11487 | 569.6667 | 0.008979 | 0.003162 | 1.83159 | 0.83159 | |
| 8 | 6.59771 | 580.5667 | 0.011364 | 0.005547 | 2.459037 | 1.459037 | |
| 8.5 | 5.92607 | 576.7667 | 0.010275 | 0.004458 | 2.172446 | 1.172446 | |
| 9 | 6.65949 | 578.7667 | 0.011506 | 0.005689 | 2.496409 | 1.496409 | |
| 9.5 | 6.86635 | 578.5 | 0.011869 | 0.006052 | 2.591854 | 1.591854 | |
| 10 | 6.86885 | 571.5333 | 0.012018 | 0.006201 | 2.631059 | 1.631059 | |
| 10.5 | 6.63177 | 579 | 0.011454 | 0.005637 | 2.482597 | 1.482597 | |
| 11 | 6.51367 | 576.6 | 0.011297 | 0.00548 | 2.441264 | 1.441264 | |
| 11.5 | 5.37574 | 567.7667 | 0.009468 | 0.003651 | 1.960342 | 0.960342 | |
| 12 | 7.05363 | 621.6333 | 0.011347 | 0.00553 | 2.454479 | 1.454479 | |
| 12.5 | 6.92907 | 608.1667 | 0.011393 | 0.005576 | 2.466695 | 1.466695 | |
| 13 | 5.90466 | 604.3667 | 0.00977 | 0.003953 | 2.039715 | 1.039715 | |
| 13.5 | 6.73119 | 575.7667 | 0.011691 | 0.005874 | 2.544931 | 1.544931 | |
| 14 | 7.61524 | 622.0667 | 0.012242 | 0.006425 | 2.689858 | 1.689858 | |
| 14.5 | 6.86269 | 626.4 | 0.010956 | 0.005139 | 2.351595 | 1.351595 | |
| Mild fatigue | 15 | 7.20002 | 601.2333 | 0.011975 | 0.006158 | 2.619784 | 1.619784 |
| 15.5 | 6.35867 | 580.4333 | 0.010955 | 0.005138 | 2.351405 | 1.351405 | |
| 16 | 7.32496 | 581.7 | 0.012592 | 0.006775 | 2.782044 | 1.782044 | |
| 16.5 | 7.59014 | 598.8667 | 0.012674 | 0.006857 | 2.80357 | 1.80357 | |
| 17 | 8.44728 | 614.1667 | 0.013754 | 0.007937 | 3.087599 | 2.087599 | |
| 17.5 | 8.40259 | 597.5 | 0.014063 | 0.008246 | 3.168835 | 2.168835 | |
| 18 | 6.40334 | 614.7333 | 0.010416 | 0.004599 | 2.209745 | 1.209745 | |
| 18.5 | 7.67029 | 592.8333 | 0.012938 | 0.007121 | 2.873056 | 1.873056 | |
| 19 | 8.31485 | 600.6333 | 0.013843 | 0.008026 | 3.111118 | 2.111118 | |
| 19.5 | 8.98899 | 604.9 | 0.01486 | 0.009043 | 3.378562 | 2.378562 | |
| 20 | 8.01774 | 605.3 | 0.013246 | 0.007429 | 2.953944 | 1.953944 | |
| 20.5 | 7.54572 | 601.6 | 0.012543 | 0.006726 | 2.769004 | 1.769004 | |
| 21 | 8.45713 | 588.8333 | 0.014363 | 0.008546 | 3.247638 | 2.247638 | |
| 21.5 | 7.74697 | 617.2333 | 0.012551 | 0.006734 | 2.771205 | 1.771205 | |
| 22 | 8.80236 | 613.3667 | 0.014351 | 0.008534 | 3.24458 | 2.24458 | |
| 22.5 | 8.07429 | 596.9333 | 0.013526 | 0.007709 | 3.027692 | 2.027692 | |
| 23 | 8.33548 | 604.7 | 0.013784 | 0.007967 | 3.095604 | 2.095604 | |
| 23.5 | 8.85008 | 606 | 0.014604 | 0.008787 | 3.311176 | 2.311176 | |
| 24 | 8.03085 | 594.2667 | 0.013514 | 0.007697 | 3.02443 | 2.02443 | |
| 24.5 | 6.86269 | 622.0667 | 0.011032 | 0.005215 | 2.371668 | 1.371668 | |
| 25 | 8.20002 | 596.4 | 0.013749 | 0.007932 | 3.086322 | 2.086322 | |
| 25.5 | 8.25874 | 601.2333 | 0.013736 | 0.007919 | 3.082938 | 2.082938 | |
| 26 | 8.56897 | 625 | 0.01371 | 0.007893 | 3.076105 | 2.076105 | |
| 26.5 | 7.23012 | 581.7 | 0.012429 | 0.006612 | 2.739162 | 1.739162 | |
| 27 | 7.56987 | 598.8667 | 0.01264 | 0.006823 | 2.794667 | 1.794667 | |
| 27.5 | 6.23568 | 614.1667 | 0.010153 | 0.004336 | 2.140472 | 1.140472 | |
| 28 | 8.69875 | 597.5 | 0.014559 | 0.008742 | 3.299205 | 2.299205 | |
| 28.5 | 7.67029 | 624.7333 | 0.012278 | 0.006461 | 2.699291 | 1.699291 | |
| Moderate fatigue | 29 | 7.41353 | 592.8333 | 0.012505 | 0.006688 | 2.759141 | 1.759141 |
| 29.5 | 6.49698 | 580.5667 | 0.011191 | 0.005374 | 2.413402 | 1.413402 | |
| 30 | 7.56523 | 576.7667 | 0.013117 | 0.0073 | 2.919942 | 1.919942 | |
| 30.5 | 6.36526 | 578.7667 | 0.010998 | 0.005181 | 2.362696 | 1.362696 | |
| 31 | 9.35698 | 578.5 | 0.016175 | 0.010358 | 3.724239 | 2.724239 | |
| 31.5 | 7.75412 | 571.5333 | 0.013567 | 0.00775 | 3.03846 | 2.03846 | |
| 32 | 9.95478 | 579 | 0.017193 | 0.011376 | 3.992124 | 2.992124 | |
| 32.5 | 8.00236 | 576.6 | 0.013879 | 0.008062 | 3.120339 | 2.120339 | |
| 33 | 8.22125 | 567.7667 | 0.01448 | 0.008663 | 3.278532 | 2.278532 | |
| 33.5 | 7.40012 | 572.6333 | 0.012923 | 0.007106 | 2.869007 | 1.869007 | |
| 34 | 9.62568 | 597.1667 | 0.016119 | 0.010302 | 3.709604 | 2.709604 | |
| 34.5 | 8.95269 | 620.1667 | 0.014436 | 0.008619 | 3.266949 | 2.266949 | |
| 35 | 8.00325 | 623.1667 | 0.012843 | 0.007026 | 2.847941 | 1.847941 | |
| Severe fatigue | 35.5 | 10.35269 | 620.0667 | 0.016696 | 0.010879 | 3.861413 | 2.861413 |
Table 2.
Correlations between DFC and T.
| T | DFC | ||
|---|---|---|---|
| T | Pearson Correlation | 1 | 0.699 ** |
| Sig. (2-tailed) | 0.001 | ||
| N | 71 | 71 | |
| DFC | Pearson Correlation | 0.699 ** | 1 |
| Sig. (2-tailed) | 0.001 | ||
| N | 71 | 71 | |
** Correlation is significant at the 0.01 level (2-tailed).
Table 3.
Correlations between DFD and T.
| T | DFD | ||
|---|---|---|---|
| T | Pearson Correlation | 1 | 0.651 ** |
| Sig. (2-tailed) | 0.001 | ||
| N | 71 | 71 | |
| DFD | Pearson Correlation | 0.651 ** | 1 |
| Sig. (2-tailed) | 0.001 | ||
| N | 71 | 71 | |
** Correlation is significant at the 0.01 level (two-tailed).
Table 4.
Correlations between TDFD and T.
| T | DFD | ||
|---|---|---|---|
| T | Pearson Correlation | 1 | 0.658 ** |
| Sig. (2-tailed) | 0.001 | ||
| N | 71 | 71 | |
| TDFD | Pearson Correlation | 0.658 ** | 1 |
| Sig. (2-tailed) | 0.001 | ||
| N | 71 | 71 | |
** Correlation is significant at the 0.01 level (2-tailed).
Table 5.
Initial time of driver fatigue of different levels.
| Time (min) | Initial Time of Driver Fatigue of Different Levels | |||
|---|---|---|---|---|
| Elevation (m) | Mild Fatigue | Moderate Fatigue | Severe Fatigue | |
| 2500–3000 | 18 | 30 | 38 | |
| 3000–3500 | 15 | 29 | 35 | |
| 3500–4000 | 14 | 27 | 34 | |
| 4000–4500 | 12 | 24 | 32 | |
| 4500–5000 | 8 | 20 | 25 | |
© 2019 by the authors. Licensee MDPI, Basel, Switzerland. This article is an open access article distributed under the terms and conditions of the Creative Commons Attribution (CC BY) license (http://creativecommons.org/licenses/by/4.0/).
Share and Cite
MDPI and ACS Style
Duan, Z.; Xu, J.; Ru, H.; Li, M. Classification of Driving Fatigue in High-Altitude Areas. Sustainability 2019, 11, 817. https://doi.org/10.3390/su11030817
AMA Style
Duan Z, Xu J, Ru H, Li M. Classification of Driving Fatigue in High-Altitude Areas. Sustainability. 2019; 11(3):817. https://doi.org/10.3390/su11030817
Chicago/Turabian StyleDuan, Zhihao, Jinliang Xu, Han Ru, and Menghui Li. 2019. "Classification of Driving Fatigue in High-Altitude Areas" Sustainability 11, no. 3: 817. https://doi.org/10.3390/su11030817
Note that from the first issue of 2016, this journal uses article numbers instead of page numbers. See further details here.