Sustainability Implications of the Incorporation of a Biogas Trapping System into a Conventional Crude Palm Oil Supply Chain


1
Faculty of Engineering and Science, Curtin University Malaysia, Sarawak 98009, Malaysia
2
Sustainable Engineering Group, Curtin University, Perth, WA 6845, Australia
*
Author to whom correspondence should be addressed.
†
These authors contributed equally to this work.
Sustainability 2019, 11(3), 792; https://doi.org/10.3390/su11030792
Submission received: 25 December 2018
/
Revised: 29 January 2019
/
Accepted: 30 January 2019
/
Published: 2 February 2019
(This article belongs to the Special Issue Sustainable Materials and Manufacturing)
Abstract
:This paper presents the sustainability implications of installing biogas trapping systems in palm oil mills of a crude palm oil production supply chains in Malaysia. The study evaluates the impact of this mitigation strategy on the existing supply chains published by Lim and Biswas. The experience of a local palm oil mill installed with the KUBOTA biogas trapping system was incorporated into a typical 60 metric tonne per hour palm oil mill for effluent treatment. This allowed us to assess the changes in sustainability performance of the whole crude palm oil supply chain using the Palm Oil Sustainability Assessment (POSA) framework. Installing the biogas trapping system increased waste recycling and reuse percentage of the mill from 81.81% to 99.99% and the energy ratio (energy output/fossil fuel and biomass energy input) from 2.45 to 2.56; and reduced the Greenhouse Gas emission of the supply chain from 0.814 tonne CO2eq to 0.196 tonne CO2eq per tonne of Crude Palm Oil. This system could also potentially increase the mill’s annual revenue by 2.3%, while sacrificing the sustainability performance of other economic indicators (i.e., a further 3% negative deviation of actual growth rate from sustainable growth rate). Overall, sustainability score of the supply chain improved from 3.47/5 to 3.59/5 on the 5-level-Likert-scale due to environmental improvement strategy consideration. Finally, this paper shows that the POSA framework is capable of capturing changes in the sustainability performance of triple bottom line indicators associated with the use or incorporation of any improvement strategy in the crude palm oil supply chain.
1. Introduction
The full-fledged production of palm oil in Malaysia began in the 1980s. It has since become one of the most important sectors in the country’s economic development. Whilst the industry creates job opportunities, enriches businesses (small, medium, and large), empowers local smallholders, and revives small and rural townships [1,2], it has significantly changed the country’s landscape, by replacing forests and farmland with a large-scale monoculture plantation [3,4]. The lack of or absence of consultation and dialogue between producers and the local people has resulted in social conflicts [5]. Palm oil production has recently received worldwide criticism due to its increased environmental footprint at different stages of the supply chain. Apart from the ‘devastating impacts’ [6] on forests and species, another major environmental impact is greenhouse gas (GHG) emissions from the application of considerable amounts of synthetic fertilizer, and aerobic digestion of large volumes of palm oil mill effluent (POME) [7,8]
POME is waste water produced from the crude palm oil production process. Raw POME has low pH (4–5), a high temperature 60 °C–70 °C, a high Biochemical Oxygen Demand (BOD) of ~32,000 mg/L, a high Chemical Oxygen Demand (COD) of ~62,000 mg/L, suspended solids of 5000–54,000 mg/L, and total nitrogen of 600–1000 mg/L [9,10], compared to the acceptable limit set by the Malaysian Department of Environment (DOE). For every processed tonne of fresh fruit bunches (FFB), 0.7–1.0 m3 of raw POME is generated [11]. Hence, a typical 60 MT/hr palm oil mill would generate about 300,000 m3 POME waste per year, resulting an annual GHG emission of 37,000–52,000 tonnes of CO2eq.
Madaki and Lau [12] described POME as ‘the most expensive and difficult waste to manage’ due to handling, storage, and treatment reasons. In order to meet the Department of Environment (DOE) water quality standards, more than 85% of palm oil mills use ponding systems (Ponding system employs biological methods, e.g., waste stabilization lagoons and oxidation (aerobic, anaerobic, facultative, maturation) ponds for wastewaters treatment. It is also used as sedimentation ponds for sludge or suspended solid settlement [13]) to treat raw POME [13,14] before it is discharged to water bodies. Whilst this ponding system is the most conventional and relatively cheaper treatment option, it has a large land footprint (about 5 hectares for a 60 MT/hr mill) and carbon footprint (i.e., 33.6 m3 of methane per tonne of crude palm oil production through aerobic digestion) [15]. Methane is 28 times more powerful than carbon dioxide to produce global warming impact [16]. This open-space treatment also causes public nuisance as POME releases intolerable odor into the surrounding community.
To reduce the aforementioned environmental impacts associated with conventional POME treatments, the Malaysian Palm Oil Board (MPOB) has introduced new regulations that came into effect in January 2014. According to this regulation, all new palm oil mills, and existing mills that had already applied to throughput expansion, must include a ‘full biogas trapping or methane avoidance facilities’ [17], i.e., biogas digester (i.e., an anaerobic digestion process where methane is generated in the absence of oxygen) in the plant’s design. The regulation also requires the mills that were built before January 2014 to upgrade with ‘full biogas trapping or methane avoidance facilities’ by 2020. Non-compliance with the regulation would risk the business losing its license to operate the mill [18]. This regulation has in fact increased the investment cost for mill owners. It is difficult to offset this incremental cost as the downstream supply chain of biogas markets is lacking [19].
Despite the resistance from stakeholders in the palm oil supply chain, the Malaysian government had introduced this new regulation to reduce the environmental impact of palm oil production. The enforcement of full biogas trapping, or methane avoidance facilities, in palm oil industries is in fact one of the eight Entry Point Projects under National Key Economic Area, with an aim to improve the sustainability performance in the palm oil sector [17].
Recent research carried out overseas showed that biogas capture from POME could deliver significant environmental benefits. Stichnothe and Schuchardt [20] carried out a life cycle assessment (LCA) to compare four types of palm oil waste management practices, including dumping Empty Fruit Bunches (EFB) and storing POME in ponding systems; using EFB in palm oil plantation and POME in ponding system; using EFB and POME for co-composting for plantation; and biogas generation from POME. The results indicated that GHG emissions from palm oil mill waste can be significantly reduced by 98% via converting methane to biogas. Besides, Nasution, et al. [21] compared open lagoon POME treatment with combinations of open lagoon technology (COLT) consisting of composting and COLT-Biogas systems in Indonesia. The study found that by replacing the open lagoon POME treatment with the COLT system could reduce GHG emissions by 357.18 kg CO2eq. These results agree with findings in other studies [22,23], where the biogas trapping system as a POME waste treatment solution were found to significantly reduce overall GHG emissions of crude palm oil supply chains. These studies, however, mainly used life cycle assessment to estimate the GHG saving potential of biogas plants in palm oil supply chains, therefore, there exists a gap in terms of assessing other critical environmental indicators as well as economic and societal impacts. Besides, system boundaries of these studies are limited to processes during the production stage in palm oil mills, and they do not consider other stages in the entire supply chain, i.e., nursery and plantation stages.
The authors of this paper, Lim and Biswas, recently developed a POSA framework specifically for holistic sustainability assessment of crude palm oil production throughout its supply chain [24,25]. This framework was subsequently applied to assess the environmental, economic, and social sustainability implications of the most common crude palm oil supply chain of 60 MT/hr located in the Borneo Island of Malaysia [26]. They found that the overall sustainability performance of this palm oil supply chain is 1.53 points below the sustainability threshold (i.e., 3.47/5), because improvements are required in terms of GHG emissions reduction, smallholder equity enhancement, biomass waste recycling and recovery, plantation practice, as well as average wages and local employment [26]. Opportunities could exist for improving some of these indicators by complying with the government’s new regulation for biogas digester installation in palm oil mills. The palm oil mill in this supply chain did not have a biogas trapping system. Thus, study’s challenge was to find out the sustainability implications of incorporating a biogas trapping system into this existing crude palm oil supply chain. This allowed us to investigate the flexibility of the POSA framework in assessing changes to the supply chain when mitigation strategies are implemented.
Thus, this paper intends to evaluate:
- The environmental, economic, and social sustainability performance of incorporating a biogas trapping system into a typical crude palm oil supply chain.
- The level of improvement it would bring to the overall sustainability performance of crude palm oil production in Malaysia.
- The flexibility of the POSA framework [25] in responding the changes in technology and strategies in the supply chain.
2. Methodology
This research used the POSA framework to assess sustainability implications of incorporating a biogas trapping system into the palm oil mill of a crude palm oil supply chain. A previous study conducted by the authors Lim and Biswas [26], on the most common 60MT/hr crude palm oil supply chain in Borneo Island of Malaysia, was used as a baseline for comparison. The current paper utilized raw or primary data of this 60MT/hr crude palm oil supply chain, as this research is a follow up investigation into previously published work [26].
Secondly, a KUBOTA biogas cum polishing plant (BGPP) was considered for incorporation as an improvement strategy. Accordingly, site-specific data was collected from this BGPP to investigate changes in crude palm oil supply chain sustainability performance associated with the installation of a similar BGPP in the 60 MT/hr palm oil mill. Primary data were collected from BGPP by obtaining site operational data records, interviewing stakeholders in the supply chain, and conducting surveys with local people to gather their collective feedback. Primary data were compiled and processed to determine performance measures of the environmental, economic, and social sustainability objectives of the POSA framework.
Figure 1 shows the systems boundary of a baseline crude palm oil supply chain consisting of input and output data, in order to calculate triple bottom line indicators and to show the interaction between stakeholders across this supply chain. In the comparative study, KUBOTA BGPP replaced the POME pond (Figure 2).
Thirdly, the ranking value of each Performance Measures (PM), Key Performance Indicator (KPI), Higher Performance Indicator (HPI), and overall sustainability of the supply chain with the biogas trapping system were assessed using the POSA framework [24,25,27]. Each PM was ranked on a 1–5 Likert scale, according to the pre-defined ranking criteria, where level 5 is the sustainability threshold. The sustainability gap referred to the difference between threshold value of sustainability (5) and the rank of the corresponding indicator (i.e., between 1–5), based on the quantitative site data or feedback given by the respondents in the supply chain. Each PM had a distributed weighting factor determined by the stakeholders through collective feedback on its level of importance according to Lim and Biswas [25]. The ranking value of PMs under a KPI was aggregated into the score of this KPI, and the score of KPIs under a HPI was aggregated into the score of this HPI. The overall sustainability score for the supply chain was the aggregated value of HPI scores under environment, economic, and social objectives. Lastly, the triple bottom line indicators of both crude palm oil supply chains, with and without a BGPP, were compared to assess the level of improvement in sustainability performance.
3. Review of the Baseline Crude Palm Oil Supply Chain
Inventory of the baseline crude palm oil supply chain by Lim and Biswas [26] was reviewed and revised (Figure 1). Most assumptions made in the previous study were retained except for a few, which were slightly revised to improve accuracy of the results as follows:
- For every tonne of FFB processed, 0.7–1.0 m3 of raw POME is generated [11]; in this study 0.8 m3 POME per tonne FFB was used.
- Density of POME is 0.876 tonne/m3 [28](assumptions i and ii were used to calculate the amount of POME generated in this study, i.e., 0.7008 tonne of POME per tonne of FFB processed. In Lim and Biswas [26], one tonne of POME is assumed to be generated from every tonne of FFB processed, which was a less conservative estimate)
- Five tonnes of water are consumed for every tonne of CPO produced, and more than 50% of water consumed is discharged as POME [29,30](assumption iii considers water loss along the palm oil mill processes, i.e., leakages, steam release, vents, etc. in addition to water discharged as POME for total water consumption. Lim and Biswas [26] did not consider this water loss throughout the milling process in calculating the water consumption)
4. The KUBOTA Biogas and Polishing Plant
The KUBOTA BGPP consisting of Anaerobic Membrane Bioreactor (AnMBR) and Polishing Plant with Membrane Bioreactor (MBR) that are considered in this case study are shown in Figure 2 and Figure 3.
The biogas plant used raw POME from palm oil mills as slurry to produce biogas at the rate of 30 Nm3 per tonne of POME. The methane content of biogas generated from POME is 62.55% [9]. This biogas was sold to the neighboring brick factory, which is excluded from the system boundary of this study due to the fact that the biogas was regenerated from waste, and the combustion of biogas or the technology considered at a brick factory is not an outcome of the crude palm oil production process. In addition, capital equipment are usually excluded in life cycle assessment [31].
Permeate/digested slurry from the biogas plant is further treated in the polishing plant before the waste water (final discharge) is released to the river. This system was designed to achieve a BOD effluent of <20 mg/L, total nitrogen <100 mg/L, suspended solid <10 mg/L, and temperature <45 °C [10], which complies with DOE’s requirements.
Digested slurry from the biogas and polishing plants is discharged to the sludge pond, where the dewatering process takes place to produce a solid decanter that could be used as fertilizer in palm oil plantations. Filtrate/supernatant liquid from the sludge ponds is returned to the polishing plant for further treatment.
The use of this biogas trapping plant with a conventional open ponding system significantly reduces the amount of land from 5 hectares to 1.5 hectares for waste management purposes [32], associated with the release of an unpleasant odor. The BGPP uses membrane processes, which require minimum maintenance such as periodic cleaning and servicing. These processes are fully automated, as it only requires a few operators that could be sourced locally.
Apart from the aforementioned field information, following technical assumptions were considered when determining PMs under the POSA framework.
5. Sustainability Implications of Incorporating a Biogas Plant
Sustainability implications of incorporating a biogas trapping system into the crude palm oil supply chain was assessed using the POSA framework. Table 1 shows the data on the sustainability performance measures of crude palm oil supply chains with and without the biogas trapping system.
5.1. Environmental Sustainability Performance Measures
Out of nine PMs under the environmental objectives, four PMs, i.e., PM1.1.1—GHG Emission; PM1.2.2—biological oxygen demand of water discharged from POME pond; PM 1.3.1—percentage of biomass waste recovered or recycled; and PM 1.5.2—Energy (fossil fuel and biomass) consumption intensity (output/Input energy ratio) were improved due to the incorporation of a BGPP.
PM1.1.1—GHG Emission—in the case of baseline crude palm oil supply chain without the biogas trapping system, an estimated 208,352 tonnes of POME were generated due to the production of 65,277 tonnes of CPO per year. The discharge of this POME to existing open ponding systems releases ~1439 tonnes of methane gas (i.e., 40,287 tonnes CO2eq [16]) per year, accounting for ~76% of the supply chain GHG emissions (Table 2).
FFB production was the second largest emitter of GHG after POME. It was found that large plantations that contribute to 90% equity emitted less GHG for FFB production (i.e., 36.7 kgCO2eq) than the smallholders’ plantations that contributed to 10% of the equity in the supply chain (i.e., 49.55 kgCO2eq), due to the use of efficient machinery, and fertilizer management practices [36]. In addition, large plantations have skilled manpower and management systems to optimize its operation. This research estimated that the incorporation of a BGPP into the palm oil mill of supply chains could significantly reduce GHG emissions by 75.9% mainly due to the complete elimination of methane from POME. There was, however, a release of negligible amounts of GHG (i.e., 0.05% of total emission) from this plant due to the use of chemicals in membrane cleaning processes in BGPP.
PM1.2.2—biological oxygen demand of water discharged from POME ponds—the POME treatment, using conventional ponding system, in the current analysis met the DOE’s requirement for BOD of waste water discharge <100 mg/L. This was because the BGPP system could further reduce the BOD to a level below 20 mg/L. However, the use of this open ponding system during the time of flood is risky, as POME could overflow and pollute fresh water in surrounding areas. Since POME is enclosed in the biogas trapping plant, it eliminates the risks associated with water and ground pollution in the event of a flood.
PM 1.3.1—percentage of biomass waste recovered or recycled—biomass waste generated from the mill is equal to the mass of FFB minus the mass of main products, i.e., crude palm oil and palm kernel. Biomass waste, in the form of EFB and mesocarp fiber, contains useful materials and energy that could be recovered. The recovery processes in the existing system of palm oil mill use most of these biomass wastes (82%) for palm kernel shell, bio-fertilizer production, and energy generation. Part of this biomass waste is used as fuel in the boiler to generate steam for the milling process. The ash generated due to combustion of this waste for energy generation was purchased by the neighboring cement factory for its use as a partial replacement of cement in concrete [37]. This ash was also used as a substitute for potassium organic fertilizer [38]. The rate of recovery or recycling of biomass waste (i.e., PM 1.3.1) could increase due to the introduction of this biogas trapping system.
Of the biomass waste (i.e., 39,878 tonnes per year) generated from the palm oil mill in the existing supply chain, 18% is unrecoverable and is discharged in the form of POME. The installation of a biogas trapping plant in the system converts this unused biomass waste that exists in POME into methane for energy generation. Figure 4 shows that the biomass waste recovery in palm oil mills increased from 82% to 99.99% due to the use of the biogas trapping system. Only a small portion of biomass waste was unrecovered in this new system, which is the suspended solid in the final discharge/effluent (i.e., about 0.001% of the final discharge, <10 mg/L).
Biogas generated from the KUBOTA BGPP was used by the neighboring brick factory and formed an industrial symbiotic relationship. This biogas could alternatively be used in situ to supplement the energy needed at the mill’s steam boiler and reduce demand for mesocarp fiber. This saved mesocarp fiber could then either be sold as a fuel to other industries or be further processed into fertilizer. This is because the transportation of mesocarp fiber by trucks could be more convenient than delivering gas through a complex pipe network to meet the energy demands of downstream customers in isolated locations, where these palm oil mills are located.
PM 1.5.2—energy (fossil fuel and biomass) consumption intensity (output/input energy ratio)—the biogas trapping system traps 3,909,732 m3 methane gas per year for a 60 MT/hr mill, which is equivalent to 145 TJ of energy. This increases the total energy output from the crude palm oil supply chain by 4.6%. Therefore, PM 1.5.2, which is measured in terms of output/input energy ratio increased from 2.45 to 2.56. Although the energy output/input ratio is low (rank at level 1/5), it is worth noting that 96.9% of the energy input to the supply chain that mainly generates steam in the milling process, comes from biomass waste recovered from the supply chain. This conserves 7233 tonnes equivalent of coal (assuming coal heating value of 20 MJ/kg) for the future generation and thereby, enhances intergenerational social equity. Fossil fuel consumption for machinery at nurseries and plantations, for transportation and diesel generators at palm oil mills amounted to 3.1% of the total energy input of the supply chain. In this case, fossil fuel consumption remained unchanged with the introduction of BGPP, as the biogas produced was considered to be sold to the neighbor brick factory through an industrial symbiotic process.
5.2. Economic Sustainability Performance Measures
BGPP instillation requires a capital investment of USD 2.9 million (RM11.6 million) and an operational expenditure of USD 0.12 million (RM 0.48 million) per year, for an investment period of 16 years [39]. Biogas supply to the neighboring plant could increase the mill’s annual revenue by RM 4.52 million (consider RM 33 per MMBtu [40]) by selling this to the neighboring brick factory. Hence, the profit was estimated to be RM 4.04 million per year with a payback period of 2.87 years (Assuming 1USD = RM4).
PM2.2.1—deviation of actual growth rate (AGR) from sustainability growth rate (SGR) evaluates if the palm oil mill’s growth is healthy for long term business continuity and resiliency. Growing too fast (i.e., a positive deviation) or too slow (i.e., a negative deviation) are both not economically sustainable for the business [41,42]. A positive deviation of AGR from SGR means that the business cannot be sustained without additional borrowing, and a negative deviation means the business is underperforming considering the assets and cash it has in hand.
The additional investment on this environmental mitigation strategy increased the profit and revenue but also increased the value of assets and debts. Table 3 compares the financial status of the palm oil mill before and after one year of BGPP investment. The introduction of BGPP increased the sustainable growth rate of the palm oil mill, i.e., the maximum growth rate that the mill can sustain without having to increase financial leverage from 10% to 16% due to the higher return on equity and business retention rate. AGR of the palm oil mill increased from 6% to 9% due to the higher recent sale figures, with additional revenue generated from selling the biogas. An increase in growth due to the introduction of BGPP seems to have a positive impact on the supply chain, but it leads to a larger deviation of actual growth rate from sustainable growth rate of −4% to −7%, hence causing a negative economic impact to PM 2.2.1.
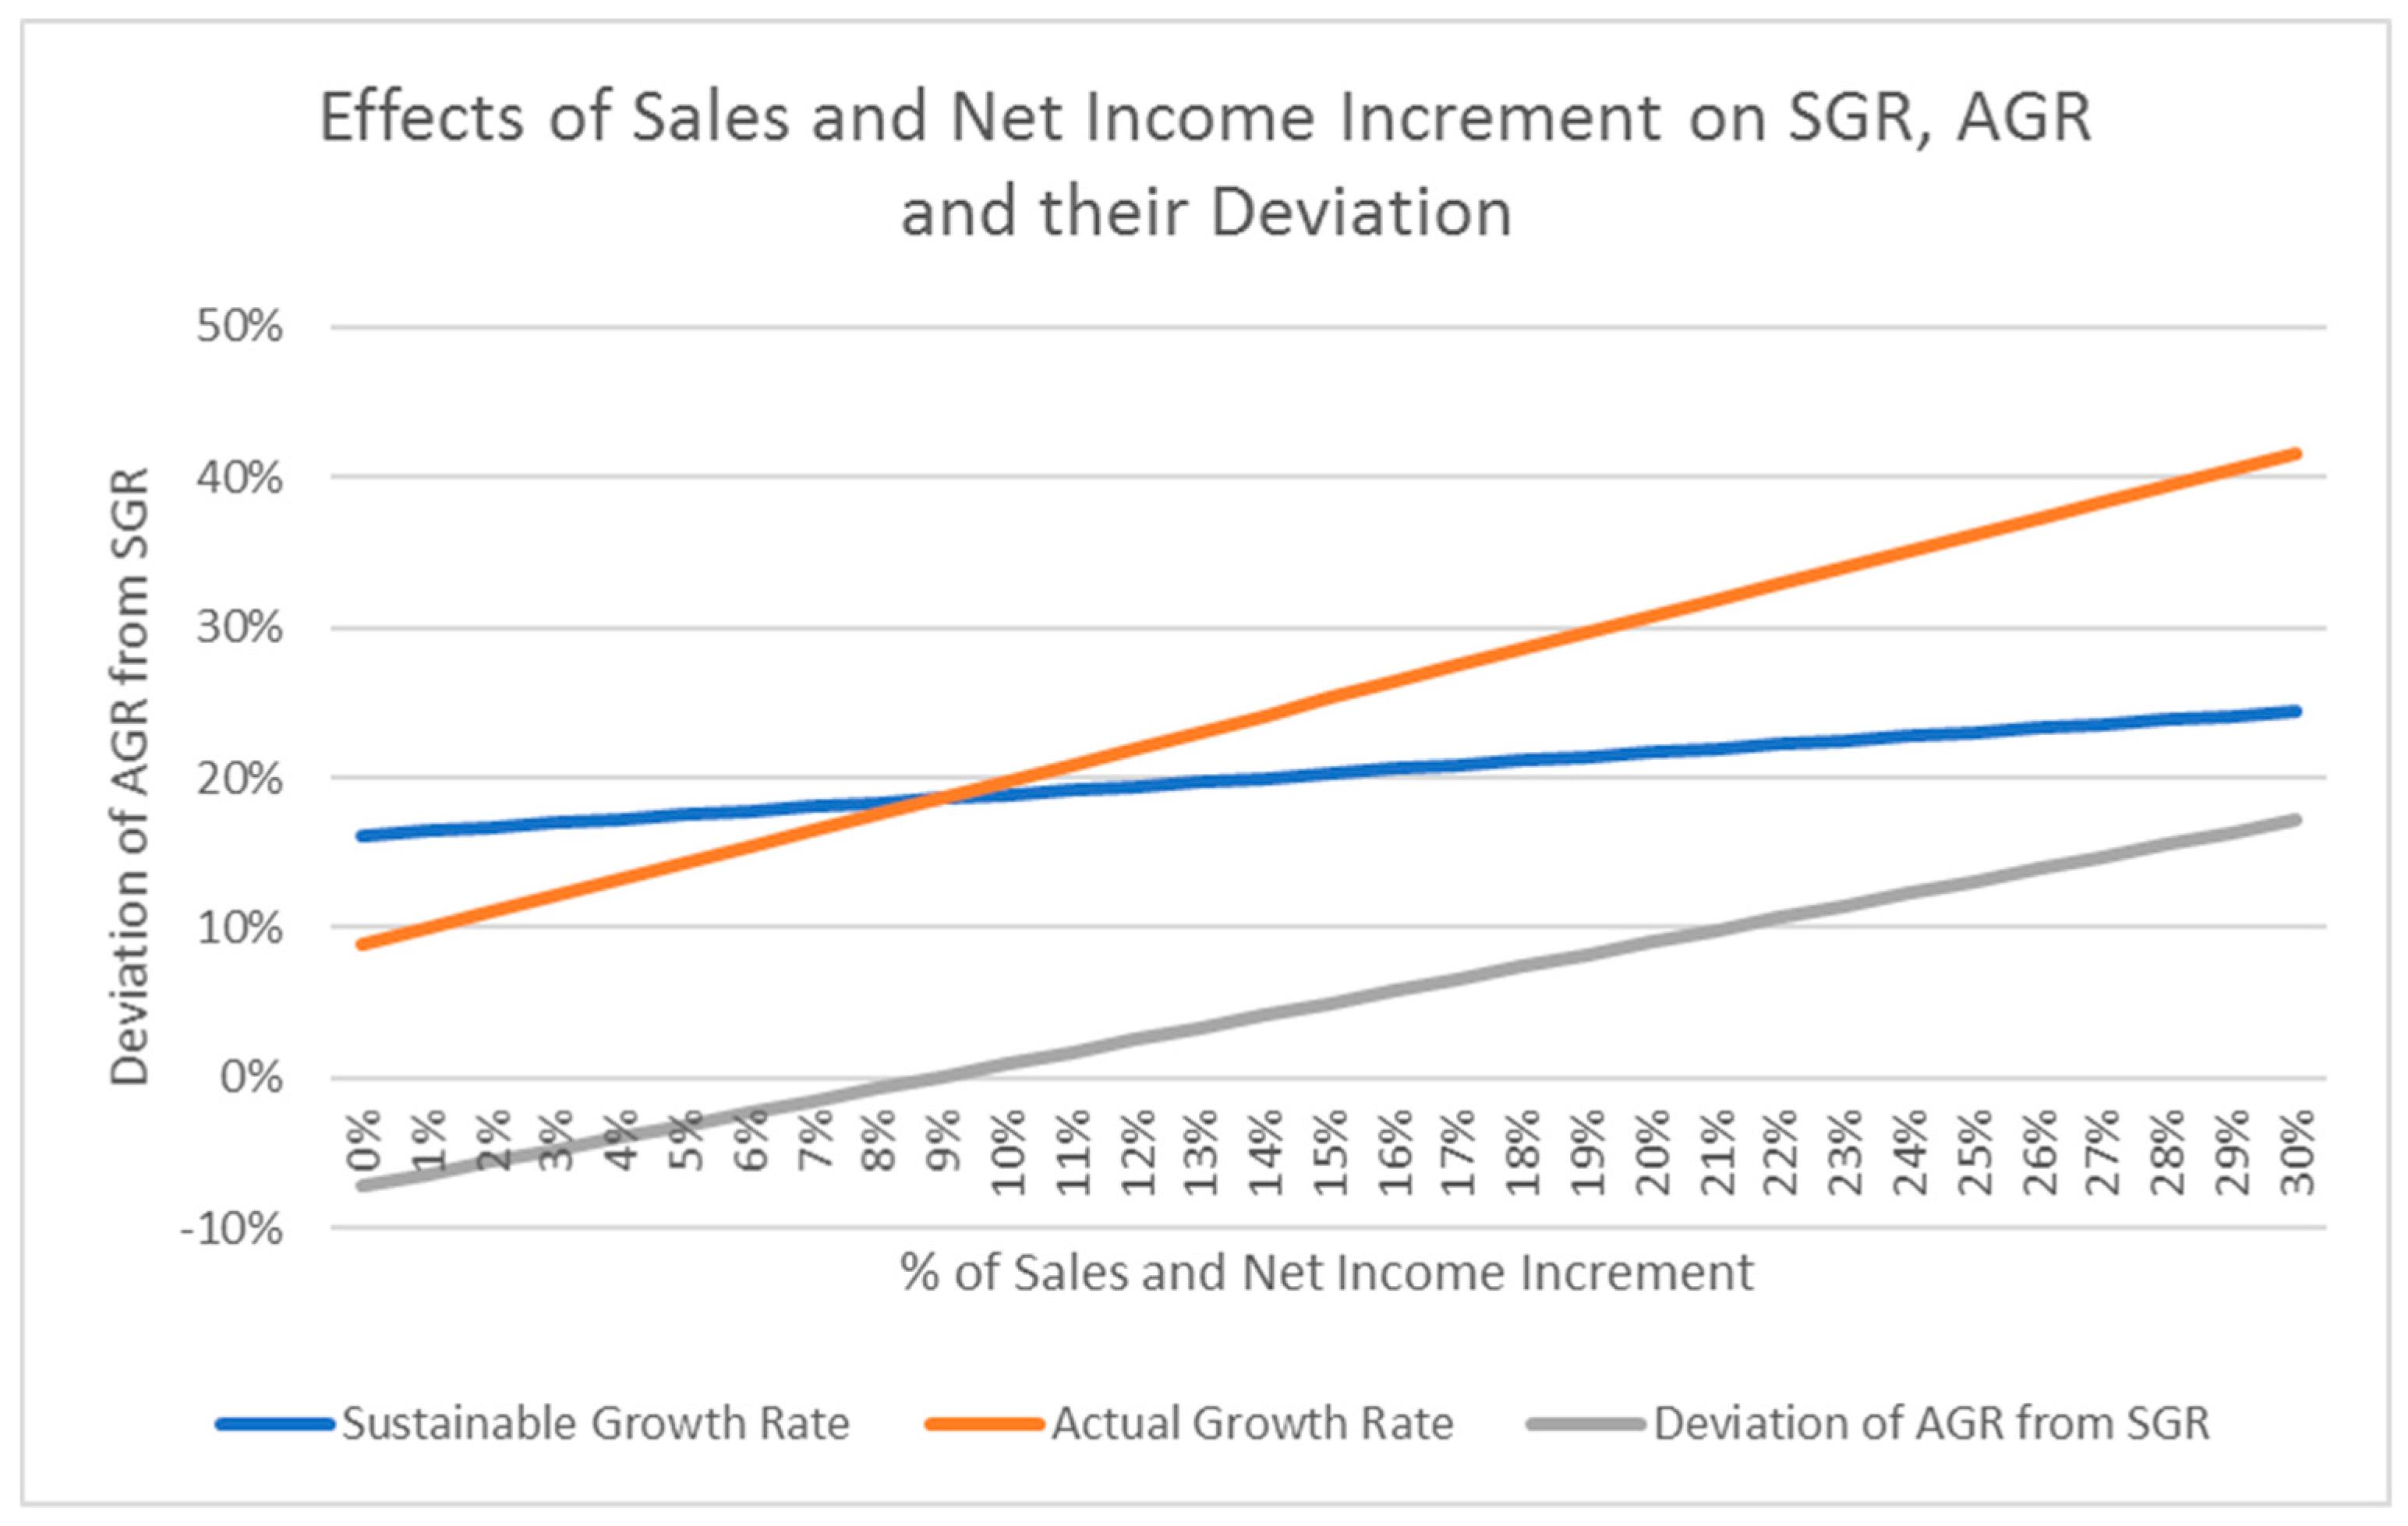
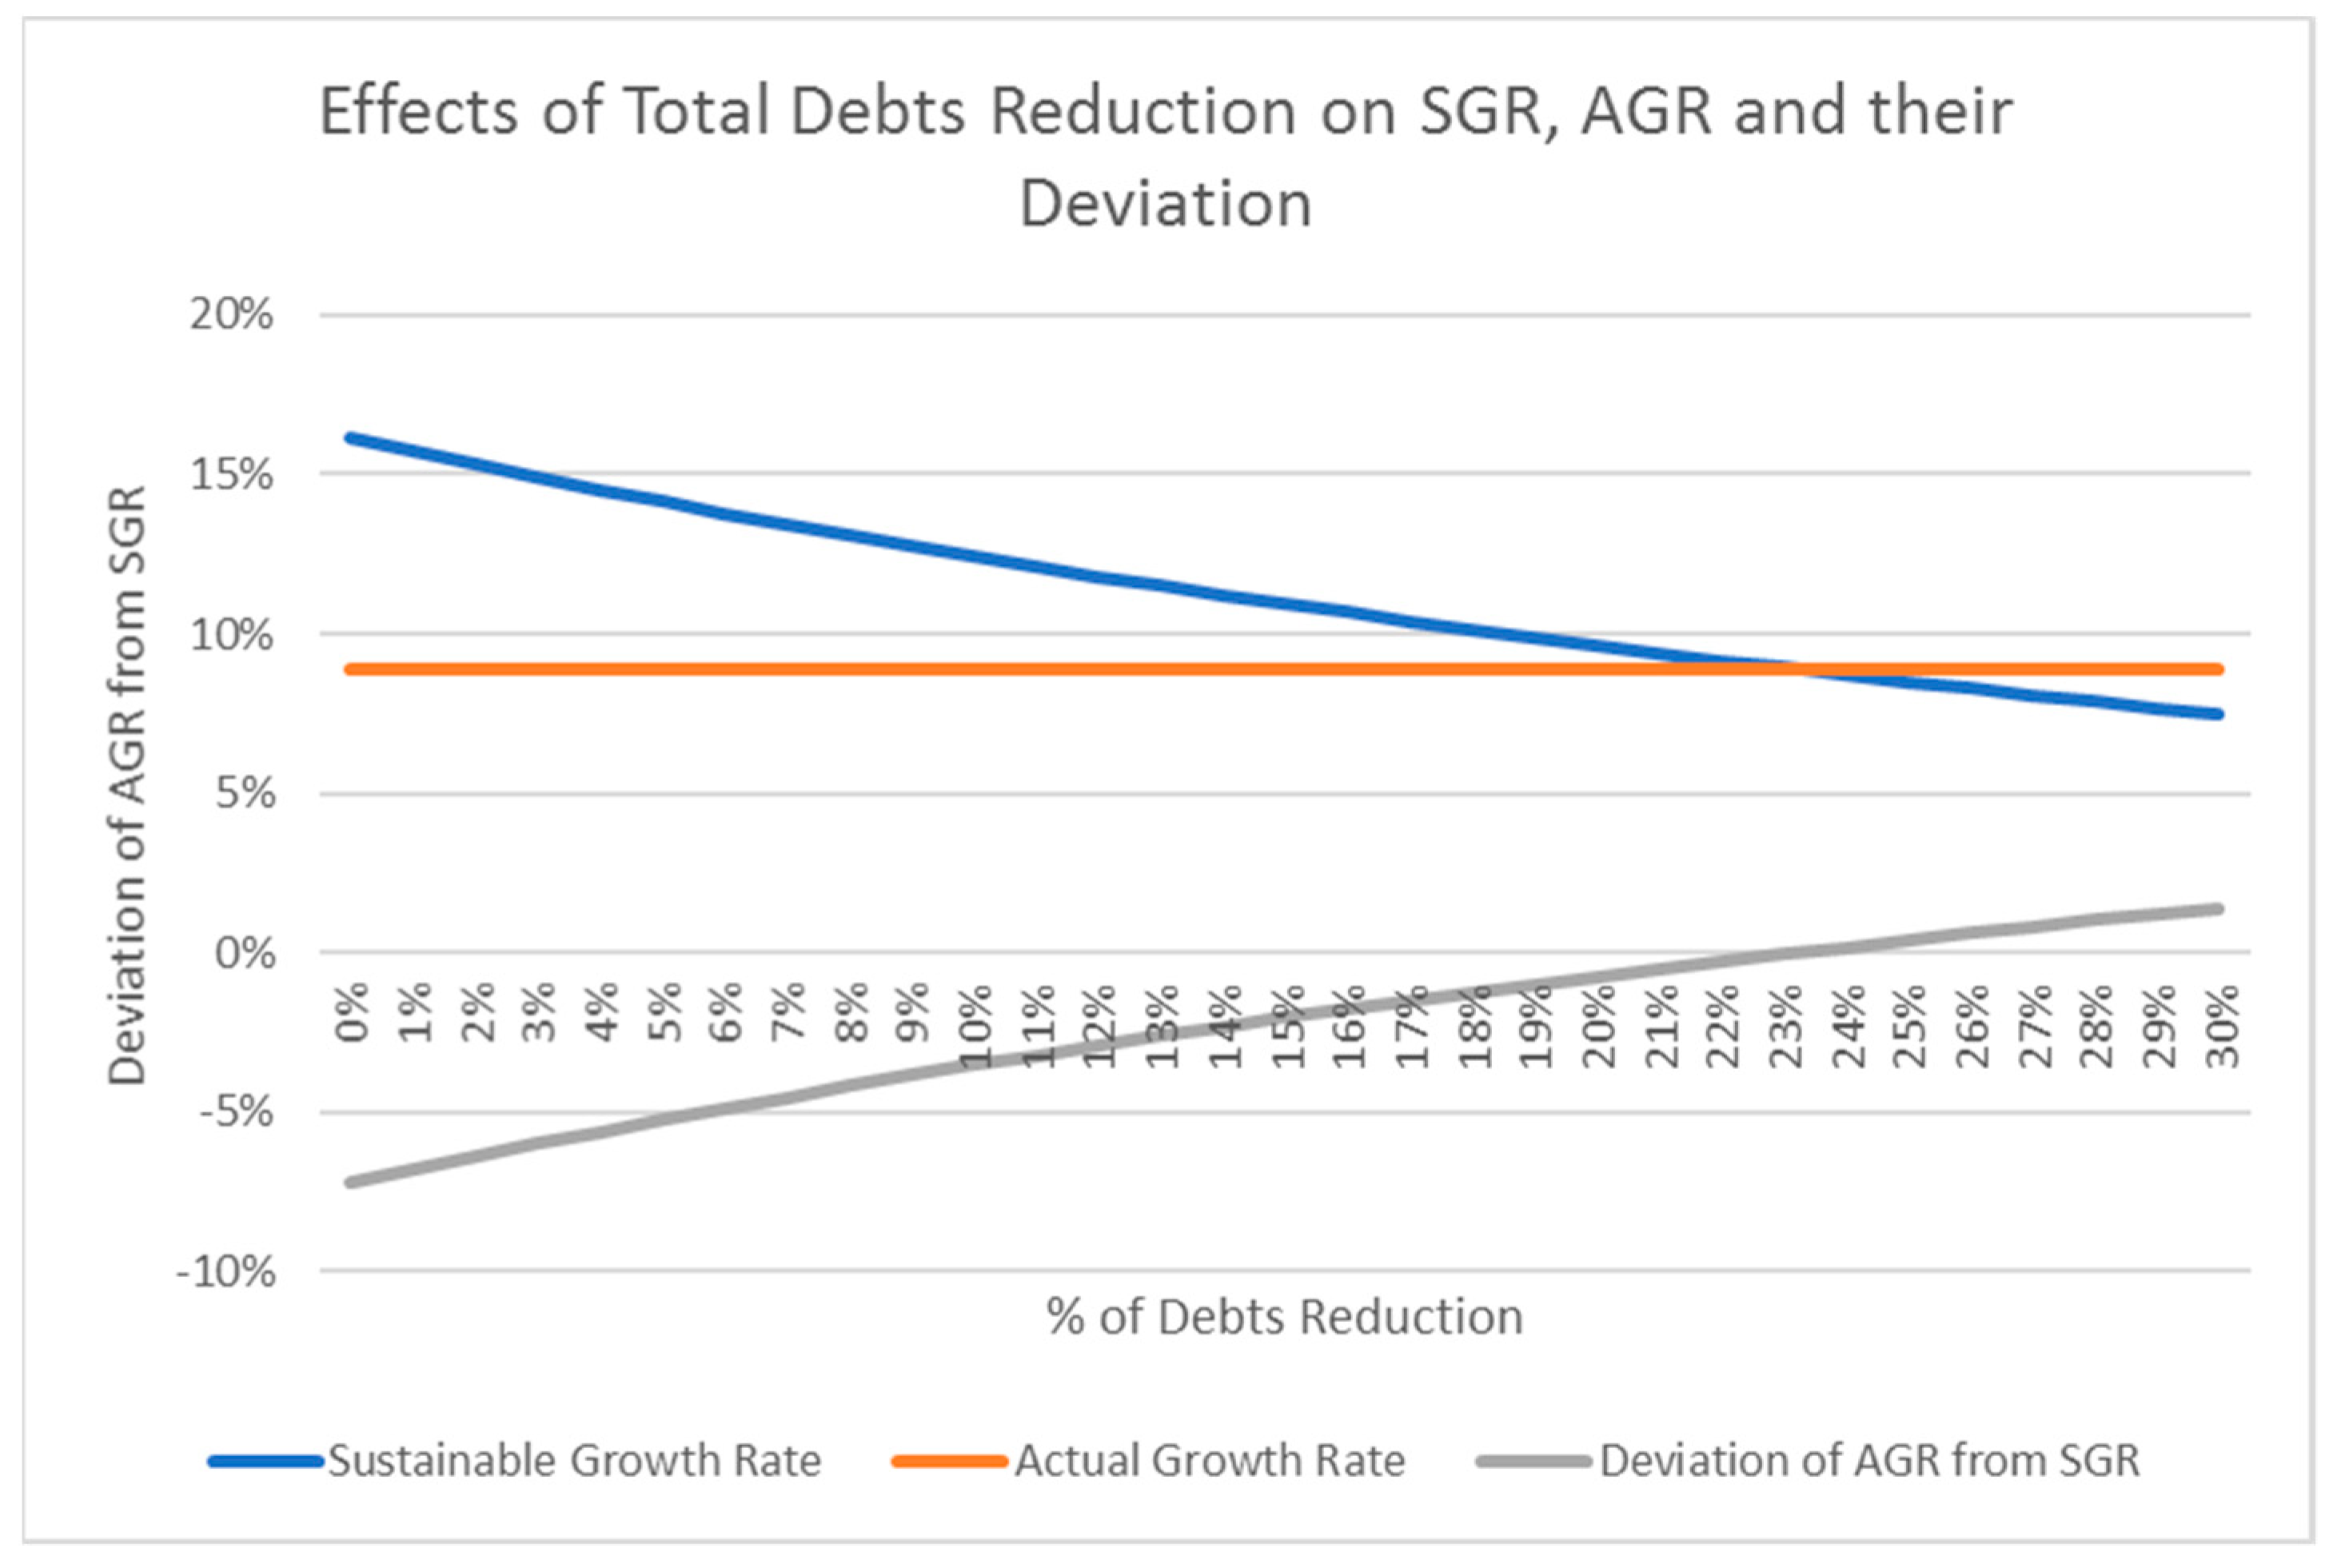
This deviation could be narrowed by reducing SGR through the productive use of excess cash, e.g., increasing dividends of shareholders or reducing business debt levels [42]. Alternatively, AGR can be increased by increasing sales, through processing more FFB into CPO, palm kernel, and other by-products with existing facilities.
Figure 5, Figure 6 and Figure 7 illustrate the sensitiveness of total debt reductions, increased dividend, and increased production (hence increase sales and net income) to SGR, AGR, and the deviation of AGR from SGR. AGR will remain constant, and SGR will be reduced if the total debts are cut down. The calculation shows that reducing total debts up to 23% of current debt levels would bring down the deviation of AGR from SGR to zero provided all other parameters (e.g., dividend) remain the same. SGR will also be reduced with smaller impact, if the dividend paid to shareholders is increased (Figure 6). A more effective way to reduce the difference between AGR and SGR, is by increasing sales and net income through increased production. Figure 7 shows that increasing both sales and net income by 9% would reduce the difference between AGR and SGR to zero.
The economic PMs including PM2.1.1—plantation yield (tonne FFB/hectare); and PM2.1.2—mill production efficiency (tonne CPO per tonne FFB), do not seem to be affected by the introduction of a biogas trapping system. This is because the BGPP only processes POME waste and does not affect plantation activities and other crude palm oil extraction processes at the palm oil mill. The revenue, profit, and cash flow have increased, but this extra earning neither directly benefitted the workers nor the local community, probably due to consideration of other higher priority areas such as debts reduction as the business had increased the capital investment through extra bank financing. Hence, PM3.1.1, i.e., average annual income per worker, which is the percentage of national average income, and PM3.2.2 (i.e., smallholders’ equity) remain unchanged. The BGPP requires minimum human involvement during operation while the periodic maintenance task could be performed by the existing manpower in the palm oil mill. Hence, the number of job opportunities for the local people (i.e., PM3.2.1 or employment opportunity for the locals) remains the same.
5.3. Social Sustainability Performance Measures
Table 1 shows that the introduction of a biogas trapping system does not have an immediate and direct effect on the social sustainability performance measures. In both supply chain scenarios, with and without a biogas trapping system, the HPI of social wellbeing was achieved by fulfilling the essential needs, including water supply, healthcare, sanitation facilities, and housing facilities for workers (PM 4.1.1–4.1.4). The supply chain practiced the same administrative strategies on workers’ welfare, regardless of whether a biogas trapping system is installed or not.
HPI of social equity (i.e., local community empowerment and engagement), which is attained by sharing information with the local community (PM5.1.1) and by offering fair partnership and community involvement in decision making (PM5.1.2), were not impacted by the biogas trapping system. This is because the incorporation of the BGPP does not affect the local community in terms of land accusation, pollution creation, and businesses, and so the consultation was not deemed necessary. This was mainly driven by governing policies but not by community pressure.
This new development can potentially improve the level of community acceptance to plantation and mill activities (PM 5.1.3), as the conversion of POME to biogas can reduce the unpleasant odor produced by the open POME pond. It should be notable that the Department of Environment in Malaysia receives ~1,082 complaints each year about odor pollution and this accounts for 2.4% of the cases lodged/filed each year, and is ranked sixth as the major sources of odor pollution in the country [43]. However, improvements on the level of community acceptance cannot be observed immediately as it takes time for stakeholders to observe the system’s implications.
5.4. The Overall Sustainability Assessment
Sustainability assessment results of crude palm oil supply chains, with and without a biogas trapping system, were determined using the POSA framework. Ranks of PMs were determined by comparing the data of PMs against the ranking criteria, while scores for KPIs, HPIs, sustainability objectives, and overall sustainability were calculated using formulae developed by Lim and Biswas [25]. For comparison purposes, rank value of PMs and score for KPIs, HPIs, sustainability objectives, and overall sustainability of the existing supply chain (i.e., without a biogas trapping system) were included in italic within brackets (Table 4).
The overall sustainability score improved from 3.47 to 3.59 out of 5, due to the incorporation of a biogas trapping system. Most of the improvements took place from an environmental perspective. The HPI score of Natural Capital Conservation in the baseline supply chain increased from 2.94 out of 5 to 3.54 out of 5 due to this improvement strategy. KPI 1.1—climate change—was significantly improved due to higher performance of its PM 1.1.1—GHG emissions (76% reduction in GHG emission). This had in fact reduced the gap between the rank and the sustainability threshold of this PM from 3 to 1. Similarly, the gap for KPI 1.3—waste generation was reduced from 1 to 0 by improving the recovery of biomass waste by 17% (i.e., PM 1.3.1—percentage of biomass waste recovered/recycled).
The incorporation of biogas plant in the supply chain was found to increase the deviation of actual growth rate from sustainability growth rate by −3%, hence the ranking of its PM 2.2.1—actual growth rate—dropped from 4 out of 5 to 3 out of 5. This has been reflected on the score for KPI 2.2—business continuity—HPI 2 of business continuity, and resiliency of the overall economic sustainability objective.
There were no changes in the scores of PMs, KPIs, HPIs, and sustainability for social sustainability objectives. This means that the incorporation of a biogas plant in the supply chain does not cause social consequences.
With the implementation of a biogas trapping system, hotspot of the crude palm oil supply chain in PM 1.1.1—GHG emission—could potentially be eliminated. Other hotspots (i.e., PM 1.4.1—plantation practice; PM1.5.2—energy (fossil fuel and biomass) consumption intensity (output/input energy ratio); PM3.1.1—average annual income per worker; PM3.2.1—employment opportunity for the local; and PM 3.2.2—smallholders’ equity) would not likely to be improved. Thus, some new strategies could be considered in the future, such as integrated livestock farming, pesticide and herbicide management, local skill development, and smallholder’s support program for reducing economic and environmental hotspots (list few within this bracket in short) and to further reduce the overall sustainability gap.
6. Discussion
Our results show that implementing a biogas trapping system to the most common crude palm oil supply chain in Malaysia allows the supply chain to reduce the sustainability gap. The results of this assessment, using the POSA framework, are consistent with findings of others in the literature [20,21,22,23], where GHG emissions were significantly reduced with the introduction of a biogas plant. This assessment also found improvements in other environmental sustainability indicators, including biological oxygen demand of the water discharged, percentage biomass waste recovery/recycling, and energy (fossil fuel and biomass) consumption intensity (output/input energy ratio). The land size required for waste treatment could also be reduced from 5 hectares to 1.5 hectares (70% reduction). This reduction in land size, however, is insignificant in making an impact as the land used for plantation, which is reflected in PM 2.1.1 plantation yield (in tonne FFB per Ha) is much larger compared to this saving. The results show that the biogas trapping system could cause beneficial repercussions in terms of enhanced environmental sustainability performances. Whilst overall environmental sustainability performance improved due to this biogas trapping plant, some other specific environmental impacts that depend on plant management system, such as plantation practice, land use, and species loss are still substantial and did not reach the sustainability threshold. This confirms that the sustainability policy, along with technological improvements are required to achieve significant sustainability improvements in the supply chain.
PM1.5.1—energy (fossil fuel and biomass) consumption intensity (output/input energy ratio) remains the hotspot despite the fact that the biogas plant contributes to additional energy output to the supply chain. While strategies and efforts should be involved in order to reduce fossil fuel consumption during plantation, milling, and transportation stages, it is worth reviewing the definition of the energy input in calculating this PM. The current calculation method includes energy input obtained from the biomass waste generated within the system boundary. It could have been more accurate to consider the net energy input in the system boundary of the supply chain [44,45], which could have also highlighted the importance of energy conservation and recovery within the supply chain.
The installation of a biogas trapping system can increase the revenue and net profits of the palm oil mill of the baseline supply chain. The additional investment is economically feasible as a breakeven point can be attained in less than 3 years. The additional capital investment due to incorporation of this biogas trapping system can cause debts, and as the mill was underutilized, it could lead to a significant deviation of actual growth rate from sustainable growth rate. With current facilities’ capacity and investment, the supply chain could have produced more crude palm oil and palm kernel for sustainable growth. The shortage of FFB supply due to labor shortage and lower CPO market price, are some main key possible barriers to increase the growth of sales [46,47].
The introduction of a biogas trapping system does not play a role to combat poverty and wealth creation, meaning that it does not help increase average annual income per worker, create employment opportunity for the local people, and increase smallholders’ equity in this case study. However, with the increase of revenue and profit, the supply chain has greater financial ability to improve the welfare of its employees. Palm oil mill owners in the supply chain could introduce schemes such as the employee stock options plan [48] to improve the social security of their employees, which would reward, retain, and attract local employees. Employee stock options plan offers company shares to the employees and thus the employees could own part of the company. They could also benefit directly through the annual dividend when the company is making a profit. Making the employees shareholders of the company meets the economic sustainability objective of sharing economic power through distribution of wealth.
The biogas trapping system does not make any changes to the social sustainability performance. The perception and level of acceptance of the local community towards the palm oil supply chain is expected to be more positive by reducing key environmental impacts, and also by eliminating odor nuisance/pollution.
While the biogas trapping system helps improve the overall sustainability performance of the crude palm oil supply chain, it cannot totally close the sustainability gap. Other environmental sustainability issues need to be resolved in terms of further reduction of fossil fuel consumption, improved plantation practice to reduce the loss of biodiversity, and land usage, initiatives for species protection, and by further reducing GHG emissions to meet the international target (i.e., 0.15 tonne CO2eq/tonne CPO, considering Malaysia’s pledge in Copenhagen for a 40% reduction in GHG emission by 2020 from 2005 level). This holistic framework also demonstrates that there exists large economic and social sustainability gaps, particularly in sharing economic power and uplifting social equity, which remain major areas of improvement, despite the efforts that could be made by installing the biogas trapping system. These economic and social sustainability indicators would require new administrative strategies and policy changes along the supply chain, e.g., increasing the share of fresh fruit bunches collected from smallholders, and the practice of community-inclusive policy in decision making, to make significant improvements.
The incorporation of technological changes in the supply chain modified the system boundary but it did not affect the sustainability assessment process using the POSA framework. The quantifiable framework thus demonstrates flexibilities or captures any sort of changes associated with the incorporation of strategies in the crude palm oil supply chain to enhance the sustainability performance. Key characteristics of the POSA framework that are generated from this research are its comprehensiveness, decision making capability, and holistic or multidisciplinary assessment by examining all indicators of the three sustainability objectives.
7. Conclusions
The paper demonstrates the flexibility of POSA framework to incorporate any improvements into the existing supply chain of crude palm oil production for sustainability assessment. The incorporation of a biogas trapping system in palm oil mills for POME treatments as an environmental improvement strategy, has improved the overall sustainability performance score of a typical crude palm oil production supply chain in Malaysia from 3.47 out of 5 to 3.59 out of 5. This POSA framework captured the changes/side effects associated with the incorporation of a biogas trapping system into the supply chain. Environmental indicators such as GHG emissions, BOD, and waste recovery were improved due to inclusion/consideration of this environmental improvement strategy but the performance of actual growth rate decreased.
There still exists a significant gap to achieve a complete sustainability outcome (i.e., 5 out of 5), as the incorporation of one improvement strategy is not enough. This research using the POSA framework has further identified that biodiversity, wealth distribution, and social equity are some areas that require a significant level of improvement using relevant improvement strategies to close this gap. The biogas trapping system would solve part of the problem but achieving sustainability production of crude palm oil remains a challenge to all stakeholders in the supply chain.
Similarly, other strategies can be incorporated into or trialed in the POSA framework until the sustainability performance gap becomes very close or equal to zero. This way the framework could enable policy makers, businesses, and customers in the supply chain to discern right strategies in attaining sustainable crude oil production in Malaysia.
This framework is limited to the crude palm oil production, but the system boundary could be further extended by incorporating the refinery production processes to generate a finished product, e.g., olein for cooking oil and biodiesel, stearin for margarine and shortening. Besides, the accuracy in estimating some performance measures could be improved, e.g., species loss could be measured using scientific methods (e.g., the species–area curve [49]) rather than collective feedback, soil nitrate levels could be measured directly with a flow injection analyzer [50] rather than through pH in water way.
Author Contributions
Conceptualization, C.I.L. and W.K.B.; methodology, C.I.L.; validation, W.K.B.; formal analysis, C.I.L.; investigation, C.I.L.; resources, C.IL.; data collection, C.I.L.; writing—original draft preparation, C.I.L.; writing—review and editing, C.I.L. and W.K.B.; visualization, C.I.L.; supervision, W.K.B.; project administration, C.I.L.
Funding
This research received no external funding
Acknowledgments
The authors would like to thank villages, smallholders, nurseries, plantation companies, palm oil mills and all the stakeholders along the crude palm oil supply chain who have participated in the data collection process of this research. The authors also appreciate the administrative support provided by Curtin University in completing this research.
Conflicts of Interest
The authors declare no conflict of interest.
Nomenclature
| AGR | Actual Growth Rate |
| BGPP | Biogas cum Polishing Plant |
| BOD | Biochemical Oxygen Demand |
| CO2eq | Carbon Dioxide Equivalent |
| COD | Chemical Oxygen Demand |
| CPO | Crude Palm Oil |
| DOE | Department of Environment |
| EFB | Empty Fruit Bunches |
| FFB | Fresh Fruit Bunches |
| GHG | Greenhouse Gas |
| HPI | Higher Performance Indicator |
| KPI | Key Performance Indicator |
| m3 | cubic meter |
| mg/L | Milligram per litre |
| MJ | Mega joule |
| MT/hr | Metric tonne per hour |
| Nm3 | Normal Cubic Meter |
| PM | Performance Measure |
| POME | Palm Oil Mill Effluent |
| POSA | Palm Oil Sustainability Assessment |
| SGR | Sustainable Growth Rate |
References
- Enden, S.V.D. Smallholders and Sustainable Palm Oil Production: A Better Understanding between Policy Arrangements and Real-Life Practices a Case Study of the Siak Smallholders Site, Riau Province. Master’s Thesis, Wageningen University, Wageningen, The Netherlands, 2013. [Google Scholar]
- Lyndon, N.; Razak, N.; Azima, A.M.; Junaidi, A.B.; Sivapalan, S. Empowerment of the bidayuh rural community oil palm smallholders: A case study in serian district, sarawak, Malaysia. Mediterr. J. Soc. Sci. 2015, 6, 55. [Google Scholar] [CrossRef]
- Rival, A.; Levang, P. Palms of Controversies—Oil Palm and Development Challenges; Center for International Forestry Research (CIFOR): Bogor, Indonesia, 2014. [Google Scholar]
- Varsha, V.; Stuart, L.P.; Clinton, N.J.; Sharon, J.S. The impacts of oil palm on recent deforestation and biodiversity loss. PLoS ONE 2016, 11, e0159668. [Google Scholar]
- Colchester, M. Palm Oil and Indigenous People in South East Asia; The International Land Coalition: Rome, Italy, 2011. [Google Scholar]
- WWF. Palm Oil & Biodiversity Loss. Available online: http://wwf.panda.org (accessed on 31 March 2017).
- Reijnders, L.; Huijbregts, M.A.J. Palm oil and the emission of carbon-based greenhouse gases. J. Clean. Prod. 2008, 16, 477–482. [Google Scholar] [CrossRef]
- Mohd Kusin, F.; Akhir, N.I.M.; Mohamat-Yusuff, F.; Awang, M. The impact of nitrogen fertilizer use on greenhouse gas emissions in an oil palm plantation associated with land use change. Atmósfera 2015, 28, 243–250. [Google Scholar] [CrossRef] [Green Version]
- BBC. Bbc Biogas and Polishing Plant (Kubota System); Bhd, B.B.S., Ed.; BBC Sdn Bhd: London, UK, 2018. [Google Scholar]
- Foo, K.Y.; Hameed, B.H. Insight into the applications of palm oil mill effluent: A renewable utilization of the industrial agricultural waste. Renew. Sustain. Energy Rev. 2010, 14, 1445–1452. [Google Scholar] [CrossRef]
- Rahayu, A.S.; Karsiwulan, D.; Yuwono, H.; Trisnawati, I.; Mulyasari, S.; Rahardjo, S.; Hokermin, S.; Paramita, V. Handbook Pome-to-Biogas Project Development in Indonesia; Winrock International: Little Rock, AR, USA, 2015. [Google Scholar]
- Madaki, Y.S.; Lau, S. Palm oil mill effluent (pome) from Malaysia palm oil mills: Waste or resource. Int. J. Sci. Environ. Technol. 2013, 2, 1138–1155. [Google Scholar]
- Wong, K.K. Application of ponding systems in the treatment of palm oil mill and rubber mill effluents. Pertanika 1980, 3, 133–141. [Google Scholar]
- Rupani, P.F.; Singh, R.P.; Ibrahim, M.H.; Esa, N. Review of current palm oil mill effluent (pome) treatment methods: Vermicomposting as a sustainable practice. World Appl. Sci. J. 2010, 10, 1190–1201. [Google Scholar]
- Wicke, B.; Dornburg, V.; Junginger, M.; Faaij, A. Different palm oil production systems for energy purposes and their greenhouse gas implications. Biomass Bioenergy 2008, 32, 1322–1337. [Google Scholar] [CrossRef] [Green Version]
- Intergovernmental Panel on Climate Change. Climate Change 2014: Mitigation of Climate Change: Working Group iii Contribution to the Fifth Assessment Report of the Intergovernmental Panel on Climate Change/Edited by Ottmar Edenhofer [and Fifteen Others]; Cambridge University Press: New York, NY, USA, 2014. [Google Scholar]
- MPOB. National Key Economic Areas (NKEA) National Biogas Implementation (EPP5) Biogas Capture and Cdm Project Implementation for Palm Oil Mills; Malaysian Palm Oil Board (MPOB): Bandar Baru Bangi, Malaysia, 2014.
- Choo, Y.M. Public Consultation on Mandatory Installation of Biogas Facilities in Palm Oil Mills; Palm Oil Board: Bandar Baru Bangi, Malaysia, 2013.
- BorneoPost. Palm oil mills’ biogas capture implementation in sarawak a major challenge—Soppoa. Borneo Post Online. 5 November 2014. Available online: http://www.theborneopost.com/2014/11/05/palm-oil-mills-biogas-capture-implementation-in-sarawak-a-major-challenge-soppoa/ (accessed on 15 October 2018).
- Stichnothe, H.; Schuchardt, F. Comparison of different treatment options for palm oil production waste on a life cycle basis. Int. J. Life Cycle Assess. 2010, 15, 907–915. [Google Scholar] [CrossRef]
- Nasution, M.A.; Wibawa, D.S.; Ahamed, T.; Noguchi, R. Comparative environmental impact evaluation of palm oil mill effluent treatment using a life cycle assessment approach: A case study based on composting and a combination for biogas technologies in north sumatera of indonesia. J. Clean. Prod. 2018, 184, 1028–1040. [Google Scholar] [CrossRef]
- Vijaya, S.; Ma, A.; Choo, Y. Capturing biogas: A means to reduce green house gas emissions for the production of crude palm oil. Am. J. Geosci. 2010, 1, 1. [Google Scholar] [CrossRef]
- Hansen, S.B.; Olsen, S.I.; Ujang, Z. Greenhouse gas reductions through enhanced use of residues in the life cycle of Malaysian palm oil derived biodiesel. Bioresour. Technol. 2012, 104, 358–366. [Google Scholar] [CrossRef] [PubMed] [Green Version]
- Lim, C.I.; Biswas, W. An evaluation of holistic sustainability assessment framework for palm oil production in Malaysia. Sustainability 2015, 7, 16561–16587. [Google Scholar] [CrossRef]
- Lim, C.I.; Biswas, W.K. Development of triple bottom line indicators for sustainability assessment framework of Malaysian palm oil industry. Clean Technol. Environ. Policy 2017, 20, 1–22. [Google Scholar] [CrossRef]
- Lim, C.I.; Biswas, W. Sustainability assessment for crude palm oil production in Malaysia using the palm oil sustainability assessment framework. Sustain. Dev. 2018, 1–17. [Google Scholar] [CrossRef]
- Lim, C.I.; Biswas, W.; Samyudia, Y. Review of existing sustainability assessment methods for Malaysian palm oil production. Procedia CIRP 2015, 26, 13–18. [Google Scholar] [CrossRef]
- Ali, E.N.; Tay, C.I. Characterization of biodiesel produced from palm oil via base catalyzed transesterification. Procedia Eng. 2013, 53, 7–12. [Google Scholar] [CrossRef]
- Latif Ahmad, A.; Ismail, S.; Bhatia, S. Water recycling from palm oil mill effluent (pome) using membrane technology. Desalination 2003, 157, 87–95. [Google Scholar] [CrossRef]
- Bala, J.D.; Lalung, J.; Ismail, N. Palm oil mill effluent (pome) treatment ‘‘microbial communities in an anaerobic digester’’: A review. Int. J. Sci. Res. Publ. 2014, 4, 1–24. [Google Scholar]
- Wahidul, K.B. Life cycle assessment of seawater desalinization in western australia. World Acad. Sci. Eng. Technol. 2009, 56, 369–375. [Google Scholar]
- Puthankattil, V. Kubota’s biogas plant design more efficient, saves land space. Borneo Post Online. 10 December 2012. Available online: http://www.theborneopost.com/2012/12/10/kubotas-biogas-plant-design-more-efficient-saves-land-space/ (accessed on 15 October 2018).
- Jørgensen, P.J. Biogas-Green Energy •Process • Design • Energy Supply• Environment; PlanEnergi and Researcher for a Day 2009. Available online: http://www.lemvigbiogas.com/BiogasPJJuk.pdf (accessed on 10 May 2018).
- ISO. ISO 14040:2006-Environmental Management—Life Cycle Assessment—Principles and Framework; International Organization for Standardization: Geneva, Switzerland, 2006. [Google Scholar]
- ISO. ISO 14044:2006-Environmental Management—Life Cycle Assessment—Requirements and Guidelines; International Organization for Standardization: Geneva, Switzerland, 2006. [Google Scholar]
- Abdullah, R. Ghg emission for crude palm oil supply chain with and without biogas capture facility. Oil Palm Ind. Econ. J. 2013, 13, 27–37. [Google Scholar]
- Majid, R.A.; Esa, H. The use of boiler fly ash for bod, tss and colour reduction of palm oil mill effluent. Palm Oil Eng. Bull. 2017, 125. [Google Scholar]
- Othman, H.; Mohammed, A.T.; Dolmat, M.T. Bunch ash: An efficient and cost-effective k-fertilizer source for mature oil palm on peat under high rainfall environment. MPOB Transf. Technol. 2005, 254. [Google Scholar]
- Abas, R.; Abdullah, R.; Hawari, Y. Economic feasibility study on establishing an oil palm biogas plant in Malaysia. Oil Palm Ind. Econ. J. 2013, 13, 14–21. [Google Scholar]
- GasMalaysia. Tariff and Rates. Available online: http://www.gasMalaysia.com/index.php/our-services/at-your-service/bills-payments/tariff-rates (accessed on 1 July 2018).
- Arora, L.; Kumar, S.; Verma, P. The anatomy of sustainable growth rate of indian manufacturing firms. Glob. Bus. Rev. 2018, 19, 1050–1071. [Google Scholar] [CrossRef]
- Inc.com. Sustainable Growth. Available online: https://www.inc.com/encyclopedia/sustainable-growth.html (accessed on 10 September 2018).
- Mohd Nahar, O. Present Status of Odour Management in Malaysia; Research and Development Seminar 2014; International Atomic Energy Agency (IAEA): Bangi, Malaysia, 2014. [Google Scholar]
- Kreith, F.; Goswami, D.Y. Handbook of Energy Efficiency and Renewable Energy/Edited by Frank Kreith and d. Yogi Goswami; CRC Press: Boca Raton, FL, USA, 2007. [Google Scholar]
- Vallero, D.A. Green Engineering and Sustainable Design Aspects of Waste Management; Elsevier: New York, NY, USA, 2011; pp. 11–21. [Google Scholar]
- Ismail, A. The effect of labour shortage in the supply and demand of palm oil in Malaysia. Oil Palm Ind. Econ. J. 2013, 13, 15–26. [Google Scholar]
- Sime Darby Plantation’s q3 Earnings slip 39% on Lower ffb Production, Cpo Price. The Sun Daily, 31 May 2018.
- SEC. Employee Stock Options Plans. Available online: https://www.sec.gov/fast-answers/answers-empopthtm.html (accessed on 15 October 2018).
- Cain, S.A. The species-area curve. Am. Mid. Nat. 1938, 19, 573–581. [Google Scholar] [CrossRef]
- Birrell, S.J.; Hummel, J.W. Real-time multi isfet/fia soil analysis system with automatic sample extraction. Comput. Electron. Agric. 2001, 32, 45–67. [Google Scholar] [CrossRef]
Figure 1.
The reviewed baseline crude palm oil supply chain.
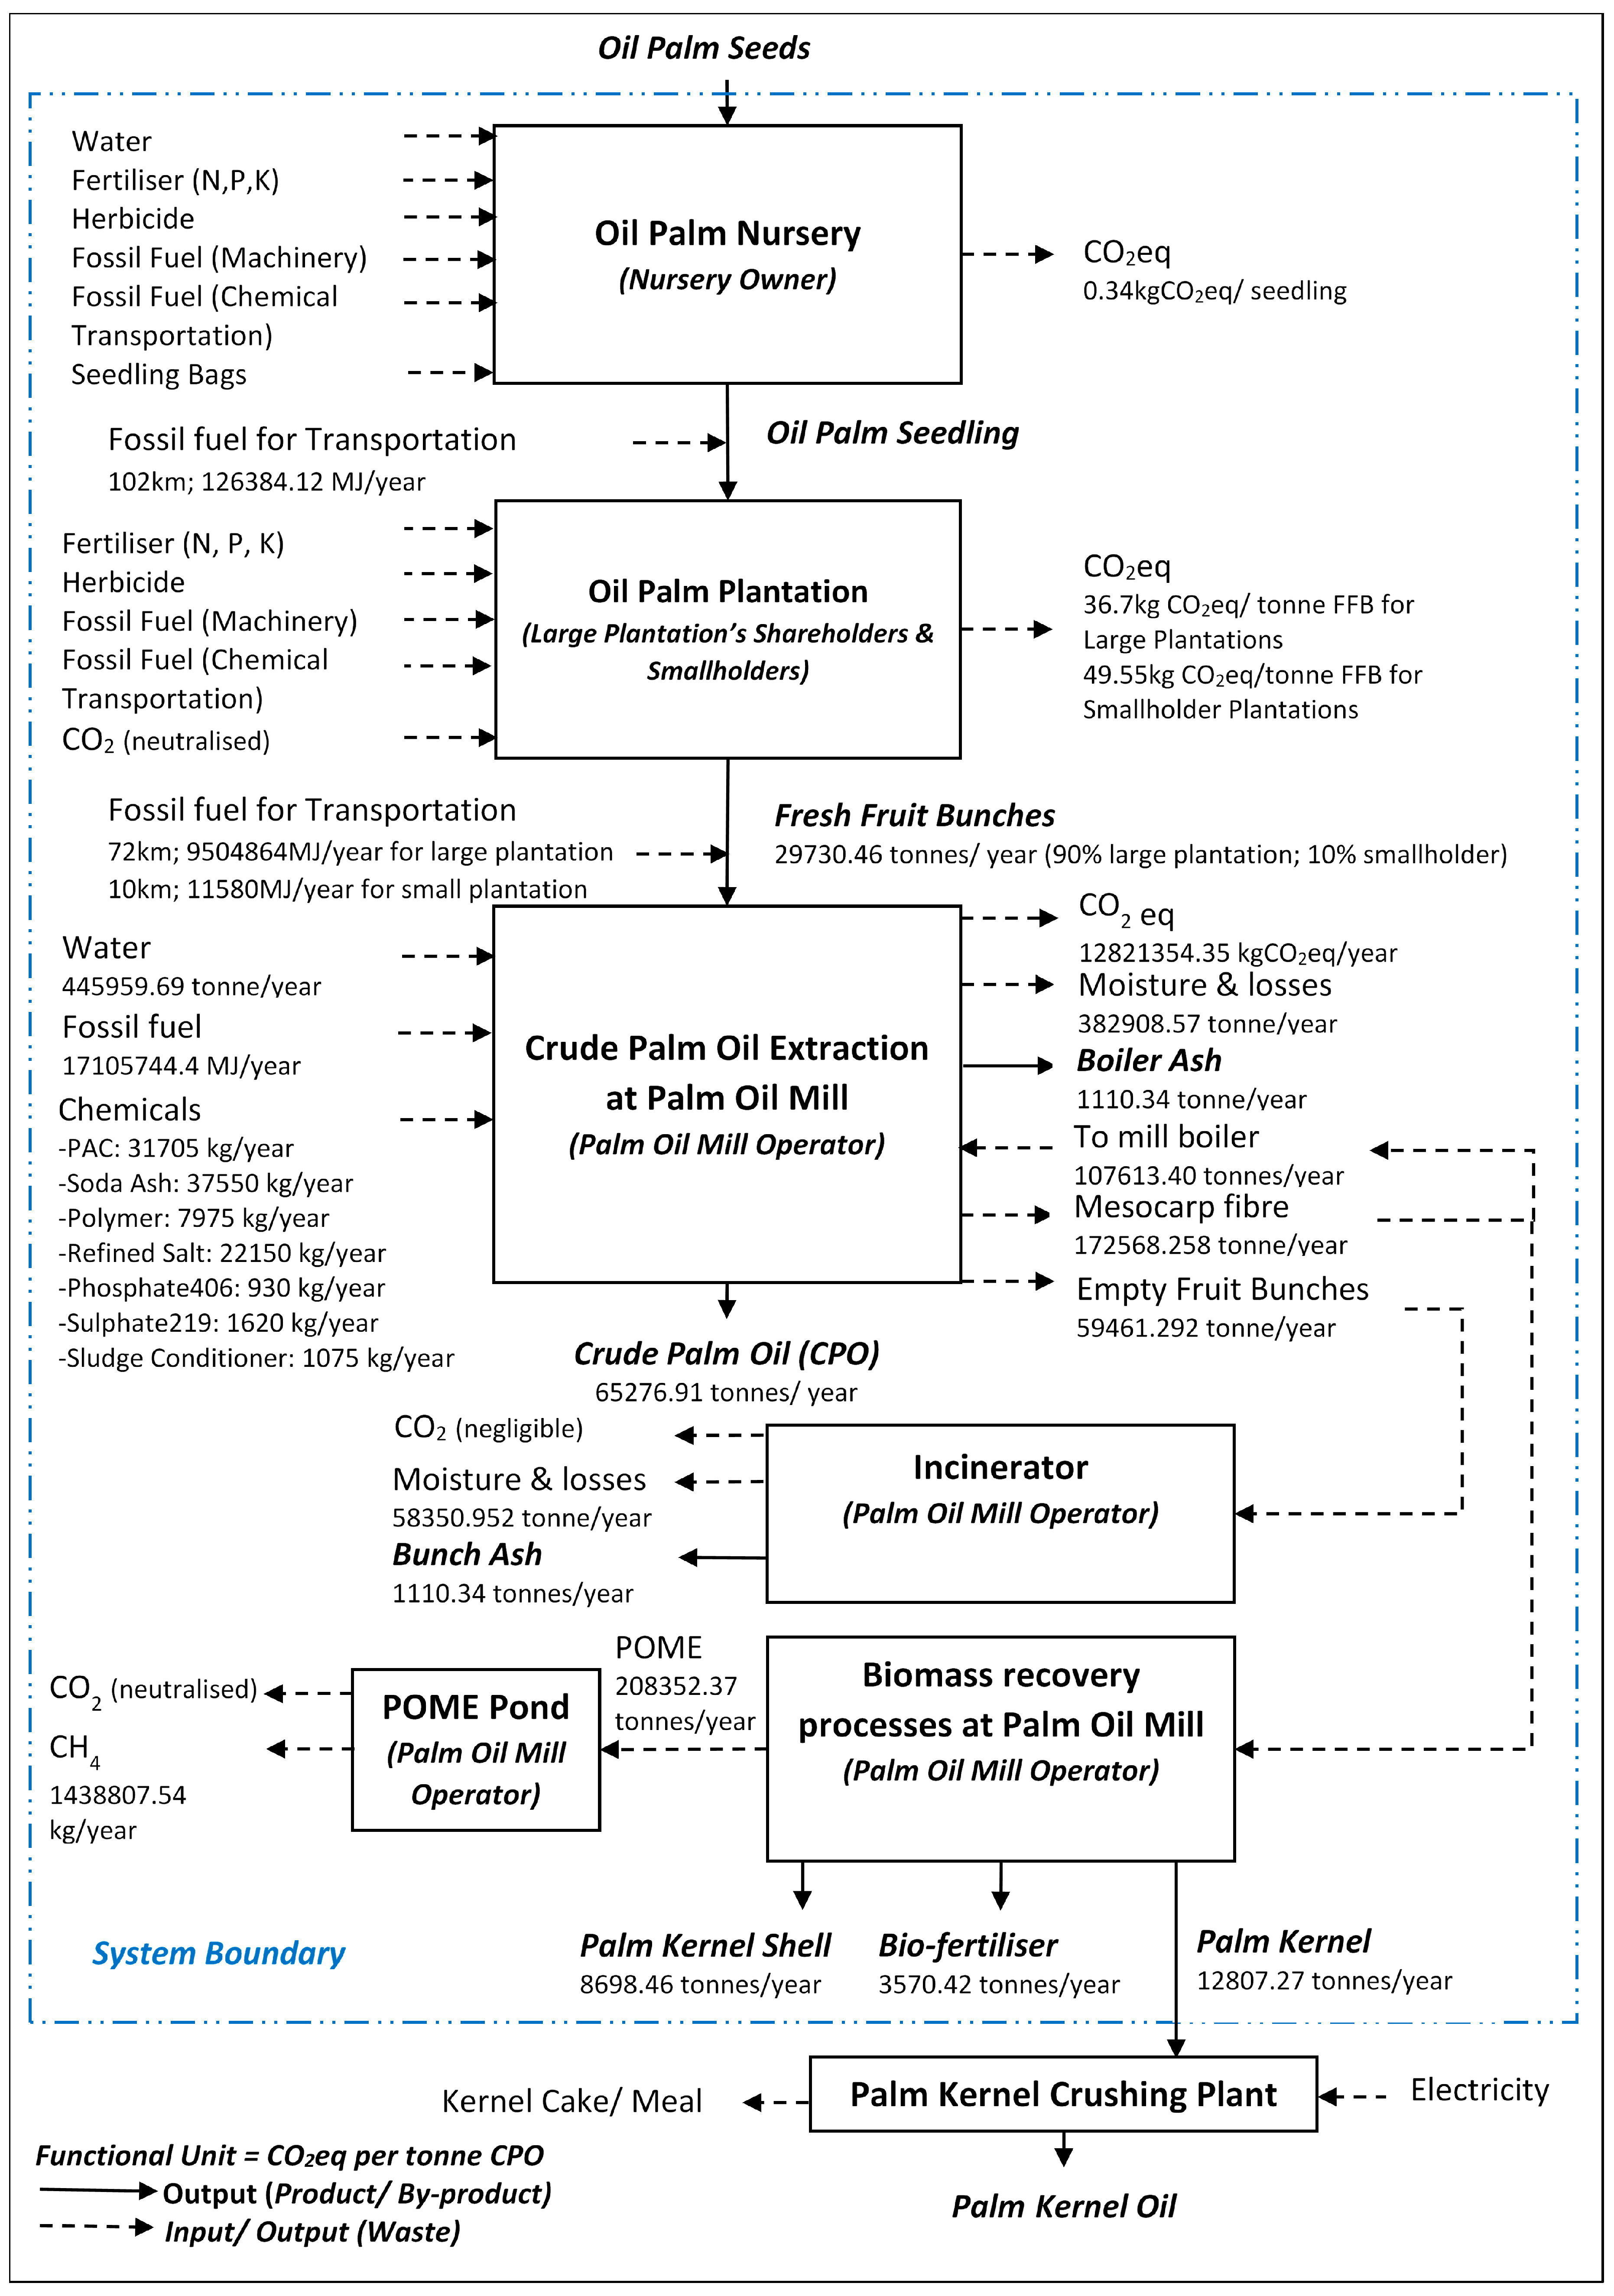
Figure 2.
Kubota biogas and polishing plant (BGPP).

Figure 3.
The biogas plant, polishing plant, the neighboring brick factory, and sludge pond in Sarawak, Malaysia (clockwise from top left corner).
Figure 3.
The biogas plant, polishing plant, the neighboring brick factory, and sludge pond in Sarawak, Malaysia (clockwise from top left corner).

Figure 4.
Biomass waste recovery in the palm oil mill (with and without the biogas trapping system).
Figure 4.
Biomass waste recovery in the palm oil mill (with and without the biogas trapping system).
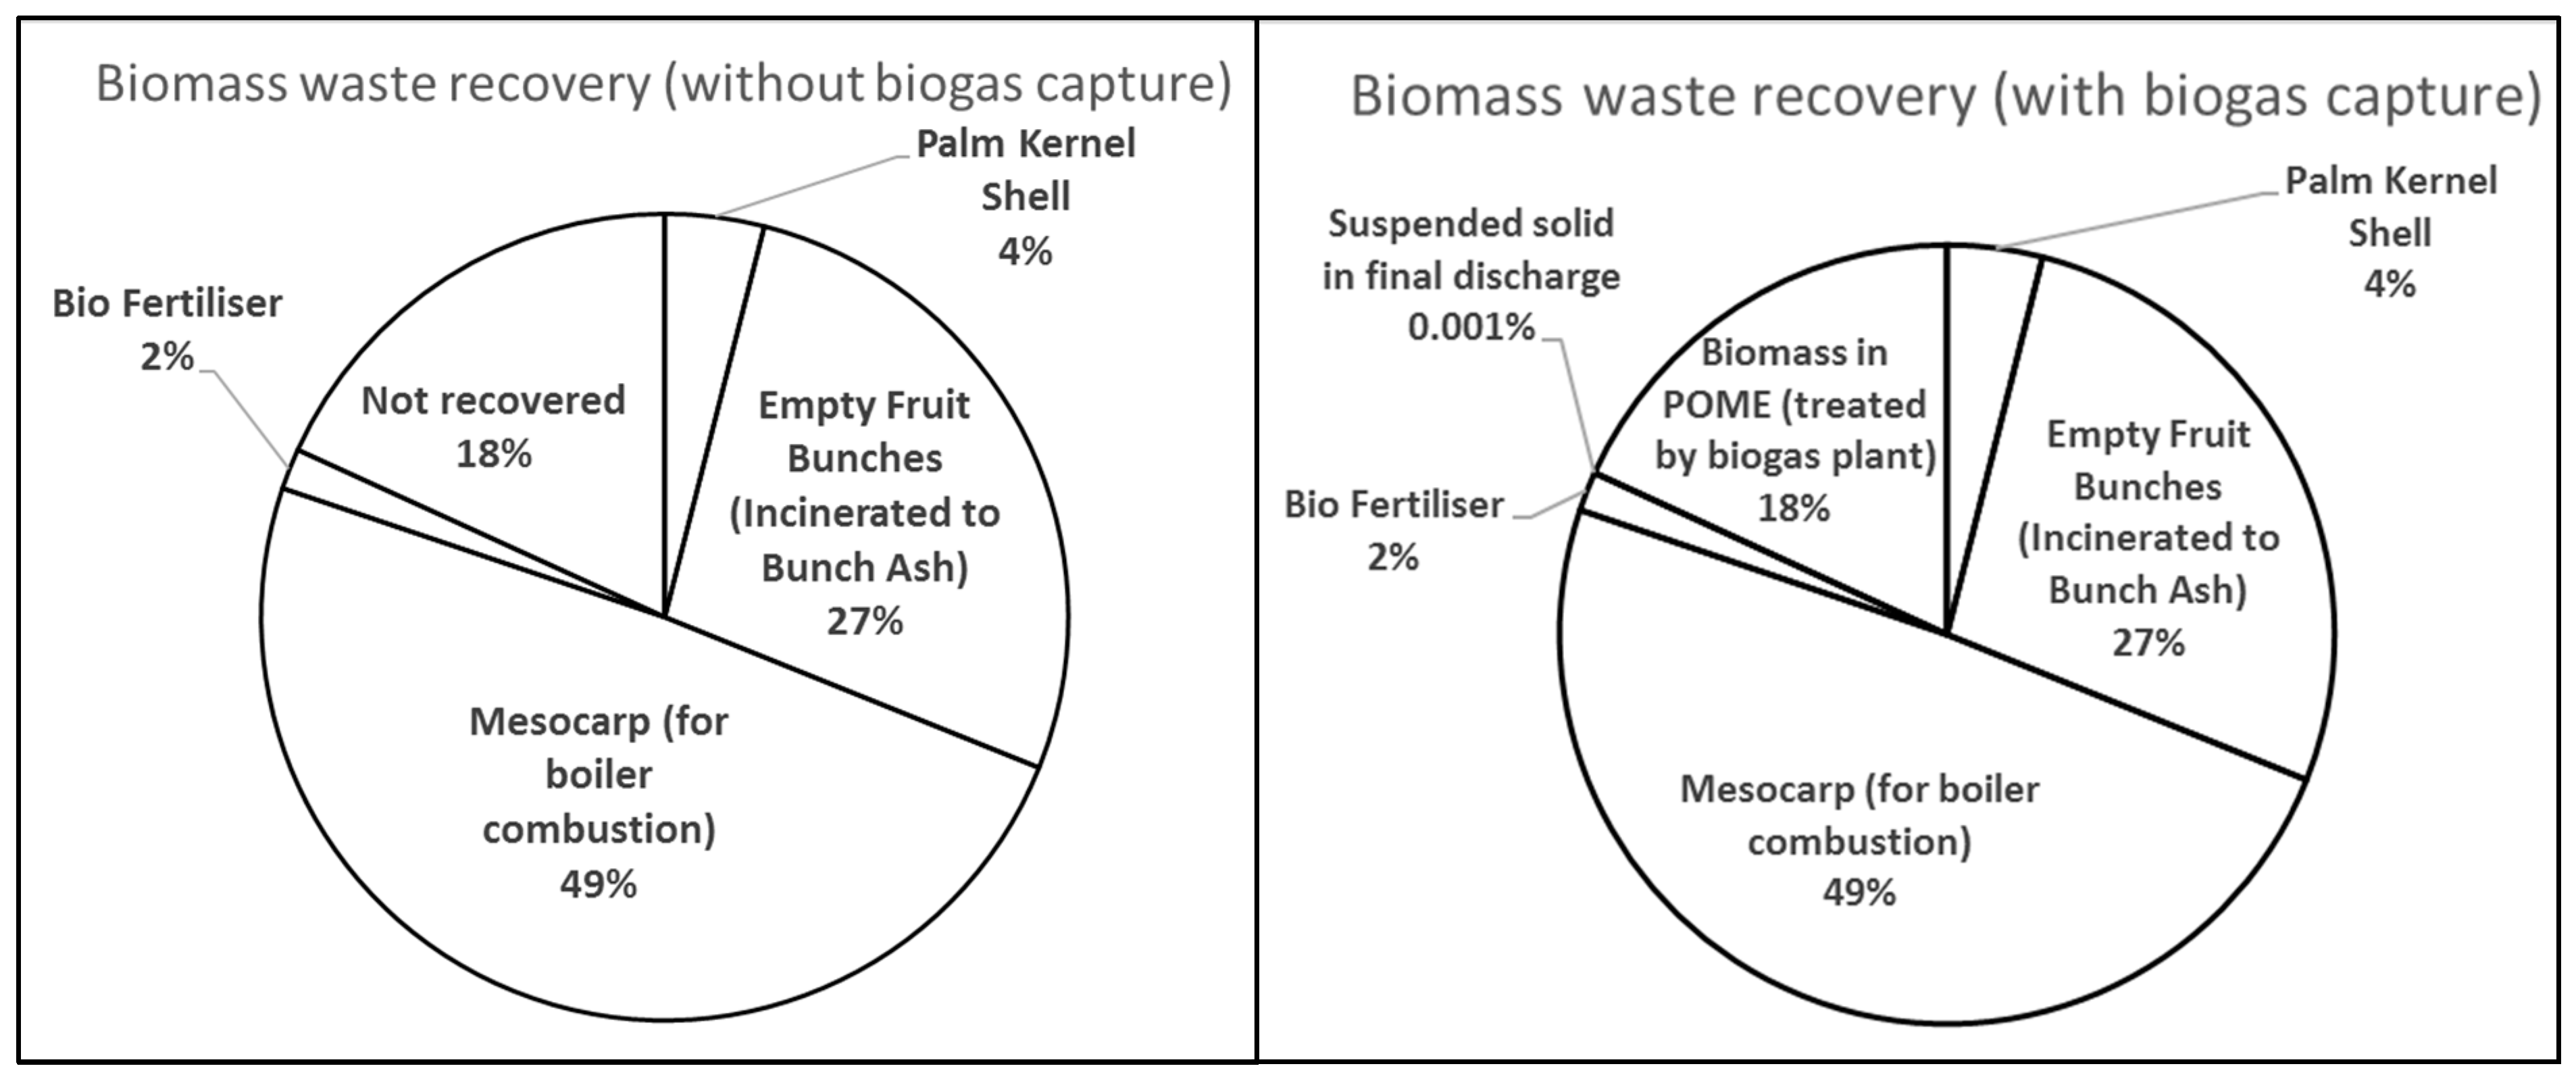
Figure 5.
Effects of total debts reduction on SGR, AGR, and their deviation.

Figure 6.
Effects of dividend increment on SGR, AGR, and their deviation.

Figure 7.
Effects of sales and net income increments on SGR, AGR, and their deviation.

Table 1.
Comparing performance measures of supply chain with and without the biogas trapping system.
Table 1.
Comparing performance measures of supply chain with and without the biogas trapping system.
| Sust. Obj. | Headline Performance Indicator (HPI) * | Key Performance Indicator (KPI) * | Performance Measures (PM) * | PM Values without Biogas Trapping | PM Values with Biogas Trapping | |||
|---|---|---|---|---|---|---|---|---|
| Env. | 1 | Natural Capital Conservation | 1.1 | Climate Change | 1.1.1 | GHG Emission (kgCO2eq per tonne CPO) | 0.814 | 0.196 |
| 1.2 | Air, Water and Soil Quality | 1.2.1 | NOx emission intensity from palm oil mill | 0 | 0 | |||
| 1.2.2 | Biological Oxygen Demand of water discharged from POME pond | 22.25 | 17 | |||||
| 1.2.3 | Soil Nitrate Level measured through pH in waterway | 92 | 92 | |||||
| 1.3 | Waste Generation | 1.3.1 | % biomass waste recovery/recycling | 81.809% | ≈100% | |||
| 1.4 | Biodiversity | 1.4.1 | Plantation Practice (Number of best practices met) | 3.5/6 | 3.5/6 | |||
| 1.4.2 | Land Use | Planted on formal agricultural land | Planted on formal agricultural land | |||||
| 1.4.3 | Species loss | 12% voted 1, 5% voted 2, 39% voted 3, 34% voted 4, 10% voted 5 | 12% voted 1, 5% voted 2, 39% voted 3, 34% voted 4, 10% voted 5 | |||||
| 1.5 | Resources Consumption | 1.5.1 | Energy (Fossil fuel and biomass) consumption intensity (Output/Input energy ratio) | 2.45 | 2.56 | |||
| Eco. | 2 | Business Continuity and Resiliency | 2.1 | Productivity efficiency | 2.1.1 | Plantation yield (tonne FFB/hectare) | 25.55 | 25.55 |
| 2.1.2 | Mill production efficiency (tonne CPO per tonne FFB) | 0.2196 | 0.2196 | |||||
| 2.2 | Business Continuity | 2.2.1 | Actual Growth Rate (deviation from sustainable growth rate) | −4% | −7% | |||
| 3 | Sharing of Economic Power | 3.1 | Relative Poverty | 3.1.1 | Average annual income per worker (% of national average income) | 26.95 | 26.95 | |
| 3.2 | Local community inclusion and distribution of wealth | 3.2.1 | Employment opportunity for the local (% of local employment) | 31.33 | 31.33 | |||
| 3.2.2 | Smallholders’ equity | 10% | 10% | |||||
| Soc. | 4 | Social Wellbeing | 4.1 | Meeting Essential Human Needs | 4.1.1 | Workers’ accessibility to water supply | 100% | 100% |
| 4.1.2 | Workers’ accessibility to health care | 100% | 100% | |||||
| 4.1.3 | Provision of sanitation facilities to workers | 100% | 100% | |||||
| 4.1.4 | Provision of housing facilities to workers | 100% | 100% | |||||
| 5 | Social Equity | 5.1 | Local community empowerment and engagement | 5.1.1 | Sharing of information with the local community | 32% voted 1, 10% voted 2, 36% voted 3, 22% voted 4, 0% voted 5 | 32% voted 1, 10% voted 2, 36% voted 3, 22% voted 4, 0% voted 5 | |
| 5.1.2 | Fair Partnership and Community involvement in decision making | 19% voted 1, 20% voted 2, 29% voted 3, 27% voted 4, 5% voted 5 | 19% voted 1, 20% voted 2, 29% voted 3, 27% voted 4, 5% voted 5 | |||||
| 5.1.3 | Level of community acceptance to plantation and mill activities | 85% agreement | 85% agreement | |||||
* These HPIs, KPIs and PMs sourced from authors’ papers on POSA framework [26]. Shaded in grey are PMs affected by the introduction of the biogas trapping system. ** It is worth mentioning that an LCA approach that follows ISO14040-44 [34,35], was only used to measure the carbon footprint/life cycle GHG emissions as the estimation of this indicator requires all upstream and downstream data.
Table 2.
GHG emissions from crude palm oil supply chains with and without a biogas trapping facility.
Table 2.
GHG emissions from crude palm oil supply chains with and without a biogas trapping facility.
| Source of Emission | GHG Emission (kgCO2eq) | |||
|---|---|---|---|---|
| Without Biogas Trapping | With Biogas Trapping | |||
| Smallholder FFB | 1.47 × 10⁶ | 2.77% | 1.47 × 10⁶ | 11.48% |
| Large Plantation FFB | 9.82 × 10⁶ | 18.49% | 9.82 × 10⁶ | 76.55% |
| Water | 1.23 × 10² | 0.00% | 1.23 × 10² | 0.00% |
| Fossil Fuel consumed by mill | 1.50 × 10⁶ | 2.83% | 1.50 × 10⁶ | 11.73% |
| Methane from POME | 4.03 × 10⁷ | 75.86% | N/A | N/A |
| Chemical for Water Treatment Plant | 2.45 × 10⁴ | 0.05% | 2.45 × 10⁴ | 0.19% |
| Chemical for biogas/polishing plant | N/A | N/A | 6.21 × 10³ | 0.05% |
| Total | 5.31 × 10⁷ | 100.00% | 1.28 × 10⁷ | 100.00% |
Table 3.
Comparing financial status before and after BGPP investment.
| ID | Description | Formula | Unit | Without BGPP | With BGPP |
|---|---|---|---|---|---|
| a. | Sales figure from starting point | RM | 11,547,410 | 11,547,410 | |
| b. | Most recent sales figure | RM | 12,199,346 | 12,576,410 | |
| c. | Total Sales throughout the year | RM | 177,959,338 | 182,484,110 | |
| d. | Total Assets at year end | RM | 70,737,661 | 82,337,661 | |
| e. | Dividend | RM | 4,282,930 | 5,569,167 | |
| f. | Net Income | RM | 9,392,273. | 13,437,045 | |
| g. | Total Debt at year end | RM | 40,123,436 | 51,723,436 | |
| h. | Total Assets at year end | RM | 70,737,661 | 82,337,661 | |
| i. | Asset Utilization Rate | c/d | % | 252% | 222% |
| j. | Profitability Rate | f/c | % | 5% | 7% |
| k. | Financial Utilization Rate | g/l | % | 131% | 169% |
| l. | Total Equity | h - g | RM | 30,614,225 | 30,614,225 |
| m. | Return on Equity | I* j* k | 0.17 | 0.28 | |
| n. | Dividend Rate | e/f | % | 45.60% | 41.45% |
| o. | Business Retention Rate | 1 - n | % | 54.40% | 58.55% |
| p. | Sustainable Growth Rate | m * o | % | 10% | 16% |
| q. | Actual Growth Rate | (b - a)/a | % | 6% | 9% |
| r. | Actual Growth Rate deviation from Sustainable Growth Rate | q - p | % | −4% | −7% |
Table 4.
Sustainability assessment of crude palm oil supply chain with biogas trapping using POSA framework.
Table 4.
Sustainability assessment of crude palm oil supply chain with biogas trapping using POSA framework.
| Sust. Obj. | Headline Performance Indicator | Key Performance Indicator | Performance Measures | Ranking for PM | Overall Weight for PM | Score for KPI | Score for HPI | Score for Sust. Obj. | Score for Overall Sust. | |||
|---|---|---|---|---|---|---|---|---|---|---|---|---|
| Env. | 1 | Natural Capital Conservation | 1.1 | Climate Change | 1.1.1 | GHG Emission | 4(2) | 0.045 | 4.00 | 3.54 (2.94) | 3.54 (2.94) | 3.59 (3.47) |
| (2.00) | ||||||||||||
| 1.2 | Air, Water and Soil Quality | 1.2.1 | NOx emission intensity from palm oil mill | 5(5) | 0.0393 | 5.00 (5.00) | ||||||
| 1.2.2 | Biological Oxygen Demand of water discharged from POME pond | 5(5) | 0.0447 | |||||||||
| 1.2.3 | Soil Nitrate Level measured through pH in waterway | 5(5) | 0.0444 | |||||||||
| 1.3 | Waste Generation | 1.3.1 | % Biomass waste recovery/recycling | 5(4) | 0.045 | 5.00 (4.00) | ||||||
| 1.4 | Biodiversity | 1.4.1 | Plantation Practice | 2(2) | 0.0463 | 2.68 (2.68) | ||||||
| 1.4.2 | Land Use | 3(3) | 0.0447 | |||||||||
| 1.4.3 | Species loss | 3(3) | 0.0538 | |||||||||
| 1.5 | Resources Consumption | 1.5.1 | Energy (Fossil fuel and biomass) consumption intensity (Output/Input energy ratio) | 1(1) | 0.0415 | 1.00 (1.00) | ||||||
| Eco. | 2 | Business Continuity and Resiliency | 2.1 | Productivity efficiency | 2.1.1 | Plantation yield | 5(5) | 0.0476 | 5.00 (5.00) | 4.00 (4.50) | 2.88 (3.13) | |
| 2.1.2 | Mill production efficiency | 5(5) | 0.0485 | |||||||||
| 2.2 | Business Continuity | 2.2.1 | Actual Growth Rate | 3(4) | 0.0447 | 3.00 (4.00) | ||||||
| 3 | Sharing of Economic Power | 3.1 | Relative Poverty | 3.1.1 | Average annual income per worker | 2(2) | 0.0452 | 2.00 (2.00) | 1.76 (1.76) | |||
| 3.2 | Local community inclusion and distribution of wealth | 3.2.1 | Employment opportunity for the local | 2(2) | 0.0471 | 1.52 (1.52) | ||||||
| 3.2.2 | Smallholders’ equity | 1(1) | 0.0439 | |||||||||
| Soc. | 4 | Social Wellbeing | 4.1 | Meeting Essential Human Needs | 4.1.1 | Workers’ accessibility to water supply | 5(5) | 0.0471 | 5.00 (5.00) | 5.00 (5.00) | 4.34 (4.34) | |
| 4.1.2 | Workers’ accessibility to health care | 5(5) | 0.0476 | |||||||||
| 4.1.3 | Provision of sanitation facilities to workers | 5(5) | 0.0474 | |||||||||
| 4.1.4 | Provision of housing facilities to workers | 5(5) | 0.046 | |||||||||
| 5 | Social Equity | 5.1 | Local community empowerment And engagement | 5.1.1 | Sharing of information with the local community | 3(3) | 0.0425 | 3.68 (3.68) | 3.68 (3.68) | |||
| 5.1.2 | Fair Partnership and Community involvement in decision making | 3(3) | 0.0433 | |||||||||
| 5.1.3 | Level of community acceptance to plantation and mill activities | 5(5) | 0.0444 | |||||||||
© 2019 by the authors. Licensee MDPI, Basel, Switzerland. This article is an open access article distributed under the terms and conditions of the Creative Commons Attribution (CC BY) license (http://creativecommons.org/licenses/by/4.0/).
Share and Cite
MDPI and ACS Style
Lim, C.I.; K. Biswas, W. Sustainability Implications of the Incorporation of a Biogas Trapping System into a Conventional Crude Palm Oil Supply Chain. Sustainability 2019, 11, 792. https://doi.org/10.3390/su11030792
AMA Style
Lim CI, K. Biswas W. Sustainability Implications of the Incorporation of a Biogas Trapping System into a Conventional Crude Palm Oil Supply Chain. Sustainability. 2019; 11(3):792. https://doi.org/10.3390/su11030792
Chicago/Turabian StyleLim, Chye Ing, and Wahidul K. Biswas. 2019. "Sustainability Implications of the Incorporation of a Biogas Trapping System into a Conventional Crude Palm Oil Supply Chain" Sustainability 11, no. 3: 792. https://doi.org/10.3390/su11030792
Note that from the first issue of 2016, this journal uses article numbers instead of page numbers. See further details here.