Article

The Influence of River Channel Occupation on Urban Inundation and Sedimentation Induced by Floodwater in Mountainous Areas: A Case Study in the Loess Plateau, China

1
Yellow River Institute of Hydraulic Research, Yellow River Conservancy Commission, Zhengzhou 450003, China
2
Key Laboratory of the Loess Plateau Soil Erosion and Water Process and Control, Ministry of Water Resources, Zhengzhou 450003, China
3
Institute of Geographic Sciences and Natural Resources Research, Chinese Academy of Sciences, Beijing 100101, China
4
Hydrology and Water Resources Institute, Hohai University, Nanjing 210000, China
*
Author to whom correspondence should be addressed.
Sustainability 2019, 11(3), 761; https://doi.org/10.3390/su11030761
Submission received: 14 December 2018 / Revised: 20 January 2019 / Accepted: 28 January 2019 / Published: 1 February 2019
(This article belongs to the Special Issue Hydrometeorological Hazards and Disasters)

Abstract

:
River channel occupation has made cities in the mountainous areas more vulnerable to floodwater out of river channels during rapid global urbanization. A better understanding of the influence of river channel occupation on urban flood disasters can serve as a reference in planning effective urban flood control strategies. In this study, taking a flood event that occurred on July 26th, 2017 in a city on the Loess Plateau as an example, field surveys, dynamics detection of the river channel using remote sensing technology, and scenario simulations with a two-dimensional flow and sediment model were utilized to quantitatively analyze the impacts of river channel occupation on urban inundation and sedimentation. The results show that river channel dynamics reduced by construction can be successfully detected using the combination of high-resolution images and Landsat time-series images. The variation of the water level–discharge relationship caused by the narrowing of the river channel and the increase of the flood-water level caused by water-blocking bridges/houses result in a significant reduction of the flood discharge capacity. The contribution of the narrowing of the river channel was 72.3% for the total area inundated by floodwater, whereas 57.2% of urban sedimentation was caused by the construction of bridges/houses within the river channel. Sustainable flood mitigation measures were also recommended according to the investigations and research findings in this study in order to reduce the social, environmental and economic damages caused by floods.

1. Introduction

Urbanization is an integral element of rapid income growth and industrialization throughout the world, and it changes population distribution, production modes, life-styles, and the ecological environment [1]. In the past three decades, China’s urbanization has been a notable event that has attracted widespread global attention [2,3]. As the economy grows, China is experiencing a vigorous rural–urban migration and expansion of cities [4,5]. The number of cities reached 657 by the end of 2012—an increase of 431 compared to 1981 [6]. This urbanization process brought immense urban land expansion. The total urban built-up land area expanded by 513%, from 7438 km2 to 45,566 km2, and the annual rate of increase reached 6% between 1981 and 2012 [7]. The country’s urbanization has brought about remarkable achievements; however, economy-centered urbanization also triggered a series of ‘urban diseases’ [8,9,10,11,12], which prevents such urbanization from being sustainable.
Currently, flood and water-logging are occurring with an increasing frequency during the process of rapid urbanization, which is a serious global problem [13]. When water-logging and floods happen, they cause serious urban flood losses; e.g., serious casualties and property losses, the destruction transport and communication, epidemic disease, the pollution of drinking water and damage to the living environment [14,15,16]. In China, the annual economic loss caused by flooding has been over 100 billion RMB since the 1990s, which is roughly equivalent to 1.5% of the annual average gross national product during the same period [17,18]. It was reported that 62% of Chinese cities experienced water-logging and flood disasters during 2008–2010, and 137 cities experienced these more than three times during that period [19].
Research and practice in the last decades has shown that urbanization has an adverse impact on the urban hydrological processes, such as the expansion of impervious areas accelerating runoff flow velocity and enlarging peak flow and runoff volume, resulting in increased risk of urban flood and water-logging [20]. In order to mitigate urban water-logging and flood disasters and reduce the flood losses, a large number of researchers have explored the quantitative impacts of urbanization on urban hydrological processes under extreme precipitation using the combination of field observations and hydrodynamic and hydrological models [21,22,23,24,25,26,27]. In addition, urban flooding risk assessment methods were developed based on various risk assessment theories [28]; e.g., the risk matrix method [29].
Currently, the studies of urban flooding have mainly focused on the floods occurring in metropolitan regions. In these regions, it was demonstrated that the dominant cause of urban flood disasters is water-logging induced by impeded drainage systems and extreme rainfall [21,22,23,24,25,26,27,28]. However, flood disasters occurring in small mountainous cities are significantly different from those of large cities [30]. Due to the terrain restrictions of mountainous areas, numerous small cities are constructed in the plain areas near to the river systems; consequently, the river terrace and flood plain are usually occupied by building construction to meet the demand of urban development. This occupied river channel increases the risk of urban flood disasters induced by floodwater out of the river channel when heavy rainstorms occur. In addition, the severe soil erosion in the mountainous region results in the transport of vast amounts of sediment into the river channel [31], and the cities near to the river channels are therefore seriously threatened not only by the inundation but also the sedimentation from floodwater. The destruction caused by sedimentation is much more severe than water inundation for the urban operating mechanisms and ecological environment; thus, small cities in mountainous areas are more vulnerable than metropolitan cities in the face of rainstorm floods.
Investigating the impact of river channel occupation on urban flood disasters during the urbanization process is critical for making effective plans and implementing measures to mitigate flood disaster and achieve sustainable urban development in rural mountainous areas. In recent years, the intimate connection between the variation of river channels and the watershed floods has been paid increasing attention [32,33,34]. Deng et al. [33] discovered that urbanization has significantly altered the flood regulation function of river systems in the Taihu Basin, eastern China, which has led to an increased flood risk for urban cities. However, few studies have quantitatively explored the role of river channel occupation on urban flood disasters for small cities in mountainous areas. Long-term satellite observations and efficient flood modeling are beneficial tools for river channel dynamics and the impact assessment of river channel variation on urban flood disasters. In this study, a torrential storm flood event that occurred on 26th July 2017 in Suide County, which is a typical small city on the Loess Plateau, China, was taken as an example. The main objectives of this study are to (1) develop a detection method for river channel dynamics caused by urbanization; (2) assess the quantitative impacts of river channel occupancy on rainstorm flood disasters using two-dimensional flow and sediment hydrodynamic modeling; (3) reveal the underlying reasons for the increased risk of urban flood disasters caused by river channel occupation.

2. Study Area and Data

2.1. Study Area

Suide County is located southeast of Yulin City in Shaanxi Province, which is between 110°04′ E–110°41′ E and 37°16′ N–37°45′ N, as shown in Figure 1. The county has a temperate continental semi-arid climate with an annual rainfall of 386 mm and an average annual temperature of 9.7 °C. Due to its location at the junction of Wuding River and Dali River, which are main tributaries of the Yellow River, and as a typical girder-shaped loess hilly and gully region of the Loess Plateau, most of the buildings in the county were constructed along the river banks; therefore, the terrain condition is an increasingly significant limiting factor for urban expansion.
From 8:00 p.m. on 25 July to 8:00 a.m. on 26 July 2017, a catastrophic rainstorm flood occurred in Suide County, with a precipitation of 252 mm within 12 h. This rainstorm flood is the largest flood in the historical records of the Wuding River and Dali River. In this flood event, a total of 135,000 people were affected, built-up areas in the county were buried by water and sediment from the river flood, and a large number of factories, croplands, bridges, buildings and roads were seriously destroyed. It was reported that this flood disaster caused direct economic losses amounting to nearly 2.26 billion RMB.

2.2. Satellite Remote Sensing Data

In this study, we collected 28 epochs (Path127/Row34) of Landsat TM/ETM+/OLI satellite images (L1T) from 1990 to 2017, as illustrated in Table 1. All Landsat images with low cloud cover (<10%) during the vegetation growing season (June–October) were acquired from the USGS Landsat archive (https://earthexplorer.usgs.gov/). The FLAASH model of ENVI software was employed to derive the surface reflectance of Landsat time-series images, while the aerosol and water vapor correction modules were set empirically [35]. In addition, multi-temporal high-resolution satellite images were also acquired, including SPOT-5 imagery (3-m) from September 2004, Gaofen-2 (GF-2) imagery (1-m) from July 2017, as shown in Table 1.

2.3. Field Survey Data

Field surveys were conducted at Suide County in October 2017. The water and sedimentation observations at the Suide and Dingjiagou gauging stations (Figure 2) were obtained from the Water Affairs Bureau. A digital line graphic (DLG) of the topographic contours and river bank protection with a measuring scale of 1:5000 in the 2010s was collected from the Land and Resources Bureau. A survey of urban flood inundation was conducted along the main streets in the Suide County. For buildings with obvious flood traces, the flood inundation depth and sedimentary thickness were measured using a tape measure. The geographical coordinates of 71 field measurement sites were recorded using GPS, as illustrated in Figure 2.
In addition, the river channel was surveyed along the roads adjacent to the Dali River and Wuding River, and both handheld cameras and unmanned aerial vehicles (UAV) were employed to take pictures of the river channel. At the same time, GPS was used to record the geographical coordinates of water-blocking buildings and bridges within the river channels, and the geometrical parameters of the buildings and bridges were measured using a laser rangefinder (Leica), as shown in Figure 2. There are 11 bridges distributed in the urban area, and the density of the bridges is 1.5 bridges/km, with the average distance between the bridges being less than 800 meters; eight of them are arch bridges whose structure has a large water-blocking area, as shown in Table 2. Water-blocking houses are mainly located near the Junmin Bridge and the Diaoyin Bridge. The average width of the occupied river channels is about 15 m, and the total length of the occupied river channels is 1060 m.

3. Methodology

In this study, an evaluation strategy was proposed to assess the influences of river channel occupation on urban inundation and sediment deposition induced by flood water, as illustrated in Figure 3. A river channel dynamic detection algorithm was developed using the combination of high-resolution imagery and Landsat normalized difference vegetation index (NDVI) time-series. A two-dimensional water and sediment hydrodynamic model for the river channels of tributaries of the Yellow River was then employed and calibrated based on field observations of flood events. Consequently, scenario simulations were conducted to calculate the contributions of different river channel occupations on urban flood disasters.

3.1. River Channel Dynamic Detection Using NDVI Time-Series And High-Resolution Imagery

In this study, all Landsat TM/ETM+/OLI images acquired from 1990 to 2017 (Table 1) were used to construct the normalization difference vegetation index (NDVI) time-series dataset. The NDVI is defined as follows [36]:
NDVI = NIR R NIR + R
where NIR is the surface reflectance of the near-infrared band, and R is the surface reflectance of the red band.
GF-2 satellite images acquired in 2017 and GIS on-screen manual digitization tools were firstly employed to visually delineate the built-up area boundary and river channel boundary in Suide County according to the brightness and texture of different land cover types [37,38].
In this region, local farmers have been growing crops in the riparian area as a result of the local terrain restrictions and convenient irrigation; therefore, the land cover type of the original riparian area later occupied for urban construction used to be cropland. Based on this prior acknowledge, a total number of 214 pixels with a conversion from cropland into built-up area in the riparian area were selected as samples based on the SPOT imagery acquired in 2004 and GF-2 imagery acquired in 2017 in order to assess the accuracy of the detection result.
By comparing the histograms of NDVI for the cropland and built-up area samples, it was found that the threshold value of 0.21 was optimal for separating these two classes [37,39]. The pixels with an NDVI value above 0.21 were assigned as non-built-up. For each pixel, the NDVI time-series of the pixels within the built-up area interpreted by GF-2 high-resolution images were assessed by referencing the detection rules of the previous study of Wang et al. [40], as follows.
From the beginning of 2017, if there was vegetation in the ith year, and there were at least two years with vegetation cover from (i − 4)th year to the ith year, the ith year was defined as the final year of the vegetation coverage period, and the (i + 1)th year was defied as the beginning year of river channel occupation for urban construction.
The NDVI time-series dynamics for a sample pixel are shown in Figure 4. The year of destruction of crops detected by NDVI time-series is 2006, which is consistent with the remarkable visual distinction from vegetation (dark red) to built-up land (bright white) interpreted from multi-temporal Landsat images with pseudo-color (RGB:432). Therefore, the period (2006–2017) with the occupation of the river channel was accurately detected by the proposed algorithm.

3.2. Calculation of Urban Inundated Area and Sedimentation Based on Field Survey Data

In this study, the inundated area caused by this flood event was determined according to field survey data of 71 sites and high-resolution images. Due to the fact that there was a great discrepancy between the sediment depths for different sections within the inundated area, we divided the entire inundated area into five sections: Wuliwan Bridge–Zhangjiabiancun Bridge, Zhangjiabiancun Bridge–Diaoyin Bridge, Diaoyin Bridge–Dali River Bridge, Dali River Bridge–Qianshi Bridge, and Qianshi Bridge–Longfeng Bridge. The co-kriging method [41] was then used to spatially interpolate the sediment thickness in each section, and the high-accuracy DEM (1:5000) in the urban region was employed as a covariate. It should be noted that the calculated values of the flood-inundated area and sediment deposition were taken as the ‘true value’ for calibrating and validating the Yellow River Conservancy Commission of the Ministry of Water Resources in China (YRCC2D) model.

3.3. Simulation of Urban Inundation and Sedimentation Using the YRCC2D Model

3.3.1. Two-Dimensional Flow and Sediment Hydrodynamic Model

In this study, the water and sediment evolution process of the flood was simulated using the two-dimensional flow and sediment hydrodynamic model developed by the YRCC2D [42]. In this model, two-dimensional shallow water equations for depth-averaged continuity and momentum conservation are as follows [42]:
h t + ( h u ) x + ( h v ) y = 0
( h u ) t + ( h u 2 + g h 2 / 2 ) x + ( h u v ) y = v t [ 2 ( h u ) x 2 + 2 ( h u ) y 2 ] g h ( S o x + S f x )
( h v ) t + ( h v 2 + g h 2 / 2 ) y + ( h u v ) x = v t [ 2 ( h v ) x 2 + 2 ( h v ) y 2 ] g h ( S o y + S f y )
S o x = z b x , S o x = z b y , S f x = n 2 u u 2 + v 2 h 4 / 3 , S f y = n 2 v u 2 + v 2 h 4 / 3
where h is water depth; zb is bed elevation; g is the gravitational acceleration; u, v are the depth-averaged velocities in x and y directions, respectively; Sox and Soy are the bottom-slope source terms in x and y directions, respectively; Sfx and Sfy are the bottom-slope friction source terms in x and y directions, respectively; and the dimensionless coefficient of n is used to represent bed roughness, which is calibrated based on field observations [42].
Turbulent viscosity νt is modeled with the zero-equation turbulence model,
ν t = A x y C s u * h ,
where h is water depth, Axy is a calibrated parameter with a range of 1–10, frictional velocity u * = 6.47 cm/s, and empirical constant Cs = 1/6 [43].
The suspended sediment transport is computed using the formula of flow sediment carrying capacity proposed by Yu et al. [44] in the following manner:
S k = k 0 μ r α [ ω k ω ( p k + p u k ) ] β ( U 3 γ s γ γ g R ω k ) m
where μr represents the dynamic viscosity coefficient, which is calculated by the formula proposed by Fei et al. [45]; Pk and Puk are the gradation of the suspended and bed sediment, respectively; ω k and ω are settling velocities of uniform and mixed sediment, respectively, which are determined according to the lookup table describing the relationship between the settling velocity and gradation of suspended sediment [44]; U is flow velocity; γ s and γ are the volume-weights of the sediment and water, respectively, γ s = 2650 kg/m3, γ = 1000 kg/m3; R represents hydraulic radius; α, β are the empirical constants, α = 6.1962, β = 0.0433 [44]; and k0 and m are calibrated parameters.

3.3.2. Numerical Simulation Using YRCC2D Model

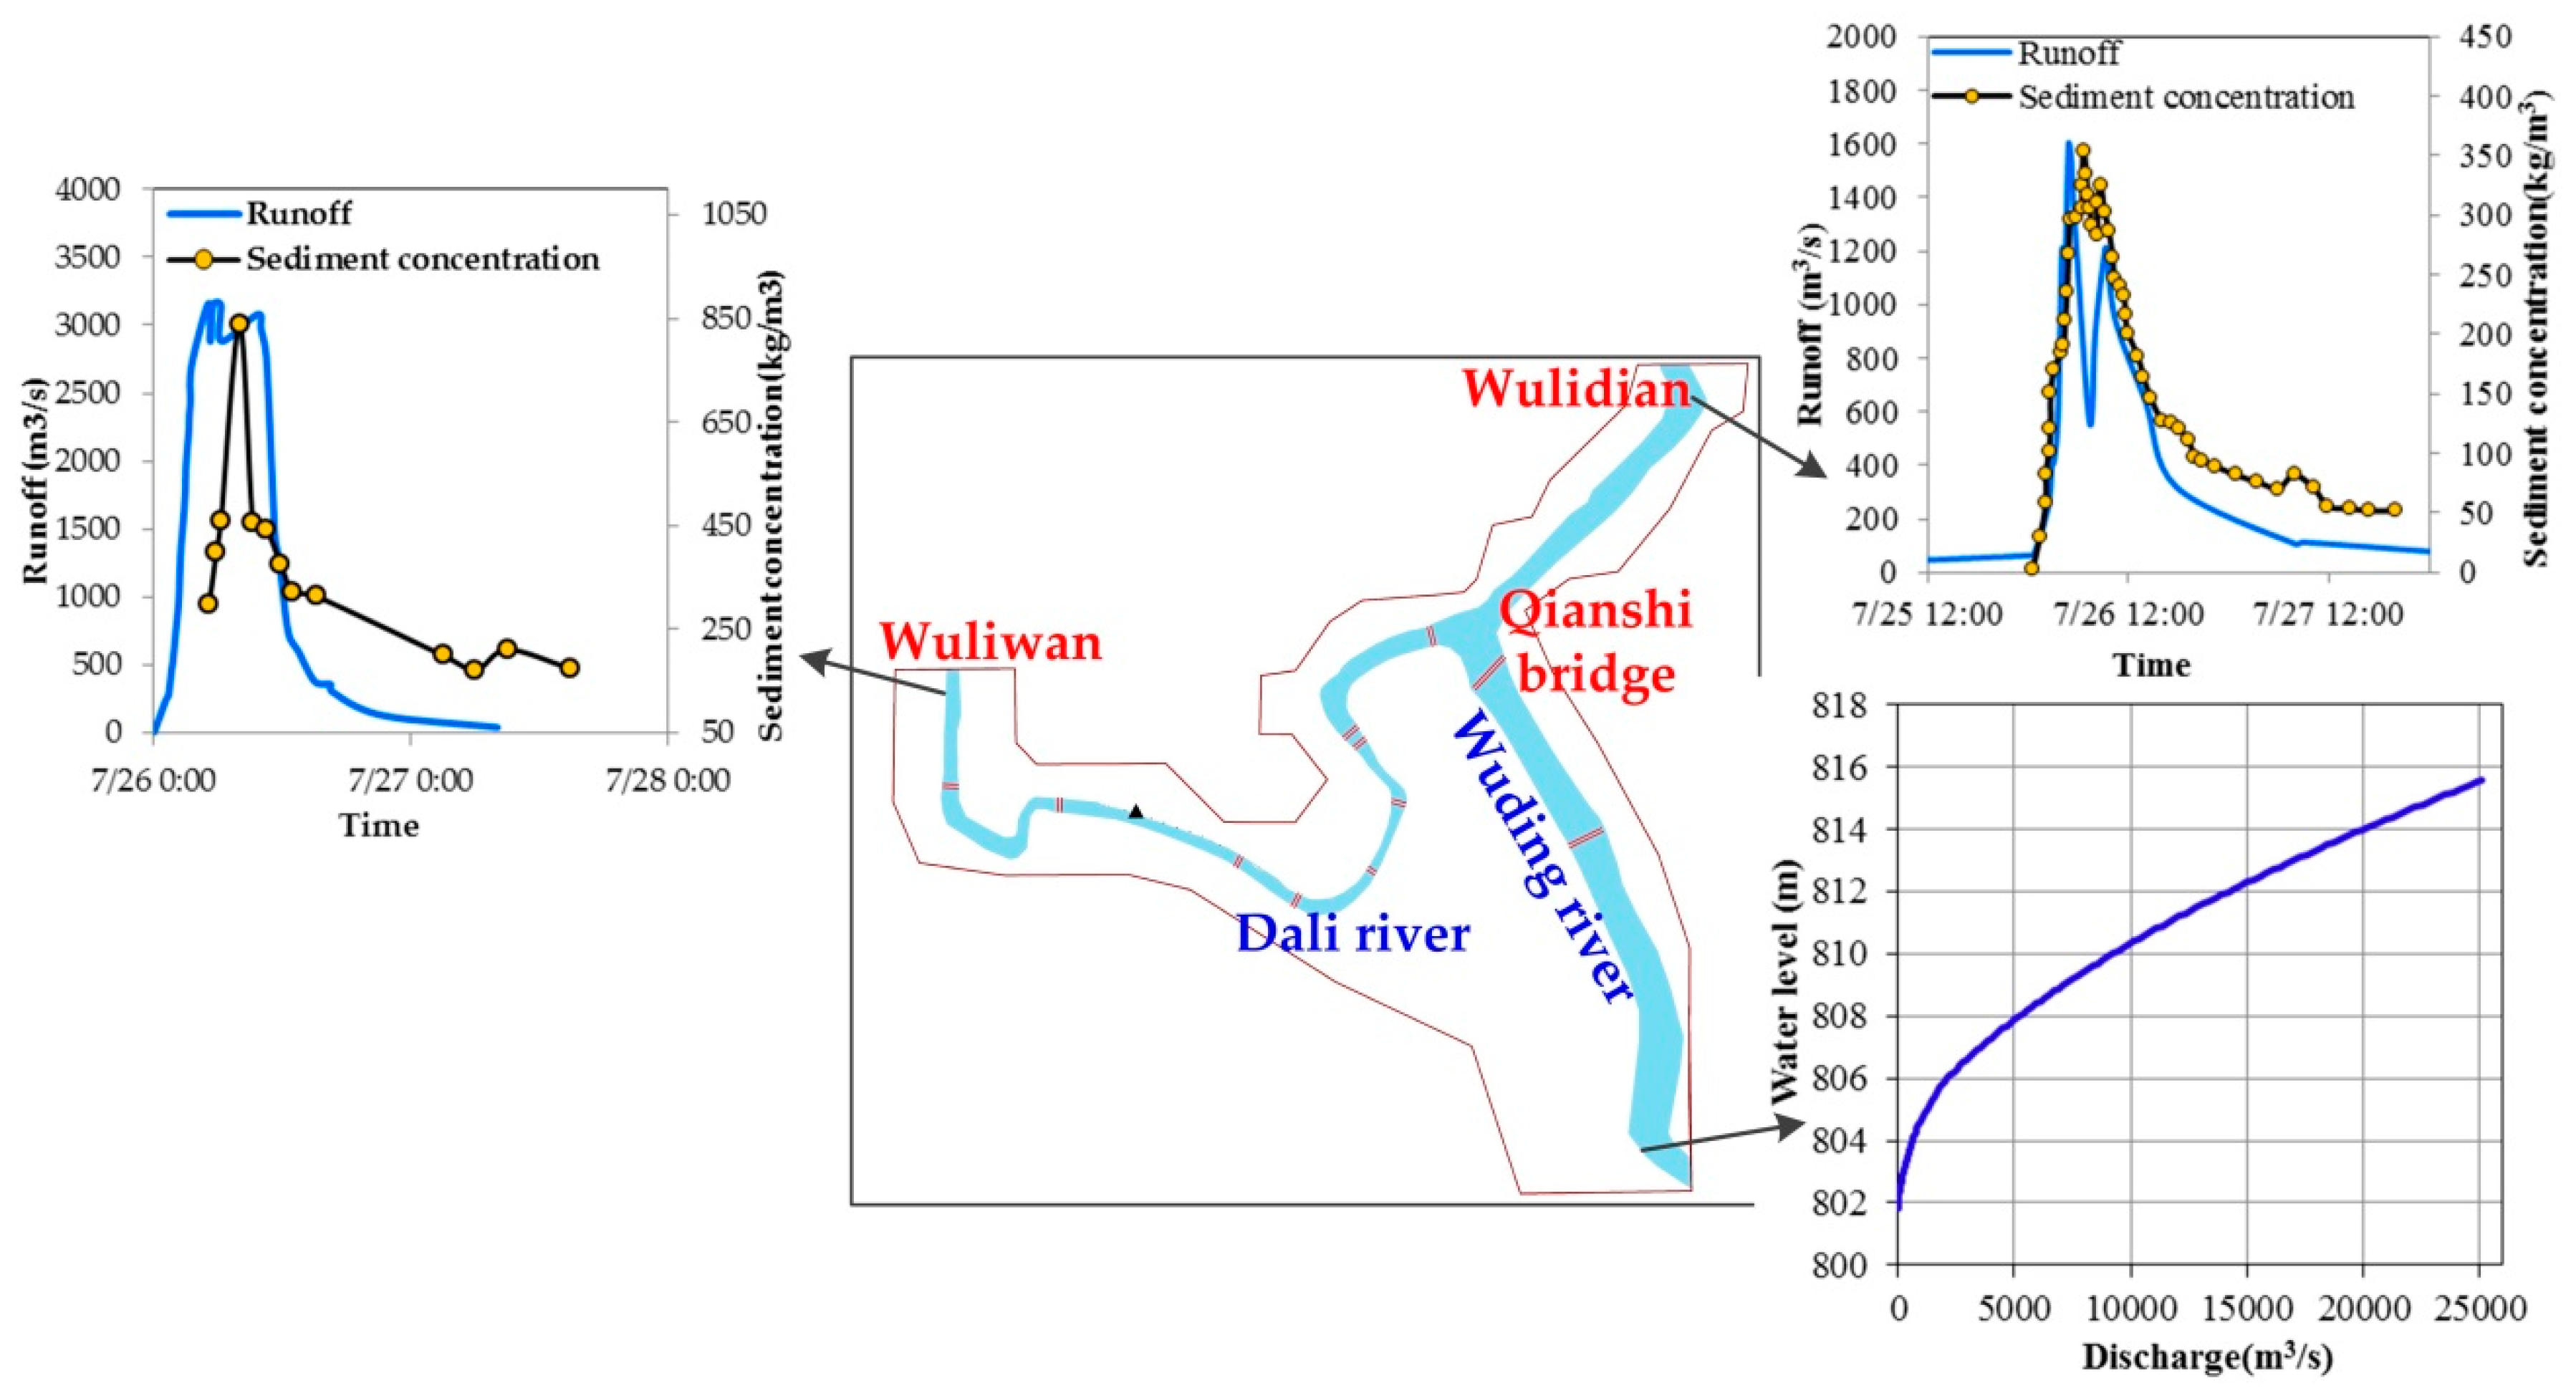
According to the spatial domain of the available river channel and urban topographic map, the scope of calculation for this study is defined as follows: Wuliwan bridge is the inlet of the Dali River, the location 3.5 km downstream of the Dingjiagou gauging station is the inlet of the Wuding River, and the location 3.98 km downstream from the junction of the Dali River and Wuding River is the outlet of the Wuding River, as illustrated in Figure 5. The water and sediment process data measured from 12:00 a.m. on 26 July 2017 to 12:00 a.m. on 27 July 2017 at the Suide and Dingjiagou gauging stations were used as the upper boundary conditions for the YRCC2D model. Due to the fact that there were no measured water and sediment data at the outlet of the scope, the water level–discharge relationship developed based on the terrain condition of the outlet section and the Manning formula [46] were employed as the lower boundary conditions for the YRCC2D model, as shown in Figure 5.
The initial gradation distribution of suspended and bed sediment used in the YRCC2D simulation is shown in Table 3 [42], and the sediment gradation changes with the variation of erosion and deposition of the riverbed during simulation processing. An initial value of the roughness n in the Equation (5) was set to 0.025 based on the historical studies in this area [42]. A triangular mesh with a maximum grid side length of 30 m was used for mesh generation in the non-river channel area, whereas a quadrilateral mesh was adopted for mesh generation in the river channels. The maximum grid side lengths in the river width direction for the Dali River and Wuding River are 6 m and 10 m, respectively, and the grid side length in the direction of water flow of both rivers is 30 m. Meanwhile, the density of the grid will be increased in the area near bridges and house construction; consequently, a total of 78,000 grid elements were constructed within the calculation range, as illustrated in Figure 6.
The key parameters of the YRCC2D model were then calibrated based on the calculated urban inundation area and sediment deposition derived from field survey data. In the simulation process, the water blocking section of the buildings located in the river channel was treated as an impervious section characterized by the measured spatial geometric parameters of the house or bridge. Consequently, two disaster indicators including the inundated area and sedimentation in the urban area were calculated based on the simulation results derived from YRCC2D.

3.4. Analysis of the Impacts of River Channel Occupations on Urban Flood Disasters

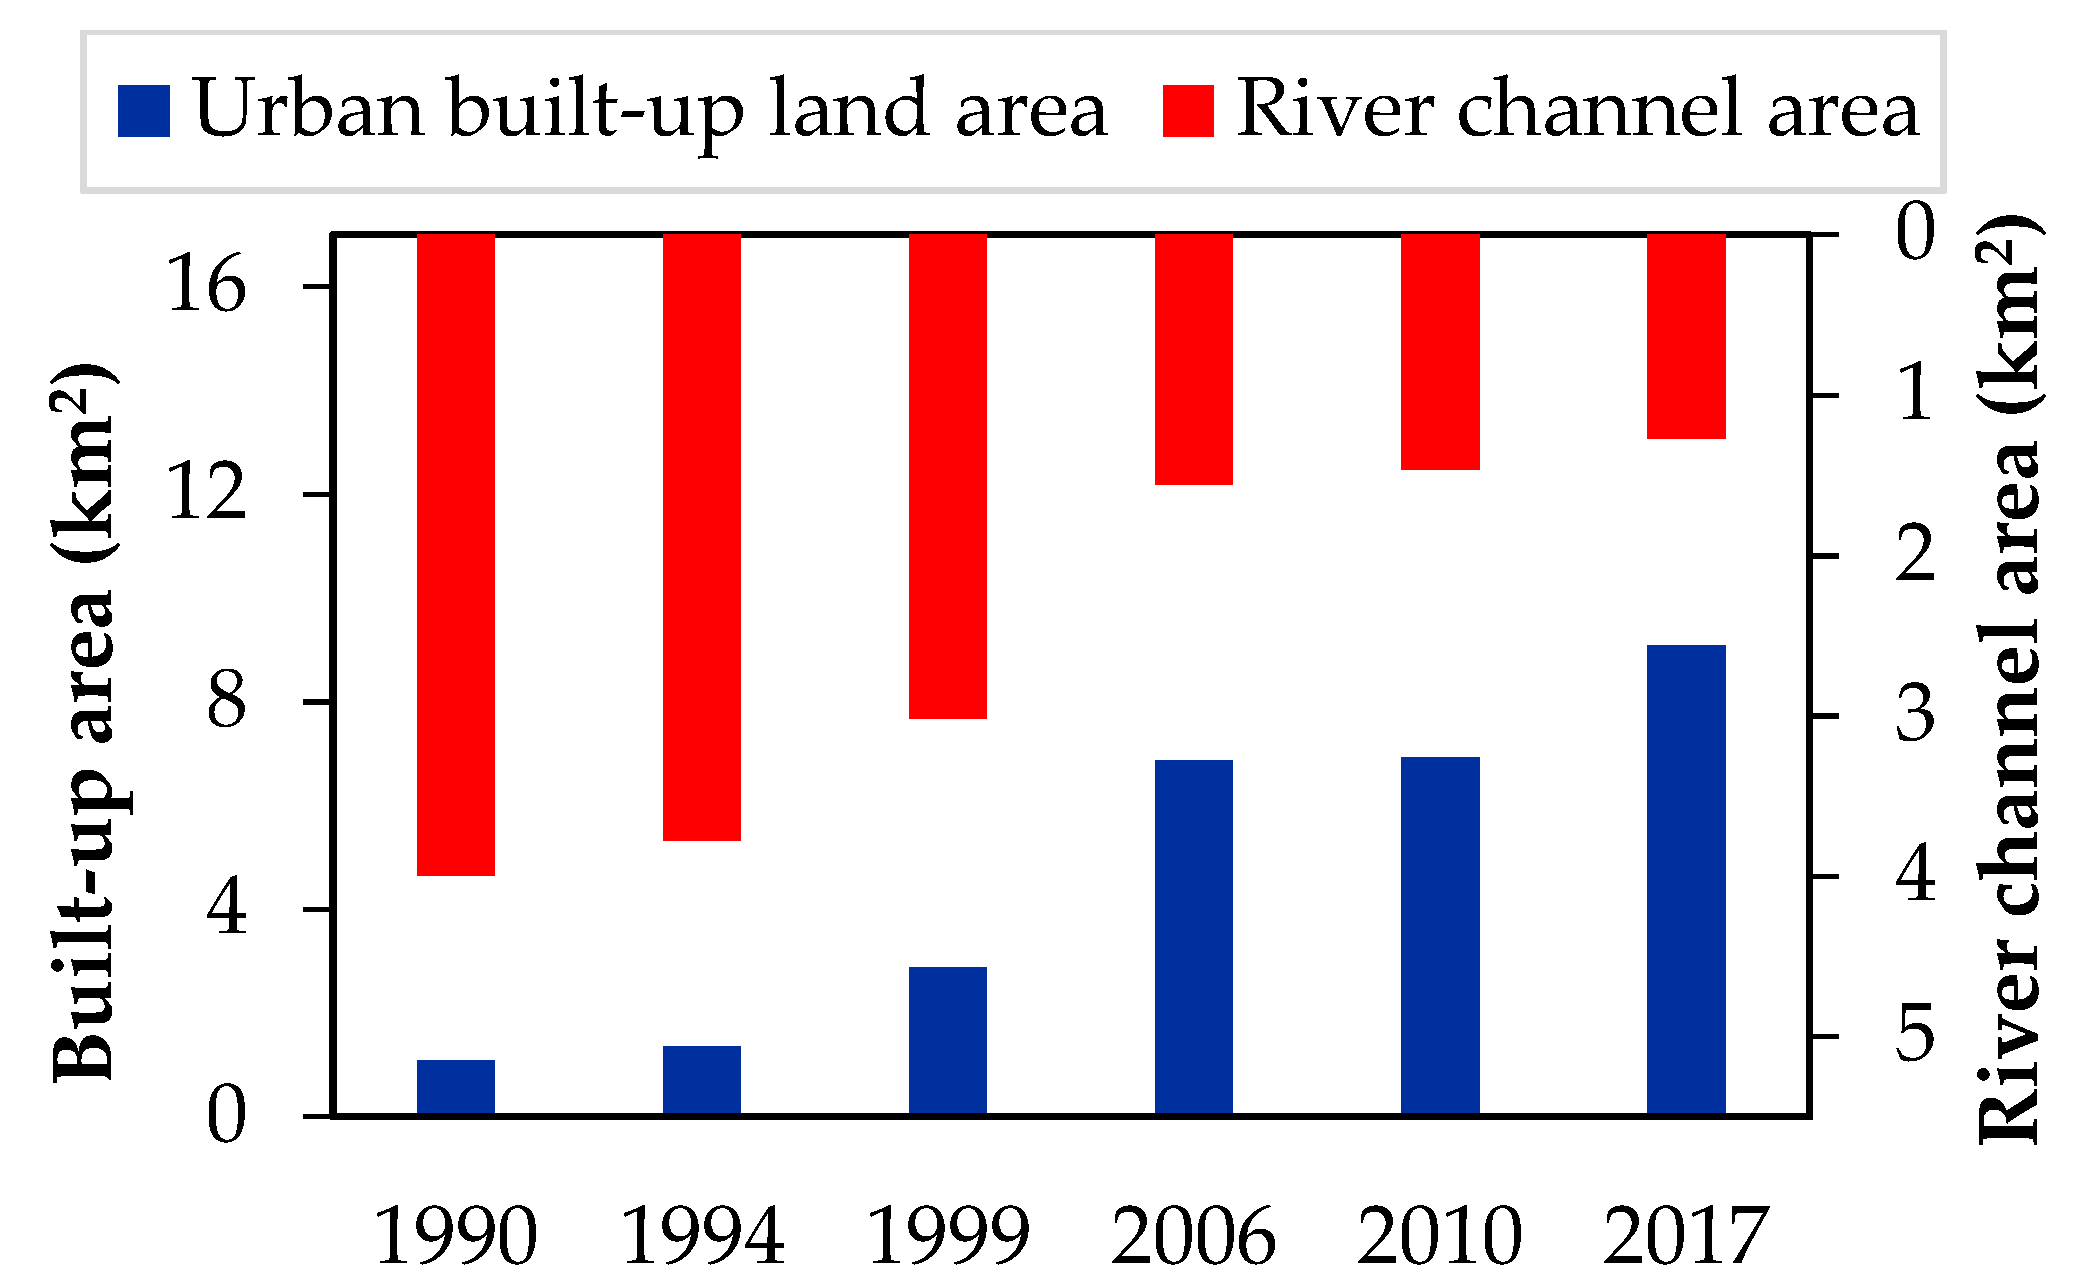
According to the dynamics of the river channel derived from the all available Landsat time-series images, the year of 1990 was selected as the base year for analyzing the impacts of river channel occupation on urban flood disasters.
Several scenario simulations [47] based on the YRCC2D model were designed in order to evaluate the impacts of the river channel width variation and bridge/house construction within the river channel on the urban inundated area and sediment deposition in the flood event on 26 July 2017:
S1: A control simulation based on the calibrated YRCC2D model with observed runoff, sediment concentration, and the boundary of the river channel and the existing bridges/houses in the river channel in 2017 was conducted;
S2: The same forcing data were used as the control simulation S1, except that bridges/houses in the river channel were not taken into account;
S3: The same forcing data were used as the control simulation S1, except the width of river channel was fixed to the condition in 1990, and bridges/houses in the river channel were not taken into account.
The difference between S1 and S2 (S1–S2) was used to estimate the change magnitude Δ B of the simulated urban inundation area and sediment volume caused by the construction of bridges/houses in the river channel:
Δ B = S C 2 , B 2 S C 2 , B 1
where S C 2 , B 2 is the simulated urban inundation area or sediment volume in scenario S1, and S C 2 , B 1 is the simulated urban inundation area or sediment volume for scenario S2.
The difference between S2 and S3 (S2–S3) was used to estimate the change magnitude Δ C of the simulated urban inundated area and sediment volume caused by the river channel variation:
Δ C = S C 2 , B 1 S C 1 , B 1
where S C 1 , B 1 is the simulated urban inundation area or sediment volume in the scenario S3.
The total change ( Δ t o t a l ) can be obtained by summing | Δ B | and | Δ C | , and the contributions of the river channel width variation ( μ C ) and bridge/house construction within the river channel ( μ B ) can be quantitatively estimated using the following equations:
Δ t o t a l = | Δ C | + | Δ B |
μ C = | Δ C | Δ t o t a l × 100 %
μ B = | Δ B | Δ t o t a l × 100 %
where μC and μB represent the contributions of the river channel width variation and bridge/house construction within the river channel to the urban-inundated area or urban-sediment deposition in relation to the year 1990.

4. Results

4.1. Dynamics of River Channel Occupation in the Suide County

The dynamic monitoring results using remote sensing technology are shown in Figure 7. It is indicated that the configuration of the main river channels of the Dali and Wuding rivers was stable during 1990–2017; however, urban expansion has spread along the river banks over 28 years, and the area of built-up land in the county increased significantly during this period.
Figure 8 shows the statistics of changes for the built-up land area and river channel area during the period from 1990 to 2017. Since 1990, with the continuous increase in the area of urban built-up land, the river channel area has begun to decrease substantially. In 2017, the area of built-up land in Suide County increased by more than 800 hm2 relative to 1990; meanwhile, the river channel area decreased by more than 270 hm2—a decrease of 68.2%. This shows that more than 1/3 of the urban expansion area occupied the original river channel, which has led to the narrowing of the river channel. It should be noted that the river channel length within the urban region in 2017 was used to calculate river channel areas with different channel widths in different years.
In addition, it is known that there were no bridges and houses in the river channels before 1990 based on the buildings inventory from the Yulin municipal bureau. However, according to the field survey in 2017, the construction of bridges and houses in the river channels has become a typical way of occupying the river channel in recent years, and a high-density spatial distribution and irrational bridge structures are the main characteristics of the bridges.

4.2. Validation of Urban Inundation and Sedimentation Simulated by the YRCC2D Model

The statistical results of inundated areas, sediment thickness, and sediment deposition in different sections are shown in Table 4. After the summation calculation of different sections, the total inundated area was 1.48 km2, and the total sediment deposition of the inundated area was approximately 1,116,000 m3, totaling approximately 1,506,600 tons according to a sediment volume-weight of 1.35 t/m3. The maximum inundation depth near the Suide hydrological station in the Dali River reached 4 m, and the maximum sediment thickness was 2.6 m.
To evaluate the performance of the YRCC2D model in simulating the urban inundation area and sedimentation caused by floodwater, a comparison was made between the simulations from the YRCC2D model and calculations derived from field survey data, as illustrated in Table 5. The relative error of the simulated inundated area, sediment deposition and maximum water depth in the urban area are 4.7%, 13.4% and 10%, respectively. This shows that the YRCC2D model can effectively and accurately simulate the flood disaster situation from 26 July 2017 in the urban area and can be used for the assessment of the impact of river channel occupation on the urban inundation and sedimentation caused by the floodwater.

4.3. Impacts of River Channel Width and Bridge/House Construction on Urban Inundation and Sedimentation

In this study, the urban inundated area and sedimentation were simulated in different scenarios of river channel occupation in the case of the storm flood on 26 July 2017, and the contribution rates of the river channel width variation and bridge/house construction in the river channel to the urban inundated area and sedimentation were then calculated using the combination of simulation results from different scenarios. The simulation results show that in the scenario of river channel boundary and urban building distribution in 1990, heavy rain would not cause flooding and sedimentation in the urban area. However, for the scenario of the river channel boundary in 2017, heavy rain resulted in urban inundation and sedimentation, and the impacts of the river channel with and without bridges/houses on the urban inundation are significantly different, as illustrated in Figure 9.
The statistics of the inundated areas and sedimentation in the urban area in different scenarios are shown in Table 6. Compared with the condition of the river channel boundary and urban construction in 1990, the decreased river channel width resulted in an increase of 1.02 km2 for the inundated urban area and an increase of 493,600 tons for urban sediment deposition. Compared with river channels without bridges and houses, the bridges and houses within the river channels increased the urban inundated area by 0.39 km2—an increase of nearly 40%—and the urban sediment increased by 658,800 tons—an increase of 133%.
The contribution of the reduction of the river channel width to the inundated area (72.3%) is higher than that to the sedimentation (42.8%) in the urban area. The contribution of bridge/house construction within the river channel to the inundated area and the sedimentation are 27.7% and 57.7%, respectively. It is demonstrated that urban inundation disasters are mainly caused by the narrowing of the river channel width instead of bridge/house construction, whereas both the river channel width variation and bridge/house construction are important causes for urban sedimentation disastesr.

5. Discussion

5.1. Application of Detection Method for River Channel Occupation

In recent years, remote sensing technology has become a tool in geomorphology for change detection in rivers and their floodplain dynamics at the strategic scale because of their capability to cover the spatiotemporal variation of river channels [48]. High-resolution aerial photographs have often been used to manually delineate river channel boundaries [49]; however, aerial imagery is very costly, and historical aerial time-series images are barely accessible for most cases. Landsat satellite images are freely available data resources for detecting river channels and have been used in previous studies. Among the common methods of surface water extraction to discriminate the land–water interface, the modified normalized difference water index (MNDWI) [50] derived from Landsat image has been widely applied and has been shown to be a robust water extraction index [38,51]. However, MNDWI cannot detect the built-up areas in the river terrace as a result of the insignificant discrepancy of MNDWI values of artificial surfaces and the original river terrace; thus, this index is not suitable for the extraction of occupied areas of river channels.
To solve this problem, the riparian vegetation degradation in the river terrace was used to represent the building construction in the river terrace, and NDVI was employed to discriminate the river channel–built-up area interface in this study. In addition, a multi-year criterion in the detection rules [40] is helpful to guarantee that the rules are not satisfied by an accidental vegetation change caused by rainfall or anthropogenic factors, thus improving the detection accuracy. Note that, due to local farmers growing crops in the river terrace, the land-cover type of the river terrace is always vegetation, which can be easily monitored using NDVI time-series. However, the practical application of this method is still subject to the duration of the period with riparian vegetation coverage and the number of available Landsat images. The proposed intra-annual NDVI time-series method has an important reference value for the detection of river channel occupation for the cases of river terraces and flood plains with natural or artificial vegetation coverage.

5.2. Influence Mechanism of River Channel Occupation on Urban Flooding Risk

The discharge–water level relationship of the Suide gauging station of the flood event on 26 July 2017 was compared with that of a flood with a similar peak discharge, which occurred before the extensive urban expansion (5 August 1977), as illustrated in Figure 10. It is indicated that, in the same flow conditions, the flood level of the 2017 flood was significantly higher than that of the 1977 flood; for example, the water levels of the two floods in 1977 and 2017 were 818.90 m and 820.95 m at a flow rate of 2450 m3/s, respectively, and the water level increased by up to 2.05 m. This demonstrates that the reduction of the width of the river channel led to a significant change in the water level–discharge relationship of the river channel, which resulted in a reduction in the flood discharge capacity of the river channel. When there is a large flow in the river channel, the flood water level will definitely increase more rapidly, which greatly increases the risk of flooding urban areas near the river channels.
In addition, the water level changes at each bridge location in the cases with and without bridge construction under the condition of the 26 July 2017 flood were simulated and compared, as shown in Table 7. Compared to the case without bridge construction, the bridges where the water level rose above 0.8 m account for approximately 55% of the total, which also agree with the field survey results. The difference of the peak discharge between the conditions with and without bridges becomes increasingly great as the number of bridges increases, which demonstrates an obvious cumulative effect of bridges on water-blocking. The reason for the increase of water level and the decrease of peak discharge is mainly due to the fact that the density of bridges is relatively high and the bridges are in a series combination, and most of the bridges are arched bridges (Table 2) with a larger water-blocking effect caused by the low bridge deck and small arch opening, which eventually results in slower flood discharge. Therefore, it is indicated that the water-blocking effect of the bridge construction will lead to the flood water level rising and the peak discharge decreasing, thereby increasing the risk of urban flood disasters [52].

5.3. Uncertainties and Limitations

Because it is difficult to obtain the true values of the inundated areas and sediment in the urban area, there may be some deviations between the actual situation of the urban inundated area and sedimentation and the calculated ‘true value’ in Section 3.2; however, due to these data being calculated based on a large number of field-measured data, it can be safely concluded that the ‘true value’ still has a certain of credibility.
Due to the Dingjiagou gauging station with field observations being located outside the spatial domain of the available river channel and urban topographic map, and there being no observed data in the section between Dingjiagou station and Wuliwan bridge, the water and sediment observations at Dingjiagou gauging station were used as the input of the YRCC2D model. This will definitely influence the accuracy of the simulation outcomes, whereas calibration processing could eliminate some errors by adjusting key parameters of the model. In fact, there are some deviations between the simulated results and the actual values for the urban inundated area and sedimentation; e.g., the relative error of the urban sediment exceeded 10%. However, in this study, we mainly compared the simulation results in different scenarios, and the model simulation error is a systematic error for each scenario simulation. Therefore, simulation error has little impact on the accuracy of the relative variation between simulations from different scenarios. In addition, the water-blocking buildings (houses and bridges) were only generalized as some impervious sections during the model simulation process, which will not perfectly reflect the hydrodynamic mechanism of water blocking.

5.4. Recommdation of Sustainable Flood Mitigation Measures

From the perspective of “sustainability”, urban development plans and flood mitigation measures should be long-lasting, cause little or no damage to the environment, and at the same time prevent the exhaustion of natural resources [53]. In the context of urban development at the cost of river channel occupation in the mountainous areas, it is therefore of paramount importance to suggest sustainable solutions that will help reduce the social, environmental and economic damages caused by floods. The following points are recommended:
  • Conduct frequent flood analysis according to the characteristics of river hydrology, and investigate the current flood discharge capacity of the river channel and the demand for flood control standards;
  • Develop scientific river control routes, and river reconnection with the adjoining floodplain can be used for water storage, which is less expensive than artificial constructions;
  • Raise flood control standards on both banks of the river for the occupied river channel in the flood-prone areas;
  • Make environmentally-friendly urban construction plans, and adopt natural systems such as the incorporation of soil and vegetation in urban runoff control strategies instead of the traditional rapid-draining approach according to the concept of the ‘sponge city’ proposed by the Chinese government [54];
  • Establish automatic flood warning systems that are easily accessed and comprehended by all stakeholders [55,56];
  • Strengthen local administrative supervision by referencing the “river leader” system [57] implemented by the Chinese government, and effectively eliminate irrational constructions in the river terrace or main river channel;
  • Increase flood awareness programs in all schools and other relevant institutions [53];
  • Develop community capital through flood action groups [58].

6. Conclusions

Although the expansion of impervious surface areas will enlarge the urban runoff volume, the area of imperious surface is too small to cause serious flood inundation; thus, floodwater from the river channel is the main threat to urban flood disasters for small cities in mountainous areas. Recently, building construction through the occupation of river channels and land reclamation is the main mode of urban expansion in these cities, and the occupation of river channels increases the risk of rainstorm flood disasters in urban regions. A torrential rainstorm flood event that occurred on 26 July 2017 in Suide County, which is a typical town in the Loess Plateau, China, was adopted as an example to explore the impacts of river channel occupancy on urban inundation and sedimentation caused by floodwater.
In this study, an innovative method of detecting urban area and river channel area dynamics using time-series satellite images was proposed, and the contributions of river channel boundary variation and bridge/house construction in the river channel on urban flood disasters were also analyzed based on different scenario simulations with the YRCC2D model. The results showed that due to the urban expansion along the riverbank, the configuration of the river cross-section has changed from a natural “V” shape to a “U” shape or a rectangular shape, and the width of the river channel has narrowed sharply, causing a significant change in the water level–discharge relationship of the river channel cross-section. This has led to a drastic decline in the flood discharge capacity of the river channels. In addition, the geometric characteristics of bridges and the excessively high distribution density have led to a reduction in flood peak discharge, and an increase of the flood water level, which have increased the risk of flood disaster in urban regions. The framework of the proposed method has significant implications for the planning of effective flood control strategies and the establishment of a sustainable development plan for the numerous small cities near the river channel in the mountainous area, especially for the Loess Plateau. The investigation and research findings together with the other proposed sustainable mitigation measures in this study can also be integrated into the disaster management and mitigation portfolio to help reduce the future effects of flooding in similar cities.
Regarding future studies, more sufficient field survey data about urban sediment deposition could be obtained to better reflect the spatial heterogeneity, instead of utilizing the interpolation results. Furthermore, the proposed assessment approach should be further evaluated by comparing similar approaches in different study areas, and the simulation method using a hydrodynamic model can also be extended to incorporate other hydrological models to figure out the different influences of water-logging and floodwater on urban disasters. A quantitative assessment of the sustainability of urban construction can be conducted by the comprehensive consideration of social, environmental, economic, political and human factors.

Author Contributions

All authors contributed to the design and development of this manuscript. Z.W. performed the data processing and wrote the first draft of the manuscript. W.Y., M.W. and P.X. gave constructive suggestions on the design and modification of the manuscript. J.Y. and Q.T. also helped process the data in this paper. P.Z., X.K. and J.W. helped edit the manuscript prior to submission.

Funding

This research was funded by the National Key R&D Program of China (2017YFC0504501), National Natural Science Foundation of China (41701509; 41571276; 61501200; 41877079), Special Research Fund of the YRIHR (HKY-JBYW-2017-08, HKY-JBYW-2016-06), Foundation of development on science and technology by YRIHR (HKF201709), Young Elite Scientists Sponsorship by CAST (2017QNRC023).

Acknowledgments

We gratefully thank the anonymous reviewers for their critical comments and constructive suggestions on the manuscript.

Conflicts of Interest

The authors declare no conflicts of interest.

References

  1. Fan, Y.F. Research on factors influencing an individual’s behavior of energy management: A field study in China. J. Manag. Anal. 2017, 4, 203–239. [Google Scholar] [CrossRef]
  2. Yang, X.J. China’s rapid urbanization. Science 2013, 342, 310. [Google Scholar] [CrossRef] [PubMed]
  3. Bai, X.M.; Shi, P.J.; Liu, Y.S. Realizing China’s urban dream. Nature 2014, 509, 158–160. [Google Scholar] [CrossRef] [PubMed]
  4. Chen, M.; Liu, W.; Tao, X. Evolution and assessment on China’s urbanization1960–2010: Under-urbanization or over-urbanization? Habitat Int. 2013, 38, 25–33. [Google Scholar] [CrossRef]
  5. Shang, J.; Wang, Z.; Li, L.; Chen, Y.; Li, P.F. A study on the correlation between technology innovation and the new-type urbanization in Shaanxi province. Technol. Forecast. Soc. Chang. 2018, 135, 266–273. [Google Scholar] [CrossRef]
  6. National Bureau of Statistics of China (NBSC). China Statistical Yearbook; China Statistics Press: Beijing, China, 2013.
  7. Chen, M.X.; Liu, W.D.; Lu, D.D. Challenges and the way forward in China’s new-type urbanization. Land Use Policy 2016, 55, 334–339. [Google Scholar] [CrossRef] [Green Version]
  8. Guan, X.L.; Wei, H.K.; Lu, S.S.; Dai, Q.; Su, H.J. Assessment on the urbanization strategy in China: Achievements, challenges and reflections. Habitat Int. 2018, 71, 97–109. [Google Scholar] [CrossRef]
  9. Cai, J.L.; Yin, H.; Olli, V. Impacts of urbanization on water use and energy-related CO2 emissions of residential consumption in China: A spatio-temporal analysis during 2003–2012. J. Clean. Prod. 2018, 194, 23–33. [Google Scholar] [CrossRef]
  10. Liu, J.; Shen, Z.Y.; Chen, L. Assessing how spatial variations of land use pattern affect water quality across a typical urbanized watershed in Beijing, China. Landsc. Urban Plan. 2018, 176, 51–63. [Google Scholar] [CrossRef]
  11. Yu, H.B.; Song, Y.H.; Chang, X.; Gao, H.; Peng, J. A Scheme for a Sustainable Urban Water Environmental System during the Urbanization Process in China. Engineering 2018, 4, 190–193. [Google Scholar] [CrossRef]
  12. Wu, J.S.; Chen, B.K.; Mao, J.Y.; Feng, Z. Spatiotemporal evolution of carbon sequestration vulnerability and its relationship with urbanization in China’s coastal zone. Sci. Total Environ. 2018, 645, 692–701. [Google Scholar] [CrossRef] [PubMed]
  13. Adhikari, P.; Hong, Y.; Douglas, K.R.; Kirschbaum, D.B.; Gourley, J.; Adler, R.; Brakenridge, G.R. A digitized global flood inventory (1998–2008): Compilation and preliminary results. Nat. Hazards 2010, 55, 405–422. [Google Scholar] [CrossRef]
  14. Chen, Y.B.; Zhou, H.L.; Zhang, H.; Du, G.M.; Zhou, J.H. Urban flood risk warning under rapid urbanization. Environ. Res. 2015, 139, 3–10. [Google Scholar] [CrossRef] [PubMed]
  15. Grove, M.; Harbor, J.M. Impacts of urbanization on surface hydrology, Little Eagle Creek, IN, and analysis of LTHIA model sensitivity to data resolution. Phys. Geogr. 2001, 22, 135–153. [Google Scholar] [CrossRef]
  16. Cai, Y.P.; Huang, G.H.; Tan, Q.; Chen, B. Identification of optimal strategies for improving eco-resilience to floods in ecologically vulnerable regions of a wetland. Ecol. Model. 2011, 222, 360–369. [Google Scholar] [CrossRef]
  17. Wang, J.; Wang, H.J.; Hong, Y. A high-resolution flood forecasting and monitoring system for China using satellite remote sensing data. Chin. Sci. Bull. 2016, 61, 518–528. [Google Scholar]
  18. Zhou, Y.; Liu, Y.S.; Wu, W.X. Disaster risk: Strengthen china’s flood control. Nature 2016, 536, 396. [Google Scholar] [CrossRef] [PubMed]
  19. Su, M.R.; Zheng, Y.; Hao, Y.; Chen, Q.H.; Chen, S.H.; Chen, Z.Y.; Xie, H. The influence of landscape pattern on the risk of urban water-logging and flood disaster. Ecol. Indic. 2018, 92, 133–140. [Google Scholar] [CrossRef]
  20. Choi, W.; Nauth, K.; Choi, J.; Becker, S. Urbanization and rainfall–runoff relationships in the Milwaukee River basin. Prof. Geogr. 2016, 68, 14–25. [Google Scholar] [CrossRef]
  21. Zhang, X.F.; Zhang, X.; Hu, S.; Liu, T.; Li, G.H. Runoff and sediment modeling in a peri-urban artificial landscape: Case study of Olympic Forest Park in Beijing. J. Hydrol. 2013, 485, 126–138. [Google Scholar] [CrossRef]
  22. Mejia, A.I.; Moglen, G.E. Spatial distribution of imperviousness and the space-time variability of rainfall, runoff generation, and routing. Water Resour. Res. 2010, 46, W07509. [Google Scholar] [CrossRef]
  23. Li, C.L.; Liu, M.; Hu, Y.M.; Shi, T.; Qu, X.Q.; Walter, M.T. Effects of urbanization on direct runoff characteristics in urban functional zones. Sci. Total Environ. 2018, 643, 301–311. [Google Scholar] [CrossRef] [PubMed]
  24. Salvadore, E.; Bronders, J.; Batelaan, O. Hydrological modelling of urbanized catchments: A review and future directions. J. Hydrol. 2015, 529, 62–81. [Google Scholar] [CrossRef]
  25. Chen, W.J.; Huang, G.R.; Zhang, H.; Wang, W.Q. Urban inundation response to rainstorm patterns with a coupled hydrodynamic model: A case study in Haidian Island, China. J. Hydrol. 2018, 564, 1022–1035. [Google Scholar] [CrossRef]
  26. Oudin, L.; Salavati, B.; Furushopercot, C.; Ribstein, B.; Saadi, M. Hydrological impacts of urbanization at the catchment scale. J. Hydrol. 2018, 559, 774–786. [Google Scholar] [CrossRef]
  27. Liu, Z.; Merwade, V. Accounting for model structure, parameter and input forcing uncertainty in flood inundation modeling using Bayesian model averaging. J. Hydrol. 2018, 565, 138–149. [Google Scholar] [CrossRef]
  28. Xu, H.S.; Ma, C.; Lian, J.J.; Xu, K.; Chaima, E. Urban flooding risk assessment based on an integrated k-means cluster algorithm and improved entropy weight method in the region of Haikou, China. J. Hydrol. 2018, 563, 975–986. [Google Scholar] [CrossRef]
  29. Tchorzewska-Cieslak, B.; Pietrucha-Urbanik, K.; Zygmunt, A. Implementation of Matrix Methods in Flood Risk Analysis and Assessment. Econ. Environ. 2018, 3, 8–24. [Google Scholar]
  30. Guo, A.J.; Chang, J.X.; Wang, Y.M.; Huang, Q.; Zhou, S. Flood risk analysis for flood control and sediment transportation in sandy regions: A case study in the Loess Plateau, China. J. Hydrol. 2018, 560, 39–55. [Google Scholar] [CrossRef]
  31. Zhao, G.; Mu, X.; Wen, Z.; Wang, F.; Gao, P. Soil erosion, conservation, and ecoenvironment changes in the loess plateau of China. Land Degrad. Dev. 2013, 24, 499–510. [Google Scholar]
  32. Steele, M.K.; Heffernan, J.B. Morphological characteristics of urban water bodies: Mechanisms of change and implications for ecosystem function. Ecol. Appl. 2014, 24, 1070–1084. [Google Scholar] [CrossRef] [PubMed]
  33. Deng, X.F.; Xu, Y.P. Degrading flood regulation function of river systems in the urbanization process. Sci. Total Environ. 2018, 622, 1379–1390. [Google Scholar] [CrossRef] [PubMed]
  34. Czech, W.; Radecki-Pawlik, A.; Wyzga, B.; Hajdukiewicz, H. Modelling the flooding capacity of a Polish Carpathian river: A comparison of constrained and free channel conditions. Geomorphology 2016, 272, 32–42. [Google Scholar] [CrossRef]
  35. Berk, A.; Bernstein, L.S.; Anderson, G.P.; Acharya, P.K.; Robertson, D.C. MODTRAN cloud and multiple scattering upgrades with application to AVIRIS. Remote Sens. Environ. 1998, 65, 367–375. [Google Scholar] [CrossRef]
  36. Tucker, C.J. Red and photographic infrared linear combinations for monitoring vegetation. Remote Sens. Environ. 1979, 8, 127–150. [Google Scholar] [CrossRef] [Green Version]
  37. Han, N.; Wu, J.; Tahmassebia, A.R.S.; Xu, H.W.; Wang, K. NDVI-Based Lacunarity Texture for Improving Identification of Torreya Using Object-Oriented Method. Agric. Sci. China 2011, 10, 1431–1444. [Google Scholar] [CrossRef]
  38. Philip, K.L.; Lalit, K.; Richard, K. Monitoring river channel dynamics using remote sensing and GIS techniques. Geomorphology 2019, 325, 92–102. [Google Scholar]
  39. Cheng, W.C.; Chang, J.C.; Chang, C.P.; Su, Y.; Tu, T.M. A Fixed-Threshold Approach to Generate High-Resolution Vegetation Maps for IKONOS Imagery. Sensors 2008, 8, 4308–4317. [Google Scholar] [CrossRef] [Green Version]
  40. Wang, Z.; Yao, W.; Tang, Q.; Liu, L.; Xiao, P.; Kong, X.; Zhang, P.; Shi, F.; Wang, Y. Continuous Change Detection of Forest/Grassland and Cropland in the Loess Plateau of China Using All Available Landsat Data. Remote Sens. 2018, 10, 1775. [Google Scholar] [CrossRef]
  41. Knotters, M.; Brus, D.J.; Voshaar, J.H. A comparison of kriging, co-kriging and kriging combined with regression for spatial interpolation of horizon depth with censored observations. Geoderma 1995, 67, 227–246. [Google Scholar] [CrossRef]
  42. Lan, H.; Zhou, L.; Wang, Z.; Zhang, X.; Zeng, H. The Study on the Land Use and Remediation Technology in the Floodplain of the Lower Yellow River. In Proceedings of the 4th International Yellow River Forum on Ecological Civilization and River Ethics, Zhengzhou, China, 21 October 2009; Volume Ii, pp. 375–381. [Google Scholar]
  43. Smagorinsky, J. General circulation experiments with the primitive equations. Mon. Weather Rev. 1963, 91, 99–164. [Google Scholar] [CrossRef]
  44. Yu, M.H.; Liu, G.F. Preliminary study on sediment carrying capacity formula of non-uniform sediment flow. J. Sediment. Res. 2001, 3, 25–29. (In Chinese) [Google Scholar]
  45. Fei, X.J.; Shao, X.J. Calculation Method of Channel Sediment Transport Capacity in Sediment Source Area. J. Sediment. Res. 2004, 2, 1–8. (In Chinese) [Google Scholar]
  46. Gioia, G.; Bombardelli, F.A. Scaling and Similarity in Rough Channel Flows. Phys. Rev. Lett. 2001, 88, 014501. [Google Scholar] [CrossRef] [PubMed]
  47. Wu, J.; Wang, Z.H.; Dong, Z.C.; Tang, Q.H.; Lv, X.Z.; Dong, G.T. Analysis of Natural Streamflow Variation and Its Influential Factors on the Yellow River from 1957 to 2010. Water 2018, 10, 1155. [Google Scholar] [CrossRef]
  48. Cunningham, S.C.; Nally, R.M.; Read, J.; Baker, P.J.; White, M.; Thomson, J.R.; Griffioen, P. A robust technique for mapping vegetation condition across a major river system. Ecosystems 2009, 12, 207–219. [Google Scholar] [CrossRef]
  49. Lauer, J.W.; Caitlyn, E.; Christian, L.; Patrick, B.; Rachel, R. Air-photo based change in channel width in the Minnesota River basin: Modes of adjustment and implications for sediment budget. Geomorphology 2017, 297, 170–184. [Google Scholar] [CrossRef]
  50. Xu, H. Modification of normalised difference water index (NDWI) to enhance open water features in remotely sensed imagery. Int. J. Remote Sens. 2006, 27, 3025–3033. [Google Scholar] [CrossRef]
  51. Rokni, K.; Ahmad, A.; Selamat, A.; Hazini, S. Water feature extraction and change detection using multitemporal Landsat imagery. Remote Sens. 2014, 6, 4173–4189. [Google Scholar] [CrossRef]
  52. Gschnitzer, T.; Gems, B.; Mazzorana, B.; Aufleger, M. Towards a robust assessment of bridge clogging processes in flood risk management. Geomorphology 2017, 279, 128–140. [Google Scholar] [CrossRef]
  53. Remember, S.; Aysu, S.K. An analysis of the flood management and mitigation measures in Zimbabwe for a sustainable future. Int. J. Disaster Risk Reduct. 2018, 31, 691–697. [Google Scholar]
  54. Wang, H.; Mei, C.; Liu, J.H.; Shao, W.W. A new strategy for integrated urban water management in China: Sponge city. Sci. China Technol. Sci. 2017, 3, 317–329. [Google Scholar] [CrossRef]
  55. Lumbroso, D. How can policymakers in sub-Saharan Africa make early warning systems more effective? The case of Uganda. Int. J. Disaster Risk Reduct. 2018, 27, 530–540. [Google Scholar] [CrossRef]
  56. Rossi, C.; Acerbo, F.S.; Ylinen, K.; Juga, I.; Nurmi, P.; Bosca, A.; Tarasconi, F.; Cristoforetti, M.; Alikadic, A. Early detection and information extraction for weather-induced floods using social media streams. Int. J. Disaster Risk Reduct. 2018, 30, 145–157. [Google Scholar] [CrossRef]
  57. Chien, S.S.; Hong, D.L. River leaders in China: Party-state hierarchy and transboundary governance. Political Geogr. 2018, 62, 58–67. [Google Scholar] [CrossRef]
  58. McEwen, L.; Holmes, A.; Quinn, N.; Cobbing, P. “Learning for resilience”: Developing community capital through flood action groups in urban flood risk settings with lower social capital. Int. J. Disaster Risk Reduct. 2018, 27, 329–342. [Google Scholar] [CrossRef]
Figure 1. Geographical location and river system of Suide County.
Sustainability 11 00761 g001
Figure 2. Spatial distribution of field survey sites (Landsat8 image acquired on 30 July 2014, RGB: 742).
Sustainability 11 00761 g002
Figure 3. Flowchart of evaluation method for the influence of river channel occupations on urban inundation and sedimentation induced by floodwater.
Sustainability 11 00761 g003
Figure 4. Landsat time-series imagery (RGB: 432) and normalized difference vegetation index (NDVI) time-series of a pixel with land cover conversion from cropland into built-up land.
Sustainability 11 00761 g004
Figure 5. The scope of calculation for the Yellow River Conservancy Commission of the Ministry of Water Resources in China (YRCC2D) model simulation and corresponding upper and lower boundary conditions.
Sustainability 11 00761 g005
Figure 6. Computed grid and simple models of water-blocking buildings for a sub-region in the study area.
Sustainability 11 00761 g006
Figure 7. The boundary of the built-up area in Suide County from 1990 to 2017, with overlaid Landsat time-series images (RGB:742).
Sustainability 11 00761 g007
Figure 8. Statistical changes of the built-up land area and river channel area in the Suide urban region from 1990 to 2017.
Sustainability 11 00761 g008
Figure 9. Spatial distribution of water depth in the urban inundated area caused by the flood on 26 July 2017 in the two scenario simulations. S1: river channel boundary in 2017 with bridges/houses within the river channel, S2: river channel boundary in 2017 without bridges/houses within the river channel.
Sustainability 11 00761 g009
Figure 10. Flood level–flow diagram of two flood events at the Suide gauging station in the Dali River.
Sustainability 11 00761 g010
Table 1. Acquisition dates (year/month/day) of collected Landsat imagery and high-resolution imagery.
Data TypeSpatial Resolution (m)Acquisition Date
(Year/Month/Day)
Landsat TM/ETM+/OLI301990/8/29, 1992/7/17, 1993/6/18, 1994/8/24, 1995/6/8, 1996/6/10, 1998/7/2, 1999/10/17, 2000/6/5, 2000/9/1, 2001/6/16, 2002/9/23, 2002/10/1, 2003/8/17, 2004/9/20, 2005/9/7, 2006/9/10, 2007/8-/12, 2008/10/1, 2009/6/30, 2010/6/17, 2011/8/7, 2013/9/13, 2014/7/30, 2015/7/1, 2016/7/3, 2017/8/17
GF-212017/4/7, 2017/8/8
SPOT-532004/9/8
Table 2. Main features of bridges in the study area.
No.Bridge NameDistance to the First Bridge(m)Water OvertoppingBridge Structure
1Wuliwan Bridge0YesArch Bridge
2Zhangjiabian Bridge1172YesBeam bridge
3Junmin Bridge2462YesArch Bridge
4Diaoyin Bridge2933YesBeam bridge
5Nanguan Bridge3544YesArch Bridge
6Dali River Bridge4030YesArch Bridge
7Guanyun Bridge4519NoArch Bridge
8Minde Bridge4613NoBeam Bridge
9Yongle Bridge5667NoArch Bridge
10Qianshi Bridge6249NoArch Bridge
11Longfeng Bridge7531YesArch Bridge
Table 3. Initial sediment gradation used in the YRCC2D simulation.
Grain DiameterCumulative Percentage (%) of Different Grain Diameter LevelsMedium Diameter (d50)
0.005 mm0.01 mm0.025 mm0.05 mm0.1 mm0.25 mm0.5 mm1.0 mm
Suspended sediment22.230.347.772.693.299.6100.0-0.032
Bed sediment13.819.331.953.679.698.599.9100.00.039
Table 4. Calculated results of the flood-inundated area, sediment thickness and sediment deposition of different sections derived from field survey data.
Five Sections between Different BridgesInundated Area (km2)Sediment Thickness (m)Sediment Depositon (t)
Wuliwan Bridge–Zhangjiabiancun Bridge0.170.3–1.0191,700
Zhangjiabiancun Bridge–Diaoyin Bridge0.140.6–2.6336,150
Diaoyin Bridge–Dali River Bridge0.220.7–1.2318,600
Dali River Bridge–Qianshi Bridge0.140.3–0.7114,750
Qianshi Bridge–Longfeng Bridge0.810.3–0.6545,400
Total1.48/1,506,600
Table 5. Comparison of inundated area, sediment deposition and maximum water depth derived from field survey data and the YRCC2D model.
Calculation ConditionUrban Inundated Area (km2)Urban Sediment Deposition (t)Maximum Water Depth (m)
Field survey1.481,506,6004.0
Model simulation1.411,305,0003.6
Relative error4.7%13.4%10%
Table 6. Simulated inundated area and sedimentation in the urban area in different scenarios for the flood event on 26 July 2017.
Different ScenariosImpact of River Channel Width ChangesImpact of Bridges/Houses Construction
Inundated Area (km2)Sediment Deposition (t)Inundated Area (km2)Sediment Deposition (t)
River channel boundary in 1990, without bridges or houses00
River channel boundary in 2017, without bridges or houses1.02493,6001.02493,600
River channel boundary in 2017, with bridges and houses1.411,152,400
The amount of change1.02493,6000.39658,800
Relative change38.2%133.4%
Contribution72.3%42.8%27.7%57.2%
Table 7. Statistics of simulated water level and peak discharge in different scenarios with and without bridges in the river channel.
No.Bridge NameSimulated Water Level (m)Simulated Peak Discharge (m3/s)
With BridgeWithout BridgeDifferenceWith BridgeWithout BridgeDifference
1Wuliwan Bridge826.54825.720.82315031500
2Zhangjiabiancun Bridge823.64822.920.7231483150−2
3Junmin Bridge822.63821.740.8931433148−5
4Diaoyin Bridge821.97821.660.3131403147−7
5Nanguan Bridge820.58819.281.3031343144−10
6Dali River Bridge819.57818.920.6531303142−12
7Guanyun Bridge817.6816.830.7731283140−12
8Minde Bridge816.57816.280.2931283140−12
9Yongle Bridge815.58814.650.9331263138−12
10Qianshi Bridge814.25813.151.145484717−169
11Longfeng Bridge812.6810.771.8345454710−165

