Differential Allelic Richness between Malus sylvestris L. and Malus × domestica Borkh. from Finland as a Measure of Genetic Loss


Abstract
:1. Introduction
2. Materials and Methods
2.1. Apple Samples
2.2. DNA Isolation and Microsatellite Genotyping
2.3. Data Analysis
3. Results and Discussion
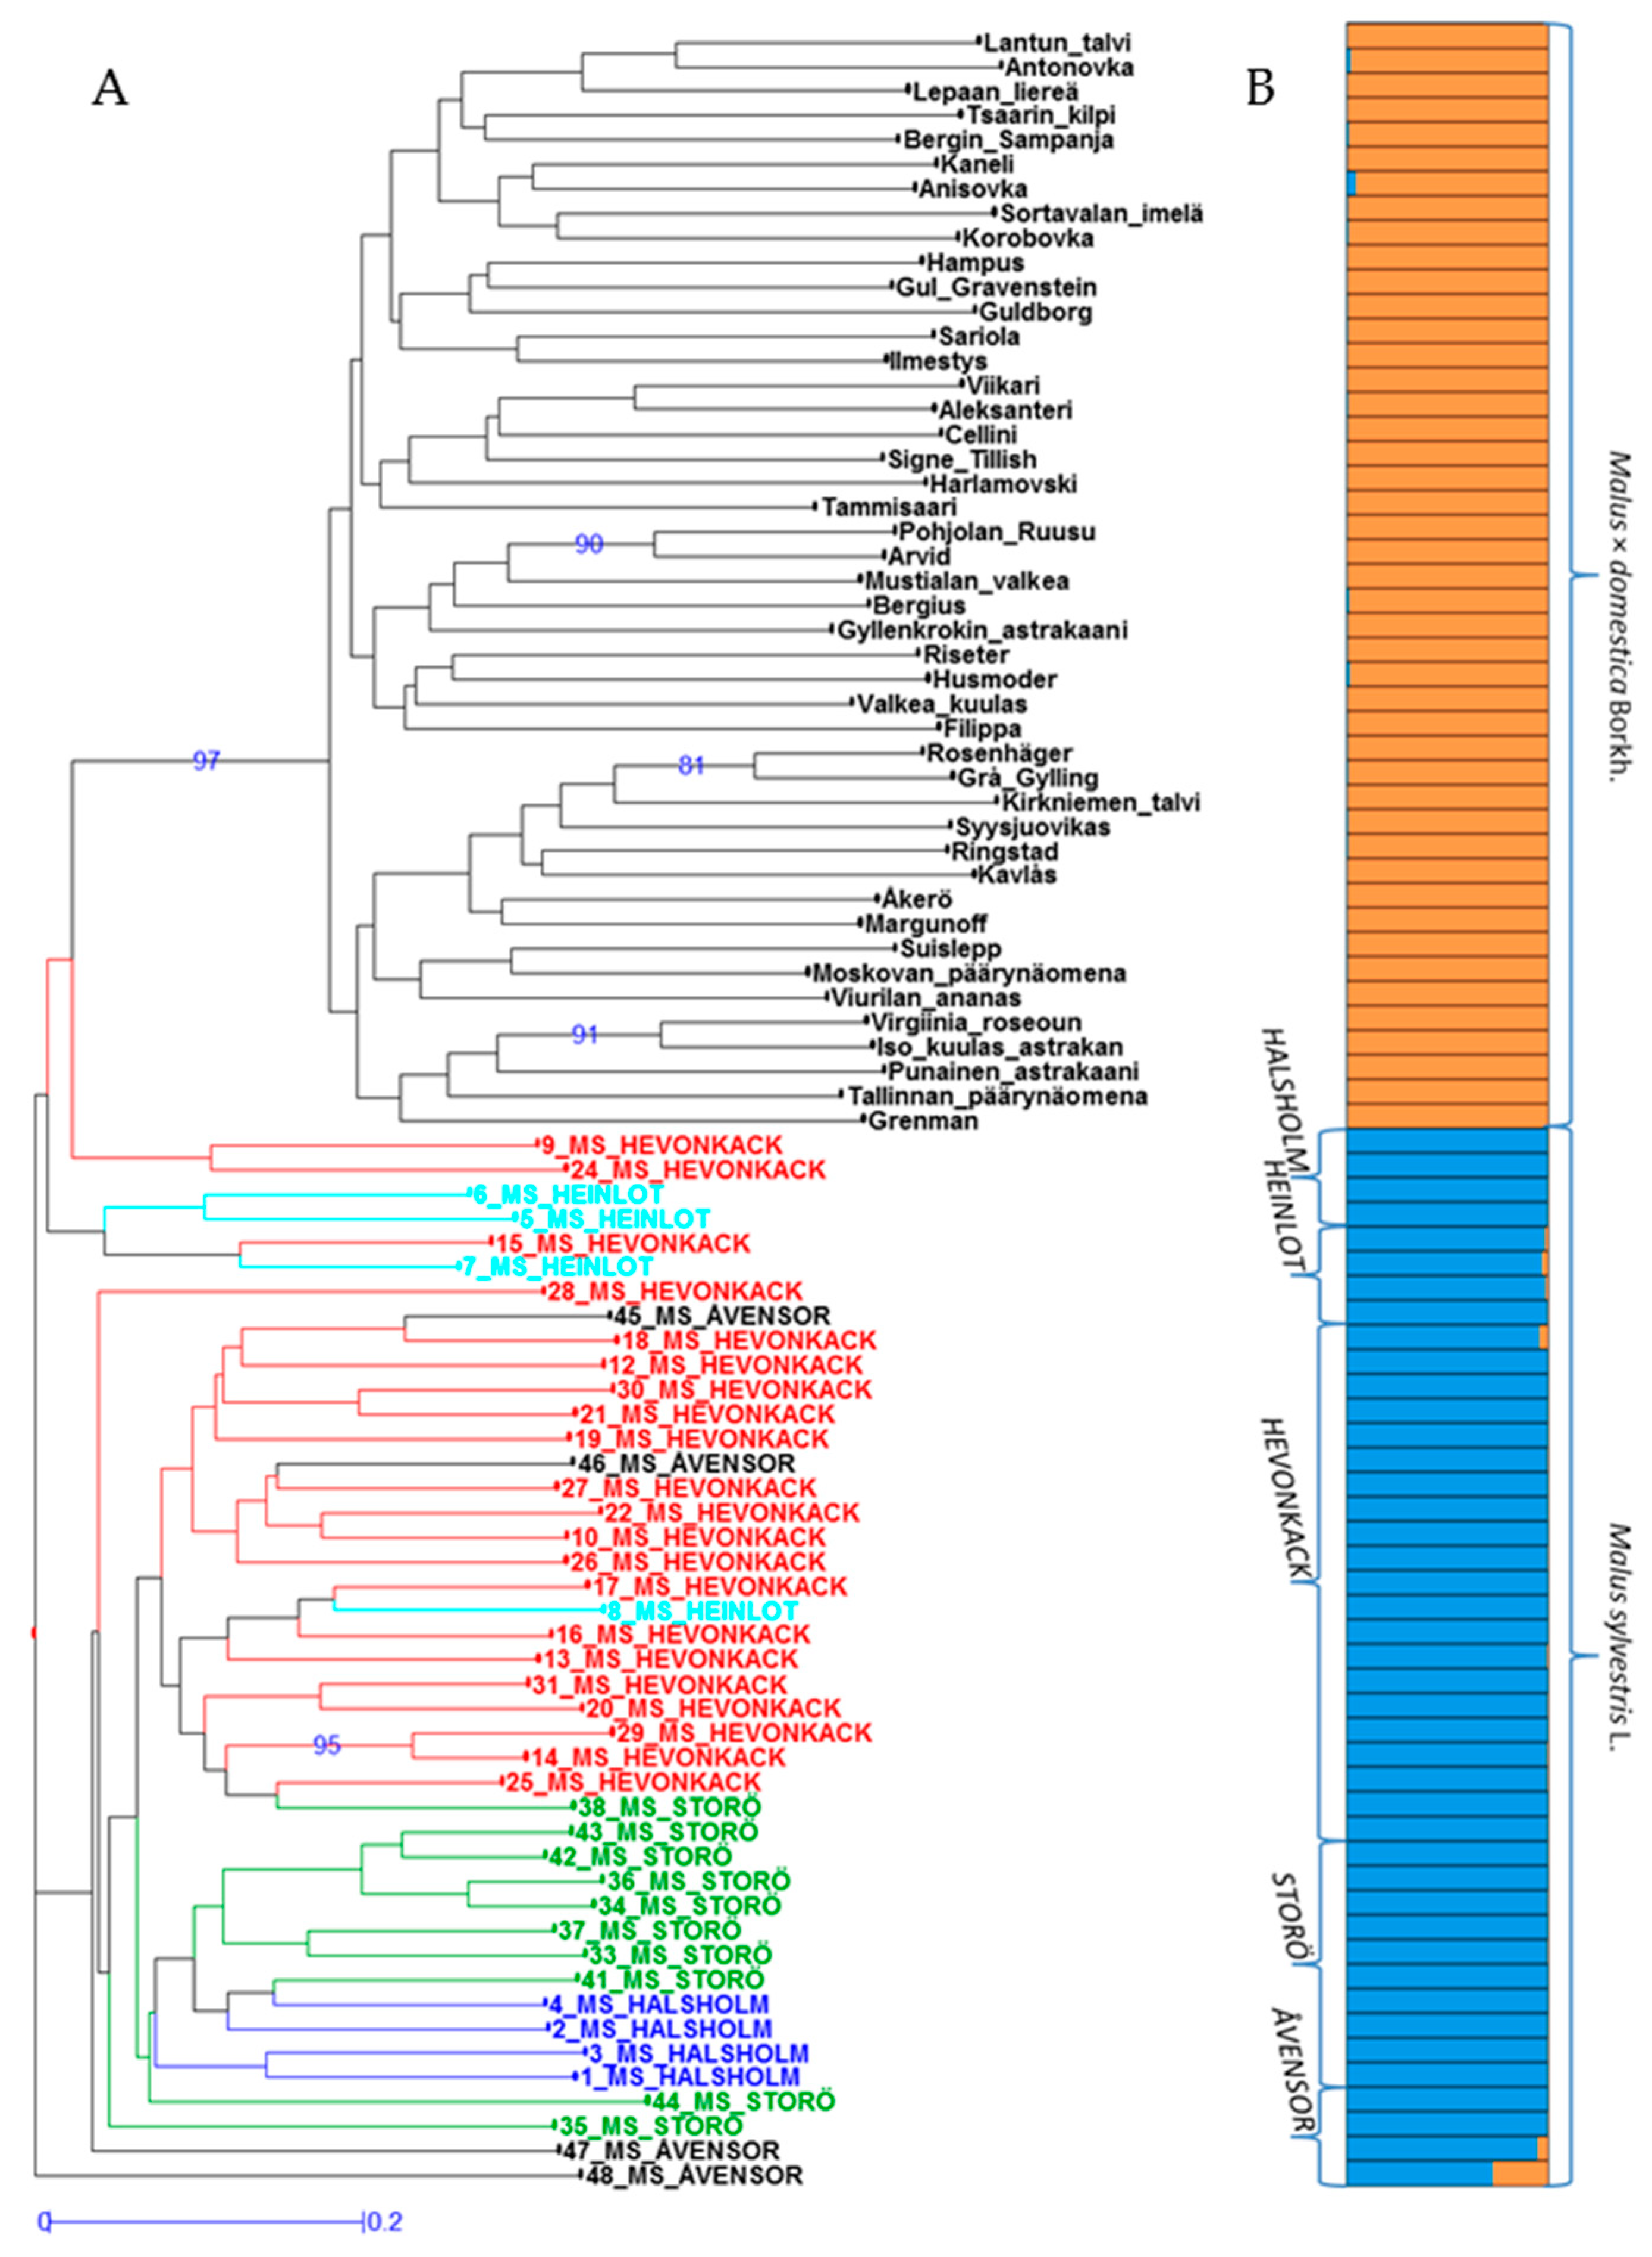
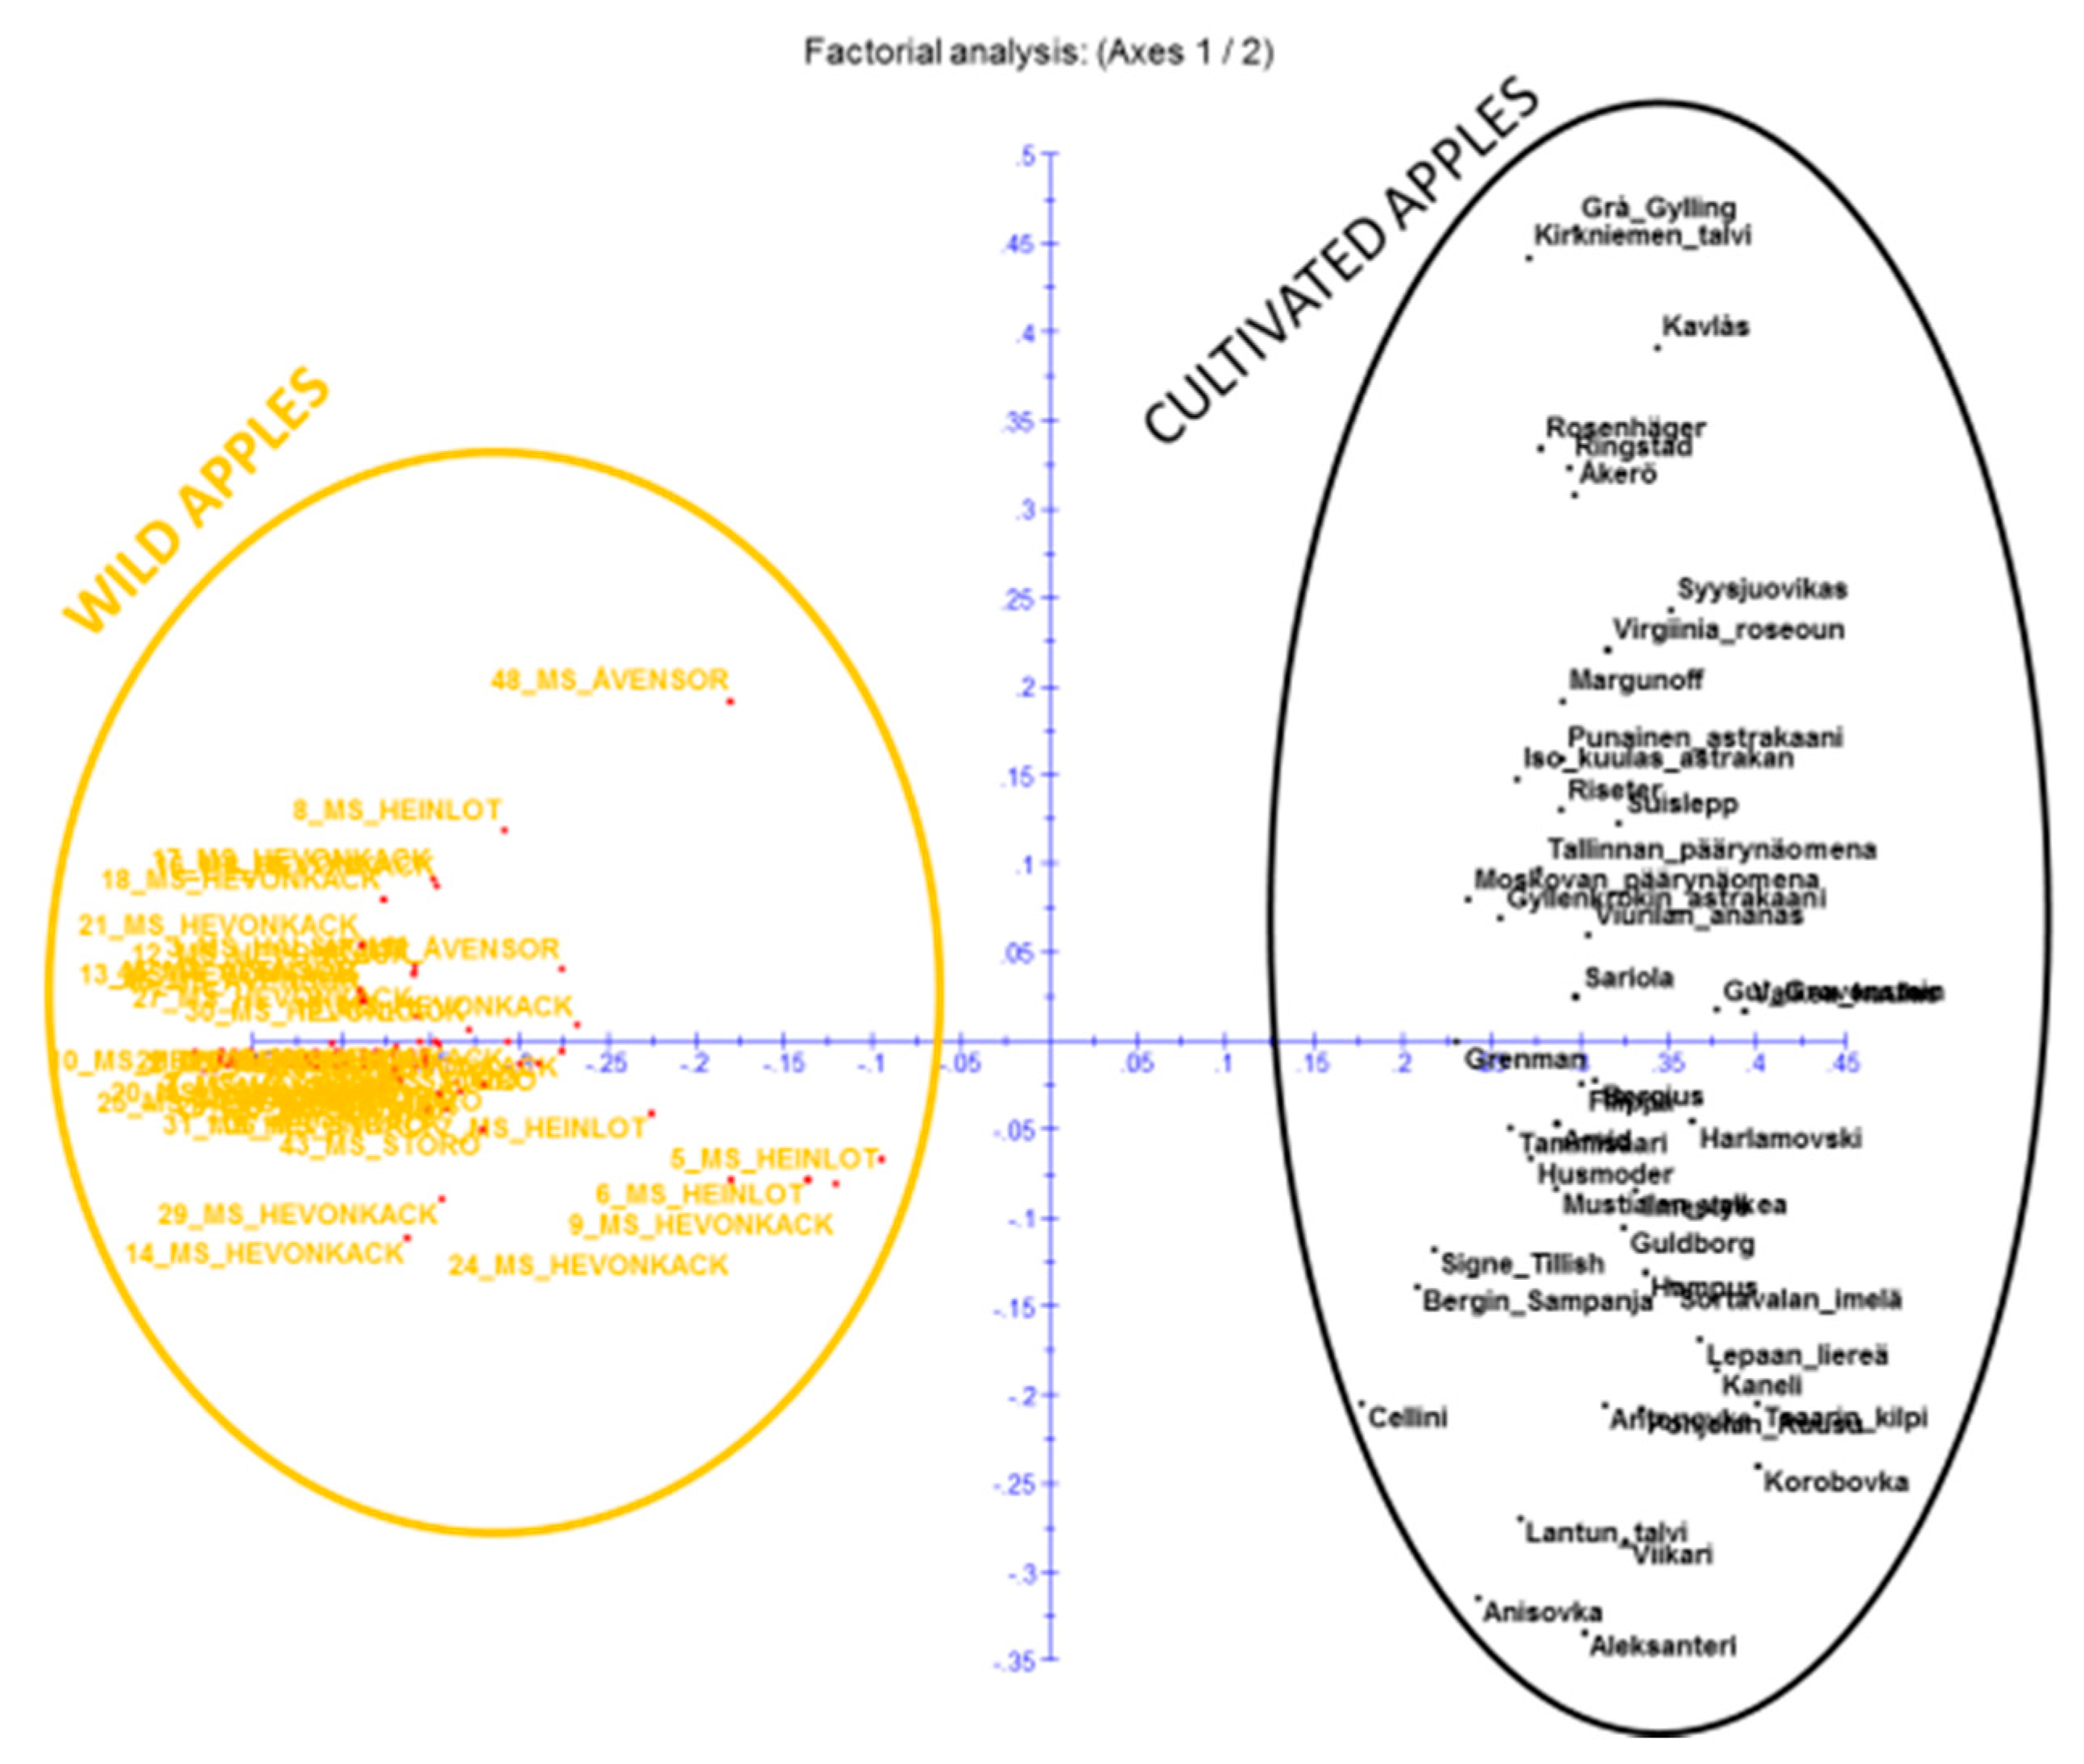
3.1. Differential Allelic Richness between M. sylvestris and Malus × domestica Borkh. as a Measure of Genetic Loss
3.2. Is Hybridization Another Threat to Finnish M. sylvestris Populations?
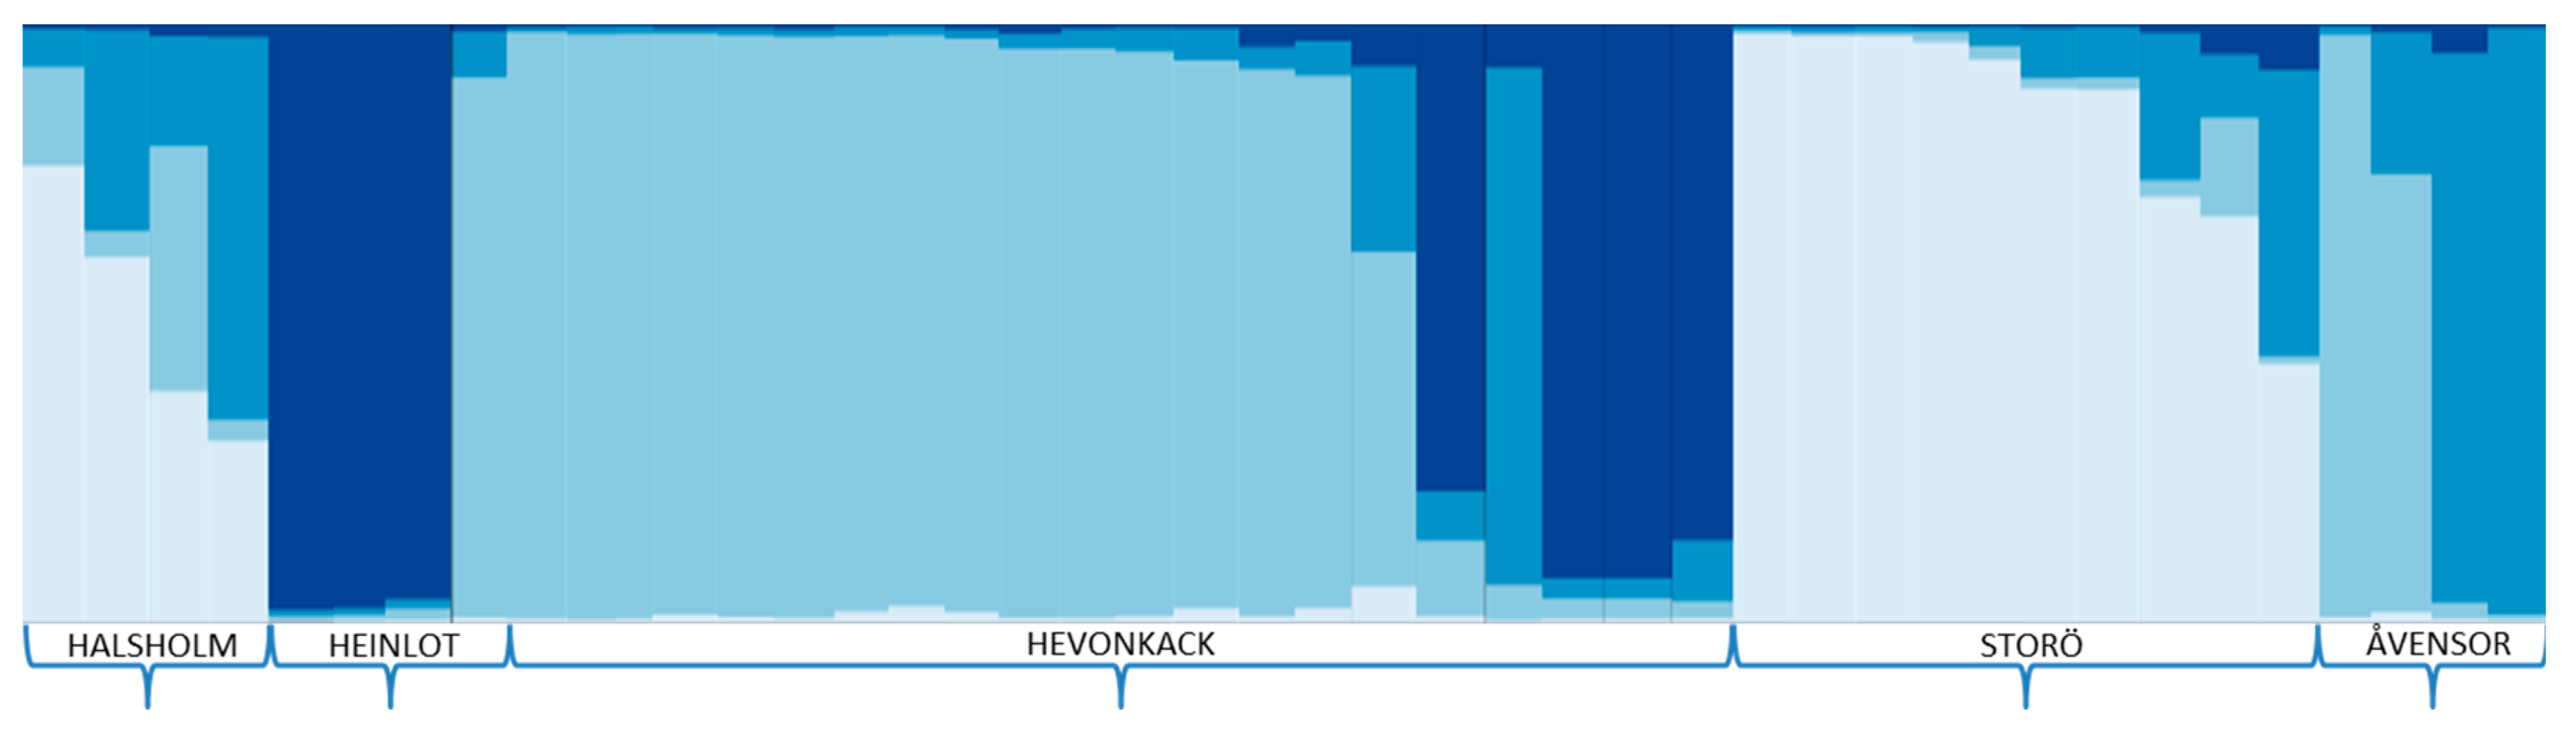
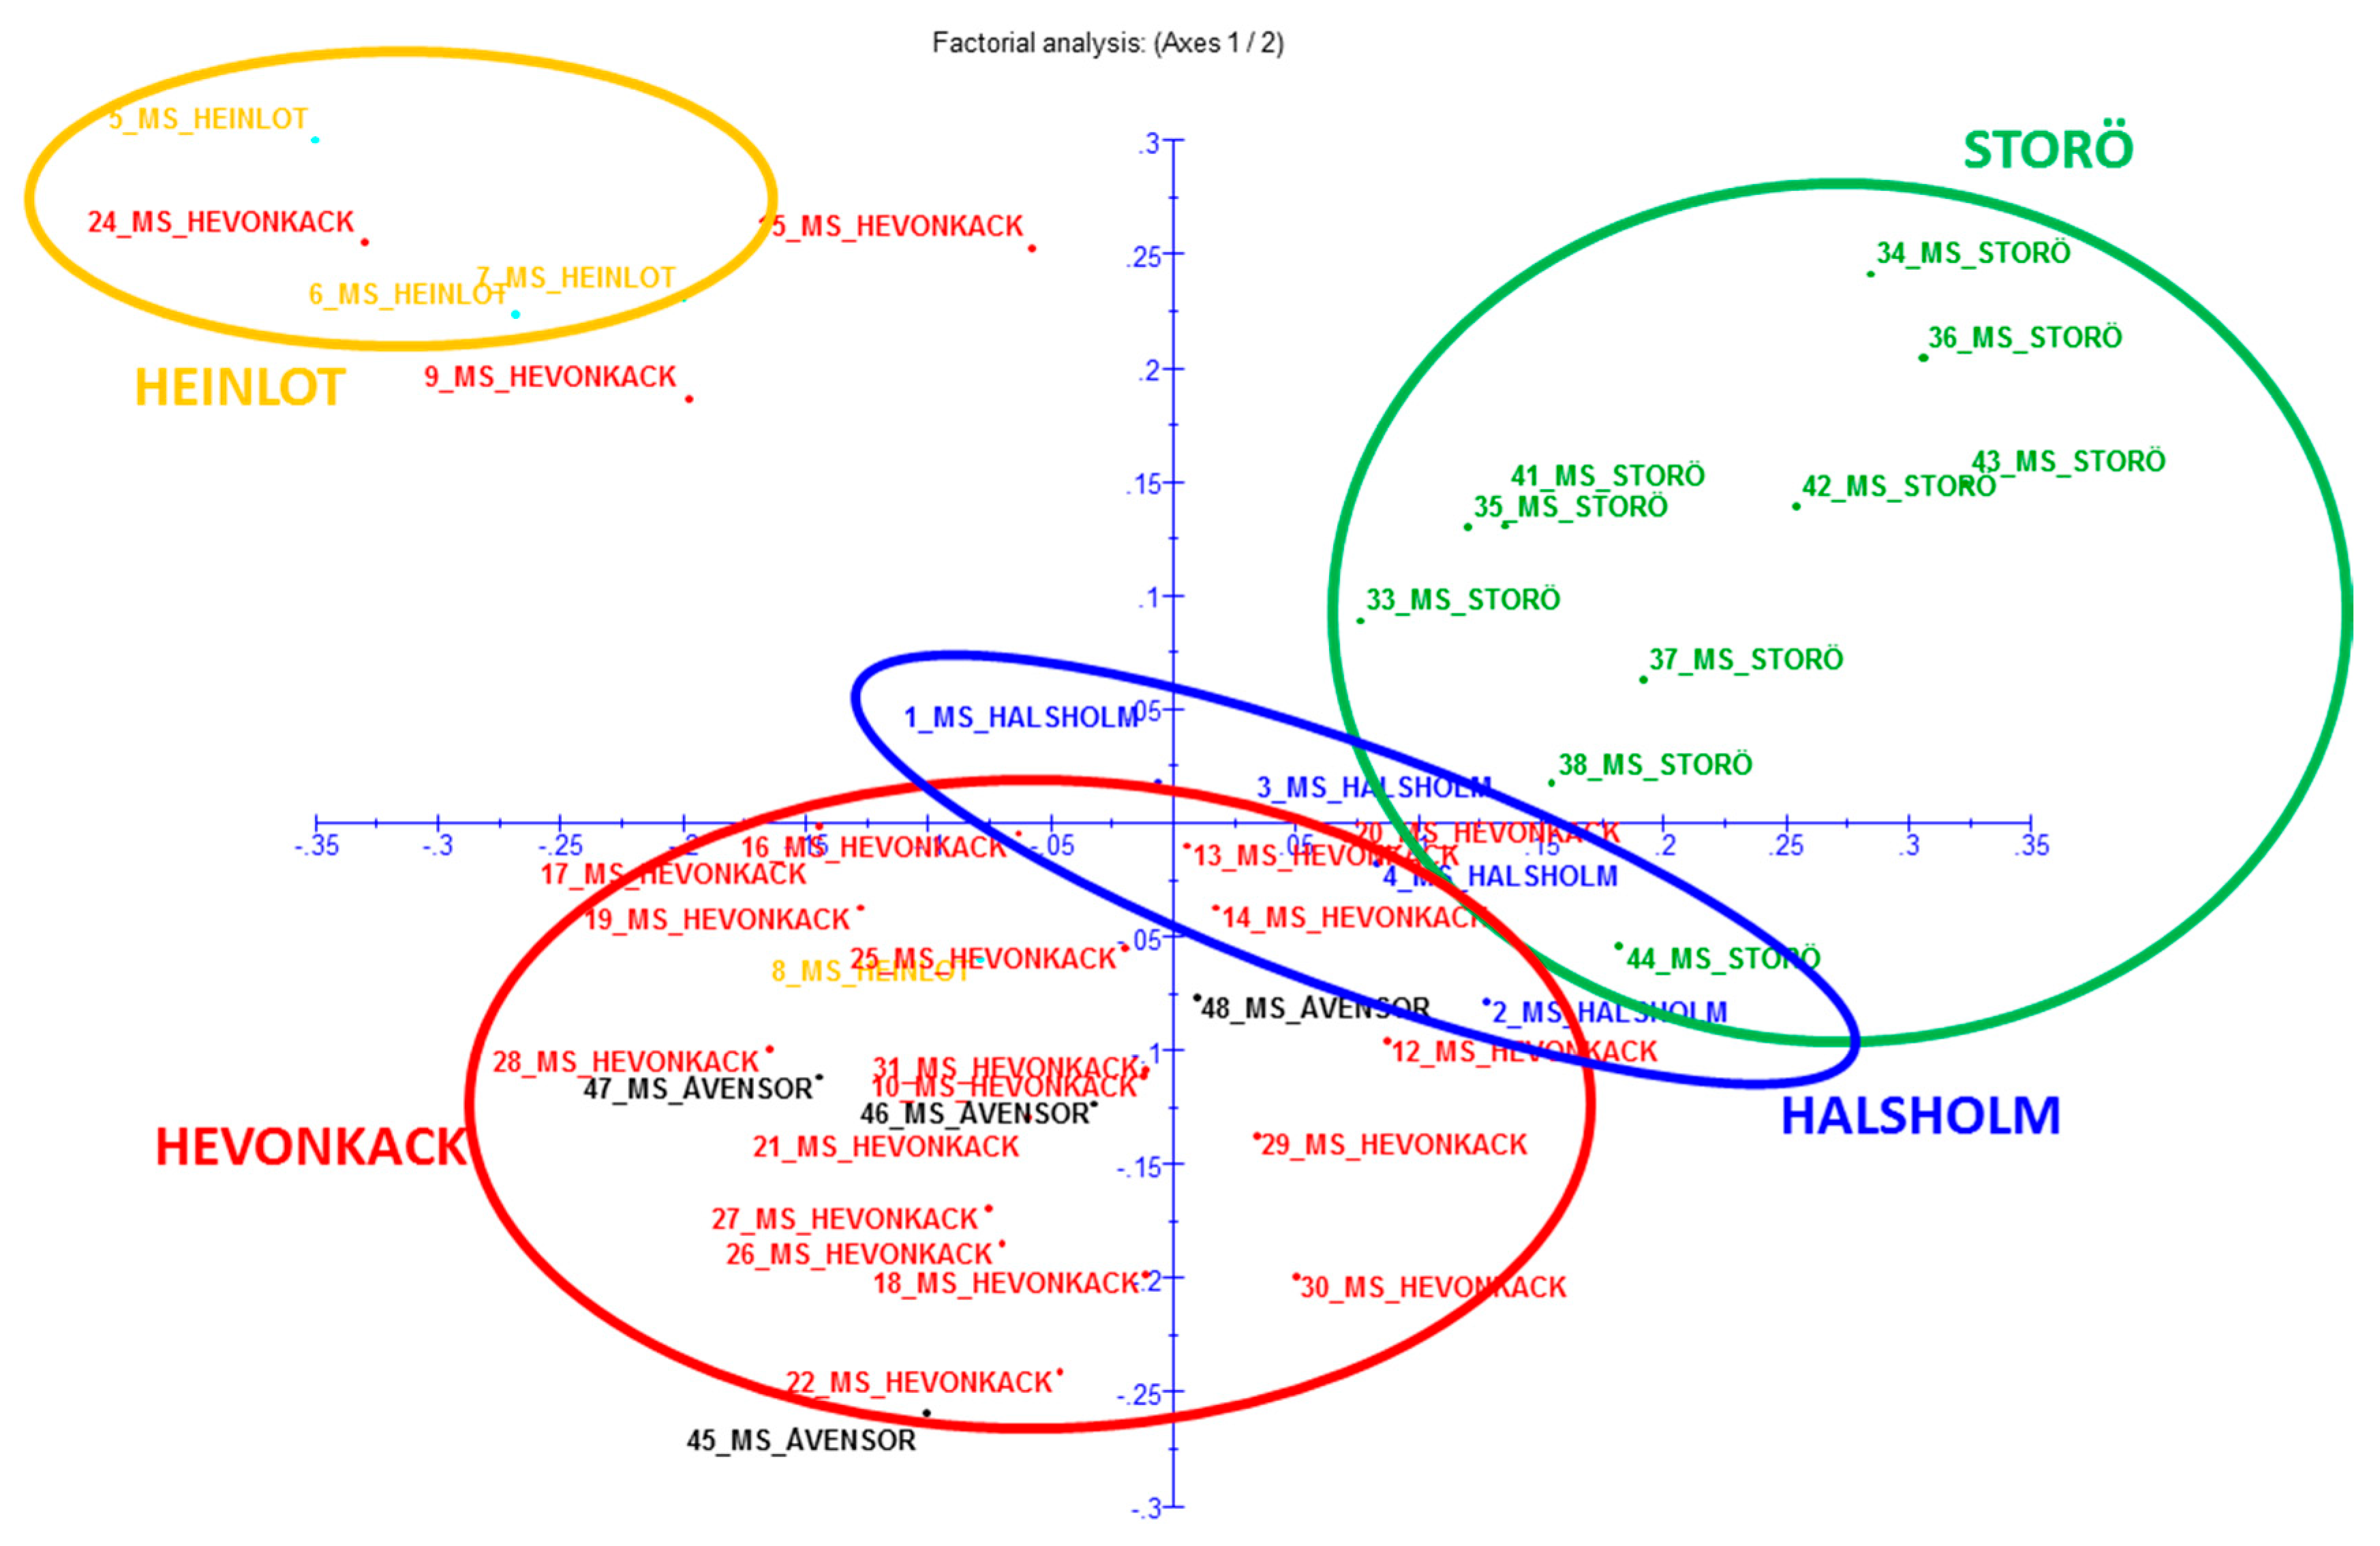
3.3. Are Finnish M. sylvestris Populations Genetically Differentiated?
4. Conclusions
Supplementary Materials
Author Contributions
Funding
Acknowledgments
Conflicts of Interest
References
- Cornille, A.; Giraud, T.; Smulders, M.J.M.; Roldán-Ruiz, I.; Gladieux, P. The domestication and evolutionary ecology of apples. Trends Genet. 2014, 30, 57–65. [Google Scholar] [CrossRef]
- Jacques, D.; Vandermijnsbrugge, K.; Lemaire, S.; Antofie, A.; Lateur, M. Natural distribution and variability of wild apple (Malus sylvestris) in Belgium. Belg. J. Bot. 2009, 1, 39–49. [Google Scholar]
- Frankham, R.; Ballou, J.D.; Briscoe, D.A. Introduction to Conservation Genetics, 2nd ed.; Cambridge University Press: Cambridge, UK, 2010; pp. 29, 64, 531. [Google Scholar]
- Guarino, L. Assessing the threat of genetic erosion. In Collecting Plant Genetic Diversity-Technical Guidelines; Guarino, L., Rao, V.R., Reid, R., Eds.; CAB International: Wallingford, UK, 1995; pp. 67–74. [Google Scholar]
- Hammer, K.; Knupffer, H.; Xhuveli, L.; Perrino, P. Estimating genetic erosion in landraces—Two case studies. Genet. Resour. Crop Evol. 1996, 43, 329–336. [Google Scholar] [CrossRef]
- Broothaerts, W.; Neram, I.; Keulemans, J. Update on and Review of the Incompatibility (S-) Genotypes of Apple Cultivars. Hort. Sci. 2004, 39, 943–947. [Google Scholar] [CrossRef] [Green Version]
- Kron, P.; Husband, B. Hybridization and the reproductive pathways mediating gene flow between native Malus coronaria and domestic apple, M. domestica. Botany 2009, 87, 864–874. [Google Scholar] [CrossRef]
- Larsen, A.; Jensen, M.; Kjaer, E. Crossability Between Wild (Malus sylvestris) and Cultivated (M. × domestica) Apples. Silvae Genet. 2008, 57, 127–130. [Google Scholar] [CrossRef] [Green Version]
- Larsen, A.S.; Asmussen, C.B.; Coart, E.; Olrik, D.C.; Kjær, E.D. Hybridization and genetic variation in Danish populations of European crab apple (Malus sylvestris). Tree Genet. Genomes 2006, 2, 86–97. [Google Scholar] [CrossRef] [Green Version]
- Coart, E.; Vekemans, X.; Smulders, M.J.M.; Wagner, I.; Van Huylenbroeck, J.; Van Ockstaele, E.; Roldán-Ruiz, I. Genetic variation in the endangered wild apple (Malus sylvestris (L.) Mill.) in Belgium as revealed by amplified fragment length polymorphism and microsatellite markers. Mol. Ecol. 2003, 12, 845–857. [Google Scholar] [CrossRef]
- Reim, S.; Höltken, A.; Höfer, M. Diversity of the European indigenous wild apple (Malus sylvestris (L.) Mill.) in the East Ore Mountains (Osterzgebirge), Germany: II. Genetic characterization. Genet. Resour. Crop Evol. 2013, 60, 879–892. [Google Scholar] [CrossRef]
- Schnitzler, A.; Arnold, C.; Cornille, A.; Bachmann, O.; Schnitzler, C. Wild European Apple (Malus sylvestris (L.) Mill.) Population Dynamics: Insight from Genetics and Ecology in the Rhine Valley. Priorities for a Future Conservation Programme. PLoS ONE 2014, 9, e96596. [Google Scholar] [CrossRef] [Green Version]
- Czarna, A.; Nowińska, R.; Gawrońska, B. Malus × oxysepala (M. domestica Borkh. × M. sylvestris Mill.)—A new spontaneous apple hybrid. Acta Soc. Bot. Pol. 2013, 82, 147–156. [Google Scholar] [CrossRef] [Green Version]
- Gross, B.L.; Henk, A.D.; Forsline, P.L.; Richards, C.M.; Volk, G.M. Identification of interspecific hybrids among domesticated apple and its wild relatives. Tree Genet. Genomes 2012, 8, 1223–1235. [Google Scholar] [CrossRef]
- Cornille, A.; Giraud, T.; Bellard, C.; Tellier, A.; Le Cam, B.; Smulders, M.J.M.; Kleinschmit, J.; Roldán-Ruiz, I.; Gladieux, P. Postglacial recolonization history of the European crabapple (Malus sylvestris Mill.), a wild contributor to the domesticated apple. Mol. Ecol. 2013, 22, 2249–2263. [Google Scholar] [CrossRef]
- Velasco, R.; Zharkikh, A.; Affourtit, J.; Dhingra, A.; Cestaro, A.; Kalyanaraman, A.; Fontana, P.; Bhatnagar, S.K.; Troggio, M.; Pruss, D.; et al. The genome of the domesticated apple (Malus × domestica Borkh.). Nat. Genet. 2010, 42, 833. [Google Scholar] [CrossRef]
- Coart, E.; Van Glabeke, S.; De Loose, E.; Larsen, A.S.; Roldán-Ruiz, I. Chloroplast diversity in the genus Malus: New insights into the relationship between the European wild apple (Malus sylvestris (L.) Mill.) and the domesticated apple (Malus domestica Borkh.). Mol. Ecol. 2006, 15, 2171–2182. [Google Scholar] [CrossRef]
- Fitzgerald, H. The national crop wild relative strategy report for Finland. MTT Jokioinen 2013, 9–24. [Google Scholar] [CrossRef]
- Murto, R. Present status and distribution of European wild apple (Malus sylvestris) in Finland. Sorbifolia 1985, 16, 87–95. [Google Scholar]
- Sarvarinne, J. European wild apple from Turku archipelago. Sorbifolia 2006, 37, 51–58. [Google Scholar]
- Murto, R. Collecting knowledge about the habitats of European wild apple. Sorbifolia 1984, 15, 7–8. [Google Scholar]
- Hinneri, S. Malus sylvestris in the archipelago of Turku, SW Finland. Sorbifolia 1985, 16, 39–47. [Google Scholar]
- Lindberg, B.; Lunden, O.; Sjöberg, V. Internationella frukt utställiningen i St Petersborg hösten 1895. Trägårdsvännen 1895, 3, 25–36. [Google Scholar]
- Collan, O. Suomen hedelmänviljelys hedelmätarhojamme v. 1929 kohdanneen tuhon valossa. In Valtion Maatalouskoetoiminnan Julkaisuja 60; Valtioneuvoston kirjapaino: Helsinki, Finland, 1934. [Google Scholar]
- Liebhard, R.; Gianfranceschi, L.; Koller, B.; Ryder, C.D.; Tarchini, R.; Van de Weg, E.; Gessler, C. Development and characterisation of 140 new microsatellites in apple (Malus × domestica Borkh.). Mol. Breed. 2002, 10, 217–241. [Google Scholar] [CrossRef]
- Hokanson, S.C.; Lamboy, W.F.; Szewc-McFadden, A.K.; McFerson, J.R. Microsatellite (SSR) variation in a collection of Malus (apple) species and hybrids. Euphytica 2001, 118, 281–294. [Google Scholar] [CrossRef]
- Silfverberg-Dilworth, E.; Matasci, C.L.; Van de Weg, W.E.; Van Kaauwen, M.P.W.; Walser, M.; Kodde, L.P.; Soglio, V.; Gianfranceschi, L.; Durel, C.E.; Costa, F.; et al. Microsatellite markers spanning the apple (Malus × domestica Borkh.) genome. Tree Genet. Genomes 2006, 2, 202–224. [Google Scholar] [CrossRef] [Green Version]
- Garkava-Gustavsson, L.; Mujaju, C.; Sehic, J.; Zborowska, A.; Backes, G.M.; Hietaranta, T.; Antonius, K. Genetic diversity in Swedish and Finnish heirloom apple cultivars revealed with SSR markers. Sci. Hort. 2013, 162, 43–48. [Google Scholar] [CrossRef]
- Kalinowski, S.T.; Taper, M.L.; Marshall, T.C. Revising how the computer program CERVUS accommodates genotyping error increases success in paternity assignment. Mol. Ecol. 2007, 16, 1099–1106. [Google Scholar] [CrossRef] [PubMed]
- Szpiech, Z.A.; Jakobsson, M.; Rosenberg, N.A. ADZE: A rarefaction approach for counting alleles private to combinations of populations. Bioinformatics 2008, 24, 2498–2504. [Google Scholar] [CrossRef] [Green Version]
- Perrier, X.; Jacquemoud-Collet, J.P. DARwin Software. 2006. Available online: http://darwin.cirad.fr/ (accessed on 29 November 2019).
- Pritchard, J.K.; Stephens, M.; Donnely, P. Inference of population structure using multilocus genotype data. Genetics 2000, 155, 945–959. [Google Scholar]
- Earl, D.A.; von Holdt, B.M. STRUCTURE HARVESTER: A website and program for visualizing STRUCTURE output and implementing the Evanno method. Conserv. Genet. Resour. 2012, 4, 359–361. [Google Scholar] [CrossRef]
- Evanno, G.; Regnaut, S.; Goudet, J. Detecting the number of clusters of individuals using the software STRUCTURE: A simulation study. Mol. Ecol. 2005, 14, 2611–2620. [Google Scholar] [CrossRef] [Green Version]
- Jakobsson, L.; Rosenberg, N.A. CLUMPP: A cluster matching and permutation program for dealing with label switching and multimodality in analysis of population structure. Bioinformatics 2007, 23, 1801–1806. [Google Scholar] [CrossRef] [PubMed] [Green Version]
- Rosenberg, N.A. Distruct: A program for the graphical display of population structure. Mol. Ecol. Notes 2004, 4, 137–138. [Google Scholar] [CrossRef]
- Raymond, M.; Rousset, F. GENEPOP (version 1.2): Population genetics software for exact tests and ecumenicis. J. Hered. 1995, 86, 248–249. [Google Scholar] [CrossRef]
- Rousset, F. GENEPOP’007: A complete reimplementation of the GENEPOP software for Windows and Linux. Mol. Ecol. Resour. 2008, 8, 103–106. [Google Scholar] [CrossRef] [PubMed]
- Weir, B.S.; Cocherham, C.C. Estimating F-statistics for the analysis of population structure. Evolution 1984, 38, 1358–1370. [Google Scholar] [PubMed]
- Waples, R.S.; Do, C. LDNe: A program for estimating effective population size from data on linkage equilibrium. Mol. Ecol. Resour. 2008, 8, 753–756. [Google Scholar] [CrossRef] [PubMed] [Green Version]
- Cornille, A.; Gladieux, P.; Smulders, M.J.; Roldan-Ruiz, I.; Laurens, F.; Le Cam, B.; Nersesyan, A.; Clavel, J.; Olonova, M.; Feugey, L.; et al. New Insight into the History of Domesticated Apple: Secondary Contribution of the European Wild Apple to the Genome of Cultivated Varieties. PLoS Genet. 2012, 8, e1002703. [Google Scholar] [CrossRef] [Green Version]
- Ma, X.; Cai, Z.; Liu, W.; Ge, S.; Tang, L. Identification, genealogical structure and population genetics of S-alleles in Malus sieversii, the wild ancestor of domesticated apple. Heredity 2017, 119, 185–196. [Google Scholar] [CrossRef]
- Gross, B.L.; Henk, A.D.; Chritopher, M.; Richards, M.; Fazio, G.; Volk, G.M. Genetic diversity in Malus × domestica (Rosaceae) through time in response to domestication. Am. J. Bot. 2014, 101, 1770–1779. [Google Scholar] [CrossRef]


| No. | Sample Code | Species | Population(=name of the island) | Photos of the M. sylvestris apple fruits from one tree per island. |
|---|---|---|---|---|
| 1 | 1017_MS2016 | Malus sylvestris L. | HALSHOLM | 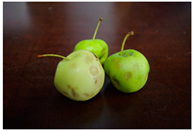 1019_MS2016 HALSHOLM 1019_MS2016 HALSHOLM |
| 2 | 1018_MS2016 | Malus sylvestris L. | HALSHOLM | |
| 3 | 1019_MS2016 | Malus sylvestris L. | HALSHOLM | |
| 4 | 1020_MS2016 | Malus sylvestris L. | HALSHOLM | |
| 5 | 1044_MS2016 | Malus sylvestris L. | HEINLOT | 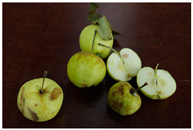 1045_MS2016 HEINLOT 1045_MS2016 HEINLOT |
| 6 | 1045_MS2016 | Malus sylvestris L. | HEINLOT | |
| 7 | 1046_MS2016 | Malus sylvestris L. | HEINLOT | |
| 8 | 1047_MS2016 | Malus sylvestris L. | HEINLOT | |
| 9 | 1021_MS2016 | Malus sylvestris L. | HEVONKACK |  1036_MS2016 HEVONKACK 1036_MS2016 HEVONKACK |
| 10 | 1022_MS2016 | Malus sylvestris L. | HEVONKACK | |
| 11 | 1023_ MS2016 | Malus sylvestris L. | HEVONKACK | |
| 12 | 1024_MS2016 | Malus sylvestris L. | HEVONKACK | |
| 13 | 1025_MS2016 | Malus sylvestris L. | HEVONKACK | |
| 14 | 1026_MS2016 | Malus sylvestris L. | HEVONKACK | |
| 15 | 1027_MS2016 | Malus sylvestris L. | HEVONKACK | |
| 16 | 1028_MS2016 | Malus sylvestris L. | HEVONKACK | |
| 17 | 1029_MS2016 | Malus sylvestris L. | HEVONKACK | |
| 18 | 1030_MS2016 | Malus sylvestris L. | HEVONKACK | |
| 19 | 1031_MS2016 | Malus sylvestris L. | HEVONKACK | |
| 20 | 1033_MS2016 | Malus sylvestris L. | HEVONKACK | |
| 21 | 1034_MS2016 | Malus sylvestris L. | HEVONKACK | |
| 22 | 1035_MS2016 | Malus sylvestris L. | HEVONKACK | |
| 23 | 1036_MS2016 | Malus sylvestris L. | HEVONKACK | |
| 24 | 1037_MS2016 | Malus sylvestris L. | HEVONKACK | |
| 25 | 1038_MS2016 | Malus sylvestris L. | HEVONKACK | |
| 26 | 1039_MS2016 | Malus sylvestris L. | HEVONKACK | |
| 27 | 1040_MS2016 | Malus sylvestris L. | HEVONKACK | |
| 28 | 1041_MS2016 | Malus sylvestris L. | HEVONKACK | |
| 29 | 1042_MS2016 | Malus sylvestris L. | HEVONKACK | |
| 30 | 1043_MS2016 | Malus sylvestris L. | HEVONKACK | |
| 31 | 1004_MS2016 | Malus sylvestris L. | STORÖ |  1004_MS2016 STORÖ 1004_MS2016 STORÖ |
| 32 | 1005_MS2016 | Malus sylvestris L. | STORÖ | |
| 33 | 1006_MS2016 | Malus sylvestris L. | STORÖ | |
| 34 | 1007_MS2016 | Malus sylvestris L. | STORÖ | |
| 35 | 1008_MS2016 | Malus sylvestris L. | STORÖ | |
| 36 | 109_MS2016 | Malus sylvestris L. | STORÖ | |
| 37 | 1010_MS2016 | Malus sylvestris L. | STORÖ | |
| 38 | 1011_MS2016 | Malus sylvestris L. | STORÖ | |
| 39 | 1013_MS2016 | Malus sylvestris L. | STORÖ | |
| 40 | 1014_MS2016 | Malus sylvestris L. | STORÖ | |
| 41 | 1015_MS2016 | Malus sylvestris L. | STORÖ | |
| 42 | 1016_MS2016 | Malus sylvestris L. | STORÖ | |
| 43 | 1001_MS2016 | Malus sylvestris L. | ÅVENSOR | 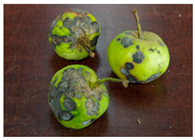 1003_MS2016 ÅVENSOR 1003_MS2016 ÅVENSOR |
| 44 | 1002_MS2016 | Malus sylvestris L. | ÅVENSOR | |
| 45 | 1003_MS2016 | Malus sylvestris L. | ÅVENSOR | |
| 46 | 1050_MS2016 | Malus sylvestris L. | ÅVENSOR |
| Species | Malus × domestica Borkh. (n = 46) | Malus sylvestris L. (n = 43) | ||||||||
|---|---|---|---|---|---|---|---|---|---|---|
| Locus/Parameter | Na | Ar | Ho | He | PIC | Na | Ar | Ho | He | PIC |
| CH01f02 | 15 | 9.13 | 0.867 | 0.886 | 0.863 | 12 | 7.61 | 0.837 | 0.830 | 0.798 |
| CH01f03 | 8 | 5.90 | 0.889 | 0.789 | 0.746 | 6 | 4.27 | 0.605 | 0.546 | 0.497 |
| CH01g12 | 13 | 7.96 | 0.844 | 0.827 | 0.795 | 13 | 9.43 | 0.953 | 0.884 | 0.862 |
| CH01h01 | 11 | 7.39 | 0.800 | 0.800 | 0.769 | 12 | 7.57 | 0.860 | 0.842 | 0.811 |
| CH01h02 | 8 | 5.35 | 0.644 | 0.651 | 0.607 | 10 | 7.51 | 0.907 | 0.819 | 0.787 |
| CH01h10 | 11 | 7.06 | 0.822 | 0.711 | 0.679 | 9 | 5.86 | 0.860 | 0.768 | 0.721 |
| CH02c09 | 8 | 7.01 | 0.867 | 0.868 | 0.842 | 6 | 4.68 | 0.581 | 0.630 | 0.587 |
| CH02c11 | 12 | 10.68 | 0.778 | 0.783 | 0.742 | 6 | 4.82 | 0.698 | 0.700 | 0.640 |
| CH02d08 | 18 | 9.28 | 0.778 | 0.905 | 0.886 | 7 | 5.02 | 0.628 | 0.589 | 0.552 |
| CH04c07 | 12 | 6.97 | 0.956 | 0.901 | 0.881 | 5 | 2.94 | 0.651 | 0.537 | 0.423 |
| CH04e05 | 11 | 6.00 | 0.756 | 0.796 | 0.760 | 2 | 1.32 | 0.023 | 0.023 | 0.023 |
| COL | 9 | 5.72 | 0.711 | 0.794 | 0.752 | 8 | 5.56 | 0.698 | 0.774 | 0.728 |
| GD12 | 8 | 9.90 | 0.756 | 0.715 | 0.671 | 6 | 4.77 | 0.419 | 0.712 | 0.658 |
| GD147 | 10 | 7.09 | 0.889 | 0.813 | 0.778 | 7 | 4.89 | 0.651 | 0.707 | 0.647 |
| Hi02c07 | 10 | 7.30 | 0.778 | 0.848 | 0.818 | 9 | 5.58 | 0.558 | 0.638 | 0.600 |
| Average | 10.93 | 2.44 | 0.81 | 0.81 | 0.77 | 7.87 | 2.08 | 0.66 | 0.67 | 0.62 |
| Population | HALSHOLM (n = 4) | HEINLOT (n = 4) | HEVONKACK (n = 21) | STORÖ (n = 10) | ÅVENSOR (n = 4) | ||||||||||
| Locus | Ar | Ho | He | Ar | Ho | He | Ar | Ho | He | Ar | Ho | He | Ar | Ho | He |
| CH01f02 | 2.64 | 0.750 | 0.750 | 2.24 | 0.500 | 0.464 | 6.31 | 0.905 | 0.840 | 5.20 | 0.900 | 0.832 | 3.46 | 0.750 | 0.786 |
| CH01f03 | 1.63 | 0.250 | 0.250 | 3.18 | 1.000 | 0.821 | 3.98 | 0.571 | 0.552 | 3.00 | 0.700 | 0.537 | 2.24 | 0.500 | 0.464 |
| CH01g12 | 3.18 | 1.000 | 0.821 | 3.61 | 1.000 | 0.857 | 7.92 | 0.905 | 0.842 | 5.31 | 1.000 | 0.858 | 3.03 | 1.000 | 0.750 |
| CH01h01 | 3.03 | 0.750 | 0.750 | 3.61 | 1.000 | 0.857 | 5.67 | 0.810 | 0.765 | 5.10 | 0.900 | 0.837 | 4.14 | 1.000 | 0.929 |
| CH01h02 | 3.07 | 1.000 | 0.786 | 3.61 | 1.000 | 0.857 | 6.03 | 0.810 | 0.753 | 5.30 | 1.000 | 0.837 | 4.14 | 1.000 | 0.929 |
| CH01h10 | 3.07 | 1.000 | 0.786 | 2.64 | 1.000 | 0.75 | 4.89 | 0.810 | 0.762 | 3.33 | 0.800 | 0.711 | 2.49 | 1.000 | 0.679 |
| CH02c09 | 1.89 | 0.250 | 0.536 | 3.46 | 0.500 | 0.786 | 4.61 | 0.667 | 0.612 | 2.74 | 0.600 | 0.616 | 1.91 | 0.500 | 0.571 |
| CH02c11 | 2.64 | 1.000 | 0.750 | 3.07 | 1.000 | 0.786 | 5.00 | 0.762 | 0.738 | 2.65 | 0.500 | 0.568 | 2.49 | 0.250 | 0.679 |
| CH02d08 | 2.43 | 0.750 | 0.607 | 3.07 | 0.750 | 0.786 | 3.69 | 0.524 | 0.508 | 2.49 | 0.700 | 0.542 | 2.43 | 0.750 | 0.607 |
| CH04c07 | 1.91 | 0.500 | 0.571 | 1.91 | 0.500 | 0.571 | 1.98 | 0.667 | 0.502 | 2.50 | 0.700 | 0.574 | 3.03 | 0.750 | 0.750 |
| CH04e05 | 1.00 | 0.000 | 0.000 | 1.00 | 0.000 | 0.000 | 1.00 | 0.000 | 0.000 | 1.00 | 0.000 | 0.000 | 1.63 | 0.250 | 0.250 |
| COL | 3.61 | 1.000 | 0.857 | 2.64 | 0.500 | 0.75 | 4.80 | 0.762 | 0.748 | 3.74 | 0.400 | 0.574 | 3.61 | 1.000 | 0.857 |
| GD12 | 2.49 | 0.500 | 0.679 | 2.64 | 1.000 | 0.75 | 4.36 | 0.333 | 0.735 | 1.82 | 0.100 | 0.268 | 3.61 | 1.000 | 0.857 |
| GD147 | 2.49 | 0.750 | 0.679 | 2.86 | 0.750 | 0.643 | 3.57 | 0.714 | 0.669 | 3.01 | 0.300 | 0.437 | 2.64 | 1.000 | 0.750 |
| Hi02c07 | 2.25 | 0.500 | 0.464 | 2.43 | 0.750 | 0.607 | 4.38 | 0.429 | 0.548 | 3.58 | 0.900 | 0.653 | 3.03 | 0.250 | 0.750 |
| Mean | 2.01 | 0.667 | 0.619 | 2.16 | 0.750 | 0.685 | 2.07 | 0.645 | 0.638 | 1.98 | 0.633 | 0.589 | 2.21 | 0.730 | 0.707 |
| Population/Parameters | FIS | P |
|---|---|---|
| Halsholm | −0.0796 | 0.9994 |
| Heinlot | −0.1166 | 0.9896 |
| Hevonkack | −0.0147 | high.sign. |
| Storö | −0.0383 | 0.1630 |
| Åvensor | −0.0586 | 0.9678 |
© 2019 by the authors. Licensee MDPI, Basel, Switzerland. This article is an open access article distributed under the terms and conditions of the Creative Commons Attribution (CC BY) license (http://creativecommons.org/licenses/by/4.0/).
Share and Cite
Bitz, L.; Heinonen, M.; Moisander, S.; Tanhuanpää, P.; Sarvarinne, J. Differential Allelic Richness between Malus sylvestris L. and Malus × domestica Borkh. from Finland as a Measure of Genetic Loss. Sustainability 2019, 11, 6949. https://doi.org/10.3390/su11246949
Bitz L, Heinonen M, Moisander S, Tanhuanpää P, Sarvarinne J. Differential Allelic Richness between Malus sylvestris L. and Malus × domestica Borkh. from Finland as a Measure of Genetic Loss. Sustainability. 2019; 11(24):6949. https://doi.org/10.3390/su11246949
Chicago/Turabian StyleBitz, Lidija, Maarit Heinonen, Sirpa Moisander, Pirjo Tanhuanpää, and Jukka Sarvarinne. 2019. "Differential Allelic Richness between Malus sylvestris L. and Malus × domestica Borkh. from Finland as a Measure of Genetic Loss" Sustainability 11, no. 24: 6949. https://doi.org/10.3390/su11246949