Discovering Potential Technology Opportunities for Fuel Cell Vehicle Firms: A Multi-Level Patent Portfolio-Based Approach


1
School of Economics and Management, Shanxi University, Taiyuan 030006, China
2
College of Information and Computer Science, Shanghai Business School, Shanghai 201400, China
3
School of Management Science and Engineering, Hebei University of Business and Economics, Shijiazhuang 050061, China
*
Author to whom correspondence should be addressed.
Sustainability 2019, 11(22), 6381; https://doi.org/10.3390/su11226381
Submission received: 3 October 2019
/
Revised: 7 November 2019
/
Accepted: 10 November 2019
/
Published: 13 November 2019
(This article belongs to the Special Issue Innovation and the Development of Enterprises)
Abstract
:Technology opportunity discovery (TOD) is an important technique to help fuel cell vehicle (FCV) firms keep market advantage and sustainable development. Under fierce competition in the new energy industry, there is an urgent necessity for innovative TOD methods to effectively identify technology opportunities for FCV firms. This study proposes a structured TOD framework with a multi-level identification process. Based on technology portfolio analysis, it fully integrates the firm’s technology level analysis, technology potential analysis and patent novelty analysis. A series of techniques such as LDA (latent Dirichlet allocation), MDS (multidimensional scaling) and LOF (local outlier factor) are also applied in the framework. A total of 14,858 granted patent data of the FCV industry containing 798 patents of the target firm were extracted from the Derwent Innovation Index database as the input data of the empirical study. The result shows that the framework can provide a more profound analysis for identifying technology opportunities, which offer more appropriate insights in both strategic and operational level technological decisions for technology-oriented firms.
Keywords:
technology opportunities; patent portfolio; text mining; LDA; patentometrics; MDS; LOF; visualization; fuel cell vehicle1. Introduction
Increasing awareness of environmental pollution and the growing energy crisis have spurred the interests of automobile industries in developing new energy alternatives [1]. In recent years, a comprehensive environmentally sustainable solution of energy issues in the transportation industry has been found by using hydrogen energy and fuel cell technology on cars [2]. Fuel cell vehicles (FCVs) are quiet, highly efficient, zero-emission and have an equivalent performance and range to their gasoline counterparts [3,4]. Therefore, the number of global automobile companies who have started to focus on the development of FCVs and R&D investments for those vehicles is escalating [5,6]. Due to the increase of social demands on advanced technology and the enhancement of industrial competition, FCV firms intensively require new promising technology that has the potential to sustainably secure their competitiveness and development.
To this end, technology opportunity discovery (TOD) has been employed to deal with this problem. TOD was initially introduced and applied by Georgia Technology Policy and Assessment Center in the 1990s to identify emerging technologies in strategic planning [7]. Since then, TOD has gradually become an established technique for technological innovation [8,9]. It is a starting point for managing technology activities, such as technology acquisition and exploitation [10]. Making technology development decisions based on proper and practical technology opportunities often leads to a a more efficient R&D process while reducing the risk level of R&D investment [11,12]. Given these advantages, TOD plays a vital role in FCV firm’s strategic R&D decisions as well as their sustainable development.
However, emerging new technology areas are challenging the traditional TOD method. With the explosion of FCV technology in recent years, the boundary of its technology field has renewed more frequently, and the evaluation standard has to be altered all the time. So as to solve this problem, a general and flexible TOD method is urgently needed. Additionally, the practicability of the TOD method towards individual firms has been highlighted. Typically, the process of identifying technology opportunities begins with the discovery of the technological gap and vacuum, and then each potential technology is screened and evaluated for its value of opportunity. Though this method can be useful in terms of the total industry, it may offer limited help for individual firms. This is because the technology capacity of each firm is different, as is their status in the market competition and the benefit they can obtain by developing a certain type of technology. A better TOD method should fully consider the technology capacity of the target firm and discover a technology opportunity which suits the target firm.
In this study, we propose a systematic TOD framework with a multi-level process to identify technology opportunities and select a proper R&D direction for FCV firms. The framework we present here is based on the collection and analysis of systematic patent information. The latent Dirichlet allocation (LDA) technique is applied to identify the technology groups as well as the technology portfolio of the target firm. The multi-level design of the identification process helps the target firm integrate technology level, technology potential, and patent novelty analyses, all of which form a comprehensive analysis of technology opportunity for the target firm. An empirical study of an FCV firm verifies the effectiveness of this framework and shows how the framework identifies the technology or patent which has the potential to enhance a firm’s technology competitiveness.
2. Literature Review
Technological change brings vast opportunities for technology-intensive industries. A lot of firms embrace this change through new technology development to improve the performance and competitiveness of their products. During this process, the development priority of the technology category is the key question to enhance the competitiveness of firms with limited resources. For this reason, a vast amount of literature has researched the development and practice of the TOD method, which can help firms quickly identify the latest research development and effectively locate their direction of technology development. Additionally, up-to-date patent documents data have long been considered as valid technical sources that reflect the current state of technological advancements [13] and also contain inventive knowledge with economic value [14]. Consequently, the application of patent data in TOD methods has been widely explored by prior studies as a popular framework to identify technology opportunities.
Some literature has used patent data to fit the growth curves of the patents in order to predict the timing of emerging technologies and evaluate the life cycles of these technologies. This literature has extracted implications from these analyses and has suggested strategic directions for technology development [15,16,17]. Some studies have applied patent maps and networks to analyze the characteristics of specific patents and patent groups [18]. Patent data is useful in detecting novel patents [19], evaluating patent vacant areas [20] and tracing evolutionary pathways [21]. Other studies have also developed novel methods to identify new technology opportunities by using systematic innovation theories, such as disruptive innovation [22], morphology analysis [23], and system evolution patterns [24]. Though many methods have been developed and continuously improved, most literature has not focused on the portfolios of existing technology for target firms. These studies are usually industry-scope analysis, which might not be appropriate or applicable for the target firm. A framework which is flexible and suitable for specific target firms is still rare. To ensure the appropriateness and successfulness of the firm’s TOD process and R&D direction, we proposed a novel TOD framework which comprehensively considers the technology portfolio of the target firm, moving the research scope from the industry level to the firm level.
TOD methods that involve technology forecasting and innovative technology identification have been actively discussed for a long time. Recent TOD studies have started to highlight the importance of technology capabilities to fully understand firms’ innovation direction. Some studies of customized TOD have identified technology opportunities by integrating text mining techniques and other methods, such as collaborative filtering [25], association rule mining [12], and the syntactic and semantic analysis of technical sentences [11,26]. The first step of their procedure has been to define a target firm’s products or technologies. For example, technology capabilities are typically defined as products, technology keywords, patent classification and technology functions (e.g., action–object or subject–action–object structures) that appear in the firm’s owned patents. Additionally, another important issue is the practical operationalization of enterprise functions, including R&D, product development, and strategic planning. Recently, some researchers have also introduced technology planning [27], product development [28] and business planning [26,29] in TOD. They have identified technology opportunities, extracted information (e.g., technical performance metrics, product attributes and business items), linked each technology opportunity to relevant information, and evaluated the strategic priority of each technology.
However, these proposed methods are defective in several ways. First, most studies have usually used individual technology and product information as input data to analyze technology opportunities, but technology portfolios have not been considered. Previous studies have indicated that the strategic planning of the technology-oriented firm should take full account of the firm’s patent portfolio, because it enables R&D project managers to understand the technological capabilities and competitive position of the firm in a specific technology field and make comprehensive technology plans [30,31,32,33,34]. Second, many studies have not well-specified the strategic significance of a technology vacuum to the firm. Some of them have directly regarded the technology vacuum as the only indicator of technology opportunity, which is not adequate. The scope of technology opportunities should be exhibited in more aspects. Thus, the existing approaches are weakly connected to practical operations for R&D planning. To address these limitations, this paper presents a novel multi-level TOD framework that jointly considers the technology portfolio, technology potential and patent novelty of the firm. Moreover, we demonstrate the implication of technology vacuum for the firms’ technology decisions from a new perspective, which makes the proposed TOD framework more explanatory and reliable in practice.
3. Methodology
3.1. Topic Analysis
Topic modeling is a popular text-mining technique for discovering hidden topics from a text corpus [35]. The first-generation of topic models were able to capture different thematic topics covered by document collections, and LDA is the best-known one. LDA is based on the Bayesian statistical method to infer the meaning of each word based on its neighboring or co-occurring words [36]. The basic assumption is that documents are mixtures of latent topics, wherein each topic is a distribution of words. Each word that appears in the document is assigned to a topic with a certain probability, and its meaning might change with the semantic association of other words in the document [35]. Since the LDA model is regarded as a sophisticated statistical modeling technique on the automatic identification, extraction and conceptualization of scientific topics when analyzing a large text corpus [37,38], it is also appropriate to be applied to group patents. In this paper, we employed the LDA model to group patents whose technological functions were similar and to derive topics based on the co-occurrence of words and extracts key technology topics. Finally, the model can be used to offer insights into the R&D focus and strategic orientation of firms. The results are presented through a defined portfolio of technology topics, in which each technology topic obtains a weight based on probabilistic distribution. Generally, the high weight of a certain technology topic indicates the knowledge specialty of the firm, while the low weight of a technology topic might reveal an underdeveloped strategic orientation. Hereafter, we determine technology topics as technology groups that represent different fields of technology.
3.2. Technical Specialization
Technical specialization reflects the degree to which the firm has mastered technical knowledge in a specific field. Generally, the higher the degree of technical specialization, the easier the firm can accumulate technical knowledge. A low degree of technical specialization indicates that a firm is less focused on this technical field. Since there is no fixed algorithm for calculating technical specialization, in this paper, we measured the level of technical specialization for patent assignees by generating a technology level map with comparative advantage indicators. The technology level map consisted of two dimensions which were represented in two axes, i.e., x and y.
1. Relative Technological Comparative Advantage
Axis x is defined as the relative technological comparative advantage (TCA). In the existing literature, the TCA has been used as the industrial specialization index for quantitative evaluating a country’s technology competitiveness [39]. While our study was based on firm-level patent data, some modifications had to be made to calculate firm-level specialization scores, which is shown in Equation (1),
Here, Pij represents the number of patents of firm j which belongs to a given technology group i. Consequently, the value of x is obtained by subtracting the average TCA value of the other firms from the TCA value of the target firm. Thus, it represents the relative quantitative technology level of a target firm in a given technology group. If the TCA value of a specific technology group for a given firm is above 0, the firm is specialized in that group; and if the TCA value is below 0, the firm is not specialized in that group.
2. Relative Technology Impact Index
Likewise, axis y is defined as the relative technology impact index (TII). The value of the TII is calculated as Equation (2),
Here, Cij presents the total cited number of patents that firm j possesses in the technology group i. The value y is obtained by subtracting the average TII value of the other firms from the TII value of the target firm. Therefore, different from TCA, the TII represents the relative quality technology level of innovation accomplishment.
Figure 1 shows the six grades of the technology level in a given field. The TCA and TII values were used to judge the technology level of the firms. Grades ① and ④ indicate that the technology groups are untapped vacant technology. Grade ② indicates that the technology group of the target assignee is inferior in technology specialization. All grades above imply that the target firm has a relatively lesser advantage than the leading firms. Technology groups at Grades ③ and ⑤ have the potential to become more specialized because they have a relatively a high quantitative or qualitative advantage of patents. Technology groups at Grade ⑥ have the highest levels of technology specialization.
3.3. Evaluation Indicators
The purpose of technology opportunity analysis is to explore the development potential of technology, identify probable future technologies, and establish the technology development strategy for target patent assignee. To this end, we measured the potential of each technology group by integrating the competitive strength, technology cycle time, and marketability.
1. Competitive Strength
The competitive strength of the technology k is calculated according to the entropy index (EI), which is shown in Equation (3),
Indicator pi is the patent share of the ith firm among all firms, n is the total number of firms in the industry. Originally, the EI was used to evaluate industry concentration and firm diversity [40]. When using patent data, the EI can provide valuable information for firms about the distribution of different technologies capabilities in the total industry, which can also represent the intensity of the technology competition. When the value of the EI is close to zero, little competition exists in the current technology group, i.e., all technological innovations are monopolized by a few firms. In contrast, when the value of the EI equals to the maximum value (logn), technological innovation activities are distributed among a large number of firms in the industry, which represents a high competition of technology development. Additionally, the competitive strength also reflects the extent of difficulties for the firm to entry and expand to the promising technology field. When the competition is high, a huge barrier between firms in this technology group has not formed, which is a positive sign for a firm to develop this technology.
2. Technology Cycle Time
The indicator of technology cycle time (TCT) was employed for measuring the pace of technological progress or change. The length of the TCT depends on the time lag between a set of current patents and their prior art. This indicator can measure how long the prior granted patents and corresponding scientific information have impacted on the newly appeared technology [41]. Then the formula for calculating TCT is given by
where patent j cites patent i for j = 1, 2, …, ri, ri is the number of patents citing the patent i, and N denotes the number of patents. TCT represents the average value of the median time gaps between the target patent and its cited patents in terms of a given technology k. The value of TCT varies based on the type of technologies. A smaller TCT value refers to faster-moving technologies, while a larger TCT value refers to slower-moving technologies [42].
3. Marketability
When analyzing marketability, the scale of family patents can be used to estimate the market size, which implies the potential value which the firm can derive through the commercialization of corresponding patents. The marketability index (MI) is calculated by Equation (5),
where FCi represents the number of countries in the patent family and N denotes the number of patents. On one hand, the patent family directly indicates the geographical protection region of the patent. On the other hand, the patent family indirectly provides information on the potential technical value of the patent and the significance of the patent according to the size of the application region. When the value of the MI is large, the patent in the technology group is more likely to be applied in more countries, which indicates a higher potential commercial value the firm can derive.
As these three technological assessment indicators have different value range, we normalized all indicators with a scale between 0 and 100. The priority of a technology group was given by measuring the final average value of the standard normalized value per technology group. The higher the values of the EI and the MI, the higher the priority. In contrast, the larger the value of TCT, the lower the priority.
3.4. Multidimensional Scaling
Multidimensional scaling (MDS) is a nonparametric, distance-based multivariate analysis technique that generates statistical maps based on the main features of the data. It has the advantage of making the results accessible to non-specialists in an intuitive manner [43]. In this study, we first calculated the dissimilarity of the patents, and then we mapped the patents on a lower dimension-feature space. Finally, we identified the coordinates of the patents. Patent visualizing provides an overall understanding of the given patent set. The novel patents can be derived by exploiting the MDS, and the content information of the novel patents can be considered the beginning of new technology fields.
3.5. Local Outlier Factor
In general, the outlier patents have a strong possibility of being unusual items of inventions, because they are distinctive in terms of structural similarity. Local outlier factor (LOF) is an anomaly detection algorithm that compares the local density of a point’s neighborhood with those of its neighbor points. It represents the degree of an object’s outlier from a cluster [44]. LOF is able to capture outlier data, which are more valuable and more difficult to be extracted than normal data. Researchers have proposed many outlier mining algorithms that could effectively detect outlier data in a data set [45,46]. In this paper, the final output of LOF was used to discover technology opportunities.
4. A Multi-Level Framework Based on Patent Portfolio Analysis for Identifying a Firm’s Technology Opportunities
The purpose of this research was to develop a procedural framework based on formal methods to help firms identify promising technology opportunities and establish R&D strategies based on target firms’ existing internal technology portfolio. Figure 2 illustrates our proposed framework, which consisted of five steps: (1) data collection and pre-processing, (2) generating technology capability portfolios, (3) developing technology level mapping, (4) evaluating the potential technology areas, and (5) identifying novel patents. Then, we introduced the details of each step and demonstrated why the corresponding technique is effective in evaluating technology opportunity for the target firm.
4.1. Data Collection and Pre-Processing
In this paper, we collected patents from the Derwent Innovation Index database, which includes over 16 million inventions from 41 worldwide patent-issuing authorities. The relevant information, such as patent number, patent title, patent abstract, granted year, patent assignee, citation, and classification code, was extracted and stored as the basis for the next steps. VantagePoint’s text mining software was used for data cleaning and statistical analysis. In addition, the patent assignee is the entity that holds the property right to the patent, which is usually an organization or firm. In this paper, the patent assignees were considered as firms.
4.2. Generating the Firm’s Technology Capability Portfolios
To determine an appropriate R&D strategy with good practicability and potential for a target firm, the implementation of the TOD needs to be based on the firm’s technology capability portfolio. Therefore, the proposed methodology should contain each firm’s technology portfolio as a set of its patents, and structure each firm as an assignee–technology distribution vector by applying an LDA topic model. The topic which contributes the most to a patent becomes its technological group. According to these definitions, this study constructed assignee–technology portfolio vectors as [P1,j,P2,j,…,Pi,j,…,Pn,j] and [C1,j,C2,j,…,Ci,j,…,Cn,j], in which Pi,j denotes the number of patents of firm j in a given technology group i, and Ci,j denotes the cited number of patents that firm j possesses in the technology group i. In addition, Derwent Manual Codes (DMCs) system was chosen as the assistant analysis tool to explore the main technological sub-areas. This is because the DMCs are more detailed in activities and technical applications in the areas of mechanical engineering and electricity. In this way, this step generates assignee–technology vectors for all technology groups.
4.3. Developing Technology Level Map
The fundamental purpose of measuring a technology level is to identify key technology groups and give proper guidance for firms to enhance their technological competitiveness. Hence, the idea of this step is to confirm the specialization degree of key technologies of a firm while also identifying the candidate R&D directions from a large number of relevant technologies. Specifically, the technical specialization score is calculated for each patent assignee according to Equations (1) and (2). Then the TCA and TII scores can be jointly applied to judge the technology development level.
Among the six grades of technological specialization shown in Figure 1, all Grades except ① and ④ indicate that a firm has some level of specialization in this technology group. On the contrary, Grades ① and ④ are identified as key vacant technology areas. In the same sense, the technology sub-group can be also evaluated using these grades.
Additionally, the technology level map and sub-technology level map play different roles in a firm’s technology identification. In this paper, we defined a multi-level identification process for the firm, which is characterized as follows. First, the firm learns its advanced technology and vacant technology depending on the technology level map from the scope of the technology group. Second, the firm locates the corresponding technology group which needs to be improved depending on the development strategy of the target firm, such as strengthening the advanced technology or strengthening the vacant strategy. Third, the target firm analyzes which technology sub-group needs to be improved given the purpose of improving the target technology group. The detail and rationale of this identification process are further introduced in the empirical study of FCV Firm X.
4.4. Evaluating the Potential of Technology Areas
The purpose of technology level analysis is to identify the candidate technology groups and sub-groups which need development; however, this analysis does not indicate whether these technology groups or sub-groups are worth developing. A firm might suffer from a lack of innovation ability in a specific key technology group. Thus, intuitively, the firm may consider this key technology group as a potential technology area. However, the firm may have other options with the consideration of its existing technology capability, strategic orientations, and market environment. These factors expand our scope in correctly evaluating the potential of a firm’s technology.
Our methodology uses several research indicators to evaluate whether or not the identified technologies are appropriate for the target firm to develop. The indicators that jointly reflect the technical decision-making process are competitive strength, technology cycle time, and marketability. The goal of this step is not to point out every vacant technology area of the firm in the technology distribution vectors or offer a ranking of all technologies for the firm but to suggest a few available candidate technology sub-groups (e.g., undeveloped but promising technologies that the firm does not own) that the firm could consider as the direction for future researching and developing.
4.5. Identifying Novel Patents
After knowing which technology sub-group needs to be improved and also has the greatest potential, the final step locates the firm’s development direction from the scope of technology sub-group to a specific patent. By identifying the most novel patents in key technology areas, the target firm can have a more specific understanding about which patent is more likely to lead the further technology development trend.
To this end, we have proposed a module that integrates the MDS and LOF methods to detect technological opportunities with a two-stage process. First, we generated an MDS map for the patents of the target firm. By applying the patent dissimilarity matrix to the MDS algorithm, the patents of the target firm were visualized as points in a two-dimension space. Meanwhile, we could identify the coordinates of the patents. Second, using these coordinates, we calculated the LOF values of the patents. Then a density-based outlier detection was conducted to quantify the outlier patents. When the density of a patent is much lower than its neighbors on the 2D space, it could be identified as an outlier patent, i.e., the novel patent.
5. Illustration and Discussion
5.1. Data
Since this research aimed to identify technology opportunities at the firm level in the FCV industry, Firm X was chosen as the target firm for the analysis in this study. Firm X has contributed to advance the development of fuel cell transportation alternatives through the development of FCV technologies. To derive the promising technology of Firm X, the patents applied for by Firm X and the patents applied for by 14 other industry-leading technology assignees between the years 2008 and 2017 were analyzed. The retrieval query was TS = (((fuel cell*) OR (fuelcell*) OR (fuel-cell*)) AND ((vehicle*) OR (car*) OR (bus*))). Finally, a total of 14,858 granted patents were captured as the data set, which contained 798 patents data of the target Firm X.
5.2. Identifying Technology Portfolio of Firm X
In order to identify technology groups for FCVs and measure the firm’s technology level, we applied the LDA technique on the document-term matrix of the 14,858 patents. In LDA, the number of topics indicates the number of latent dimensional factors. This number can be properly determined through a topic coherence test which measures the degree of semantic similarity between high scoring terms in a topic [47]. In this study, to find the best number of technology topic groups, we set the number of topics from five to fifteen and check the variation trend of the average topic coherence (See Figure 3).
The result shows that the average topic coherence first increased then decreased as the number of the topics increased from five to fifteen, and when the number of the topics was eight, the average coherence value was the highest (0.718). Therefore, we selected eight as the optimal topic number, which formed eight technology groups. Figure 4 reflects the quantity proportion of patents in each technology group in the whole FCV industry. The result shows that there were relatively more patents in the “membrane electrode assembly”, “temperature management”, “power converter and inverter” technology fields, and there were relatively fewer patents in fields of “fuel cell stack”, “hydrogen storage”, “powertrain”, “secondary battery” and “reforming” in the FCV industry.
Then, we focused on target Firm X. The analysis process above could also provide the technology portfolio of Firm X, which is illustrated in Figure 5. Compared with the total FCV industry, we can see that Firm X has obvious technology advantages in “powertrain” and “reforming” as well technology disadvantages in “fuel cell stack”, “secondary battery”, and “power converter and inverter”. While this analysis was only based on patent quantity, an integrated quantitative and qualitative analysis is shown in the next section.
We also obtained the technology portfolio from the perspective of the technology sub-group for subsequent analysis. For the convenience of reading the details of all semantic topics, the top ten ranked terms and the corresponding probabilities of each term are listed in Table A1 in Appendix A.
5.3. Constructing Technology Level Map of Firm X
Based on the technology portfolio we obtained before, we could further analyze the technology level of Firm X from the perspectives of both quantity and quality. Utilizing the relative advantage indicators of the patent (TCA and the TII), the technology level of Firm X in terms of each technology group was mapped to a TCA-TII coordinate system. As shown in Figure 6, each point represents a corresponding technology group, and the size of each point represents the number of contained patents. Then, the target technology groups were classified into different grades based on their relative TCA and TII scores. The results show that “powertrain”, “hydrogen storage” and “reforming” were classified as Grade ⑥, which indicates that Firm X has a high level of technical specialization in these technology groups. “Temperature management technology” was classified as Grade ⑤, which indicates a relatively high qualitative technology advantage. “Membrane electrode assembly”, “power converter and inverter”, and “fuel cell stack” were classified as Grade ②, which indicates that Firm X is relatively inferior in these technology groups from the perspectives of both quality and quantity. At last, “secondary battery technology” is a technology vacancy for Firm X because its relative TCA and TII value were both less than −0.5.
Then, we investigated the level of sub-technology of Firm X in the same way. The technology level maps of eight groups are given in Figure 7. The result shows that the level of technology group and sub-groups offered different messages for the firm. For example, the “reforming” group was identified as an advanced technology group, while its sub-group “hydrogen generation”. “H2 production and storage” and “control” were all inferior. The inferior group “power converter and inverter” still owned the advanced sub-group “DC–AC converter”. This is because the technology group is the integrated reflection of its sub-groups, and the sub-technology level may unbalance in one group.
This multi-level setting offers a better understanding of the technology level for firm X. When FCV firms make strategic development decisions, they tend to rely on the system-level performance of the firm. For example, a car’s driving experience in a certain aspect is directly reflected by the level of the corresponding technology group. After this, the technology groups are divided into different grades, and Firm X chooses the candidate technology groups according to its technology strategy. Then, from an operational perspective, the sub-technology level map can tell which technology sub-group is the weakest, i.e., the most urgent to be improved.
A detailed analysis shows how this decision process works. If the firm intends to strengthen the advanced technology, it can improve “powertrain”, “hydrogen storage” and “reforming”. If the firm intends to strengthen the weak technology, it can improve “secondary battery”, “fuel cell stack”, “power converter and inverter”, and “membrane electrode assembly”. Operationally, it can decide which technology sub-group to improve. For example, it can consider improving “transmission system and its control” when choosing “powertrain” (See f in Figure 7), “control” when choosing “hydrogen storage” (See e in Figure 7) or “hydrogen generation” and “H2 production storage” when choosing “reforming” (See g in Figure 7), because they are relatively weak or even vacant technology.
The identification of its technology level helps the firm know its advantage and weakness of their technology development and the candidate technologies which are in urgent need to be improved. However, it does not show which technology group or sub-group is the most appropriate or the priority to develop. In the next section, we answer this question by identifying the potential of each technology area.
5.4. Evaluating Potential Technology Areas of Firm X
After mapping the technology groups, we knew about the technological status quo of Firm X and the candidate directions of technology group or sub-group that Firm X intends to develop. Then we identified the potential of technology areas of Firms X, i.e., which candidate technology group or sub-group has the priority to be developed. To this end, the competitive strength, technology cycle time, and marketability perspectives were identified for each technology field.
The result of competitive strength shows that three out of eight technology groups (“reforming”, “temperature management” and “powertrain”) have entropy values 1.038, 0.974 and 0.944, respectively, which shows a small technology barrier. Thus, these three groups were identified as competitive technology groups for Firm X. Additionally, as the average entropy value of all technology groups was 0.914, it is clear that almost every firm owns patents in all these eight technology groups. Thus, considerable competition exists among the FCV firms in terms of technology development.
The result of the technology cycle time shows that the average TCT value was approximately four years and the TCT values of five technology groups (“membrane electrode assembly”, “fuel cell stack”, “secondary battery”, “reforming” and “hydrogen storage”) were less than four years. This result indicates that these five technology groups are the fastest developing and have great potential for continuous development.
To grasp the market size for each technology area, family patents were utilized to provide a perspective on market potential. The result of marketability shows that the average value of marketability for Firm X was 3.48. Specifically, the value of the marketability of “powertrain”, “reforming”, “temperature management”, “hydrogen storage” and “fuel cell stack” was higher than the average value. This indicates that Firm X has a higher potential in commercializing the technologies in these fields.
Finally, using the standard normalized value of these three indicators, we could quantitatively obtain the potential of each technology group and confirm its development priority. According to the analysis, “reforming” (Grade ⑥) shows the highest priority of development for Firm X, which is also its advanced technology. This is followed by “temperature management” (Grade ⑤) and “powertrain” (Grade ⑥). This result indicates that strengthening the advantages in these technical fields is a good strategy for Firm X at this stage. Through the analysis above, we could obtain the development priority of the technology groups of Firm X.
After locating the candidate technology groups, we could further perform a sub-technology analysis for Firm X. We took the relatively weak technology “membrane electrode assembly” group, which consists of eleven main technology sub-groups, as an example. In this technology group, most of the sub-groups were classified as inferior technology areas that need to be improved, and it was still difficult to tell which technology sub-group had the priority. Therefore, we continued to use technology potential indicators to analyze the sub-technology. In terms of competitive strength, the average EI of all “membrane electrode assembly” sub-groups was 0.918, which is higher than the total average EI. Therefore, a large number of firms have made efforts in the innovation of “membrane electrode assembly technology”, and the competition is fierce. In addition, the EI value of some other sub-technologies, such as “catalyst”, “catalyst electrodes”, “catalysts and supports”, “other polyelectrolytes, flocculants”, “acrylic polyelectrolytes, flocculants”, and “coating” was lower than the average EI, which indicates higher technology concentration. The technology cycle time for the eleven technology sub-groups showed a fast development pace. The market size was 3.46, which was slightly lower than the average market size of 3.48. Then, the standard normalized value for each sub-group was calculated to determine the development priority of each sub-technology. The result shows that the highest development priority of sub-technology in the “membrane electrode assembly technology” is “gas diffusion layer”, which is followed by “electrode materials” and “anode and cathode gases separators”. More details for the evaluation of sub-technology potential are shown in Table A2 (in Appendix A).
5.5. Discovering Novel Patents of Firm X
Using the proposed framework in the former chapter, the technology level and technology potential for each sub-group technology were identified. Then, we analyzed the novelty of patent. The patents that were invented by Firm X in the last three years were extracted for the analysis (118 patents). Then, we conducted dimensionality reduction using MDS towards the document dissimilarity matrix to form a patent map, which helped us obtain the similarities of patent documents. Figure 8 shows the patent map we constructed in this study, where each patent is represented as a point. Patents with higher similarity are closer in the figure, and the patents which are away from the other patents are more likely to be the novel ones.
In order to quantitatively identify the novel patent, we calculated the outlierness by setting the k-distance as 10, which was a user-defined parameter to represent the minimum cluster size. Then, the patent document with a high outlierness score indicates fewer similar patents. Table 1 and Figure 8 both display the top five novel patents according to the LOF method (US212757, US383125, US383154, US229864, US950780). As these patterns are unique compared with the others, they may provide some new or unusual signals for the firm. Firm X may consider them unnoticed new directions of technology innovation and develop new technologies based on them. Additionally, the discovered novel patents may not be mainstream technology, which means they cannot form a continual development to improve the performance of FCV. However, this process does make sense in narrowing the candidate patents and extracting some important information for identifying the future technological trend.
The results show that Firm X has novel patents in the technology group of “fuel cell stack”, “powertrain” and “temperature management”. As a Grade ② technology group, the “fuel cell stack” has three novel patents. this indicates that Firm X may have a potential opportunity for extending these three patents to strengthen the weakness of this technology field. In addition, “powertrain” as a Grade ⑥ technology group has the relatively distinctive patent US229864, which may lead the future development direction to strengthen the advantage technology of Firm X.
In the competitive technology environment, an early grasp of potential technology opportunities is important for technology development that can improve the competitiveness of a business [13]. These results show that the new multi-level patent portfolio-based analysis framework can effectively identify the appropriate technology opportunities for firms from the scope of the technology group, technology sub-group, and patent, which offers firms a detailed analysis framework to achieve specific technological goals.
6. Conclusion
This paper proposes a novel framework to identify potential R&D opportunities for a target firm in the FCV industry. The framework is structured with a multi-level process, which integrates technology level, technology potential, and patent novelty analyses based on patent portfolio analysis. The LDA method was employed to effectively identify the key categories in the FCV industry and technology portfolio of the target firm. Each technology category that was regarded as a technology group was then differentiated with different levels of technical specialization. This result showed the technological status quo of the target firm and reflected which technology group or sub-group needs development. After that, the development potential of the technology groups and sub-groups were calculated based on the values of competitive strength, technology cycle time and marketability indicators. This result showed the development priority of the technology direction for the target FCV firm. Lastly, the novel patents of key technology categories were identified using the MDS and LOF techniques, answering which patents were the most likely to lead the future technology trend of the target FCV firm.
An empirical study of a target FCV firm showed that the integration of technology level, technology potential, and patent novelty analyses formed a more comprehensive analysis framework and made it more efficient in evaluating technology opportunity. It also showed how the framework supports the strategic and operational R&D decisions for FCV firms. This method can effectively help a target firm to judge the development feasibility of certain technology and make is easier to coordinate with a specific technology strategy than a model based on measuring generic potential values of the total industry. Moreover, using the real-time updated patent data, this method can continuously offer insights into the sustainable technology development of FCV firms.
Nevertheless, our study still has some possible limitations. First, unlike the mainstream technology topics which have been frequently discussed, some valuable but unapparent technology topics may be neglected. Therefore, it will be very important to construct a vast number of refined document collections as the input and adjust the topic granularity in the empirical study so as to increase the possibility of capturing and presenting all the technology topics. Second, the overall accuracy and performance of the proposed framework can be improved by avoiding analyzing the firms with unique tastes. Finally, with regard to the introduced evaluation indicators, we simplified the sophisticated process of technological R&D by only considering the competitive strength, technology cycle time and marketability of a firm, a process which disregards other aspects like location, culture and regulations. Here, the composition of the evaluation indicators could be adjusted to better fit the individual strategic requirements of firms to improve the analytical capabilities of the proposed framework. We will further explore these topics in our future research.
Author Contributions
The manuscript was approved by all authors for publication. X.S. conceived and designed the study. X.S. and L.C. performed the experiments and wrote the paper. X.S., L.C. and H.S. reviewed and edited the manuscript. I would like to declare on behalf of my co-authors that the work described was original research that has not been published previously, and not under consideration for publication elsewhere, in whole or in part.
Funding
This research was funded by the National Natural Science Foundation of China, grant number 71901089 and 71871023.
Conflicts of Interest
The authors declare no conflict of interest.
Appendix A

Table A1.
The top 10 ranked words of eight core technology groups in major assignee’s patents from 2008 to 2017 and their corresponding probabilities.
Table A1.
The top 10 ranked words of eight core technology groups in major assignee’s patents from 2008 to 2017 and their corresponding probabilities.
| Tech. group 1 | Tech. group 2 | Tech. group 3 | Tech. group 4 | ||||
| Power converter and inverter | Membrane electrode assembly | Temperature management | Fuel cell stack | ||||
| Word | Prob. | Word | Prob. | Word | Prob. | Word | Prob. |
| voltage | 0.0260 | membrane | 0.0170 | temperature | 0.0129 | cell stack | 0.0144 |
| circuit | 0.0187 | electrolyte | 0.0166 | heat | 0.0117 | stack | 0.0144 |
| converter | 0.0185 | polymer | 0.0165 | air | 0.0115 | fuel cell stack | 0.0143 |
| switch | 0.0170 | electrode | 0.0160 | pump | 0.0109 | end plate | 0.0134 |
| charging | 0.0163 | catalyst | 0.0155 | valve | 0.0105 | port | 0.0114 |
| power supply | 0.0138 | layer | 0.0151 | water | 0.0101 | lamination | 0.0113 |
| control unit | 0.0137 | polymer electrolyte | 0.0138 | flow | 0.0099 | lamination direction | 0.0109 |
| direct current | 0.0130 | electrode assembly | 0.0126 | cooling | 0.0096 | surface | 0.0102 |
| inverter | 0.0126 | catalyst layer | 0.0124 | heater | 0.0094 | magnet | 0.0092 |
| output voltage | 0.0126 | membrane electrode assembly | 0.0122 | exchanger | 0.0084 | cooling | 0.090 |
| Tech. group 5 | Tech. group 6 | Tech. group 7 | Tech. group 8 | ||||
| Hydrogen storage | Powertrain | Reforming | Secondary battery | ||||
| Word | Prob. | Word | Prob. | Word | Prob. | Word | Prob. |
| tank | 0.0205 | motor | 0.0143 | reaction | 0.0159 | lithium | 0.0230 |
| pressure | 0.0171 | engine | 0.0137 | reforming | 0.0133 | secondary battery | 0.0195 |
| hydrogen | 0.0144 | torque | 0.0134 | carbon | 0.0130 | lithium ion | 0.0186 |
| valve | 0.0128 | wheel | 0.0129 | gas | 0.0125 | negative electrode | 0.0174 |
| high pressure | 0.0112 | control system | 0.0123 | modification | 0.0117 | positive electrode | 0.0163 |
| Gas | 0.0112 | speed | 0.0122 | reformed gas | 0.0107 | active material | 0.0157 |
| hydrogen gas | 0.0109 | generator | 0.0100 | chemical reaction | 0.0105 | collector | 0.0151 |
| control part | 0.0106 | shaft | 0.0099 | reactive | 0.0102 | electrode active material | 0.0128 |
| vessel | 0.0105 | electric motor | 0.0095 | electrochemical | 0.0102 | material | 0.0127 |
| filling | 0.0096 | rotation | 0.0093 | electrochemical reaction | 0.0101 | lithium ion secondary battery | 0.0126 |
Table A2.
Technology potential evaluation result of sub-groups of Firm X.
| Competitiveness | Technology Cycle Time | Marketability | ||||||||
|---|---|---|---|---|---|---|---|---|---|---|
| Tech. Group | Tech. Code | Tech. Title | Tech. Grade | EI | Z-Score | TCT | Z-Score | MI | Z-Score | Average Z-Score |
| Power converter and inverter | S01-D01 | Measuring electric variables-currents or voltages | ③ | 0.915 | 65.914 | 3.214 | 62.916 | 3.25 | 49.985 | 59.605 |
| X16-H03 | Battery measurements and testing/ Voltage/current | ② | 0.788 | 55.336 | 4.4 | 47.644 | 3.417 | 57.753 | 53.578 | |
| X21-B01B | On-board power supply systems/power supply control | ⑤ | 0.686 | 46.916 | 5 | 39.917 | 3.5 | 61.614 | 49.482 | |
| U24-D05 | DC-AC converter | ⑥ | 0.728 | 50.396 | 4.577 | 45.364 | 3.267 | 50.775 | 48.845 | |
| X16-G | Battery chargers | ② | 0.711 | 48.975 | 3.111 | 64.242 | 2.818 | 29.89 | 47.702 | |
| U24-D02 | DC-DC converters | ⑤ | 0.511 | 32.463 | 5 | 39.917 | 3.25 | 49.985 | 40.788 | |
| Membrane electrode assembly | X16-E06A5E | Gas diffusion layer | ① | 0.914 | 57.957 | 2 | 66.078 | 3 | 52.549 | 58.861 |
| X16-E06A1 | Electrode materials | ① | 0.925 | 60.907 | 3.417 | 47.218 | 3.188 | 60.372 | 56.166 | |
| X16-C16 | Anode and cathode gases separators | ② | 0.941 | 64.96 | 3.625 | 44.45 | 3.071 | 55.504 | 54.971 | |
| A12-M02 | Other polyelectrolytes, flocculants | ① | 0.891 | 52.022 | 3.818 | 41.881 | 3.15 | 58.791 | 50.898 | |
| X16-E06A5A | Catalyst | ① | 0.879 | 48.986 | 3.167 | 50.546 | 2.897 | 48.263 | 49.265 | |
| A12-W11K | Catalysts and supports (polymer use) | ② | 0.799 | 28.495 | 1.333 | 74.955 | 2.714 | 40.647 | 48.032 | |
| A12-M01 | Acrylic polyelectrolytes, flocculants | ② | 0.861 | 44.441 | 3.9 | 40.79 | 3.111 | 57.168 | 47.466 | |
| L03-E04B2 | Membrane electrodes | ① | 0.928 | 61.645 | 3.625 | 44.45 | 2.586 | 35.32 | 47.138 | |
| A11-B05 | Coating | ③ | 0.865 | 45.432 | 3.889 | 40.936 | 3 | 52.549 | 46.306 | |
| L03-A02B | Nonmetal conductors-carbon and graphite | ③ | 0.921 | 59.754 | 3.333 | 48.336 | 2.462 | 30.16 | 46.083 | |
| L03-E04B1 | Catalyst electrodes | ① | 0.839 | 38.825 | 3.389 | 47.591 | 2.813 | 44.767 | 43.728 | |
| Temperature management | X16-C01C | Solid polymer fuel cell | ② | 1.015 | 70.603 | 3.250 | 59.756 | 2.917 | 57.843 | 62.734 |
| T01-J07D1 | Heating system control | ⑤ | 0.765 | 36.535 | 3.550 | 56.771 | 3.063 | 66.963 | 53.423 | |
| X16-C09 | Control (catalyst temp. control using fuel and air flow, etc.) | ② | 0.823 | 44.487 | 4 | 52.293 | 2.895 | 56.469 | 51.083 | |
| X21-C02 | Passenger compartment air conditioning/ventilation systems | ⑤ | 0.897 | 54.568 | 3.778 | 54.502 | 2.583 | 36.981 | 48.684 | |
| X16-K01 | Cooling | ⑥ | 0.818 | 43.804 | 3.684 | 55.437 | 2.652 | 41.291 | 46.844 | |
| X16-C15A | Fuel/gas supply arrangements | ① | 0.875 | 51.512 | 5 | 42.342 | 2.667 | 42.228 | 45.361 | |
| X21-B01A | Traction battery | ⑤ | 0.852 | 48.491 | 6.351 | 28.899 | 2.763 | 48.224 | 41.871 | |
| Fuel cell stack | X16-C01 | Solid oxide and solid polymer fuel cell | ② | 0.729 | 36.624 | 2.5 | 63.821 | 2.714 | 62.381 | 54.276 |
| A12-E06B | Separators, membranes for batteries, accumulators, fuel cells | ② | 0.821 | 60.665 | 3.5 | 45.683 | 2.636 | 49.731 | 52.026 | |
| X16-C18 | Fuel cell housing, stack, and sealing arrangements | ② | 0.791 | 52.711 | 3.786 | 40.496 | 2.563 | 37.891 | 43.699 | |
| Hydrogen storage | X16-C09 | Control (gas and air circulation, etc.) | ⑤ | 0.663 | 48.564 | 3 | 61.908 | 2.455 | 42.929 | 51.134 |
| X16-C15A | Fuel/gas supply arrangements | ⑥ | 0.598 | 38.534 | 3.667 | 50.652 | 2.800 | 64.142 | 51.11 | |
| X16-C15C2 | Replaceable fuel container | ⑥ | 0.757 | 62.902 | 4.45 | 37.439 | 2.455 | 42.929 | 47.757 | |
| Powertrain | T01-J07D1 | Vehicle microprocessor system | ⑤ | 0.889 | 62.214 | 3.591 | 64.077 | 3 | 48.991 | 58.427 |
| X21-A02A | Transmission system and its control | ⑥ | 0.681 | 34.458 | 4 | 54.038 | 3.667 | 65.923 | 51.473 | |
| X21-A07 | Electric traction motor | ⑥ | 0.82 | 53.032 | 4.4 | 44.22 | 2.909 | 46.681 | 47.977 | |
| X21-A04 | Traction motor speed control | ⑥ | 0.8 | 50.297 | 4.667 | 37.666 | 2.583 | 38.405 | 42.123 | |
| Reforming | X16-C15A | Fuel/gas supply arrangements | ⑥ | 0.94 | 66.643 | 4.286 | 44.688 | 2.958 | 56.957 | 56.096 |
| L03-E04I | Hydrogen generation | ① | 0.787 | 43.549 | 3.25 | 53.554 | 3 | 57.471 | 51.524 | |
| X16-C09 | Control (gas and air circulation, etc.) | ③ | 0.825 | 49.188 | 5.125 | 37.508 | 2.6 | 52.576 | 46.424 | |
| E31-A02C | H2 production, storage | ① | 0.77 | 41.013 | 2 | 64.251 | 1 | 32.996 | 46.087 | |
| Secondary battery | L03-H03A | Data storage units, computers | ① | 0.616 | 60.503 | - | - | - | - | 60.503 |
| X16-B01A3 | Metal-hydrogen | ⑤ | 0.482 | 42.224 | 3.5 | 60 | 2.5 | 60 | 54.075 | |
| L03-E01C | Components of primary and secondary cells–electrolytes | ① | 0.551 | 51.613 | - | - | - | - | 51.613 | |
| X16-B01F1 | Lithium-based | ① | 0.65 | 65.139 | 3.8 | 40 | 2.167 | 40 | 48.38 | |
| L03-E01B5B | Lithium electrodes | ① | 0.482 | 42.226 | - | - | - | - | 42.226 | |
| X16-E02 | Electrodes/Carriers, plates, collectors | ① | 0.453 | 38.295 | - | - | - | - | 38.295 | |
Note: “-” represents no invalid value.
References
- Hu, Z.; Li, J.; Xu, L.; Song, Z.; Fang, C.; Ouyang, M.; Dou, G.; Kou, G. Multi-objective energy management optimization and parameter sizing for proton exchange membrane hybrid fuel cell vehicles. Energy Convers. Manag. 2016, 129, 108–121. [Google Scholar] [CrossRef]
- Ha, S.H.; Liu, W.; Cho, H.; Kim, S.H. Technological advances in the fuel cell vehicle: Patent portfolio management. Technol. Forecast. Soc. Chang. 2015, 100, 277–289. [Google Scholar] [CrossRef]
- Ananthachar, V.; Duffy, J.J. Efficiencies of hydrogen storage systems onboard fuel cell vehicles. Sol. Energy 2005, 78, 687–694. [Google Scholar] [CrossRef]
- Veziroglu, A.; Macario, R. Fuel cell vehicles: State of the art with economic and environmental concerns. Int. J. Hydrogen Energy 2011, 36, 25–43. [Google Scholar] [CrossRef]
- Zapata, C.; Nieuwenhuis, P. Exploring innovation in the automotive industry: New technologies for cleaner cars. J. Clean. Prod. 2010, 18, 14–20. [Google Scholar] [CrossRef]
- Van Bree, B.; Verbong, G.P.; Kramer, G.J. A multi-level perspective on the introduction of hydrogen and battery-electric vehicles. Technol. Forecast. Soc. Chang. 2010, 77, 529–540. [Google Scholar] [CrossRef]
- Porter, A.L.; Detampel, M.J. Technology opportunities analysis. Technol. Forecast. Soc. Chang. 1995, 49, 237–255. [Google Scholar] [CrossRef]
- Lee, S.; Yoon, B.; Park, Y. An approach to discovering new technology opportunities: Keyword-based patent map approach. Technovation 2009, 29, 481–497. [Google Scholar] [CrossRef]
- Jia, Y.B.; Cheng, Y.; Du, X.K.; Feng, L.J. Analysis of technology opportunities about the CBM mining method based on multidimensional technology innovation map. Procedia Eng. 2017, 174, 251–259. [Google Scholar] [CrossRef]
- Yoon, B.; Magee, C.L. Exploring technology opportunities by visualizing patent information based on generative topographic mapping and link prediction. Technol. Forecast. Soc. Chang. 2018, 132, 105–117. [Google Scholar] [CrossRef]
- Yoon, J.; Park, H.; Seo, W.; Lee, J.M.; Coh, B.Y.; Kim, J. Technology opportunity discovery (TOD) from existing technologies and products: A function-based TOD framework. Technol. Forecast. Soc. Chang. 2015, 100, 153–167. [Google Scholar] [CrossRef]
- Seo, W.; Yoon, J.; Park, H.; Coh, B.Y.; Lee, J.M.; Kwon, O.J. Product opportunity identification based on internal capabilities using text mining and association rule mining. Technol. Forecast. Soc. Chang. 2016, 105, 94–104. [Google Scholar] [CrossRef]
- Yoon, J.; Park, H.; Kim, K. Identifying technological competition trends for R&D planning using dynamic patent maps: SAO-based content analysis. Scientometrics 2013, 94, 313–331. [Google Scholar]
- Yoon, J.; Seo, W.; Coh, B.Y.; Song, I.; Lee, J.M. Identifying product opportunities using collaborative filtering-based patent analysis. Comput. Ind. Eng. 2017, 107, 376–387. [Google Scholar] [CrossRef]
- Chang, S.H.; Fan, C.Y. Identification of the technology life cycle of telematics: A patent-based analytical perspective. Technol. Forecast. Soc. Chang. 2016, 105, 1–10. [Google Scholar] [CrossRef]
- Haupt, R.; Kloyer, M.; Lange, M. Patent indicators for the technology life cycle development. Res. Policy 2007, 36, 387–398. [Google Scholar] [CrossRef]
- Ardito, L.; D’Adda, D.; Petruzzelli, A.M. Mapping innovation dynamics in the Internet of Things domain: Evidence from patent analysis. Technol. Forecast. Soc. Chang. 2018, 136, 317–330. [Google Scholar] [CrossRef]
- Choi, S.; Yoon, J.; Kim, K.; Lee, J.Y.; Kim, C.H. SAO network analysis of patents for technology trends identification: A case study of polymer electrolyte membrane technology in proton exchange membrane fuel cells. Scientometrics 2011, 88, 863. [Google Scholar] [CrossRef]
- Lee, C.; Kang, B.; Shin, J. Novelty-focused patent mapping for technology opportunity analysis. Technol. Forecast. Soc. Chang. 2015, 90, 355–365. [Google Scholar] [CrossRef]
- Jun, S.; Park, S.S.; Jang, D.S. Technology forecasting using matrix map and patent clustering. Ind. Manag. Data Syst. 2012, 112, 786–807. [Google Scholar]
- Zhou, X.; Zhang, Y.; Porter, A.L.; Guo, Y.; Zhu, D. A patent analysis method to trace technology evolutionary pathways. Scientometrics 2014, 100, 705–721. [Google Scholar] [CrossRef]
- Geum, Y.; Jeon, J.; Seol, H. Identifying technological opportunities using the novelty detection technique: A case of laser technology in semiconductor manufacturing. Technol. Anal. Strateg. Manag. 2013, 25, 1–22. [Google Scholar] [CrossRef]
- Yoon, B.; Park, I.; Coh, B.Y. Exploring technological opportunities by linking technology and products: Application of morphology analysis and text mining. Technol. Forecast. Soc. Chang. 2014, 86, 287–303. [Google Scholar] [CrossRef]
- Park, H.; Ree, J.J.; Kim, K. Identification of promising patents for technology transfers using TRIZ evolution trends. Expert Syst. Appl. 2013, 40, 736–743. [Google Scholar] [CrossRef]
- Park, Y.; Yoon, J. Application technology opportunity discovery from technology portfolios: Use of patent classification and collaborative filtering. Technol. Forecast. Soc. Chang. 2017, 118, 170–183. [Google Scholar] [CrossRef]
- Mun, C.; Kim, Y.; Yoo, D.; Yoon, S.; Hyun, H.; Raghavan, N.; Park, H. Discovering business diversification opportunities using patent information and open innovation cases. Technol. Forecast. Soc. Chang. 2019, 139, 144–154. [Google Scholar] [CrossRef]
- Lee, J.; Kim, C.; Shin, J. Technology opportunity discovery to R&D planning: Key technological performance analysis. Technol. Forecast. Soc. Chang. 2017, 119, 53–63. [Google Scholar]
- Frishammar, J.; Lichtenthaler, U.; Rundquist, J. Identifying technology commercialization opportunities: The importance of integrating product development knowledge. J. Prod. Innov. Manag. 2012, 29, 573–589. [Google Scholar] [CrossRef]
- Jeong, Y.; Park, I.; Yoon, B. Identifying emerging Research and Business Development (R&BD) areas based on topic modeling and visualization with intellectual property right data. Technol. Forecast. Soc. Chang. 2019, 146, 655–672. [Google Scholar]
- Brockhoff, K.K. Instruments for patent data analyses in business firms. Technovation 1992, 12, 41–59. [Google Scholar] [CrossRef]
- Ernst, H. Patent portfolios for strategic R&D planning. J. Eng. Technol. Manag. 1998, 15, 279–308. [Google Scholar]
- Ernst, H. Patent information for strategic technology management. World Pat. Inf. 2003, 25, 233–242. [Google Scholar] [CrossRef]
- Fabry, B.; Ernst, H.; Langholz, J.; Köster, M. Patent portfolio analysis as a useful tool for identifying R&D and business opportunities—An empirical application in the nutrition and health industry. World Pat. Inf. 2006, 28, 215–225. [Google Scholar]
- Lin, B.W.; Chen, C.J.; Wu, H.L. Patent portfolio diversity, technology strategy, and firm value. IEEE Trans. Eng. Manag. 2006, 53, 17–26. [Google Scholar]
- Momeni, A.; Rost, K. Identification and monitoring of possible disruptive technologies by patent-development paths and topic modeling. Technol. Forecast. Soc. Chang. 2016, 104, 16–29. [Google Scholar] [CrossRef]
- Blei, D.M.; Ng, A.Y.; Jordan, M.I. Latent dirichlet allocation. J. Mach. Learn. Res. 2003, 3, 993–1022. [Google Scholar]
- Jeong, B.; Yoon, J. Competitive intelligence analysis of augmented reality technology using patent information. Sustainability 2017, 9, 497. [Google Scholar] [CrossRef]
- Furukawa, T.; Mori, K.; Arino, K.; Hayashi, K.; Shirakawa, N. Identifying the evolutionary process of emerging technologies: A chronological network analysis of World Wide Web conference sessions. Technol. Forecast. Soc. Chang. 2015, 91, 280–294. [Google Scholar] [CrossRef]
- Uchida, Y.; Cook, P. The transformation of competitive advantage in East Asia: An analysis of technological and trade specialization. World Dev. 2005, 33, 701–728. [Google Scholar] [CrossRef]
- Acar, W.; Sankaran, K. The myth of the unique decomposability: Specializing the Herfindahl and entropy measures? Strateg. Manag. J. 1999, 20, 969–975. [Google Scholar] [CrossRef]
- Kayal, A.A.; Waters, R.C. An empirical evaluation of the technology cycle time indicator as a measure of the pace of technological progress in superconductor technology. IEEE Trans. Eng. Manag. 1999, 46, 127–131. [Google Scholar] [CrossRef]
- Narin, F. Technology indicators and corporate strategy. Rev. Bus. 1993, 14, 19–23. [Google Scholar]
- Sagarra, M.; Mar-Molinero, C.; García-Cestona, M. Spanish savings banks in the credit crunch: Could distress have been predicted before the crisis? A multivariate statistical analysis. Eur. J. Financ. 2015, 21, 195–214. [Google Scholar]
- Weiwei, X.; Liya, S.; Xiang, W. Human motion behavior segmentation based on local outlier factor. Open Autom. Control Syst. J. 2015, 7, 540–551. [Google Scholar] [CrossRef]
- Domingues, R.; Filippone, M.; Michiardi, P.; Zouaoui, J. A comparative evaluation of outlier detection algorithms: Experiments and analyses. Pattern Recognit. 2018, 74, 406–421. [Google Scholar] [CrossRef]
- Wang, H.; Chi, Y.; Hsin, P. Constructing patent maps using text mining to sustainably detect potential technological opportunities. Sustainability 2018, 10, 3729. [Google Scholar] [CrossRef] [Green Version]
- Wang, B.; Liu, S.; Ding, K.; Liu, Z.; Xu, J. Identifying technological topics and institution-topic distribution probability for patent competitive intelligence analysis: A case study in LTE technology. Scientometrics 2014, 101, 685–704. [Google Scholar] [CrossRef]
Figure 1.
The grades of technology level mapping.
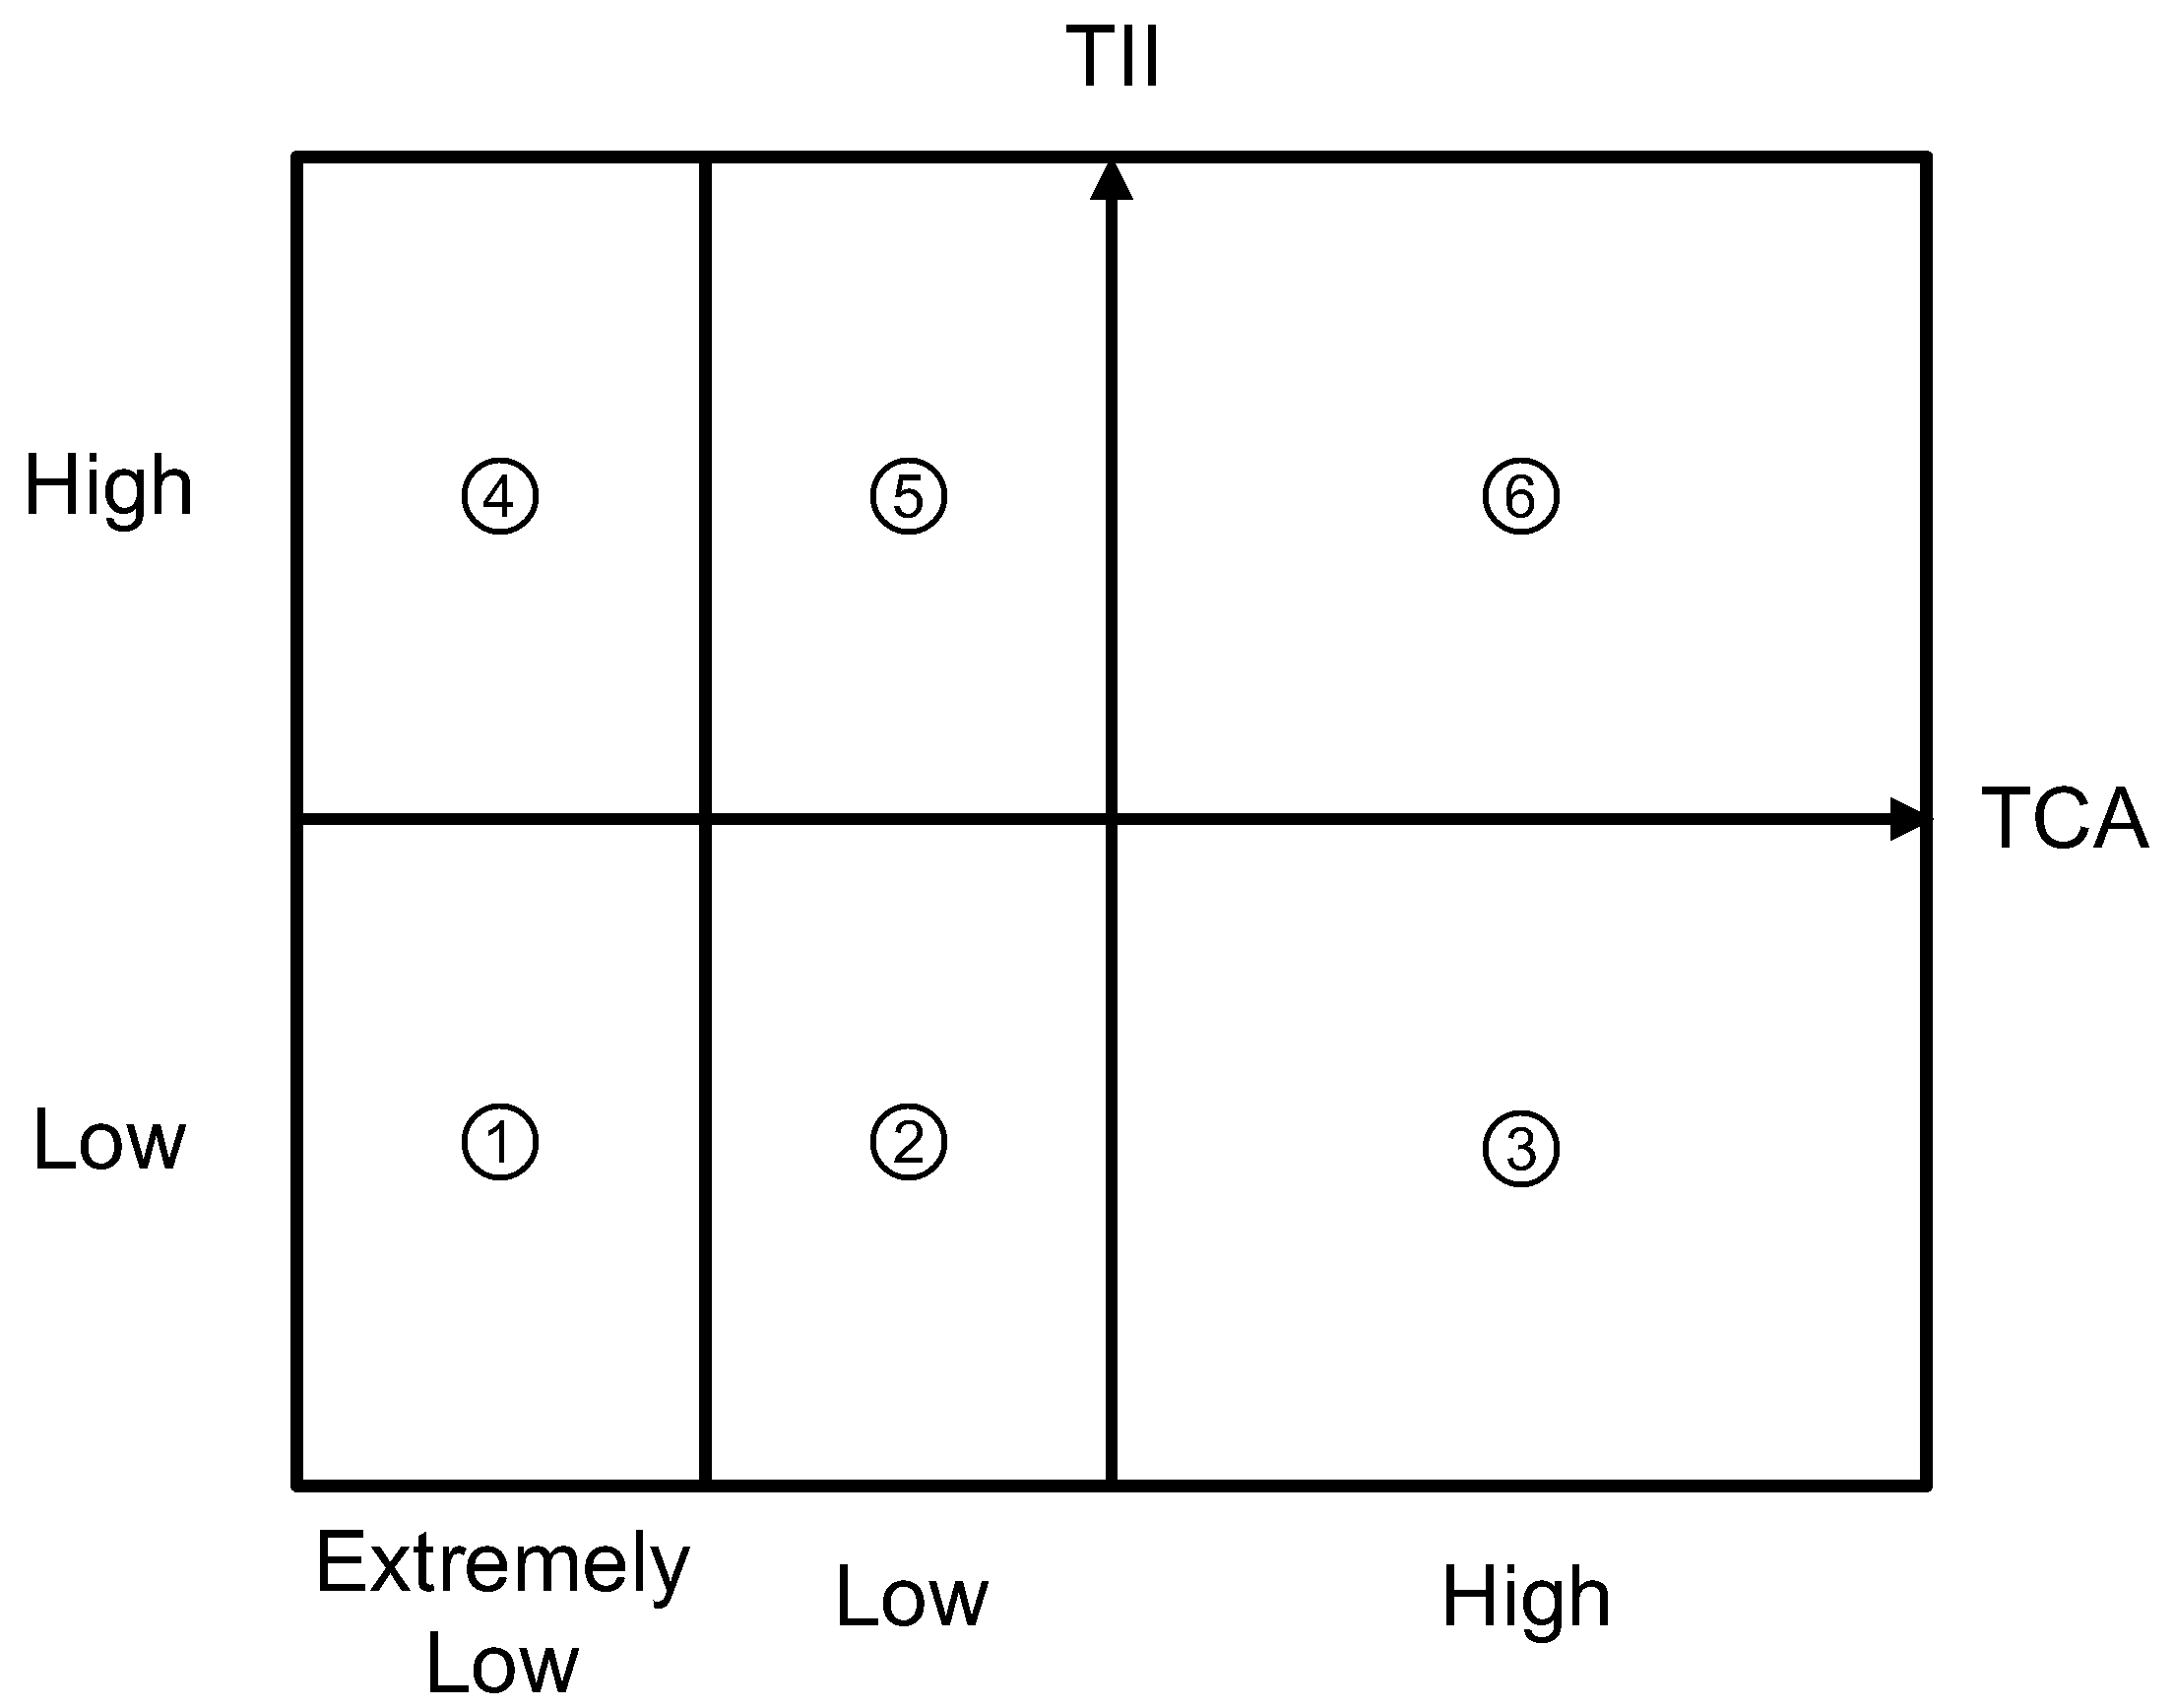
Figure 2.
The model of a multi-level patent portfolio-based approach for identifying a firm’s technology opportunities.
Figure 2.
The model of a multi-level patent portfolio-based approach for identifying a firm’s technology opportunities.
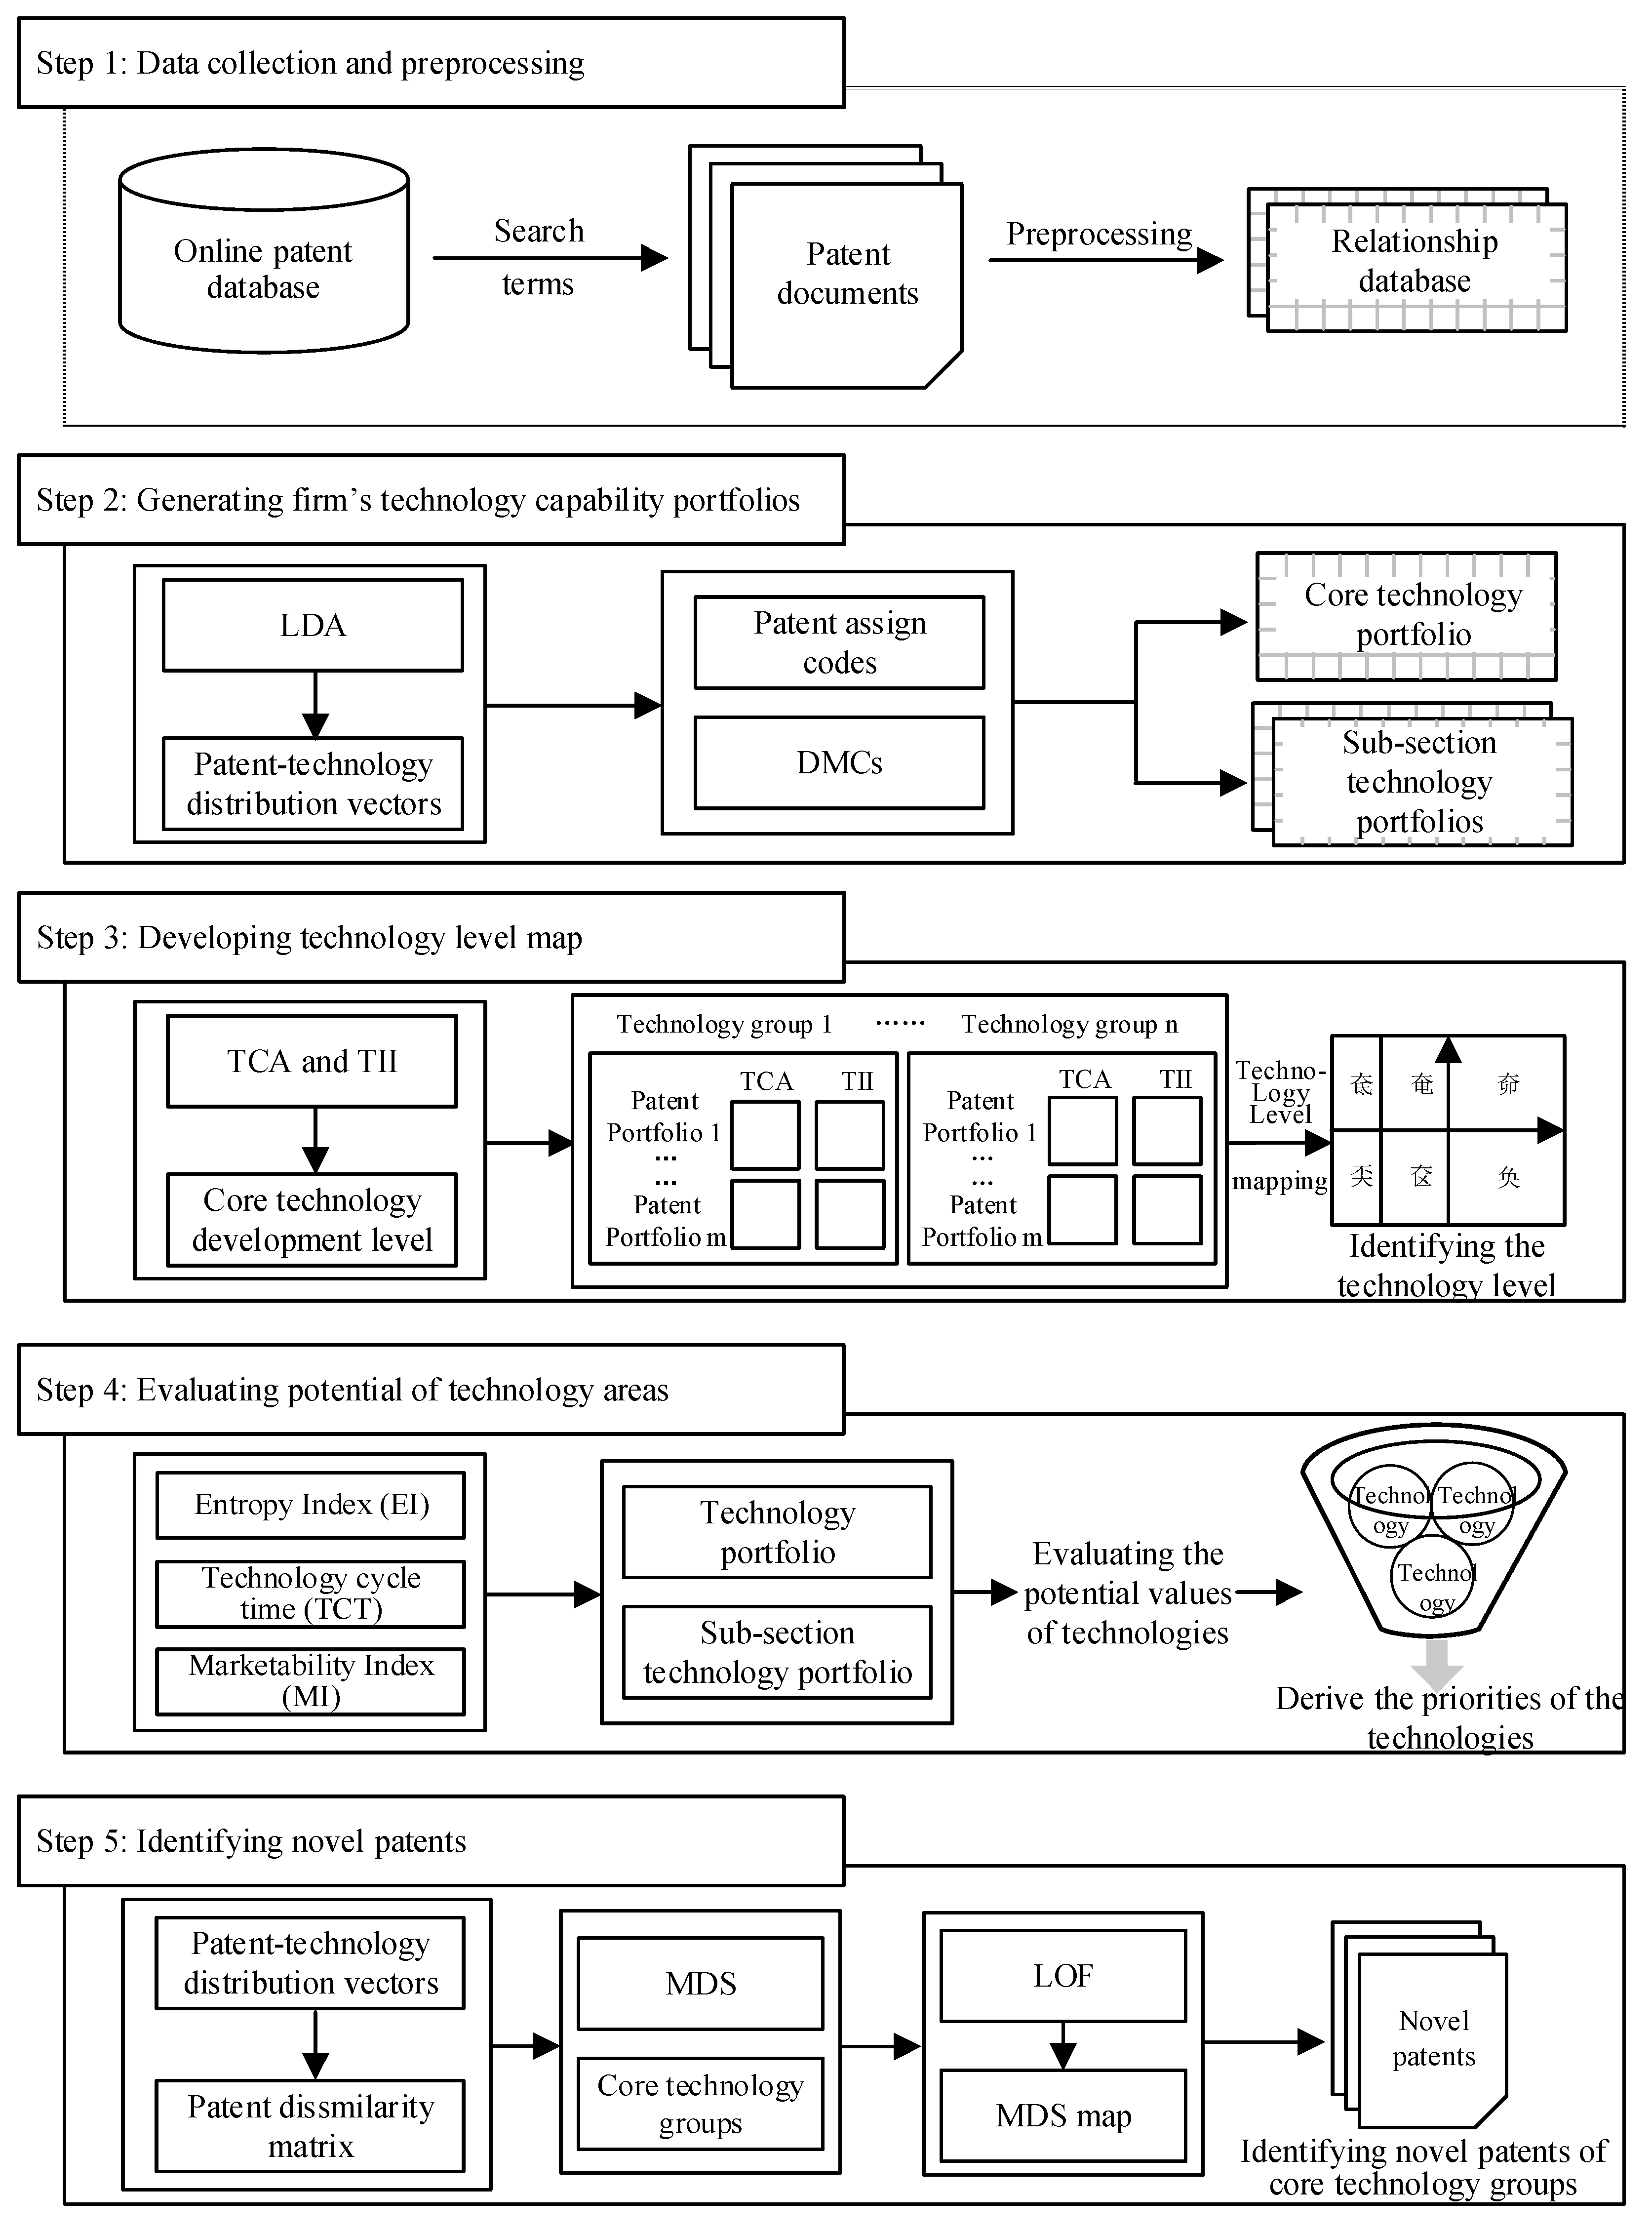
Figure 3.
Average topic coherence.

Figure 4.
The proportion of patents of each technology group in the fuel cell vehicle (FCV) industry.
Figure 4.
The proportion of patents of each technology group in the fuel cell vehicle (FCV) industry.

Figure 5.
The proportion of patents of each technology group in Firm X.

Figure 6.
Technology level map of Firm X.

Figure 7.
Sub-technology level map of Firm X. (a) Power converter and inverter; (b) membrane electrode assembly; (c) temperature management; (d) fuel cell stack; (e) hydrogen storage; (f) powertrain; (g) reforming; and (h) secondary battery.
Figure 7.
Sub-technology level map of Firm X. (a) Power converter and inverter; (b) membrane electrode assembly; (c) temperature management; (d) fuel cell stack; (e) hydrogen storage; (f) powertrain; (g) reforming; and (h) secondary battery.
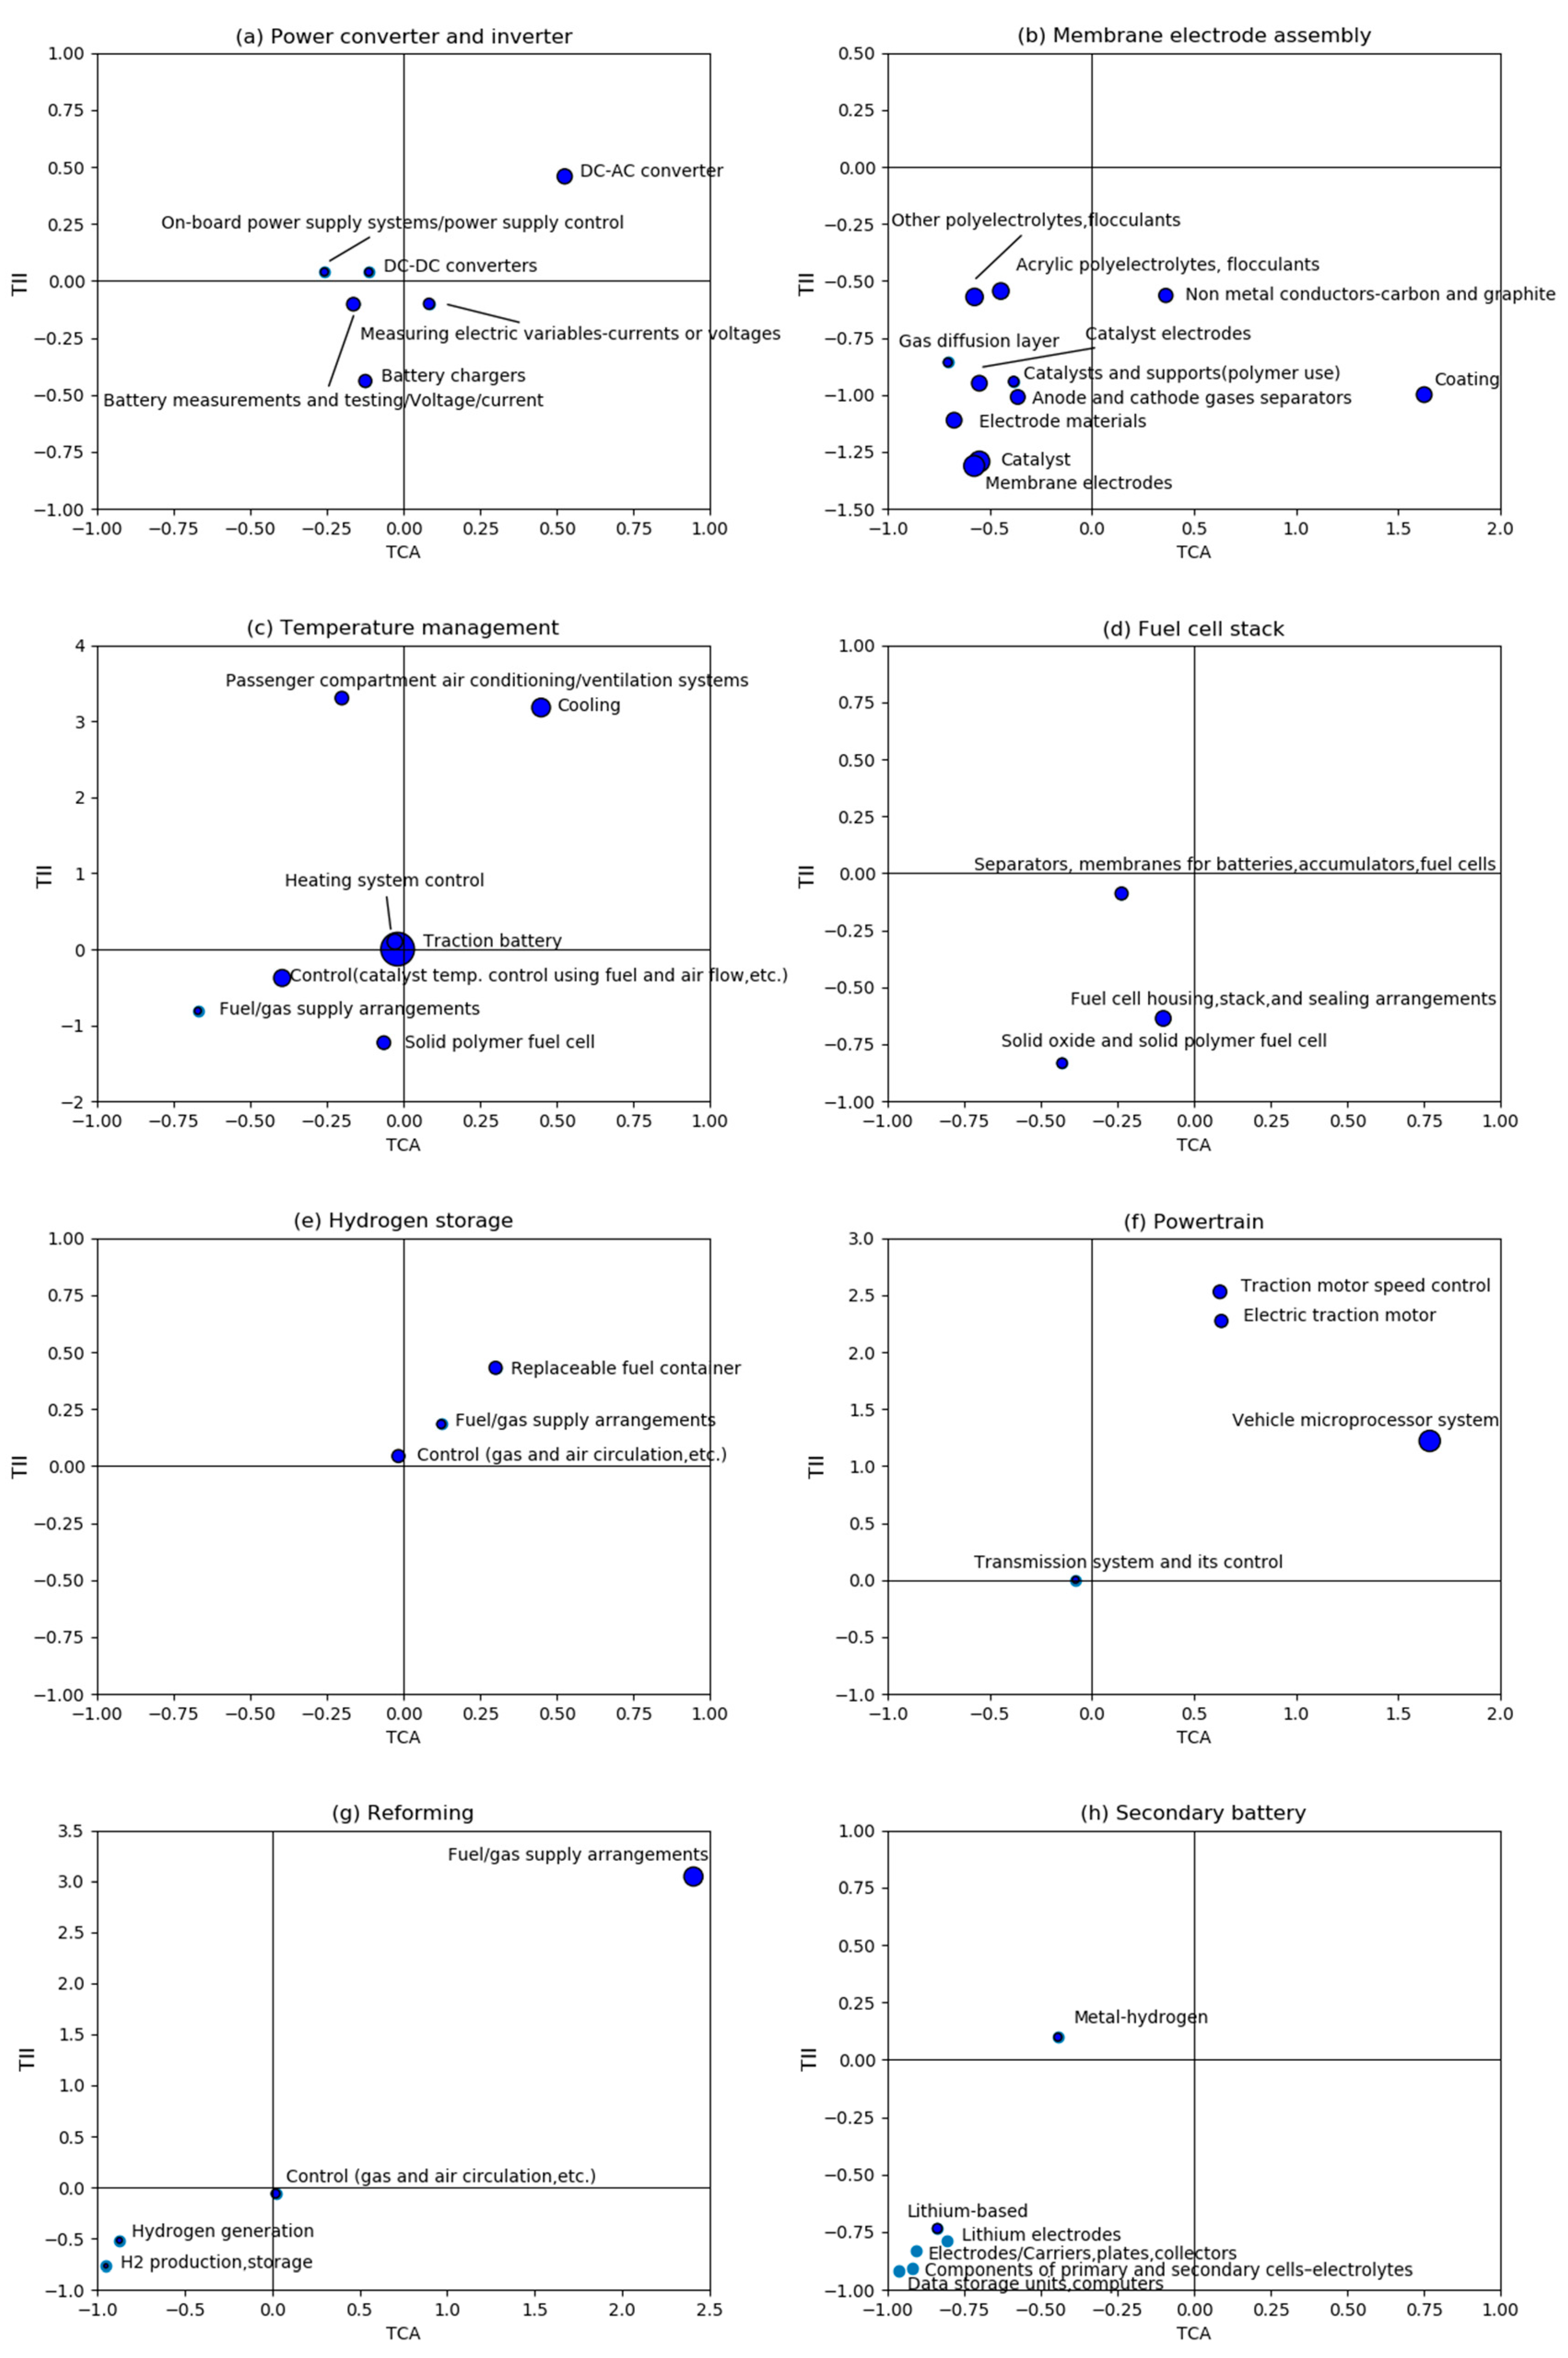
Figure 8.
Local outlier factor patent map using the multidimensional scaling (MDS) (Table 1: novel patents).
Figure 8.
Local outlier factor patent map using the multidimensional scaling (MDS) (Table 1: novel patents).

Table 1.
Novel patents of Firm X for the recent three years.
| Item | Patent Number | Outlierness | Tech. Group | Num. of Patent Countries | Application Year |
|---|---|---|---|---|---|
| a | US212757 | 2.626 | Fuel cell stack | 2 | 2017 |
| b | US383125 | 2.242 | Fuel cell stack | 3 | 2016 |
| c | US383154 | 1.99 | Fuel cell stack | 1 | 2016 |
| d | US229864 | 1.386 | Powertrain | 3 | 2016 |
| e | US950780 | 1.039 | Temperature management | 3 | 2015 |
© 2019 by the authors. Licensee MDPI, Basel, Switzerland. This article is an open access article distributed under the terms and conditions of the Creative Commons Attribution (CC BY) license (http://creativecommons.org/licenses/by/4.0/).
Share and Cite
MDPI and ACS Style
Shi, X.; Cai, L.; Song, H. Discovering Potential Technology Opportunities for Fuel Cell Vehicle Firms: A Multi-Level Patent Portfolio-Based Approach. Sustainability 2019, 11, 6381. https://doi.org/10.3390/su11226381
AMA Style
Shi X, Cai L, Song H. Discovering Potential Technology Opportunities for Fuel Cell Vehicle Firms: A Multi-Level Patent Portfolio-Based Approach. Sustainability. 2019; 11(22):6381. https://doi.org/10.3390/su11226381
Chicago/Turabian StyleShi, Xuan, Lingfei Cai, and Hongfang Song. 2019. "Discovering Potential Technology Opportunities for Fuel Cell Vehicle Firms: A Multi-Level Patent Portfolio-Based Approach" Sustainability 11, no. 22: 6381. https://doi.org/10.3390/su11226381
Note that from the first issue of 2016, this journal uses article numbers instead of page numbers. See further details here.