Article

Organizational Learning and Corporate Social Responsibility Drivers of Performance in SMEs in Northwestern Mexico

by
Luis Enrique Valdez-Juárez
1,*,
Dolores Gallardo-Vázquez
2 and
Elva Alicia Ramos-Escobar
1
1
Faculty of Business Administration, Technological Institute of Sonora, Guaymas Sonora 85400, Mexico
2
Department of Financial Economics and Accounting, Faculty of Economics and Business, University of Extremadura, Badajoz 06006, Spain
*
Author to whom correspondence should be addressed.
Sustainability 2019, 11(20), 5655; https://doi.org/10.3390/su11205655
Submission received: 4 September 2019 / Revised: 4 October 2019 / Accepted: 9 October 2019 / Published: 14 October 2019

Abstract

:
The main objective of this article is to examine the effects of the organizational learning and corporate social responsibility (social, economic and environmental) practices that exert on the financial performance of SMEs (small and medium enterprises). The research is based on a sample of 343 companies of which 19.8% belong to the primary sector, 26.6% to the secondary sector and 53.6% to the tertiary sector of the northwestern region of Mexico. The data were collected from February to May 2018 with the support of a self-directed structured survey of company managers. For the analysis and validation of the results, the statistical technique of the structural equations model (SEM) based on the variance was used to validate the structured relationships in this investigation through PLS (partial least squares). These analyses were prepared with the support of SmartPLS version 3.2.8 Professional. The results indicate that OLE (organizational learning) is a key element to strengthen CSR (corporate social responsibility) practices and increase financial performance in these types of companies, and that CSR is key to increasing financial performance. In addition, it was found that the OLE is a variable that mediates the relationship between CSR and financial performance. The work contributes to the development of the literature of organizational learning, the theory of resources and capabilities, and stakeholder theory

1. Introduction

At the present time, when the only constants are technological change, learning and improvement in innovative business models, companies are opting for the deployment of effective business strategies in order to be protagonists in highly competitive markets [1,2]. The demands of new consumers and generations based on knowledge and a greater awareness of sustainability, lead to organizations being in continuous competitive struggle and focusing on maximizing their resources and capabilities [3]. Therefore, human capital has become an intangible asset of greater relevance and organizational profitability [4,5]. Human capital is fed by the flow of knowledge that is acquired inside and outside the company, which is managed by the capabilities of its managers [6]. This flow of knowledge becomes a key factor by first transforming into individual learning and later into collective learning [7,8]. Theories of knowledge and organizational learning (OLE), have studied these manifestations and flows of knowledge in the individual, and have been key in the development of the different modern currents, such as the case of the theory based on resources and capabilities (RBV) [5,9,10]. Most studies focused on the subject have observed that the flow of knowledge, knowledge management and organizational learning are a source of innovation and are an important way to achieve greater financial growth [11,12]. However, recently OLE has been a decisive business strategy in the adoption and execution of corporate social responsibility (CSR) practices. This new approach has been contemplated in theories of dynamic capabilities, stakeholder theory and sustainability. The precursors of these theories have shown that one of the pillars and global trends of companies is the adoption of socially responsible strategies, with the purpose of improving innovation activities and raising financial performance. These theories have revealed and proven that small and large organizations need to adopt a network of learning (individual–team–collective) and knowledge (internal–external), in which all members of an organization and external collaborators participate. These same conclusions have been issued in reports by various international organizations, such as the United Nations Educational, Scientific and Cultural Organization UNESCO [13], the Organization for Economic Co-operation and Development OECD [14] and the World Bank [15]. However, the main studies of these variables have focused on the analysis of large companies, with only a few investigating micro, small and medium enterprises (SMEs). These types of companies generally have a greater difficulty in acquiring and managing knowledge, and few manage to implement a model of organizational improvement based on learning [5,16]. This is mainly due to the lack of a formal organizational structure, lack of financial solvency, lack of business vision and poor physical and technological infrastructure [17]. This causes administrative and emotional wear on managers and employees, leading the company to poor organizational results for its stakeholders [17,18].
The objectives of this work are as follows: 1. To analyze the effects that OLE has on CSR practices and financial performance in SMEs; 2. to examine the influence of CSR practices on the financial performance of SMEs; 3. to analyze the direct and indirect effects of the OLE variable on CSR and financial performance through the mediation technique; and, 4. to verify the influence of greater weight of OLE in the dimensions of CSR and also corroborate which of the dimensions of CSR has greater weight on financial performance. The research questions contemplated in the work are:
  • Is OLE a determining factor in the increase in CSR practices and in the results of financial performance of the SME? Does CSR have significant effects on the financial performance of the SME;
  • Is OLE a variable that has mediation effects between CSR and the financial performance of the SME;
  • Of the dimensions of CSR, on which does OLE have most influence?
The research is based on a sample of 343 companies in the primary, secondary and tertiary sectors of the Sonora and Baja California region, which are located in the northwest of Mexico. For the analysis and validation of the results, we have used a statistical technique with structural equation models (SEM) based on the variance in order to validate and verify the structured relationships in this research through PLS (partial least squares), with the support of SmartPLS version 3.2.8 Professional.
The research mainly contributes to the development of the theory of organizational learning, and resources and capabilities directed towards the theory of stakeholders. Generally, organizations with greater learning and knowledge contribute to business competitiveness and play a leading role in CSR strategies. From a strategic business vision, CSR practices are visualized, as an elementary part of business development and growth, from three essential perspectives: 1) Social practices, 2) economic activities, and 3) environmental actions. For companies established in a developing country, this represents a challenge towards consolidation and competitiveness. First, the learning theory indicates that companies should adopt a learning model based on individual knowledge, for its subsequent transformation into collective learning and, finally, organizational learning [19]. This acquired knowledge helps in the innovative and socially responsible transformation of organizations [20,21]. Second, the theory of resources and capabilities has stated that organizational learning focused on sustainability actions is a key element to obtain better organizational results. Third, stakeholder theory explains that companies must not only satisfy and meet the expectations of shareholders, but also of a wide variety of business stakeholders, such as employees, customers and suppliers [22,23]. This article has been structured as follows: The theoretical review, the empirical review and the development of the hypotheses raised in the study are presented in the first section. Secondly, the methodology, the conformation of the sample and its characteristics are explained, as well as the measurement and justification of the variables under study. Finally, the results and the main conclusions of the investigation are shown.

2. Literature Review and Hypothesis Development

2.1. Organizational Learning and Social Responsibility

The resources and capabilities of organizations have been the door and the path to sustained growth and towards competitive business consolidation. Frequently, the organizations with the greatest resources (financial, technological and human) are those that increase and strengthen their capacities towards exponential results [3,24]. However, in this new digital era, based on the knowledge economy and learning abilities, these resources have become the most valuable intangible assets that an innovative company has [1,25]. Organizational learning is defined as the capacity of organizations for the creation, generation, administration and processing (conversion) of information and individual knowledge in collective knowledge [8,26]. This is achieved through the adoption and execution of a model based on a culture of continuous learning and the innovative creativity of the company’s employees [27,28]. Classical authors such as Huber [29] and Bontis, Crossan and Hulland [4] have defined organizational learning as a dynamic process that is part of knowledge. The companies that enhance their learning that allows them to be more competitive, do so through efficiency in data processing and control of their information. In addition, various authors, such as Nonaka and Von Krogh [30], Argote, and Miron-Spektor [31] and Namada [32] have stated that organizations focused on organizational learning and in raising the knowledge of their human capital, increase their market opportunities, increase innovation and achieve greater economic results. In the literature there is a wide variety of models focused on the analysis and behavior of individual and organizational learning, which have become solid theories and of which the most prominent are as follows: 1) The spiral model of knowledge, based on the conversion of tacit knowledge into explicit [33]. 2) Authors such as Huber [29] and Slater and Narver [34] proposed an organizational learning model that is based on four determining processes for innovative and competitive companies: a) knowledge capture, b) information dissemination, c) information interpretation and, d) organizational memory. 3) Knowledge absorption, a model that focuses on capture, absorption (internal–external), assimilation and transformation of knowledge [35,36]. 4) The model based on technological and/or virtual knowledge, focused on capturing and using existing knowledge in virtual (internal/external) platforms and networks of collaboration [27,37]. 5) Another of the models related to organizational learning is the one developed by Jensen, Johnson, Lorenz, & Lundvall [38], known as DUI (Doing, Using, Interacting), a model that focuses on the capacity for learning and knowledge (internal–external) of the individuals of the companies to generate innovation and competitive advantages. 6) The learning model, based on stocks and flows of individual, collective and organizational learning [4]. This model helps to select the acquisition of knowledge effectively, and strengthens the skills and abilities of knowledge flows in individuals in order to focus on innovative ideas in the organization [39,40]. For a company to achieve significant organizational and financial results, it is crucial to establish a philosophy focused on the culture of learning. The challenge of managers of companies is to take individual learning (implicit and explicit knowledge), towards team learning (acquisition of new collaborative knowledge) and towards organizational learning (standardized mechanism to generate, share and exploit the knowledge). According to Maon, Lindgreen & Swaen [41], in the literature there is a great diversity of proposals for CSR models focused on organizational learning. However, one of those that have had a greater impact on business management is that proposed by Wood [42] and Ferguson, Roper, Wood and Wilson [43], a model that proposes a learning called a simple circuit (institutional strategies, organizational processes and the level of impacts on stakeholders). This model has been perfected by Zadek [44], whose proposal is based on the learning curve of the organization and is known as a double circuit. This is because companies adopt social responsibility principles and values, and develop their strategies based on the experiences and needs of stakeholders. Organizational learning in the last two decades has allowed companies to be in a global and competitive environment [45,46]. In addition, recently, organizations through this individual and collective learning have managed to channel it towards the implementation of corporate social responsibility strategies, actions that have allowed them to become a dynamic and innovative organization [4,41,47]. The theory of stakeholders has reiterated that the commitment, experience and skills of managers are decisive elements to permeate throughout the organizational structure the culture of social responsibility, in its three substantial dimensions: Social actions, economic actions and environmental actions [48,49].

2.2. Organizational Learning and Corporate Social Responsibility

There are various empirical studies that relate organizational learning with CSR practices that are developed in the SME. Most have stated that these types of organizations are trying to incorporate new ways of learning and extracting knowledge from various sources, and that executives are adopting new forms and models of learning to improve their internal social responsibility processes. In addition, they are focusing on improving the quality of life of workers, customer satisfaction and actions aimed at caring for the environment [50,51]. Recent studies have explained that organizational learning and the flow of knowledge are the source and key to execute sustainable strategies such as CSR [52,53]. These actions that are developed through the efficiency of the management of individual learning, organizational learning and with external learning have allowed companies to penetrate new markets, find new customers, satisfy current customers, maintain business sales and improve financial profit [54,55]. In addition, some research has exposed that the lack of knowledge of the managers of the companies in the topic of the CSR means that learning is focusing on issues other than sustainability [53]. Therefore, most studies conclude that the relationship between organizational learning and CSR is complementary [45]. However, to be able to articulate these resources requires strategic capabilities [56]. This process is considered to be complex because it is necessary to develop business leadership, including the culture, values, norms and tactics focused on the welfare of stakeholders [23,57]. From the theoretical and empirical context, the following hypotheses were formulated:
Hypothesis 1 (H1).
Organizational learning generates a greater focus on corporate social responsibility activities in SMEs.

2.3. Organizational Learning and Financial Performance

In the literature reviewed we find that there are a large number of studies that relate these two variables; however, this occurs more frequently in large organizations. Studies in the field of SMEs indicate that organizational learning indirectly influences the financial performance of companies because they require other resources (economic and technological) and capabilities (intellectual capital and innovation) to achieve better financial results [54,58]. On the other hand, other scholars on the subject have concluded that when SMEs adopt and develop a learning model based on dynamic capabilities and manage to turn it into a fluid process of knowledge management, the financial performance of the business grows exponentially and is sustained [59,60]. Generally, SMEs can improve their learning systems and financial performance because they are closer to their employees, which makes it easier to capture, transfer and better apply the knowledge learned [50,61]. Therefore, organizational learning is visualized as a capacity that helps to achieve better organizational practices, such as the adoption of social responsibility, and an increase of financial performance in SMEs [62,63]. From the theoretical and empirical context, we developed the following hypothesis:
Hypothesis 2 (H2).
Organizational learning raises the level of financial performance of SMEs.

2.4. The Relationship of CSR with Financial Performance

Stakeholder theory has recognized that CSR practices are part of the core strategy for companies with sustained growth, and contribute to the achievement of organizational results, such as satisfaction of interest groups and increased financial profitability [49,64]. Different empirical studies have reported that social, environmental, economic and ethical–legal practices positively influence the economic results of companies [65,66]. In addition, some studies have corroborated that the implementation of CSR has become a powerful weapon in meeting customer expectations and satisfaction, driving companies to be more competitive and more profitable [67,68]. Other researchers have concluded that there is a significant relationship between the ethical, social, economic and environmental dimensions of CSR, with the financial performance of companies [69]. In contrast, researchers such as Torugsa, O’Donohue, & Hecker [70] found that the adoption of practices in each dimension of CSR by SMEs is influenced differently. This is mainly due to their resources and capabilities, such as learning, knowledge, finance and technology; these factors directly affect the financial profitability of organizations. More recent research has shown that there is a positive relationship between the investment and the successful deployment of CSR, positively affecting the level of satisfaction of employees and customers, and the profitability of investments [71,72]. More recent studies in the field of SMEs on CSR practices indicate that to meet the needs of stakeholders these types of companies are adopting global practices, such as environmental actions, ecological products, marketing-focused campaigns, and social and green marketing-innovation, in the organizational climate (based on guidelines from international organizations) [73,74]. These strategies are leading them to compete with larger corporations and moving them towards achieving significant organizational and financial results [75,76]. Derived from this empirical analysis, the following hypotheses are issued:
Hypothesis 3 (H3).
Corporate social responsibility positively influences the financial performance of the SME. All relationships (hypotheses) structured in the research model can be seen in Figure 1.

3. Materials and Methods

3.1. Participants and Sampling Technique

The structure of the sample is based on the principles of stratified sampling for finite populations. The population is made up of SMEs in the region of Sonora and Baja California located in the northwest of Mexico and has been segmented according to the sector of activity. The number of companies in each of the strata has been obtained from the information of the economic census provided by the National Statistical Directory of Economic Units (DENUE) of the National Institute of Statistics and Geography [77]. The sample is made up of SMEs that employ from 10 to 250 workers. The sample size was determined to ensure that the maximum margin of error for the estimation of a proportion (relative frequency of response in a specific item of a question) was less than 0.03 points with a 95% confidence level. The technique for collecting the information was through a personal interview (questionnaire) addressed to the SME leader. The field work was carried out during the months of February to May of 2018. To ensure the participation of company managers in this study, those who did not decide to participate in the first round of the interviews (20% of the selected sample) were replaced; in the first round, once 80% participation was achieved, t-test and chi-square analyses were performed, and there were no significant differences between the groups [78]. Finally, a sample of 343 companies was obtained; 19.8% belonged to the primary sector (agro-livestock activities), 26.6% to the secondary sector (food, textile, furniture and other activities) and 53.6% to the tertiary sector (commercial activities, construction, transportation, financial services and communication). The composition and characteristics of the sample can be seen in Table 1.

3.2. Variance Test of the Common Method (CMV)

Due to the different problems that it represents for most investigations when using data collected from the same source of information, the variance of the common method has represented one of the main challenges in the field of social science and business management. In our study we validated the questions contained in the questionnaire through experts in the area and with a pilot test of the survey on 10% of the final sample. However, this is not enough to completely eliminate bias in respondents’ responses; therefore, we have performed the following procedure.
According to Podsakoff, MacKenzie, Lee, and Podsakoff [79], the Harman single factor test requires the following steps: 1) Perform the factor analysis of all the exogenous latent constructs and endogenous latents (items) of the model and then an analysis of the main components without selecting some type of rotation method and, 2) the values of the non-rotated components and the number of factors that complement the variance are analyzed. Once this analysis has been carried out through the SPSS statistical software, the results have shown us that our model is constructed of 5 factors, the total variance explained is 66.20%, and the first non-rotated factor is 37.88%. This information allows us to deduce that our model has no indication that there is a single factor. In addition, it reveals that the first non-rotated factor is lower than the total value of the variance; therefore, this eliminates and reduces the presence of CMV response bias (see Table 2).
As an additional test to combat CMV, we have followed the recommendations of Bagozzi, Yi and Phillips [80]. These experts in the field propose to perform the correlation matrix procedure of the latent variables for models constructed and analyzed with PLS. Therefore, in their conclusions and suggestions they propose that the value of correlations between constructs should be less than 0.9. According to the analysis of this Harman test through the correlation matrix, the results confirm that CMV is not a problem for the model proposed in this study (see Table 3).

3.3. Variable Measurement

Reflective variables were used in this study. The main feature of these models is that the direction and influence leave the construct towards the indicator. Reflective variables are characterized because all the indicators of a construct are highly correlated (co-vary); they are interchangeable, and eliminating an indicator does not alter the content of the construct [81,82]. The questions that make up all the constructs can be seen in Table 4.
Organizational learning (OLE). This variable was measured based on the models of Kristandl & Bontis [83] and of Nonaka [6]. Models consider organizational learning and knowledge as the engine that drives creativity, innovation and business competitiveness. This variable was measured using a Likert scale of 7 points, with 1 = Total disagreement and 7 = Strongly agree. This variable has been constructed with 6 questions that are related to the main learning actions that take place inside the organization.
Corporate social responsibility (CSR). Based on the literature and the main theories that are most identified in the studies to support this business activity, and the measurement of CSR, the theory of interest groups was taken as a reference, which includes the mutual benefits in social, financial and sustainable terms among the company (managers and employees), customers, and the community [48,64,84]. Therefore, we decided to focus the measurement of this variable based on theories that are directed towards the results shared with an integrative approach: 1. Social, 2. Economic and 3. Environmental activities, which lead to the achievement of organizational profitability. Based on these theories we divided the multidimensional construct of the CSR (second order) into three dimensions or first-order factors (social, economic and environmental) [84].
Social responsibility (SOR). Measured taking as a reference the studies developed by Carroll [85], Turker [86] and Carroll and Shabana [49]. This variable was composed of 4 structured questions in the questionnaire and was provided to the manager to identify and rate the social activities related to social responsibility that the company has carried out in the last 3 years, using a Likert scale of 7 points with 1 = Strongly disagree and 7 = Strongly agree.
Economic responsibility (ECR). Measured according to the studies developed by Friedman [64] and McWilliams [84] and McWilliams, Parhankangas, Coupet, Welch & Barnum [23]. This variable was made up of 4 questions that were shown in the questionnaire addressed to the SME manager, in order to identify and rate the social responsibility economic actions in the last 3 years. For this, a 7-point Likert scale was used with 1 = Completely in disagreement and 7 = Completely agree; see Table 3.
Environmental responsibility (ENR). Measured considering the studies of Jenkis [87] and McWilliams et al. [23]. This variable was made up of 5 structured questions in the questionnaire and provided to the manager to identify and rate the environmental and sustainability activities related to social responsibility that the company has carried out in the last 3 years, using a 7-point Likert scale with 1 = Strongly disagree and 7 = Strongly agree.
Financial performance (FPE). It is one of the most analyzed indicators in the literature for its value and importance for companies, as well as the complexity in its measurement [88,89]. Classic currents, such as economic theory that focuses mainly on the generation of wealth through the exploitation of resources [90,91], the theory of resources and capabilities (TRC) of Barney [92,93], learning theory [4,36], and the theory of stakeholders [22,23], argue that the total tangible and intangible assets, such as learning, intellectual capital and social responsibility, generate an incalculable and superior value for companies. These benefits translate into increased sales, greater business image and rising financial results. Based on the review of the literature on the profitability related to learning and social responsibility, this variable was measured taking as a reference the studies of Griffin and Mahon [94], McWilliams et al. [84] and Barney et al. [24]. The variable was measured with 5 questions formulated in the questionnaire addressed to managers capturing their answers about the financial performance results obtained by the company in the last 3 years. For this, a 7-point Likert scale has been used with 1 = poor performance and 7 = high performance.

3.4. Control Variables

Size of the company. This variable was measured with the natural logarithm of the total employees in 2018. Frequently this variable is used in empirical studies because it is an important parameter in the measurement of competitiveness and organizational performance [95,96]. The structural size of the company is related as a determining factor in the generation of economic and financial performance [97,98]. Different authors in recent studies have incorporated this variable into their research models in order to analyze its effect on dependent variables, such as corporate social responsibility, innovation and financial profitability [99,100].
Company Sector. In the literature and empirical studies, it is common to find the analysis of this control variable in business models, related to economic and financial results. This is in order to analyze the influence of the productive sector and its effect on the performance of organizations over a period of time [91,95,101]. This variable is measured according to the activity sector of each business.

3.5. Reliability and Validity

The use of the PLS methodology implies a two-phase approach [102,103]: The measurement model and the structural model. The measurements are based on a confirmatory factor analysis (CFA) to rule out indicators that have a low correlation with respect to the rest of the scale. To evaluate the measurement model with variables of the reflective type for first- and second-order constructs in (A) mode, the following statistical parameters have been analyzed: 1) Individual reliability of the item, 2) reliability of the construct (internal consistency), 3) convergent validity, and 4) discriminant validity. For the evaluation of the second-order multidimensional construct (CSR), the two-step approach was used through the construction of latent variables [104,105]. In the first step, the first-order dimensions are estimated, and in the second step these scores are used to model the second-order construct [106]. PLS has been chosen in our research because this technique works with blocks of variables (components) and estimates the parameters of the model by maximizing the explained variance of all dependent variables (latent and observed) [107]. Normally this statistical technique is used for exploratory and confirmatory research [108,109]. In addition, we have selected this technique for three main reasons: 1) Our research has a main purpose of explaining how and why the dependent variable influences the independent variable, and also aims to generate new observations and/or scenarios based on predictions [110,111]; 2) in recent years the use of PLS has increased in the areas of social sciences and particularly in the management of the company [112,113]; and, 3) it is a flexible (soft) statistical method in the subject of normality [114,115] and in the type of measurement scales used [111,116].

4. Results

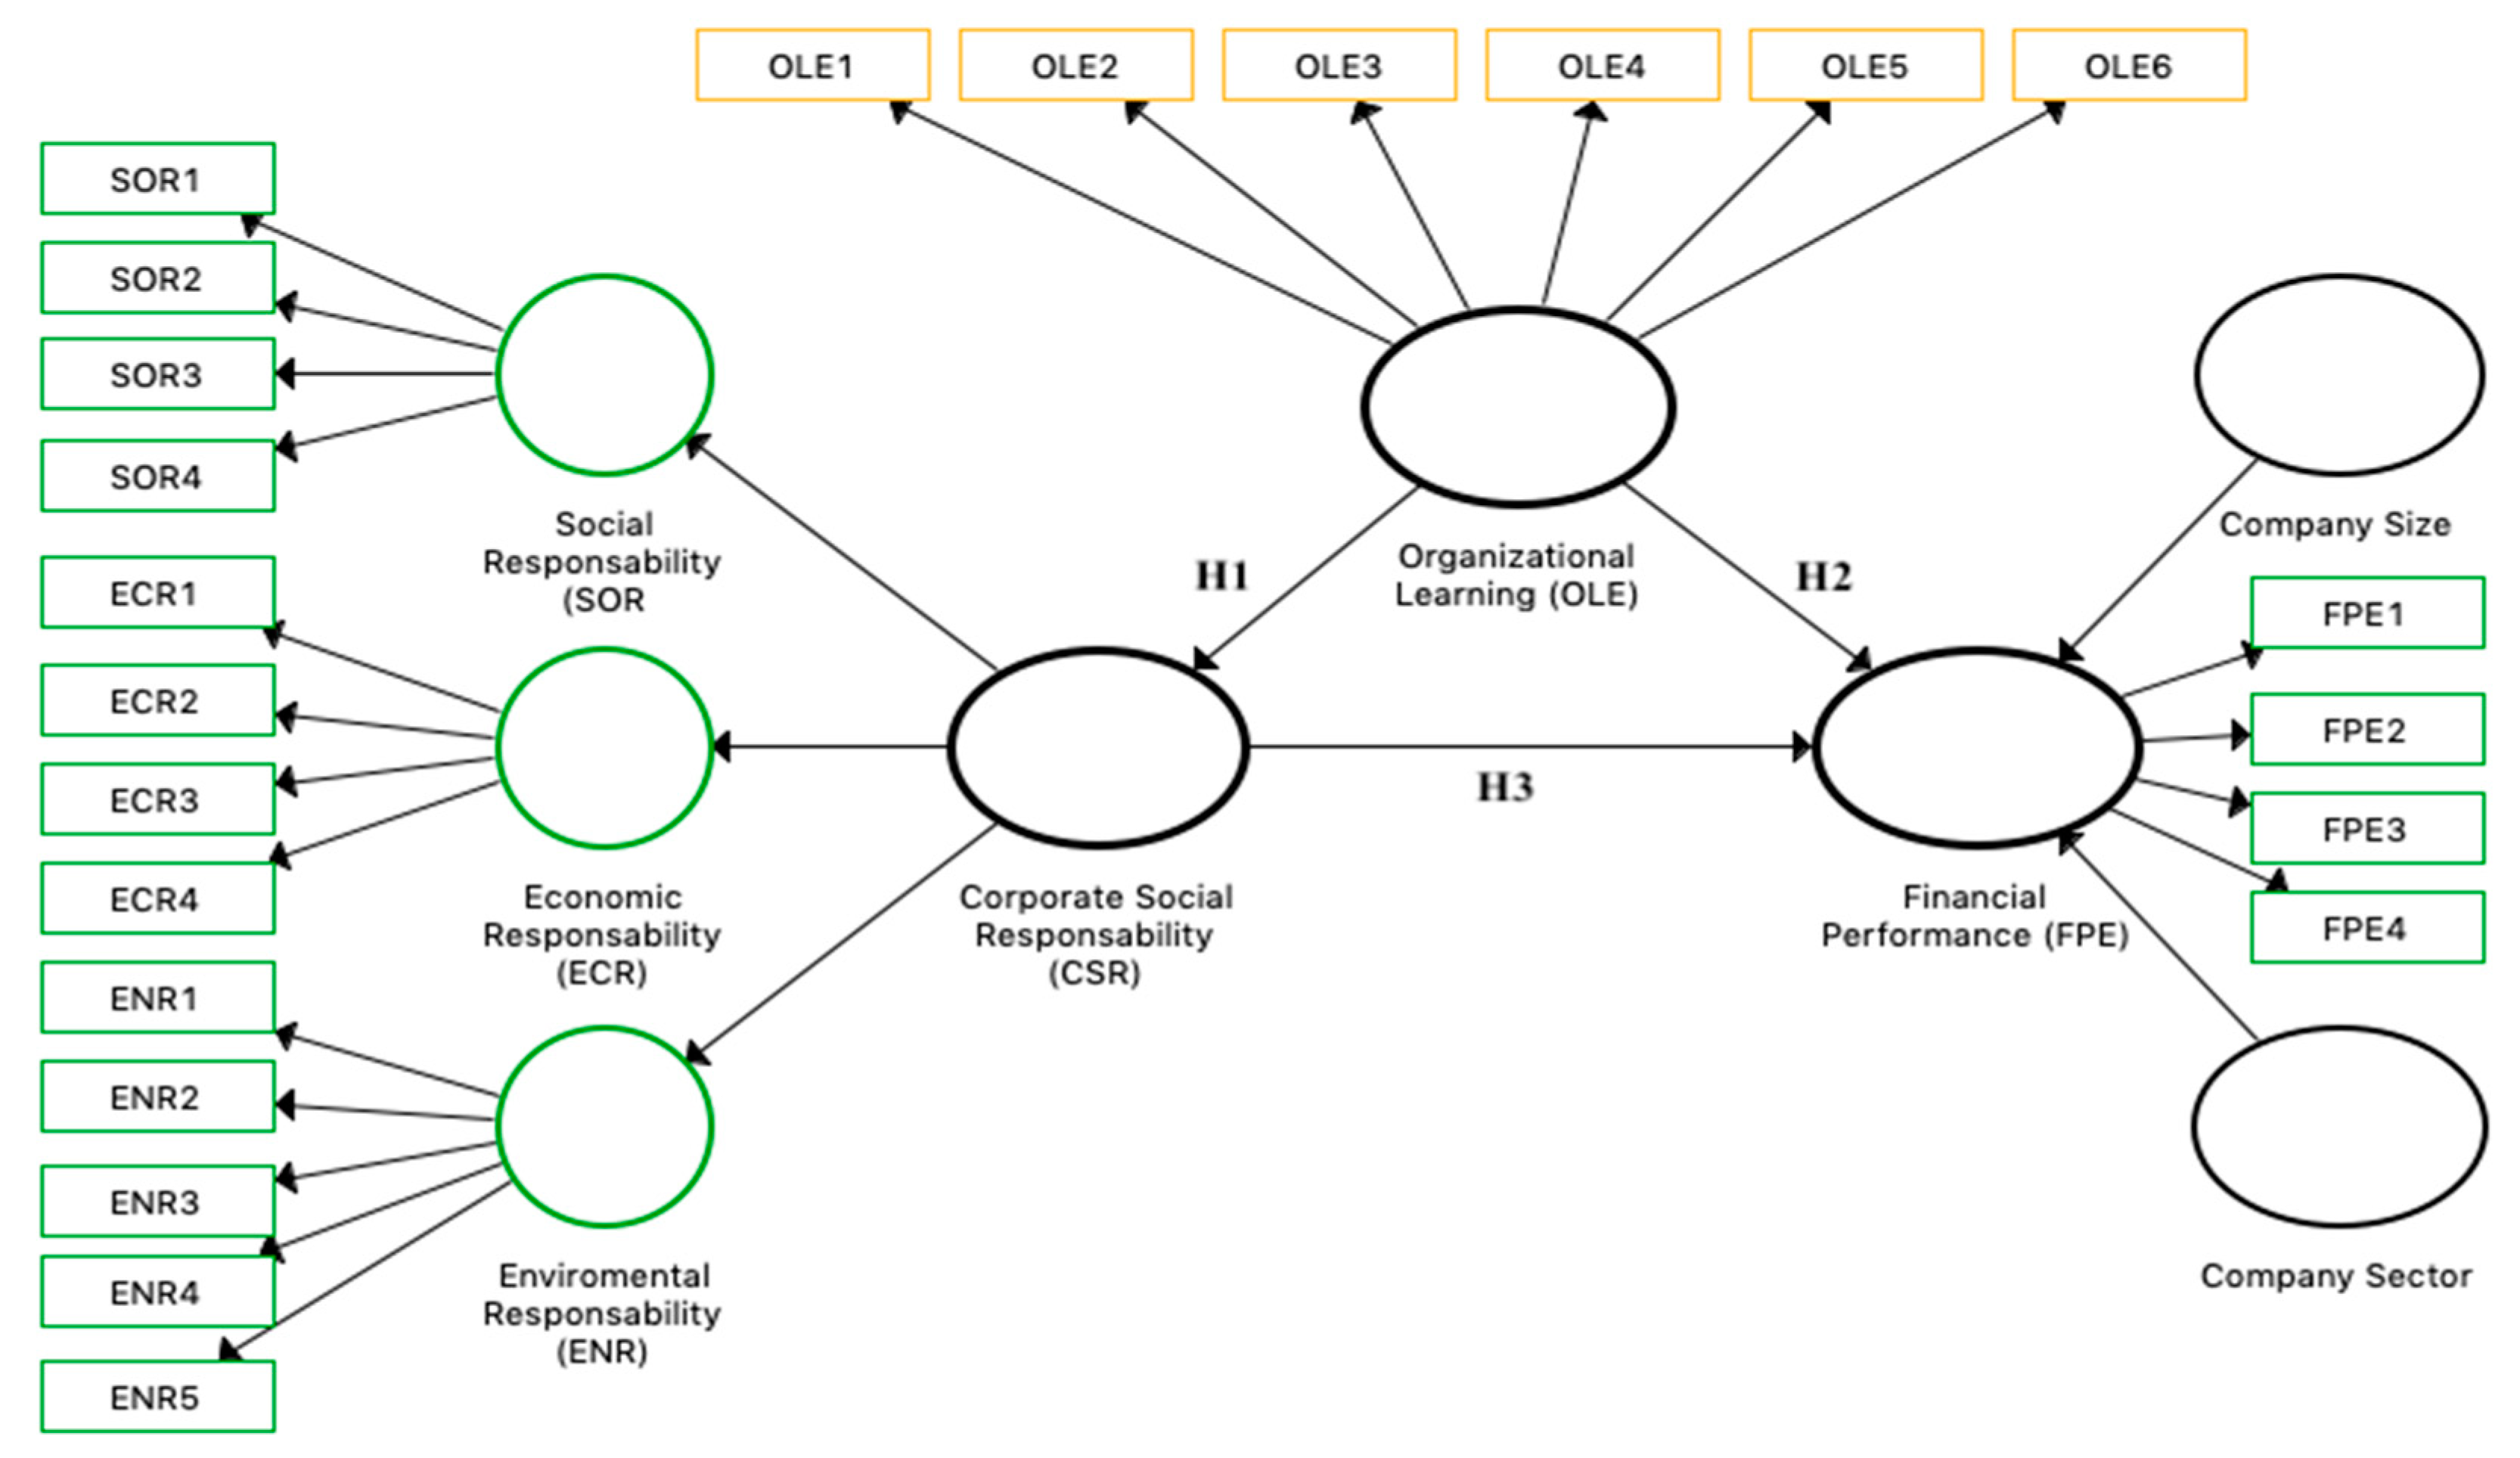
4.1. Measurement Model

To validate the measurement model with reflective variables, we have considered analyzing the behavior of 1) the individual reliability of the item (loads), 2) the reliability of the scale constructs and internal consistency (Cronbach’s alpha and composite reliability), 3) convergent validity, and 4) discriminant validity.

4.2. Item Reliability

The research values are in the range of 0.711 to 0.903 (see Table 2, Table 3 and Table 4); i.e., close numbers and above 0.707, as recommended by Barclay et al. [102]. Other authors, such as Hair et al. [117], indicate that values between 0.500 and 0.600 are sufficient to explain the correlation between the indicator and its respective construct; see Table 4.

4.3. Construct Reliability

With this test we analyze whether the items that measure a construct are similar to its scores. With this, it is evaluated how rigorously or robustly the observable variables are measuring the latent variable. For this test, considered measures are 1) Cronbach’s alpha coefficient (should be greater than 0.700) [118,119], for which our values are in a range of 0.877 to 0.920; and, 2) composite reliability (should be greater than 0.800) [120,121,122], for which our results are in a range of 0.910 to 0.933 [123,124]. All our values are shown above these parameters (see Table 4).

4.4. Convergent Validity

This test implies that a set of indicators represents a single underlying construct, which can be demonstrated by its one-dimensionality [109]. For this, we have considered the value of the AVE (average variance extract), which provides the amount of variance that a construct obtains from its indicators in relation to the amount of variance due to the measurement error [125]. This indicator should be above the value of 0.500 [109,126]. Our results indicate that the values of the AVE of the constructs of the research model are 0.514 (CSR), 0.696 (FPE) and 0.701 (OLE) (see Table 5). Therefore, all constructs explain more than 50% of the variance of the indicators.

4.5. Discriminant Validity

To carry out this test, we considered the criteria of: 1) Forner and Larker [127], and 2) of Henseler, Ringle and Sarstedt [128] through the criterion of the heterotrait-monotrait ratio (HTMT). For the first criterion, the value of the AVE has been considered. Our results of this test are in the range of 0.514 to 0.701 (see Table 5). These data can be seen in the diagonal (in bold) and are the square root of the variance shared between the construct and its measurements. The elements shown outside the diagonal are the correlations between constructs. The square root of the AVE of a construct must be greater than the correlation with another construct of the model.
The second criterion of discriminant validity that was considered is the value or ratio of the HTMT. This test shows the correlations between the indicators of different constructs that measure different phenomena [129,130]. The studies developed by Henseler et al. [130] conclude that HTMT better detects the lack of discriminant validity of the constructs in the research models. The HTMT represents the average of the Heterotrait-Heteromethod correlations (correlations between the indicators that measure the same construct) in relation to the average of the Monotrait-Heteromethod correlations (correlations between the indicators of different constructs that measure different phenomena). In a well-adjusted model, heterotrait correlations should be smaller than monotrait correlations, which implies that the HTMT ratio should be below the value of 1 [110,130]. Our results show values below 0.9 [131]; see Table 6. With these two tests, the three constructs of the research model reach discriminant validity.

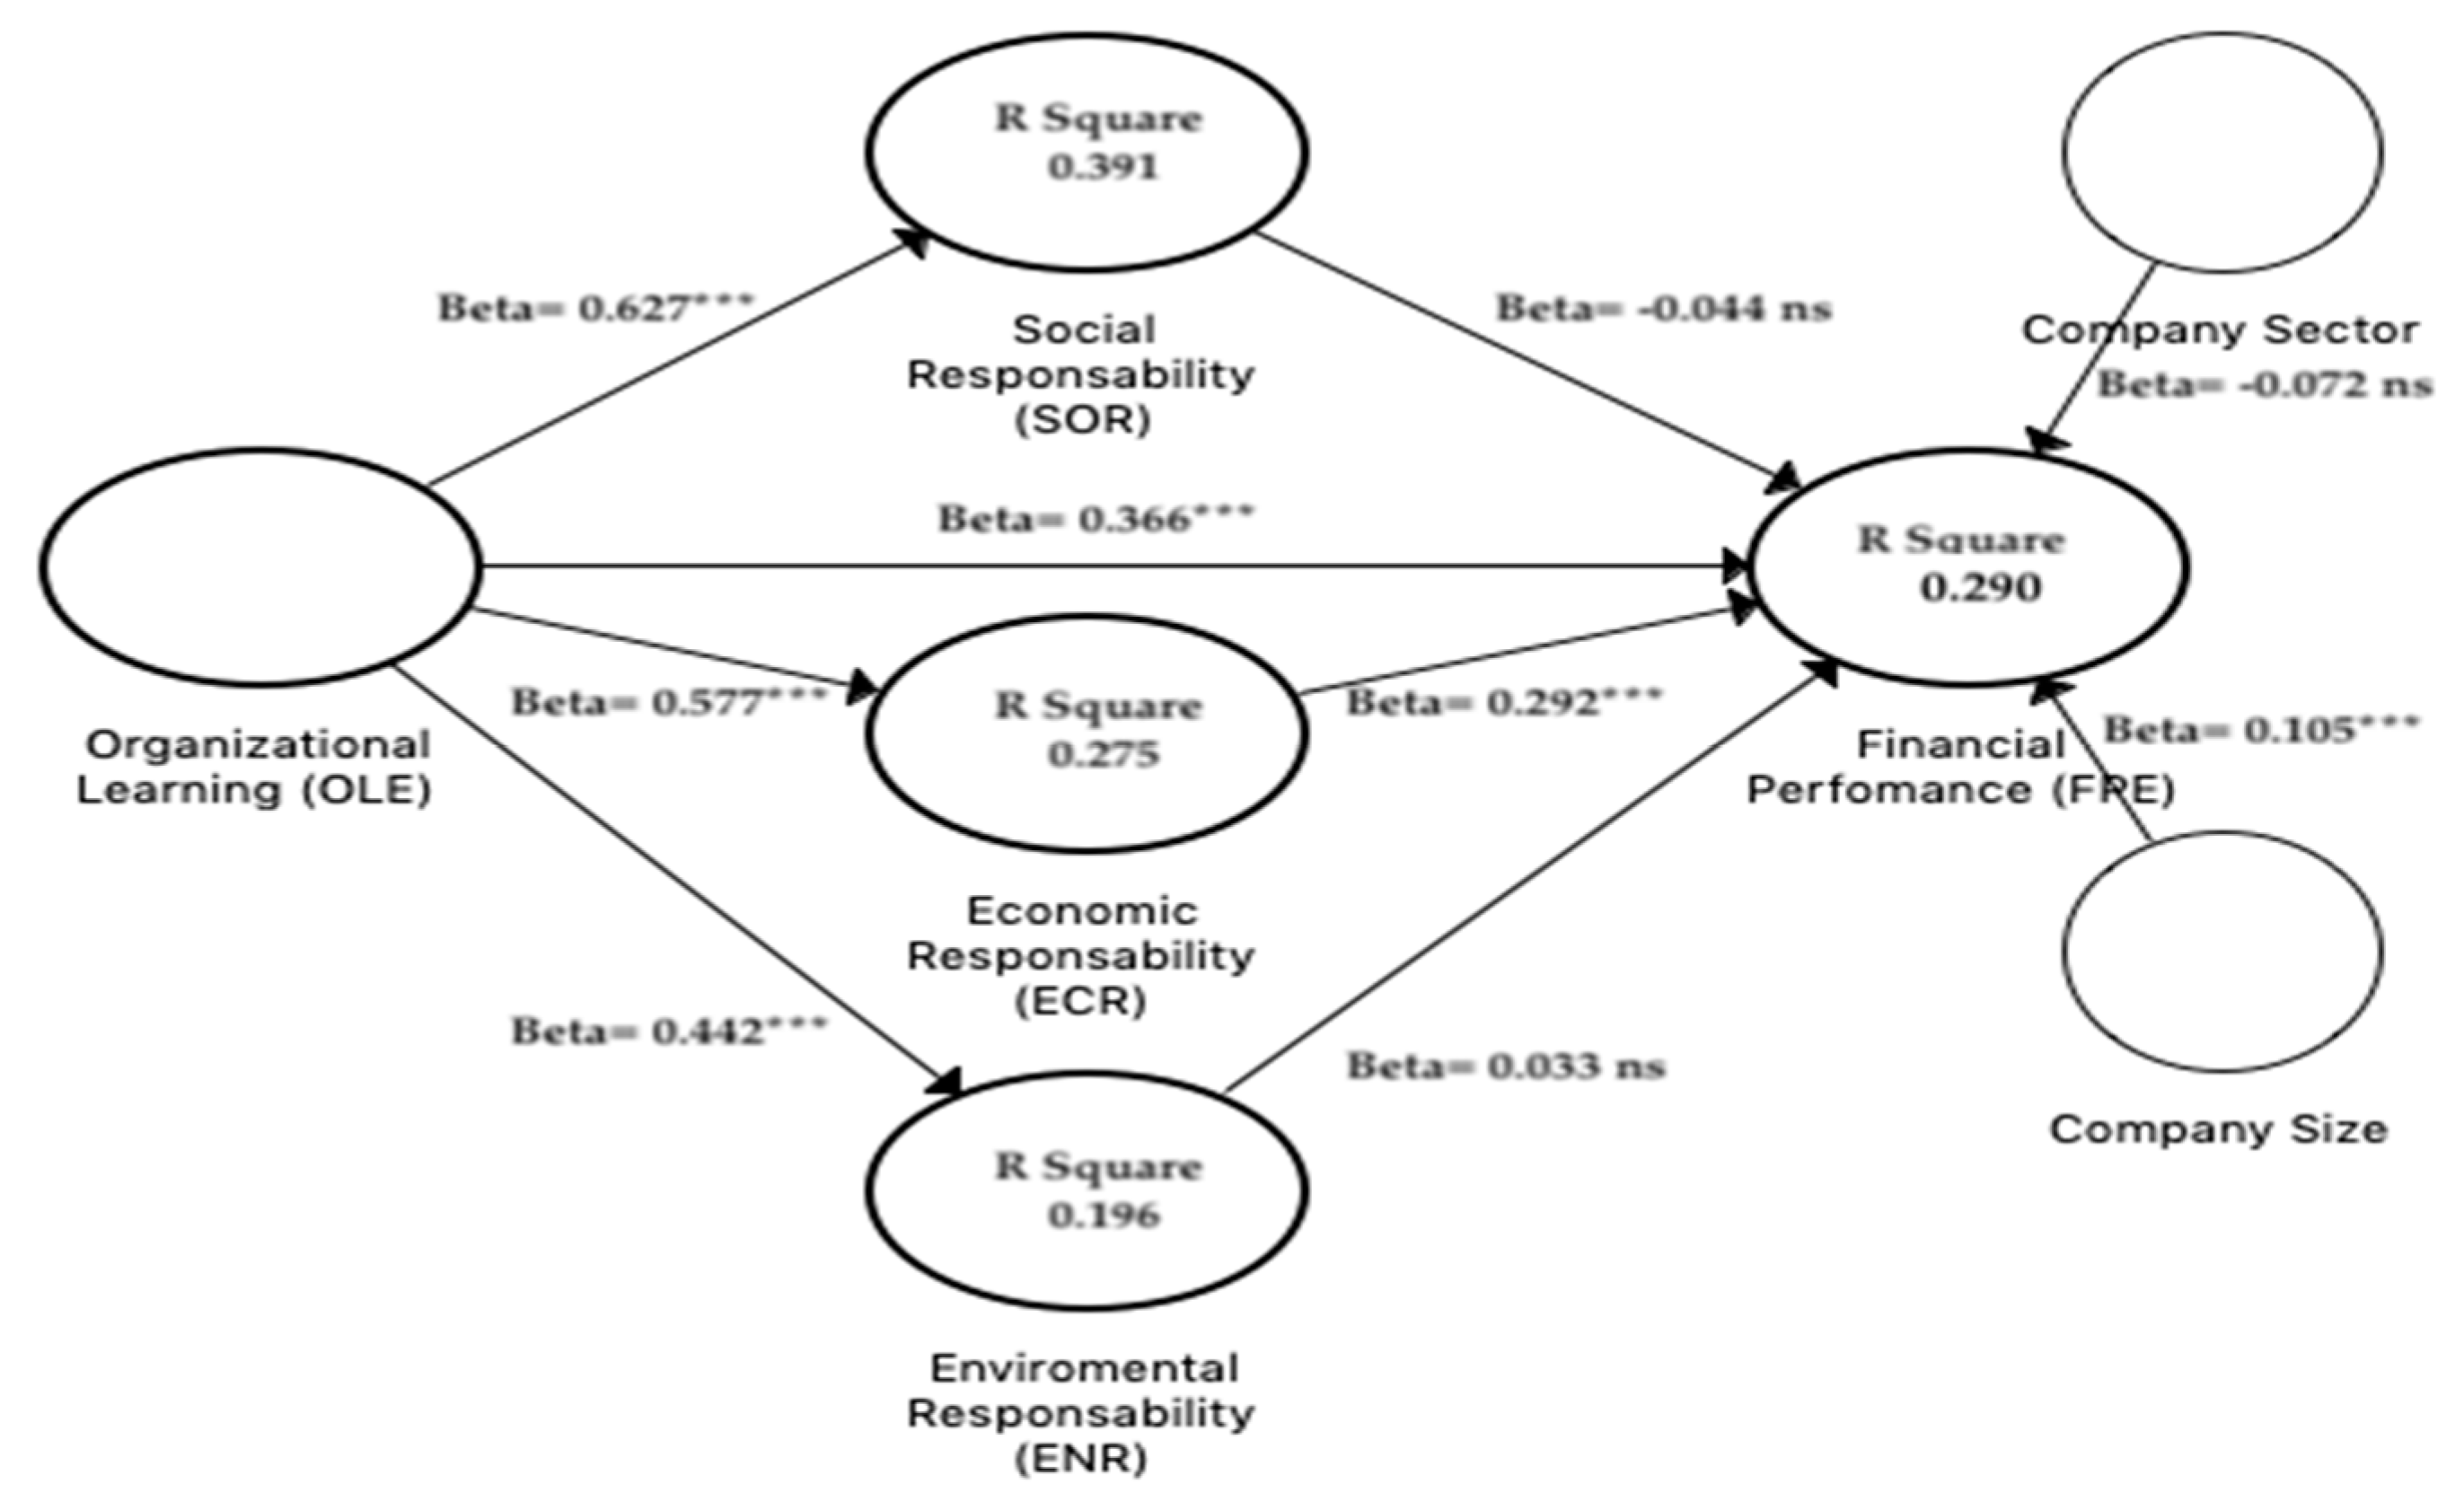
4.6. Structural Model

The statistical technique of structural equations based on variance was used to validate and/or verify the hypotheses raised in this investigation using SmartPLS version 3.2.8 Professional [115]. The use of this technique with the support of this software is appropriate in exploratory and confirmatory research [114,132]. To test the hypotheses of the structural model, the algebraic sign, the magnitude, and the significance of the path coefficients of the research model were analyzed [133]. The test includes a bootstrap test with 5000 subsamples and, in addition, analysis of the percentile confidence intervals (CI) and the bias corrected (CI) were performed; these values must be above the value of 0 [120]. Table 7 and Table 8 present the results of the hypotheses structured in the model.
Table 7 shows the results of the estimation of the structural equations made with PLS. We found empirical support for all the hypotheses structured in the model (H1, H2 and H3). The results of all the hypotheses have positive and significant effects at 99%. H1 shows a strong positive and significant relationship between the OLE and the CSR in the SME according to the beta value of 0.606 p < 0.001. In the same direction, H2 reveals that the OLE exerts a positive and significant influence on the results of financial performance of SMEs according to the beta value of 0.361 p < 0.001. H3 shows that CSR has a positive and significant effect on the FPE according to the beta value of 0.245 p < 0.001. The control variables of size and sector of the company were incorporated into the model. The size of the company shows a small but significant and positive effect on the profitability results of the SME, according to the beta value of 0.099, and with the significance value (p) of 95%. The variable of sector of the company does not show significant effects on profitability in the SME according to the beta value of −0.078.
To measure the predictive power of the structural model we analyzed the coefficient of determination (R2). This value indicates the amount of variance of a construct that is explained by the predictive variables of the said endogenous construct in the model. Our values of adjusted R2 in the model are 0.365 (36%) for the CSR and 0.300 (30%) for the FPE. These results have a substantial impact. We have also analyzed the effect size through f2. This test measures the degree to which an exogenous construct helps explain a specific endogenous construct in terms of R2 [120]. The f2 analysis shows the results of the key relationships of the model with values of 0.055 (small effect), 0.115 (small effect) and 0.580 (big effect); these parameters are based on Cohen [134].
To evaluate the predictive relevance of the structural model we used the analysis of Q2 (cross-validated redundancy index). Therefore, a Stone–Geisser test was performed through the blindfolding procedure in order to measure the relevance and predictive size of the reflective variables. Our values are 0.354 for CSR and 0.283 for FPE, values that are above the value of 0 [107]. To measure the global model fit with reflective-type constructs we analyzed two determining indicators; however, these tests are still under development [135]. First, we analyzed the value of the standardized mean square residue (SRMR), a value that should be in a range between <0.08 and 0.1; our value was 0.099 [128,136]. Second, we analyzed the value of the root mean square error correlation (RMStheta). This indicator is based on the residuals of the external model, which are the differences between the values of the forecast indicators [135]. The values of this indicator should be very close to zero and less than 0.12; our value of 0.139 is close to these parameters [128]. The results of these tests confirm that our global model has a good fit and is aligned with the theory (see Table 9).

4.7. Mediation Analysis

Additionally, we have included the simple mediation analysis in order to respond to objective two of the research sample. According to Hayes & Scharkow [137] and Cepeda, Nitzl & Roldan [138], the procedure to develop a mediation analysis is to 1) determine the significance of the indirect effects (a × b) and 2) determine the type of effect and its magnitude. For this purpose, the test implies, in the first moment, estimating the importance of the direct effect (c’). Following the recommendations of Hayes & Scharkow [137], in a first step it is necessary to check the significance of the indirect effects through a boostrapping procedure with 5000 subsamples to analyze the 90% confidence intervals (bias corrected bootstrap CI and the percentile bootstrap CI ). Indirect effects are significant when the value of 0 is not included in the confidence intervals. According to Nitzl et al. [139], the second step to determine a mediation relationship is necessary to know the type of effect and its magnitude. For this, it is important to know the value of the VAF (variance accounted for); this indicates the size of the indirect effect on the total effect. The value of the VAF must be in a range between 20% and 80%. In our analysis the value of the VAF is 47.17%. In addition, the results of this analysis reveals that our research model reaches a partial mediation of complementary type because: 1) The values of a × b and c´ have the same direction (positive) and 2) the value of the VAF is within the parameters commonly accepted by the researchers (see Table 10, Figure 2) [138,140]. The hypotheses developed to verify the mediating effect are:
H1: The CSR is positively directly related to the financial performance (FPE). H2: The relationship between the CSR and the FPE is mediated positively by the OLE. Where: H1 = CSR→ FPE = c’; H2 = CSR→ OLE→FPE = a1 × b1.
The results show that the variable CSR has a significant direct effect on the variable financial performance (H1: c’ = 0.245sig). On the other hand, all the indirect effects of the variable of mediation OLE are positive and significant. This means that H2 is compatible. Therefore, variable OLE positively mediates the relationship between CSR and FPE (H2: a1 × b1). The results show an indirect effect of 0.219sig and a total effect of 0.464sig. In addition, the values of R2 are observed to be 0.365 for the CSR and 0.289 for the FP, values that are similar the original model.

4.8. Alternative Model 1

In this section, we have included analysis of the alternative model. In order to comply with objective 4 of this research, we analyze in greater depth the direct relationship of the OLE with each of the dimensions of CSR practices (SOR, ECR, ENR) and with financial performance. The constructs of this model were measured as reflective and first-order type. The results show that the OLE has a positive and significant influence on all dimensions of the CSR and financial performance. In a first analysis we observe that OLE has a greater influence on the dimension SOR, which reveals that companies that manage to raise individual and collective learning, and transform it into knowledge, can channel it in the improvement of their social responsibility practices (decent salaries to employees, concern for improving the quality of life of workers and attention to the demands of society). However, the only dimension of CSR practices in SMEs that has a positive and significant effect on financial performance are ECR practices. This result shows that these types of companies are more focused on and concerned about economic practices (strengthening of responsible relationships with other companies and suppliers, offering quality products and increasing their commitment to customers) [49,64]. In relation to the effect that financial performance receives as the model-dependent variable, we observe in Figure 3 that the variance explained through R2 has suffered a small negative variation (alternative model R2 = 0.290) with respect to the theoretical research model (proposed model R2 = 0.300).

4.9. Alternative Model 2

This section shows another of the alternative models we have analyzed to prove that the proposed theoretical model has a greater relevance and significant impact on financial performance. In this model we have eliminated the relationship between CSR towards financial performance. For this, we have tested the model with first- and second-order constructs of the reflective type and structured the direct relationship between the OLE and the CSR and financial performance. The results report that the R2 value of financial performance is 0.264 (see Figure 4). This proves that this model has a lower value of R2 for financial performance and the same value of R2 for CSR with respect to the proposed model.

5. Discussion

To respond to the objectives and research questions derived from the analysis of the sample of 343 SMEs located in a geographical and economic area with great challenges, the results and the main findings are discussed based on learning theories of resources, capabilities and stakeholders. Our work contributes to the literature and business management by analyzing and discovering the connection between organizational learning and CSR actions carried out by SMEs. These types of businesses currently present latent and strong needs. In addition, our mediation analysis has shown that organizational learning is an effective mediating strategy between CSR and the financial performance of SMEs. The strongest result observed in this model focuses on the relationship between OLE and CSR. These results indicate that organizations with managers that focus on the adoption of innovative and effective learning models transform results into higher level capabilities, directly impacting strategies and actions related to corporate social responsibility [9,46,49,141]. These findings between OLE and CSR are in the same direction as the theories of organizational learning and the theory based on resources. Therefore, it is important to report that these business resources and capabilities are complementary and have a two-way effect [142,143]. That is, when managers stop learning and developing knowledge flows throughout the company, the results of CSR strategies will decrease [6,144]. When the company does not focus its resources and capabilities on CSR strategies, the company loses strength in its learning management system (individual, team, collective and social) [45,145]. Another of the clear discoveries of the study focuses on the relationship between CSR and financial performance. Different theoretical currents, such as those of stakeholders, resources and capabilities, have often strongly connected these two variables, and argued that organizational learning is a key element to increase competitiveness and performance in business enterprises of different sizes [46,84,146]. In this same direction, with a similar force, we find that CSR practices derived from the learning abilities of managers and collaborators of companies, including SMEs, help companies increase their sales, profits and profitability, results and behaviors manifested in the roots of stakeholder theory and organizational learning [23,54,147]. The alternative models developed in the study revealed that the proposed model is the one with the greatest congruence and the greatest significant effects between the independent variable (OLE) and the dependent variables CSR and FPE. Therefore, we conclude that OLE is an excellent means to achieve greater profitability through CSR practices. These findings are in the same direction as the different theoretical models developed in the literature [24,48,49,146].

6. Conclusions

The study has generated important theoretical implications: 1) The research contributes to the development of the theory of stakeholders in the field of SMEs by confirming that social, economic and environmental actions contribute significantly to the achievement of financial profitability; 2 ) in addition, these results reinforce the postulates of learning theory and resource-based theory, stating that learning as part of a dynamic capacity increases competitiveness and financial profitability in companies.
From a practical point of view, our study has generated the following implications in the context of SMEs with CSR-based learning models: 1) It is important that investors and managers continue to implement collective learning models in order to increase creativity, innovation and social responsibility actions; 2) companies should continue to adopt sustainable models in order to meet the expectations of stakeholders; and 3) business owners and managers should channel knowledge and learning, and solidify penetration into existing markets and new markets in order to increase financial profitability. In addition, it is important that the owners and managers of these types of companies strengthen the social actions of CSR that focus on the welfare of the worker and social projects towards the community, in order to improve productivity, organizational performance and the company’s own image [148,149]. In addition, the directors of SMEs should pay more attention to formal training to increase the learning of workers; this can be improved through an annual specialized training program. At the same time, SMEs could improve the way of sharing knowledge and create a corporate philosophy based on the flow and regulation of knowledge [150,151]. This is in order to improve communication channels, and establish standards of information security and reliability of the company’s processes. For this purpose, it is important that SMEs adopt CSR models based on double-circuit organizational learning and from the perspective of a dynamic capacity in order to meet the challenges with responsible and competitive strategies [152,153]. Despite the fact that there is a greater interest on the part of SMEs in using learning to focus on their CSR practices, most of these companies are adopting these types of models based on mutual benefit (Stakeholders), only as a strategy of marketing and for being a global trend.
The research exhibits some limitations and, on the other hand, opens an important door for the development of future lines of research. The first limitation at work is the use of a single source of information. This is because the data was collected from subjective perceptions expressed by the owners of SMEs in different productive sectors, which could bias the results. The second limitation refers to the measurement scales used, since only reflective type variables with adaptations of other study scales were considered, so it would be acceptable to use other types of variables with mixed models (reflective-formative), and including analysis of variables with statistical techniques based on variance. In the same way it would be appropriate to conduct a longitudinal study over the next few years with these same companies in order to analyze the behavior of these same variables. Finally, given the importance of organizational learning and corporate social responsibility in small and large companies, as they are factors that generate organizational and financial sustainability, it is convenient to continue with the development of this type of research that includes variables such as creativity, eco-innovation, circular economy and technological knowledge. This is in order to continue strengthening the development and sustained growth of SMEs in global and highly competitive environments.

Author Contributions

L.E.V.-J.: Elaborated the theoretical model of the investigation, collaborated in the justification of the hypotheses, in the analysis of the results and in the elaboration of the conclusions of this manuscript. D.G.-V.: Collaborated in the construction and justification of the hypotheses and in the review of the literature and also contributed to the statistical analysis of the data. E.A.R.-E.: Contributed to the review of the literature of the document and in the construction of the conclusions and recommendations of the manuscript. D.G.-V.: He contributed in the statistical analysis for the verification of non-response bias and in the factorial analysis.

Funding

This project received funding for its development and publication by the Program for Strengthening Educational Quality (PFCE, 2019) of the Secretariat of Public Education of Mexico.

Acknowledgments

We thank the support in the elaboration of this research to the professors of the research group of Management and Business Development of ITSON in Mexico and to the professors of the University of Extremadura in Spain and thanks to two students of the degree in Business Administration and Master in Business Development of the University “ITSON”, for their collaboration in the project. In addition, our recognition to the managers of the companies participating in this investigation for their availability and their valuable support).

Conflicts of Interest

The authors declare no conflict of interest.

References

  1. McCormick, K.; Kautto, N. The Bioeconomy in Europe: An Overview. Sustainability 2013, 5, 2589–2608. [Google Scholar] [CrossRef] [Green Version]
  2. Clinton, L.; Whisnant, R. Business Model Innovations for Sustainability. In Managing Sustainable Business; Springer: Dordrecht, The Netherlands, 2019; pp. 467–507. [Google Scholar]
  3. Andreeva, T.; Ritala, P. What are the sources of capability dynamism? Reconceptualizing dynamic capabilities from the perspective of organizational change. Balt. J. Manag. 2016, 11, 238–259. [Google Scholar] [CrossRef]
  4. Bontis, N.; Crossan, M.M.; Hulland, J. Managing an Organizational Learning System by Aligning Stocks and Flows. J. Manag. Stud. 2002, 39, 437–469. [Google Scholar] [CrossRef]
  5. Bontis, N.; Ciambotti, M.; Palazzi, F.; Sgro, F. Intellectual capital and financial performance in social cooperative enterprises. J. Intellect. Cap. 2018, 19, 712–731. [Google Scholar] [CrossRef]
  6. Nonaka, I. The knowledge-creating company. Harv. Bus. Rev. 2007, 85, 162. [Google Scholar]
  7. Diaz-Fernandez, M.; Pasamar-Reyes, S.; Valle-Cabrera, R. Human capital and human resource management to achieve ambidextrous learning: A structural perspective. BRQ Bus. Res. Q. 2015, 20, 63–77. [Google Scholar] [CrossRef]
  8. March, J.G. Exploration and Exploitation in Organizational Learning. Organ. Sci. 1991, 2, 71–87. [Google Scholar] [CrossRef]
  9. Zahra, S.A.; Zheng, C.; Yu, J. Learning advantages of newness: A reconceptualization and contingent framework. J. Int. Entrep. 2017, 16, 12–37. [Google Scholar] [CrossRef]
  10. McWilliams, A.; Siegel, D.S. Creating and Capturing Value. J. Manag. 2011, 37, 1480–1495. [Google Scholar] [CrossRef]
  11. Serenko, A.; Bontis, N.; Hardie, T. Organizational size and knowledge flow: A proposed theoretical link. J. Intellect. Cap. 2007, 8, 610–627. [Google Scholar] [CrossRef]
  12. Yu, Y.; Dong, X.Y.; Shen, K.N.; Khalifa, M.; Hao, J.X. Strategies, technologies, and organizational learning for developing organizational innovativeness in emerging economies. J. Bus. Res. 2013, 66, 2507–2514. [Google Scholar] [CrossRef]
  13. UNESCO. Human Learning in the Digital Era; UNESCO Publishing: París, France, 2019. [Google Scholar]
  14. OECD Organization for Economic Cooperation and Development. Employment Outlook 2018; OCED Publishing: Paris, France, 2018; p. 3. ISBN 9789264301788. [Google Scholar]
  15. Bank, W. Doing Business 2019: Training for Reform; World Bank Group: Wshington, DC, USA, 2018. [Google Scholar]
  16. Dror, I.E.; Makany, T.; Kemp, J. Overcoming learning barriers through knowledge management. Dyslexia 2011, 17, 38–47. [Google Scholar] [CrossRef] [PubMed]
  17. Thomä, J. DUI mode learning and barriers to innovation—A case from Germany. Res. Policy 2017, 46, 1327–1339. [Google Scholar] [CrossRef]
  18. Mourtzis, D.; Boli, N.; Dimitrakopoulos, G.; Zygomalas, S.; Koutoupes, A. Enabling Small Medium Enterprises (SMEs) to improve their potential through the Teaching Factory paradigm. Procedia Manuf. 2018, 23, 183–188. [Google Scholar] [CrossRef]
  19. Crossan, M.M.; Lane, H.W.; White, R.E. An Organizational Learning Framework: From Intuition to Institution. Acad. Manag. Rev. 1999, 24, 522–537. [Google Scholar] [CrossRef]
  20. Siebenhüner, B.; Arnold, M. Organizational learning to manage sustainable development. Bus. Strategy Environ. 2007, 16, 339–353. [Google Scholar] [CrossRef]
  21. Engert, S.; Rauter, R.; Baumgartner, R.J. Exploring the integration of corporate sustainability into strategic management: A literature review. J. Clean. Prod. 2016, 112, 2833–2850. [Google Scholar] [CrossRef]
  22. Freeman, R.E. Strategic Management: A Stakeholder Approach; Cambridge University Press: New York, NY, USA, 2010. [Google Scholar]
  23. McWilliams, A.; Parhankangas, A.; Coupet, J.; Welch, E.; Barnum, D.T. Strategic Decision Making for the Triple Bottom Line. Bus. Strategy Environ. 2016, 25, 193–204. [Google Scholar] [CrossRef]
  24. Barney, J.B.; Ketchen, D.J.; Wright, M. The future of resource-based theory: Revitalization or decline? J. Manag. 2011, 37, 1299–1315. [Google Scholar] [CrossRef]
  25. Teece, D.J. Business models, business strategy and innovation. Long Range Plan. 2010, 43, 172–194. [Google Scholar] [CrossRef]
  26. Spender, J.-C. Organizational knowledge, learning and memory: Three concepts in search of a theory. J. Organ. Chang. Manag. 1996, 9, 63–78. [Google Scholar] [CrossRef]
  27. Davenport, T.H. Personal Knowledge Management and Knowledge Worker Capabilities. In Personal Knowledge Management; Routledge: Abingdon-on-Thames, UK, 2016; pp. 189–210. [Google Scholar]
  28. Cameron, K.; Quinn, R. Diagnosing and Changing Organizational Culture. Based on the Competing Values Framework; Jossey-Bass Business & Management Series; John Wiley & Sons: Hoboken, NJ, USA, 2006. [Google Scholar]
  29. Huber, G.P. Organizational Learning: The Contributing Processes and the Literatures. Organ. Sci. 1991, 2, 88–115. [Google Scholar] [CrossRef]
  30. Nonaka, I.; von Krogh, G. Perspective—Tacit Knowledge and Knowledge Conversion: Controversy and Advancement in Organizational Knowledge Creation Theory. Organ. Sci. 2009, 20, 635–652. [Google Scholar] [CrossRef]
  31. Argote, L.; Miron-Spektor, E. Organizational Learning: From Experience to Knowledge. Organ. Sci. 2011, 22, 1123–1137. [Google Scholar] [CrossRef]
  32. Namada, J.M. Organizational learning and competitive advantage. In Handbook of Research on Knowledge Management for Contemporary Business Environments; Malheiro, A., Ribeiro, F., Jamil, G.L., Rascao, G.P., Mealha, O., Eds.; IGI Global: Hershey, PA, USA, 2018; pp. 86–104. [Google Scholar]
  33. Nonaka, I.; Takeuchi, H. The Knowledge-Creation Company; Oxford University Press: New York, NY, USA, 1995; ISBN 019-509269-4. [Google Scholar]
  34. Slater, S.F.; Narver, J.C. Market Orientation and the Learning Organization. J. Mark. 1995, 59, 63–74. [Google Scholar] [CrossRef]
  35. Cohen, W.M.; Levinthal, D.A. Absorptive Capacity: A New Perspective on Learning and Innovation. Adm. Sci. Q. 1990, 35, 128–152. [Google Scholar] [CrossRef]
  36. Zahra, S.A.; George, G. Absorptive capacity: A review, reconceptualization, and extension. Acad. Manag. Rev. 2002, 27, 185–203. [Google Scholar] [CrossRef]
  37. Mcafee, A.; Brynjolfsson, E. HBR. ORG Spotlight on Big Data Big Data: The Management Revolution; Harvard Business Publishing: Cambridge, MA, USA, 2012. [Google Scholar]
  38. Jensen, M.B.; Johnson, B.; Lorenz, E.; Lundvall, B.-Å.; Lundvall, B.A. Forms of knowledge and modes of innovation. In The Learning Economy and the Economics of Hope; Anthem Press: London, UK, 2007; Volume 155. [Google Scholar]
  39. Kim, D.H. The link between individual and organizational learning. MIT Sloan Manag. Rev. 1993, 35, 37–50. [Google Scholar]
  40. Todorova, G.; Durisin, B. Absorptive capacity: Valuing a reconceptualization. Acad. Manag. Rev. 2007, 32, 774–786. [Google Scholar] [CrossRef]
  41. Maon, F.; Lindgreen, A.; Swaen, V. Organizational Stages and Cultural Phases: A Critical Review and a Consolidative Model of Corporate Social Responsibility Development. Int. J. Manag. Rev. 2010, 12, 20–38. [Google Scholar] [CrossRef]
  42. Wood, D.J. Corporate Social Performance Revisited. Acad. Manag. Rev. 1991, 16, 691–718. [Google Scholar] [CrossRef]
  43. Ma, L.; Ferguson, J.D.; Roper, M.; Wood, M.; Wilson, J. A collaborative approach to learning programming: A hybrid learning model. In Proceedings of the 6th Annual Higher Education Academy Subject Network for Information Computer Science Conference, York, UK, 30 August–1 September 2005. [Google Scholar]
  44. Zadek, S. The Path to Corporate Responsibility. In Corporate Ethics and Corporate Governance; Springer: Berlin/Heidelberg, Germany, 2007; pp. 159–172. [Google Scholar]
  45. Zhao, Z.; Meng, F.; He, Y.; Gu, Z. The Influence of Corporate Social Responsibility on Competitive Advantage with Multiple Mediations from Social Capital and Dynamic Capabilities. Sustainability 2019, 11, 218. [Google Scholar] [CrossRef]
  46. Bontis, N.; Wu, S.; Wang, W.-Y.; Chang, C. Intellectual capital and performance in causal models: Evidence from the information technology industry in Taiwan. J. Intellect. Cap. 2005, 6, 222–236. [Google Scholar]
  47. Lozano, R. Creativity and Organizational Learning as Means to Foster Sustainability. Sustain. Dev. 2014, 22, 205–216. [Google Scholar] [CrossRef]
  48. Carroll, A.B. Carroll’s pyramid of CSR: Taking another look. Int. J. Corp. Soc. Responsib. 2016, 1, 3. [Google Scholar] [CrossRef]
  49. Carroll, A.B.; Shabana, K.M. The Business Case for Corporate Social Responsibility: A Review of Concepts, Research and Practice. Int. J. Manag. Rev. 2010, 12, 85–105. [Google Scholar] [CrossRef]
  50. Cohen, S.; Kaimenakis, N. Intellectual capital and corporate performance in knowledge-intensive SMEs. Learn. Organ. 2007, 14, 241–262. [Google Scholar] [CrossRef]
  51. Jiménez-Jiménez, D.; Sanz-Valle, R. Innovation, organizational learning, and performance. J. Bus. Res. 2011, 64, 408–417. [Google Scholar] [CrossRef]
  52. von Weltzien Hoivik, H. Embedding CSR as a learning and knowledge creating process: The case for SMEs in Norway. J. Manag. Dev. 2011, 30, 1067–1084. [Google Scholar] [CrossRef]
  53. Fortis, Z.; Maon, F.; Frooman, J.; Reiner, G. Unknown Knowns and Known Unknowns: Framing the Role of Organizational Learning in Corporate Social Responsibility Development. Int. J. Manag. Rev. 2018, 20, 277–300. [Google Scholar] [CrossRef]
  54. Gomes, G.; Wojahn, R.M. Organizational learning capability, innovation and performance: Study in small and medium-sized enterprises (SMES). Rev. Adm. 2017, 52, 163–175. [Google Scholar] [CrossRef]
  55. Kilpi, V.; Lorentz, H.; Solakivi, T.; Malmsten, J. The effect of external supply knowledge acquisition, development activities and organizational status on the supply performance of SMEs. J. Purch. Supply Manag. 2018, 24, 247–259. [Google Scholar] [CrossRef]
  56. Cavaleri, S.; Shabana, K. Rethinking sustainability strategies. J. Strategy Manag. 2018, 11, 2–17. [Google Scholar] [CrossRef]
  57. Dashwood, H.S. CSR norms and organizational learning in the mining sector. Corp. Gov. Int. J. Bus. Soc. 2012, 12, 118–138. [Google Scholar] [CrossRef]
  58. Mishra, D.R. Post-innovation CSR Performance and Firm Value. J. Bus. Ethics 2017, 140, 285–306. [Google Scholar] [CrossRef]
  59. Eikelenboom, M.; de Jong, G. The impact of dynamic capabilities on the sustainability performance of SMEs. J. Clean. Prod. 2019, 235, 1360–1370. [Google Scholar] [CrossRef]
  60. Lichtenthaler, U. Absorptive capacity, environmental turbulence, and the complementarity of organizational learning processes. Acad. Manag. J. 2009, 52, 822–846. [Google Scholar] [CrossRef]
  61. Swee Lin Tan, C.X.; Smyrnios, K.; Xiong, L. What drives learning orientation in fast growth SMEs? Int. J. Entrep. Behav. Res. 2014, 20, 324–350. [Google Scholar] [CrossRef]
  62. Real, J.C.; Roldán, J.L.; Leal, A. From Entrepreneurial Orientation and Learning Orientation to Business Performance: Analysing the Mediating Role of Organizational Learning and the Moderating Effects of Organizational Size. Br. J. Manag. 2014, 25, 186–208. [Google Scholar] [CrossRef]
  63. Battisti, M.; Beynon, M.; Pickernell, D.; Deakins, D. Surviving or thriving: The role of learning for the resilient performance of small firms. J. Bus. Res. 2019, 100, 38–50. [Google Scholar] [CrossRef]
  64. Friedman, M. The Social Responsibility of Business Is to Increase Its Profits. In Corporate Ethics and Corporate Governance; Zimmerli, W.C., Holzinger, M., Richter, K., Eds.; Springer: Berlin/Heidelberg, Germany, 2007; pp. 173–178. ISBN 978-3-540-70818-6. [Google Scholar]
  65. Herrera Madueño, J.; Larrán Jorge, M.; Lechuga Sancho, M.P.; Martínez-Martínez, D. Responsabilidad social en las pymes: Análisis exploratorio de factores explicativos. Rev. Contab. 2016, 19, 31–44. [Google Scholar] [CrossRef]
  66. Flammer, C. Does Corporate Social Responsibility Lead to Superior Financial Performance? A Regression Discontinuity Approach. Manag. Sci. 2015, 61, 2549–2568. [Google Scholar] [CrossRef] [Green Version]
  67. Nunes, M.F.; Park, C.L. Self-claimed sustainability: Building social and environmental reputations with words. Sustain. Prod. Consum. 2017, 11, 46–57. [Google Scholar] [CrossRef]
  68. Schramm-Klein, H.; Zentes, J.; Steinmann, S.; Swoboda, B.; Morschett, D. Retailer Corporate Social Responsibility Is Relevant to Consumer Behavior. Bus. Soc. 2016, 55, 550–575. [Google Scholar] [CrossRef]
  69. Berrone, P.; Surroca, J.; Tribó, J.A. Corporate Ethical Identity as a Determinant of Firm Performance: A Test of the Mediating Role of Stakeholder Satisfaction. J. Bus. Ethics 2007, 76, 35–53. [Google Scholar] [CrossRef]
  70. Torugsa, N.A.; O’Donohue, W.; Hecker, R. Proactive CSR: An Empirical Analysis of the Role of its Economic, Social and Environmental Dimensions on the Association between Capabilities and Performance. J. Bus. Ethics 2013, 115, 383–402. [Google Scholar] [CrossRef]
  71. Saeidi, S.P.; Sofian, S.; Saeidi, P.; Saeidi, S.P.; Saaeidi, S.A. How does corporate social responsibility contribute to firm financial performance? The mediating role of competitive advantage, reputation, and customer satisfaction. J. Bus. Res. 2015, 68, 341–350. [Google Scholar] [CrossRef]
  72. Valdez-Juárez, L.; Gallardo-Vázquez, D.; Ramos-Escobar, E.; Valdez-Juárez, L.E.; Gallardo-Vázquez, D.; Ramos-Escobar, E.A. CSR and the Supply Chain: Effects on the Results of SMEs. Sustainability 2018, 10, 2356. [Google Scholar] [CrossRef]
  73. De, D.; Chowdhury, S.; Dey, P.K.; Ghosh, S.K. Impact of Lean and Sustainability Oriented Innovation on Sustainability Performance of Small and Medium Sized Enterprises: A Data Envelopment Analysis-based framework. Int. J. Prod. Econ. 2018. [Google Scholar] [CrossRef]
  74. Danso, A.; Adomako, S.; Lartey, T.; Amankwah-Amoah, J.; Owusu-Yirenkyi, D. Stakeholder integration, environmental sustainability orientation and financial performance. J. Bus. Res. 2019. [Google Scholar] [CrossRef]
  75. Khan, S.Z.; Yang, Q.; Waheed, A. Investment in intangible resources and capabilities spurs sustainable competitive advantage and firm performance. Corp. Soc. Responsib. Environ. Manag. 2019, 26, 285–295. [Google Scholar] [CrossRef]
  76. Pislaru, M.; Herghiligiu, I.V.; Robu, I.-B. Corporate sustainable performance assessment based on fuzzy logic. J. Clean. Prod. 2019, 223, 998–1013. [Google Scholar] [CrossRef]
  77. INEGI. Economic Census, Summary of the Final Results; INEGI: Aguascalientes, Mexico, 2018. [Google Scholar]
  78. Cochran, W.G. Sampling Techniques; John Wiley & Sons: Hoboken, NJ, USA, 2007; ISBN 8126515244. [Google Scholar]
  79. Podsakoff, P.M.; MacKenzie, S.B.; Lee, J.; Podsakoff, N.P. Common Method Bias in Behavioral Research: A Critical Review of the Literature and Ecommended Remedies. J. Appl. Psychol. 2003, 88, 879–903. [Google Scholar] [CrossRef] [PubMed]
  80. Bagozzi, R.P.; Yi, Y.; Phillips, L.W. Assessing Construct Validity in Organizational Research. Adm. Sci. Q. 1991, 36, 421–458. [Google Scholar] [CrossRef]
  81. Jarvis, C.B.; MacKenzie, S.B.; Podsakoff, P.M. A Critical Review of Construct Indicators and Measurement Model Misspecification in Marketing and Consumer Research. J. Consum. Res. 2003, 30, 199–218. [Google Scholar] [CrossRef]
  82. Wetzels, M.; Odekerken-Schröder, G.; van Oppen, C. Using PLS Path Modeling for Assessing Hierarchical Construct Models: Guidelines and Empirical Illustration. MIS Q. 2009, 33, 177–195. [Google Scholar] [CrossRef]
  83. Kristandl, G.; Bontis, N. Constructing a definition for intangibles using the resource based view of the firm. Manag. Decis. 2007, 45, 1510–1524. [Google Scholar] [CrossRef] [Green Version]
  84. McWilliams, A.; Siegel, D.S.; Wright, P.M. Corporate social responsibility: Strategic implications. J. Manag. Stud. 2006, 43, 1–18. [Google Scholar] [CrossRef]
  85. Carroll, A.B. Corporate Social Responsibility. Bus. Soc. 1999, 38, 268–295. [Google Scholar] [CrossRef]
  86. Turker, D. Measuring Corporate Social Responsibility: A Scale Development Study. J. Bus. Ethics 2009, 85, 411–427. [Google Scholar] [CrossRef]
  87. Jenkins, H. Small Business Champions for Corporate Social Responsibility. J. Bus. Ethics 2006, 67, 241–256. [Google Scholar] [CrossRef]
  88. Orlitzky, M.; Schmidt, F.L.; Rynes, S.L. Corporate Social and Financial Performance: A Meta-Analysis. Organ. Stud. 2003, 24, 403–441. [Google Scholar] [CrossRef]
  89. Surroca, J.; Tribó, J.A.; Waddock, S. Corporate responsibility and financial performance: The role of intangible resources. Strategy Manag. J. 2010, 31, 463–490. [Google Scholar] [CrossRef]
  90. Fagerberg, J. Schumpeter and the revival of evolutionary economics: An appraisal of the literature. J. Evol. Econ. 2003, 13, 125–159. [Google Scholar] [CrossRef]
  91. Augier, M.; March, J.G. A retrospective look at A Behavioral Theory of the Firm. J. Econ. Behav. Organ. 2008, 66, 1–6. [Google Scholar] [CrossRef]
  92. Barney, J. Firm resources and sustained competitive advantage. J. Manag. 1991, 17, 99–120. [Google Scholar] [CrossRef]
  93. Barney, J.; Wright, M.; Ketchen, D.J. The resource-based view of the firm: Ten years after 1991. J. Manag. 2001, 27, 625–641. [Google Scholar] [CrossRef]
  94. Griffin, J.J.; Mahon, J.F. The Corporate Social Performance and Corporate Financial Performance Debate. Bus. Soc. 1997, 36, 5–31. [Google Scholar] [CrossRef]
  95. Bagnoli, C.; Vedovato, M. The impact of knowledge management and strategy configuration coherence on SME performance. J. Manag. Gov. 2014, 18, 615–647. [Google Scholar] [CrossRef]
  96. Benitez, J.; Castillo, A.; Llorens, J.; Braojos, J. IT-enabled knowledge ambidexterity and innovation performance in small U.S. firms: The moderator role of social media capability. Inf. Manag. 2018, 55, 131–143. [Google Scholar] [CrossRef]
  97. Sigler, K. CEO Compensation and Company Performance. Bus. Econ. J. 2011, 31, 1–8. [Google Scholar]
  98. Lo, S.-F.; Lu, W.-M. Does size matter? Finding the profitability and marketability benchmark of financial holding companies. Asia-Pac. J. Oper. Res. 2006, 23, 229–246. [Google Scholar]
  99. Reverte, C.; Gómez-Melero, E.; Cegarra-Navarro, J.G. The influence of corporate social responsibility practices on organizational performance: Evidence from Eco-Responsible Spanish firms. J. Clean. Prod. 2016, 112, 2870–2884. [Google Scholar]
  100. Martinez-Conesa, I.; Soto-Acosta, P.; Palacios-Manzano, M. Corporate social responsibility and its effect on innovation and firm performance: An empirical research in SMEs. J. Clean. Prod. 2017, 142, 2374–2383. [Google Scholar] [CrossRef]
  101. Benitez-Amado, J.; Walczuch, R.M. Information technology, the organizational capability of proactive corporate environmental strategy and firm performance: A resource-based analysis. Eur. J. Inf. Syst. 2012, 21, 664–679. [Google Scholar] [CrossRef]
  102. Barclay, D.; Higgins, C.; Thompson, R. The partial least squares (PLS) approach to causal modeling: Personal computer adoption and use as an illustration. Technol. Stud. 1995, 2, 285–309. [Google Scholar]
  103. Avkiran, N.K.; Ringle, C.M. Partial Least Squares Structural Equation Modeling: Recent Advances in Banking and Finance; Springer: Cham, Switzerland, 2018. [Google Scholar]
  104. Schuberth, F.; Henseler, J.; Dijkstra, T.K. Partial least squares path modeling using ordinal categorical indicators. Qual. Quant. 2018, 52, 9–35. [Google Scholar] [CrossRef] [PubMed]
  105. Wright, R.T.; Campbell, D.E.; Bennett Thatcher, J.; Roberts, N.; Bennett, J. Operationalizing Multidimensional Constructs in Structural Equation Modeling: Recommendations for IS Research. CAIS 2012, 30, 367–412. [Google Scholar] [CrossRef]
  106. Van Riel, A.C.R.; Henseler, J.; Kemény, I.; Sasovova, Z. Estimating hierarchical constructs using consistent partial least squares. Ind. Manag. Data Syst. 2017, 117, 459–477. [Google Scholar] [CrossRef] [Green Version]
  107. Chin, W.W. Issues and Opinion on Structural Equation Modeling. MIS Q. 1998, 22, 7–16. [Google Scholar]
  108. Vinzi, V.E.; Chin, W.W.; Henseler, J.; Wang, H. Handbooks of Partial Least Squares; Springer: Berlin, Germany, 2010. [Google Scholar]
  109. Henseler, J.; Ringle, C.M.; Sinkovics, R.R. The use of partial least squares path modeling in international marketing. In New Challenges to International Marketing; Emerald Group Publishing Limited: Bingley, UK, 2009; pp. 277–319. [Google Scholar] [Green Version]
  110. Roldán, J.L.; Cepeda, G. Modelos de Ecuaciones Estructurales basados en la Varianza: Partial Least Squares (PLS) para Investigadores en Ciencias Sociales; Universidad de Sevilla: Sevilla, Spain, 2016. [Google Scholar]
  111. Hair, J.F.; Hult, G.T.; Ringle, C.M.; Sarstedt, M.; Castillo-Apraiz, J.; Cepeda Carrion, G.; Roldán, J.L. Manual de Partial Least Squares Structural Equation Modeling (pls-sem); OmniaScience: Terrassa, Barcelona, Spain, 2019. [Google Scholar]
  112. Marcoulides, G.A.; Chin, W.W.; Saunders, C. A critical look at partial least squares modeling. MIS Q. 2009, 33, 171–175. [Google Scholar] [CrossRef]
  113. Richter, N.; Cepeda-Carrión, G.; Roldán Salgueiro, J.L.; Ringle, C.M. European management research using partial least squares structural equation modeling (PLS-SEM). Eur. Manag. J. 2016, 34, 589–597. [Google Scholar] [CrossRef]
  114. Chin, W.W.; Dibbern, J. Handbook of Partial Least Squares; Springer: Berlin, Germany, 2010. [Google Scholar]
  115. Ringle, C.; Wende, S.; Becker, J. SmartPLS—Statistical Software for Structural Equation Modeling. In Handbook of Market Research; Homburg, C., Klarmann, M., Vomberg, A., Eds.; Springer International Publishing: Cham, Switzerland, 2017. [Google Scholar]
  116. Wold, H. Systems Analysis by Partial Least Squares. In Measuring the Unmeasurable; Nijkamp, P., Leitner, H., Wrigley, N., Eds.; Kluwer Academic Publisher: Dordrecht, The Netherlands, 1985; pp. 221–251. [Google Scholar] [Green Version]
  117. Hair, J.F.; Ringle, C.M.; Sarstedt, M. PLS-SEM: Indeed a Silver Bullet. J. Mark. Theory Pract. 2011, 19, 139–152. [Google Scholar] [CrossRef]
  118. Gliem, J.A.; Gliem, R.R. Calculating, Interpreting, and Reporting Cronbach’s Alpha Reliability Coefficient for Likert-Type Scales. In Proceedings of the 2003 Midwest Research to Practice Conference in Adult, Continuing, and Community Education, The Ohio State University, Columbus, 8–10 October 2003. [Google Scholar]
  119. Nunnally, J. Psychometric Methods; McGraw-Hill: New York, NY, USA, 1978. [Google Scholar]
  120. Chin, W.W. The partial least squares approach to structural equation modeling. Mod. Methods Bus. Res. 1998, 295, 295–336. [Google Scholar]
  121. Henseler, J.; Dijkstra, T.K.; Sarstedt, M.; Ringle, C.M.; Diamantopoulos, A.; Straub, D.W.; Ketchen, D.J.; Hair, J.F.; Hult, G.T.M.; Calantone, R.J. Common Beliefs and Reality About PLS: Comments on Rönkkö and Evermann (2013). Organ. Res. Methods 2014, 17, 182–209. [Google Scholar] [CrossRef]
  122. Nunnally, J.C.; Bernstein, I.H. Psychometric Theory (McGraw-Hill Series in Psychology); McGraw-Hill: New York, NY, USA, 1994. [Google Scholar]
  123. Nunnally, J.C.; Bernstein, I.H. The reliability of Reliability. In Psychometric Theory, 3rd ed.; McGraw-Hill: New York, NY, USA, 1994. [Google Scholar]
  124. Dijkstra, T.K.; Henseler, J. Consistent partial least squares path modeling. MIS Q. 2015, 39, 297–316. [Google Scholar] [CrossRef]
  125. Henseler, J.; Ringle, C.M.; Sarstedt, M. A new criterion for assessing discriminant validity in variance-based structural equation modeling. J. Acad. Mark. Sci. 2015, 43, 115–135. [Google Scholar] [CrossRef]
  126. Ringle, C.M.; Wende, S.; Will, A. Finite Mixture Partial Least Squares Analysis: Methodology and Numerical Examples. In Handbook of Partial Least Squares; Springer: Berlin/Heidelberg, Germany, 2010; pp. 195–218. [Google Scholar]
  127. Fornell, C.; Larcker, D.F. Evaluating Structural Equation Models with Unobservable Variables and Measurement Error. J. Mark. Res. (JMR) 1981, 18, 39–50. [Google Scholar] [CrossRef]
  128. Henseler, J.; Ringle, C.M.; Sarstedt, M. Testing measurement invariance of composites using partial least squares. Int. Mark. Rev. 2016, 33, 405–431. [Google Scholar] [CrossRef]
  129. Franke, G.; Sarstedt, M. Heuristics versus statistics in discriminant validity testing: A comparison of four procedures. Internet Res. 2019, 29, 430–447. [Google Scholar] [CrossRef]
  130. Henseler, J. Bridging Design and Behavioral Research with Variance-Based Structural Equation Modeling. J. Advert. 2017, 46, 178–192. [Google Scholar] [CrossRef]
  131. Sarstedt, M.; Cheah, J.-H. Partial least squares structural equation modeling using SmartPLS: a software review. J. Mark. Anal. 2019, 7, 196–202. [Google Scholar] [CrossRef]
  132. Urbach, N.; Ahlemann, F. Structural Equation Modeling in Information Systems Research Using Partial Least Squares. J. Clean. Prod. Inf. Technol. Theory Appl. 2010, 11, 5–40. [Google Scholar]
  133. Hair, J.F.; Sarstedt, M.; Hopkins, L.; Kuppelwieser, V.G. Partial least squares structural equation modeling (PLS-SEM): An emerging tool in business research. Eur. Bus. Rev. 2014, 26, 106–121. [Google Scholar] [CrossRef]
  134. Cohen, J. Set Correlation and Contingency Tables. Appl. Psychol. Meas. 1988, 12, 425–434. [Google Scholar] [CrossRef]
  135. Henseler, J.; Hubona, G.; Ray, P.A. Using PLS path modeling in new technology research: Updated guidelines. Ind. Manag. Data Syst. 2016, 116, 2–20. [Google Scholar] [CrossRef]
  136. Hu, L.; Bentler, P.M. Cutoff criteria for fit indexes in covariance structure analysis: Conventional criteria versus new alternatives. Struct. Equ. Model. Multidiscip. J. 1999, 6, 1–55. [Google Scholar] [CrossRef]
  137. Hayes, A.F.; Scharkow, M. The Relative Trustworthiness of Inferential Tests of the Indirect Effect in Statistical Mediation Analysis. Psychol. Sci. 2013, 24, 1918–1927. [Google Scholar] [CrossRef]
  138. Carrión, G.C.; Nitzl, C.; Roldán, J.L. Mediation Analyses in Partial Least Squares Structural Equation Modeling: Guidelines and Empirical Examples. In Partial Least Squares Path Modeling; Springer International Publishing: Cham, Switzerland, 2017; pp. 173–195. [Google Scholar]
  139. Nitzl, C.; Roldan, J.L.; Cepeda, G. Mediation analysis in partial least squares path modeling. Ind. Manag. Data Syst. 2016, 116, 1849–1864. [Google Scholar] [CrossRef]
  140. Hair, J.J.; Hult, G.; Ringle, C.; Sarstedt, M. A Primer on Partial Least Squares Structural Equation Modeling (PLS-SEM); Sage publications: Thousand Oaks, CA, USA, 2016. [Google Scholar]
  141. Bontis, N.; Cabrita, M.D.R. Intellectual capital and business performance in the Portuguese banking industry Maria do Rosário Cabrita. Int. J. Technol. Manag. 2008, 43, 212–237. [Google Scholar]
  142. Teece, D.J. Dynamic Capabilities and Strategic Management: Organizing for Innovation and Growth; Oxford University Press: New York, NY, USA, 2009; ISBN 978-0-19-969190-6. [Google Scholar]
  143. Brink, T. Organising of dynamic proximities enables robustness, innovation and growth: The longitudinal case of small and medium-sized enterprises (SMEs) in food producing firm networks. Ind. Mark. Manag. 2018, 75, 66–79. [Google Scholar] [CrossRef]
  144. Laudal, T. Drivers and barriers of CSR and the size and internationalization of firms. Soc. Responsib. J. 2011, 7, 234–256. [Google Scholar] [CrossRef]
  145. Carroll, A. Corporate social responsibility: A review of current concepts, research, and issues. Corp. Soc. Responsib. 2018, 2, 39–69. [Google Scholar]
  146. Teece, D.J. Explicating Dynamic Capabilities: The Nature and Microfoundations of (Sustainabile) Enterprise Performance. Strategy Manag. J. 2007, 298, 1319–1350. [Google Scholar] [CrossRef]
  147. Aksoy, M.; Apak, S.; Eren, E.; Korkmaz, M. Analysis of the effect of organizational learning-based organizational culture on performance, job satisfaction and efficiency: A field study in banking sector. Int. J. Acad. Res. 2014, 6, 301–313. [Google Scholar] [CrossRef]
  148. Freeman, R.E.; Harrison, J.S.; Wicks, A.C.; Parmar, B.L.; de Colle, S. Stakeholder Theory: The State of the Art; Cambridge University Press: Cambridge, UK, 2010; ISBN 9781139484114. [Google Scholar]
  149. Yu, H.-C.; Kuo, L.; Kao, M.-F. The relationship between CSR disclosure and competitive advantage. Sustain. Account. Manag. Policy J. 2017, 8, 547–570. [Google Scholar] [CrossRef]
  150. Jain, A.; Leka, S.; Zwetsloot, G. Managing Health, Safety and Well-Being: Ethics, Responsibility and Sustainability; Springer: Berlin, Germany, 2018. [Google Scholar]
  151. Evans, M.; Dalkir, K.; Bidian, C. A holistic view of the knowledge life cycle: The knowledge management cycle (KMC) model. Electron. J. Knowl. Manag. 2014, 12, 85–97. [Google Scholar]
  152. Wood, D.J. Measuring corporate social performance: A review. Int. J. Manag. Rev. 2010, 12, 50–84. [Google Scholar] [CrossRef]
  153. Murillo, D.; Lozano, J.M. SMEs and CSR: An approach to CSR in their own words. J. Bus. Ethics 2006, 67, 227–240. [Google Scholar] [CrossRef]
Figure 1. Theoretical model (first- and second-order reflective).
Sustainability 11 05655 g001
Figure 2. Model of mediation effect.
Sustainability 11 05655 g002
Figure 3. Alternative Model 1 (first-order reflective). *: p < 0.05, **: p < 0.01, ***: p < 0.001.
Sustainability 11 05655 g003
Figure 4. Altervative Model 2 (first- and second-order reflective). *: p < 0.05, **: p < 0.01, ***: p < 0.001.
Sustainability 11 05655 g004
Table 1. Size and sector of the company.
CharacteristicMicroSmallMedium
Company size (number of employees)42 (1–10)189 (11–50)112 (51–250)
Total %12.2%55.1%32.7%
PrimarySecondaryTertiary
Business sector2122498
Total %6.1%65.3%28.6%
Source: Own elaboration.
Table 2. Total variance explained (extraction method: principal components analysis).
Initial Values Component Sums of the Square Saturations of the Extraction
ComponentTotal% of variance% accumulatedTotal% of variance% accumulated
19.09237.88537.8859.09237.88537.885
22.67711.15349.0382.67711.15349.038
31.5846.59955.6371.5846.59955.637
41.3855.77061.4071.3855.77061.407
51.1514.79466.2021.1514.79466.202
60.8953.72869.930
70.8653.60373.533
80.7343.05976.592
90.6472.69579.287
100.5732.38981.676
110.5472.28083.956
120.4721.96585.921
130.4471.86287.783
140.3941.64189.423
150.3761.56590.988
160.3401.41792.406
170.3001.25093.655
180.2781.16094.815
190.2400.99895.814
200.2350.98196.795
210.2240.93497.729
220.2080.86798.595
230.1870.78199.376
240.1500.624100.000
Source: Own elaboration.
Table 3. Correlation matrix.
Construct.ECRENRFPEOLESOR
ECR1.0000.6270.4770.5270.674
ENR0.6271.0000.3460.4430.635
FPE0.4770.3461.0000.5050.407
OLE0.5270.4430.5051.0000.627
SOR0.6740.6350.4070.6271.000
Source: Own elaboration. ECR (economic responsibility), ENR (environmental responsibility), FPE (financial performance), OLE (organizational learning), SOR (social responsibility).
Table 4. Reliability and validity by construct.
LFCRCA
Organizational Learning (OLE) (First order) 0.9330.914
The OLE is key to the competitive advantage0.812 ***
The business philosophy is based on continuous OLE0.845 ***
Constantly search for information and knowledge0.801 ***
Employees have acquired skills and abilities0.839 ***
It has transformed knowledge into an added value0.857 ***
Organizational performance is the product of the OLE0.867 ***
Corporate Social Responsibility (CSR) (Second order) 0.9230.920
SOR (Social Responsibility) 0.9060.862
It favors the hiring of people at risk of social exclusion0.741 ***
Value the contribution of disabled people0.711 ***
It deals with improving the quality of life of employees0.820 ***
Pay salaries above the industry average0.768 ***
ECR (Economic Responsibility) 0.8460.758
Offer customers complete information about our products0.800 ***
Respecting the rights of consumers is a priority0.832 ***
Have socially responsible suppliers0.903 ***
It promotes commercial relations with companies in the region0.827 ***
ENR (Environmental Responsibility) 0.9280.902
Use of consumables with low environmental impact0.834 ***
Save and monitor energy efficiency0.822 ***
Value the introduction of alternative energies0.813 ***
Perform environmental control and protection activities0.839 ***
Plan its finances based on the reduction of environmental impact0.872 ***
Financial Performance (FPE) (First order)LF0.9100.877
Increase in profits0.745 ***
Sales increase0.813 ***
Increase in contribution margin0.820 ***
Increase in market share0.847 ***
Increase in pre-tax benefits0.858 ***
Source: Own elaboration. LF, load factor; CR, composite reliability; CA, Cronbach’s alpha; *: p < 0.05, **: p < 0.01, ***: p < 0.001.
Table 5. Discriminant validity of the theoretical model.
ConstructAVEOLECSRFPE
OLE0.7010.837
CSR0.5140.6060.717
FPE0.6960.5050.4620.834
Source: Own elaboration. OLE: organizational learning, CSR: corporate social responsibility, FPE: financial profitability.
Table 6. Discriminant validity of the theoretical model (HTMT).
ConstructOLECSR
CSR0.649
FPE0.5680.516
Source: Own elaboration. OLE: organizational learning; CSR: corporate social responsibility; FPE: financial performance. All values are below 0.9.
Table 7. Hypothesis test results.
HypothesisBeta/Path CoefficientsT ScoreStandard DeviationP ValueF2Accepted/Rejected
H1. OLE- > CSR0.606 ***12.5780.0480.0000.580Accepted
H2. OLE- > FPE0.361 ***6.2550.0580.0000.115Accepted
H3. CSR- > RF0.245 ***4.0630.0600.0000.055Accepted
Source: Own elaboration. *: p < 0.05, **: p < 0.01, ***: p < 0. 001. OLE: organizational learning; CSR: corporate social responsibility; FPE: financial performance.
Table 8. Percentile CI/bias corrected CI.
HypothesisBeta/Path CoefficientsPercentile CI 5.0%Percentile CI 95.0%Bias Corrected CI 5.0%Bias Corrected CI 95.0%
H1. OLE- > CSR0.606 ***0.5250.6910.5260.686
H2. OLE- > FPE0.361 ***0.2680.4580.2660.459
H3. CSR- > RF0.245 ***0.1360.3410.1410.338
Source: Own elaboration, n = 5000 subsamples, *: p < 0.05, **: p < 0.01, ***: p < 0. 001. Note: The values of the percentile intervals (CI) and corrected bias (CI) do not have the value of 0.
Table 9. Predictive quality and model adjustment.
DimensionR2Q2SRMRRMStheta
CSR0.3650.3540.0990.139
FPE0.3000.283
Source: Own elaboration.
Table 10. Mediation effect.
CoefficientBooststrap 90% CI
Percentile CIBias Corrected CI
Direct effects
H1: c0.245sig0.1360.3410.1400.144
a10.606sig0.5250.6870.5230.520
b20.361sig0.2630.4600.2640.265
Indirect effectsPoint estimatePercentileBCVAF
H2: a1 x b10.219 sig0.1980.6710.1870.17647.17%
Total indirect effect0.219sig
Total effect0.464 sig
Source: Own elaboration.

