Measuring Environmental Efficiency through the Lens of Technology Heterogeneity: A Comparative Study between China and the G20

1
School of Economics and Management, University of Science and Technology Beijing, Beijing 100083, China
2
School of Marxism Studies, University of Science and Technology Beijing, 100083, Beijing, China
3
Waterloo Institute of Sustainable Energy, University ofWaterloo, 200 University Avenue West, Waterloo, ON, N2L 3G1, Canada
*
Author to whom correspondence should be addressed.
Sustainability 2019, 11(2), 461; https://doi.org/10.3390/su11020461
Submission received: 26 November 2018
/
Revised: 8 January 2019
/
Accepted: 11 January 2019
/
Published: 16 January 2019
Abstract
:Drawing on a perspective of technology heterogeneity, this study advances the analytical framework for evaluation of environmental efficiency (EE) across diverse economies. To improve the continuity and robustness of efficiency estimation, we construct a Hybrid Malmquist–Luenberger index under the meta-frontier (MHML) technique to allow a dynamic evaluation of environmental efficiency and to probe the underlying sources of inefficiency. Decomposition of the MHML index into component factors of efficiency change (EC), Best Practice Change (BPC) and Technological Gap Change (TPC) allows an improved understanding of causality and enhanced guidance for decision-making units (DMUs). Empirical tests based on panel data of the Group 20 countries spanning 2000–2014 reveal an upward improving trend in environmental efficiency but is also characterized by notable evidence of technological heterogeneity. Whereas technical progress was the main cause of environmental efficiency improvements in the G20 countries, for the BRICS (i.e., Brazil, Russia, India, China, South Africa), economic growth rates played a more significant in contrast to the role of technical change and allocation efficiency. The lagging growth rates of environmental efficiency for the G20 countries compared to the BRICS is a reflection of the fact that room for optimization in G20 countries was not as high as it was for BRICS and, China, in particular. China has been catching up with frontier technology whereas developing countries were shifting away from benchmark technology frontier. The developed economies remain the best performers and leaders in environmental technology. However, the BRICS countries, represented by China, remain on an upward trajectory of improvements’ in EE with gains from managerial sufficiency and technological advancement. The MHML index developed here provides a robust quantitative measure for policy interventions to support overall national environmental performance. Context-specific suggestions are proposed to foster efficiency gains and green transition for Chinese development scenarios against best performing economies.
1. Introduction
As the largest emerging economy in the world, China is suffering from an unacceptable level ecological deterioration and environmental challenges arising from unbridled economic growth with minimal attention given to conformance with environmental standards. Fortunately, growing awareness of ecological harm and a desire for inclusive growth is now shaping the policy agenda at the government and societal levels. Implementation of a series of national strategies and blueprints, including the “ecological civilization” goal, the green development policy, and the construction of beautiful China, has evolved into a new paradigm for environmental governance of the country. However, important challenges remain. According to the report of “Environmental Performance Index: 2016” issued by the Yale Center for Environmental Law and Policy, China ranked 109 among 180 sample countries with a score of 65.1 in terms of total environmental index and was the second last from the bottom in the dimension of air quality [1]. Against this background, there is a compelling need to understand in detail how to measure environmental efficiency by assessing efficiency gaps between China and major global economies and identifying various enhancement pathways of efficiency gains. In this study, we have selected a large group of countries representing a level of technological heterogeneity—with reasonable social and economic diversity. A comparative analysis is critical for understanding how China can formulate its own specific plans to achieve a green economy that is inclusive and meets the UN Sustainable Development Goals (SDGs) for future development.
Environmental efficiency (EE) is a concept of efficiency related to environmental performance, indicating how much an organization increases desirable production (e.g., economic growth) measured against reduction of undesirable impacts (e.g., carbon emissions and environmental pollutions), taking into account resource availability, climate change, ecological deterioration, and stringent environmental regulation [2]. In other words, both the economic and the environmental factors of production activities are taken into account for such efficiency measurement [3]. It is necessary to take into full account undesirable outputs, such as waste and emissions, when measuring EE [4]. Accordingly, evaluation of environmental efficiency becomes an important indicator that covers dimensions of economic growth, resource conservation, and environmental impact [5]. The indicator also serves as an effective guidance for decision-makers to manage a wide range environmental issues [6].
2. Literature Review
Evaluation on environmental efficiency originated from the time when energy constraints and pollutions embedded in production activities were noticed in the 1970s–1980s. Based on the evaluations and projections, early researchers proposed energy and environmental policy suggestions accordingly [7]. Over several decades, such an efficiency index has been developed from various perspectives on different levels, and the studies comprise a niche research field and a thematic area of academic study.
For example, Vlontzos employed a non-radial Data Envelopment Analysis (DEA) model to calculate energy and environmental efficiency scores of European Union (EU) economies by incorporating energy inputs and bad outputs generated from production activities [8]. Kounetas used the directional distance function which treats CO2 as undesirable to evaluate environmental efficiency technology gaps in 25 European countries [9]. Zhang et al. incorporated both GDP (i.e., gross domestic production) as a desirable output and pollutions as unexpected outputs to estimate the environmental efficiency of 30 provinces/cities in China using the slack-based measure (SBM) [10]. Ewertowska et al. tested the environmental efficiency of electricity mix of the top European economies with the help of the primal DEA [11]; Ma et al. incorporated haze as the bad output when measuring the environmental efficiency of China using the slack-based measure (SBM) technique of DEA [5]; Chen et al. also used the SBM model considering undesirable output to observe environmental efficiency of different regions in China [12]; Sanz-Díaz et al. combined DEA and Malmquist Index to make a comparative analysis of the dynamic environmental efficiency in the EU-28 countries, and greenhouse gas (GHG) emissions are incorporated as undesirable outputs along with one positive output of real GDP in the study [13]. Song et al. constructed an undesirable-DEA model to monitor the resource and environmental efficiency of China with electricity consumption and gross fixed social assets taken as input indexes, discharges of exhaust gas, waste water, and solid waste selected as undesirable output indexes and the total output value identified as the desirable output index [14]. Halkos et al. utilized directional distance function to deal with pollution factors when measuring the EE of the waste sector in 28 EU economics [15].
Collectively, for the estimation approach, single factor analysis has been gradually expended to multi-factor estimation. For the evaluation framework, pollutions related to economic activities are considered in the analyses process. For the analytical perspective, static efficiency evaluation has been gradually enriched by dynamic analysis, and in addition, the analytical techniques, DEA-based techniques, such as slack-based Luenberger index and directional distance function, have become a major approaches for efficiency estimation, although hybrid measures are rarely used regarding the topic so far. With respect to size and scope of studies within a research sample, economies within similar income-categories such as the EU countries are common observations for cross-country comparison, whereas multi-level samples are rarely used in the research. A fundamental challenge to our understanding of the causative factors influencing environmental efficiency arise from our inability to develop robust estimate across countries that show the influence of deep heterogeneity based on countries’ economic level, cultural background, social structures, resource endowment, and the bio-physical ecological environment. In-depth studies of comparisons on multi-level economies are scarce in the literature. To the best of our knowledge, studies on environmental efficiency comparisons based on the group 20 (G20) countries are relatively rare.
In this paper, we develop a new framework to estimate total factor environmental efficiency at the national level by combining a hybrid model and the meta-frontier technique from a dynamic perspective that is different from previous studies. We also attempt to measure efficiency gap and underlying determinants of efficiency loss by taking technology heterogeneity across countries into account. Driving factors of efficiency gains that are rated and discussed include: the role of innovation and its impacts (i.e., innovation effect, leading effect, and lagging effect (i.e., catch-up effect). These factors are incorporated in the analysis context-specific suggestions related to countries with divergent background.
The major contribution of the paper is introduction of an improved approach for measuring environmental efficiency across diverse economies allowing valid comparisons between the G20 countries and BRICS (i.e. Brazil, Russia, India, China, and South Africa). In a decomposition analysis of critical factors, we are able to obtain unbiased results for decision-making support. Furthermore, the method and evaluation framework are also applicable for similar cases, especially when dealing with EE comparison among decision-making units (DMUs) with divergent background. The remainder of this paper is organized as follows. Section 2 presents models, variables, and research sample used in the paper. Section 3 describes the empirical analyses and discusses outcomes of the tests. Section 4 demonstrates major conclusions of the study and specific suggestions for policy guidance to further enhance environmental efficiency gains in China.
3. Models and Variables
3.1. Model Construction
Efficiency level can be tested with the help of other techniques such as SFA (i.e., stochastic frontier analysis). However, In SFA or translog function, a restrict production function, random shock, and error measurements need to be decided in advance [16,17,18]. However, it cannot always be correct with respect to subjective perception [13]. Furthermore, determining the specific error structure is also a difficulty in the implement of SFA [19].
Comparatively, Data Envelopment Analysis is a non-parameter approach that can handles multiple inputs and outputs easily and doesn’t require many data points [3,20]. The efficiencies of DMUs can be measured without assuming any functional form of a representation of the production frontier [21]. It also avoids the shortcoming of subjective estimates when setting weights in the traditional efficiency evaluation method [22]. In accordance, DEA has gained popularity in environmental efficiency evaluations [23].
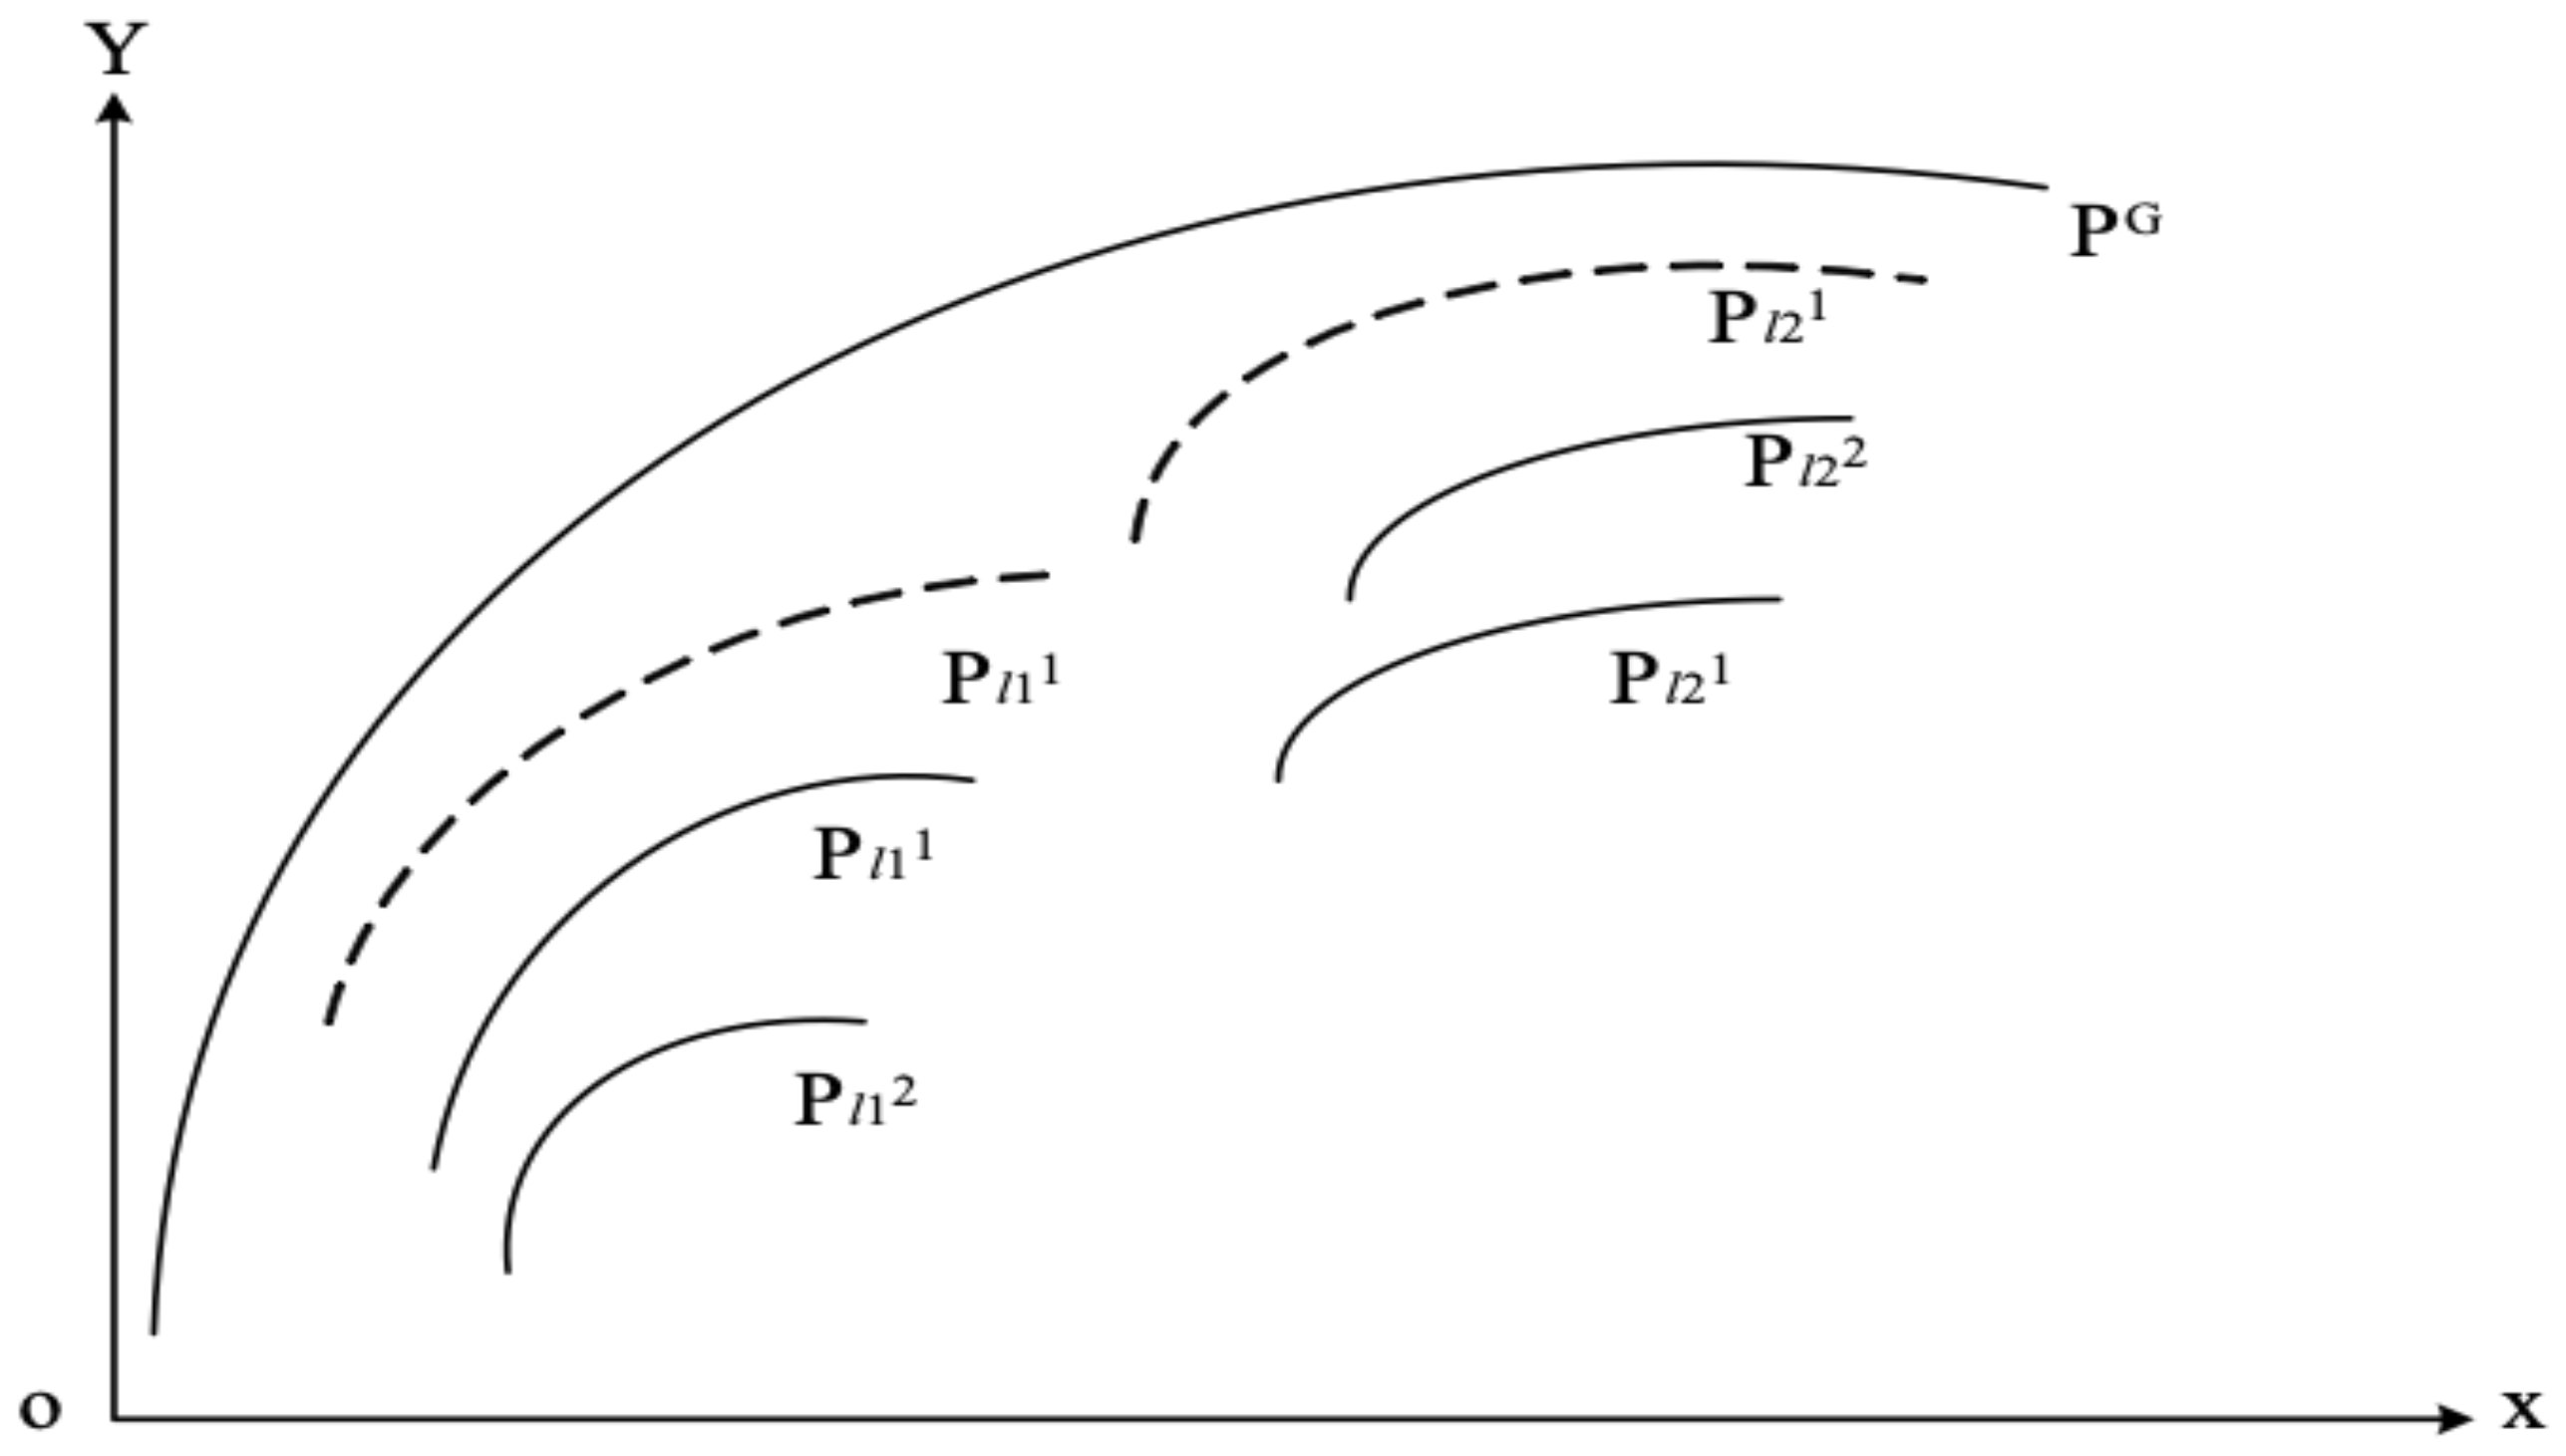
Therefore, this study employees the Malmquist–Luenberger index, a total factor analysis tool that draws on the DEA technique, to estimate dynamic environmental efficiency. However, the DMUs are considered homogeneous in traditional ML indexes. Neglecting the heterogeneity of different observations will result in biased efficiency estimation especially for the analyses at the macro-level, for example, influence of national policy makers and divergence across economies with varying levels of control. Accordingly, the meta-frontier technique can be utilized to tackle the issue of significant differences that arise at the macro level DMU. This technique provides a useful method to explain causes of inefficiency. If N kinds of inputs () are used to generate M types of outputs () and DMUs can be categorized into L groups (), then three sub-production technical sets are formed accordingly. A contemporaneous benchmark technology of group l is defined as , an intertemporal benchmark technology of group l is defined as , and global benchmark technology of all groups is defined as ). These three sets are used to reflect different envelops including production frontier of group l in time t, group l in full time period, and all groups in full time period [24].
Figure 1 demonstrates a case for two time periods and two groups of the concept of the meta-frontier M index. The superscript and the subscript on P represent the time period and the group, respectively. The interior solid lines represent contemporaneous technologies. The interior broken lines and the interior thick solid line represent intertemporal technologies and global technology, respectively. Contemporaneous benchmark technologies of group l are enveloped by its intertemporal benchmark technology envelopes its. All the intertemporal benchmark technologies are enveloped by the global benchmark technology [24].
In order to address certain constraints of radial and non-radial models of DEA and improve the continuity and robustness of dynamic efficiency estimation, this study constructs a Hybrid Malmquist–Luenberger index under the meta-frontier (MHML) to evaluate environmental efficiency. In so doing, the Hybrid Measure proposed by Tone et al. [25] and the global Malmquist–Luenberger technique [24] are combined to obtain the MHML index. For a given DMU, its total factor environmental efficiency can be obtained using the equations listed below:
where, and represents the order of DMUs and time period, respectively. In addition, indicate the radial input, non-radial input, radial expected output, radial undesirable output, and non-radial undesirable output of a given DMU, respectively. MHML reflects the degrees of efficiency change of an economy. Enhancement and improvement of environmental efficiency appears over time if MHML>1, efficiency level stays unchanged if MHML=1, and efficiency level decreases and being away from best frontier over time if MHML<1. MHML index can be further decomposed into Efficiency Change (EC), Best Practice Change (BPC), and Technological Gap Change (TGC) by referencing the study of Oh & Lee [24]:
Equation (3) reveals three factors that explain the change of environmental efficiency, and I and G stand for “intertemporal” and “global”, respectively.
Efficiency change (EC) depicts the change of technical efficiency and is considered a critical indicator for allocative efficiency. This indicator is also used to reflect managerial capability and institutional advantages. The allocative efficiency of a given DMU improves, remains unchanged, and drops over time if EC > 1, EC = 1, and EC < 1, respectively.
Best practice change (BPC) describes the change of technology progress. The technical level of a given DMU improves, remains unchanged, and regress over time if BPC > 1, BPC = 1, and BPC < 1, respectively.
Technical gap change (TGC) reflects the change of technology gaps and is used to measure the distance between a given DMU and the meta-frontier. The environmental efficiency of a given DMU is approaching towards the global best frontier if TGC > 1. A given DMU is on the best frontier and can be identified as a “leader” if it’s TGC = 1. The efficiency of a given DMU is drifting away from the meta-frontier over time if TGC < 1.
3.2. Sample and Variables
The structure of global governance has changed over the last two decades with the Group 20 countries (G20) become significant player. Moreover, aggregate influence of the G20 is significant worldwide in terms of total population, aggregate GDP, energy consumption, and carbon emissions [26]. As such, this study takes the G20 countries as the research sample and substitutes the Europe Union (EU) in the group with the permanent guest Spain by referencing a study of Lee [27]. In so doing, 20 independent economies are selected to form the group including Argentina (ARG), Australia (AUS), Brazil (BRA), Canada (CAN), China (CHN), France (FRA), Germany (DEU), India (IND), Indonesia (IDN), Italy (ITA), Japan (JAP), Mexico (MEX), Russia (RUS), Saudi Arabia (SAU), South Africa (ZAF), South Korea (KOR), Spain (ESP), Turkey (TUR), the United Kingdom (GBR), and the United States (USA).
Variables for efficiency measurement and data sources are identified by referencing related studies and the research design of the study [13,28].
3.2.1. Input variables
Variables are selected from the dimensions of capital, labor, and resource consumption. Capital stock is calculated using the perpetual inventory method with the base year of 1990 by referencing the study of Wei et al. [29], and is considered non-radial input. Different depletion rates are set according to the income-level of the countries. Method for the capital stock of the base year and settings for the related parameters are adopted by referencing the studies of King and Levien and Easterly et al., respectively [30,31]. Labor input is measured as number of employees for a given year of a country and is identified as non-radial input. Resource input is depicted by primary energy consumption to reflect the aggregate consumption of energy source in a country. Primary energy consumption is set as radial input variable.
3.2.2. Output variables
Outputs of environmental efficiency are chosen from the perspective of economic benefits and environmental impacts. The economic returns are indicated by real GDP value deflated with the rates of purchasing power parity (PPP). The environmental impacts are measured with the greenhouse gas (GHG) emissions of countries by referencing the studies of Sanz-Díaz et al. [13] and Moutinho et al. [32]. This variable is also set as radial undesirable output in the study.
Data for the 20 countries spanning 2000–2014 are collected from reliable sources including the World Bank database, the Penn World Table 9.0 (PWT), the British Petroleum (BP) Statistical Review of World Energy, and the World Resources Institute (WRI). Table 1 presents the data source, attributes, and statistical description of selected variables.
4. Empirical Test
For group division, the 20 countries are clustered into advanced-country group and developing-country group according to their income levels by referencing the study of Chiu et al. [33]. However, considering that the BRICS countries (i.e., Brazil, Russia, India, China, and South Africa) has been accounted for a large share of energy consumption and environmental impacts with high economic growth rates, such countries are also increasingly critical players in the world. As such, the BRICS is separated from other developing countries for form a new sub-group in the study, the advanced group is consisted of Australia (AUS), Canada (CAN), France (FRA), Germany (DEU), Italy (ITA), Japan (JAP), South Korea (KOR), Spain (ESP), the United Kingdom (GBR), and the United States (USA), and the developing group includes Argentina (ARG), Indonesia (IDN), Saudi Arabia (SAU), Mexico (MEX), and Turkey (TUR).
Equations 1-3 are further utilized to conduct empirical tests based on the panel data of the 20 countries during 2000-2014. Dynamic environmental efficiency and its decompositions depicted as MHML index, efficiency change (EC), best practice change (BPC), and technology gap change (TGC) are obtained, respectively. Table 2 presents the average mean of MHML, EC, BPC, and TGC of the countries as well as the groups during the observation period.
Results obtained from Table 2 illustrate that:
For group environmental efficiency indicated by MHML, the efficiency level of G20 under the meta-frontier was greater than 1, indicating that efficiency level in general has improved over time as environmental awareness has increased substantially in many countries all over the world. Encouraging outcomes include a significant focus on environmental governance and administrative protocols and formal international standards and legal stipulations embedded in trade agreements. Enhancement of environmental efficiency also appeared for the three sub-groups during the observation period. Among others, efficiency improvement for the BRICS was the most significant, followed by the group of advanced economics and the developing countries. This outcome confirms efforts regarding green growth undertaken by governments and societal groups such as NGOs (i.e., Non-governmental organizations) in the BRICS countries over the past years.
For individual countries of the G20, China experienced the most significant improvement in efficiency gains among others with a yearly growth rate of 13.7%. This accomplish is achieved due to commitments made by the Chinese government to boost the country’s green transformation and industrial upgrade. Specifically, China has realized and acknowledged that environment protection and biodiversity conservation is key to achieving sustainable development over the last two decades. Attempts to increase awareness, provide policy guidance, establish necessary regulations, and enact new legislation to promote energy conservation and emission reduction have been undertaken at various levels in the country. Especially after the period of the 11th five-year plan, the Scientific Development Concept, Two-Oriented Society Construction, Construction of Ecological Civilization, and Green Growth Strategy have been extensively promoted across the country. Concrete goals and specific targets have been set and are monitored through consultations in all regions and for all industry sectors. The goal is to put the strategies into practice. Progress on achieving a green transformation of the economy is work that will need to continue with emphasis but results of this study suggest a positive upward trend. One example is illustrative: according to the statistics of the International Energy Agency, China’s coal consumption and carbon dioxide emissions from energy use both decreased in 2014 for the first time since 1999, leading to a 0.2 percent reduction in global emissions [34].
As can be seen from the results of efficiency change (EC), slight development in EC was observed in the period for the G20 with an average growth rate of 0.5%. This outcome reveals that allocative efficiency has been improved to a certain extent arising from the enhancement in management and system construction of environmental governance. Results obtained for the sub-groups demonstrates that achievements in EC was the highest in the group of the BRICS with a yearly growth rate of 1.1%, followed by the group of advanced economies. Conversely, value of EC in the developing group declined during the observation period, reflecting insufficient focus on environmental management capability. For the individual countries, efficiency change improved greatly for Russia and India with the growth rates of 3% and 2.7%, respectively. According to the analysis, catching-up effects in efficiency have appeared in these two countries. In contrast, allocative efficiency of China stayed unchanged during the observation period as the average mean of EC was equal to 1.
In terms of BPC, technology progress was achieved for the G20 in general as the yearly growth rate of the group reached 4.1%. This outcome reveals that technology innovation and expansion, especially industrial application and innovations on green and clean techniques, has contributed greatly to efficiency gains of the countries. For the sub-groups, positive effects of technical progress was significant in the BRICS countries with a yearly growth rate of 5%, followed by the developing countries and the advanced economies with the yearly growth rates of 4.2% and 3.0%, respectively. For the individual countries, innovation effect of China was the largest among others with a yearly BPC growth rate of 9.9% and played an important role in accelerating efficiency improvement.
In terms of TGC, technical gaps were unneglectable across countries as the yearly TGR was lower than 1, confirming the effectiveness and necessity of taking into account the heterogeneity of efficiency estimation for these economies. For the sub-groups, values of TGC for most advanced economies were equal to 1, demonstrating the leading effect of developed countries regarding environmental technology. Such advantages make the countries the leaders and benchmarks of clean-tech compared to the rest of the world. The average mean of TGC was higher than 1, illustrating that the BRICS countries are moving towards the best level of global environmental technology. Technical gaps between the advanced and the emerging economies are narrowing down over time. Nevertheless, average mean of TGC of the developing countries was lower than 1, illustrating that the technical gap between developing countries and the best frontier of the G20 was widening over time. This outcome reveals the challenges and difficulties faced by the developing countries represented by Argentina in terms of environmental technology development. For individual countries, China continues its trajectory towards approaching the best technique frontier with a yearly growth rate of 3.5%. In comparison with advanced economies, the technical differences reveal a declining trend.
5. Conclusions and Suggestions
5.1. Conclusion
This study estimates and decomposes dynamic environmental efficiency by combining the Hybrid Measure, Malmquist–Luenburger index, and meta-frontier analysis. Empirical analyses based on panel data of the G20 countries demonstrates that:
- (i)
- Environmental efficiency has continually improved for the G20 countries for the period 2000–2014. A robust conclusion to be drawn is that, economic growth, resource conservation, and pollution reduction can be achieved simultaneously and a positive trend of green growth is clearly evident. Allocative efficiency was enhanced, thus contributing to the efficiency gains. Improvement in environmental efficiency of the G20 was mainly caused by technical progress although we note technical heterogeneity across countries is also evident.
- (ii)
- For the G20 advanced group, although its overall environmental efficiency increased during the period, its growth rate only ranked second after the BRICS group. This phenomenon is well recognized as most developed countries’ efficiency was already in a leading position, leaving less room for optimization. Moreover, “dual-wheel driving” becomes evident when the efficiency gains have been boosted by both managerial sufficiency and technology advancement. The clean-tech sector of advanced countries has been holding the best frontier and the leading position globally, and thus the advanced group within G20 is are considered benchmarks for all the countries.
- (iii)
- For the BRICS, its environmental efficiency improved remarkably with the highest growth rates during the observation period. This outcome reflects the conscious efforts of government agencies and implementation of good practices of environmental protection in these countries. This is a positive indication that along with the economic expansion, environmental efficiency can also be enhanced. Furthermore, we note a double dividend: improvements in allocative efficiency and technology progress were also achieved in the group. Compared to managerial improvement, contribution of technical innovation plays a more important role in facilitating efficiency gains.
- (iv)
- For the developing group, its environmental efficiency increased, yet the growth rate was the lowest among other groups. This result suggests that the developing countries still have a very large potentials for efficiency gains by balancing the development of economic prosperity, recourse depletion, and environmental protection. Moreover, efficiency gains of the countries were essentially attribute to technology progress as opposed to efficiency gains in allocative. This outcome reveals the challenges and insufficiency of environmental administration in the countries. Moreover, the group was drifting away from the G20′s best technique level over time, which also raises concerns regarding technique deterioration in the countries.
- (v)
- For China, incentives in support of environmental efficiency goals was the most significant, reflecting the progress made by China as it promotes green and conclusive growth. The efficiency gains were mainly attribute to technical progress, and the gap between China and the world most advanced level was narrowing over time. This finding is also in line with the conclusions in the study conducted by Yuan et al. [35]. It is still unneglectable that the allocative efficiency hasn’t contributed to efficiency gains of the country yet. Therefore, attentions regarding construction of environmental governance capability and system should also be paid to facilitate efficiency improvement along with the promotion of technology development.
5.2. Suggestions
Context-specific suggestions are proposed for China based on the analytical results and discussions to foster green and inclusive growth for long term sustainability.
First, technological innovation for environmental sustainability needs to should be further promoted to strengthen the positive effects of technology progress in efficiency gains. As one of the most critical paths to addressing the challenges of economic growth, energy crisis, and climate change, the importance of environmental technology’s (also known as clean technology or green technology) role has been fully acknowledged worldwide. Expansion, utilization, and development of such technologies are even more critical for China with low per-capita quantity of resources, unbalanced distribution of fossil fuels, and serious ecological deterioration and environmental pollution. As can be seen from the results of comparison, technical progress has been a major contributor to the efficiency enhancement of the country. Despite the achievements made so far, certain issues are still needing to be addressed to further release the potential of technology development in China. Specifically, unbalanced distribution of clean-tech research and development resource should be adjusted from a holistic view. In addition, market approaches to enhance the flexibility and diversity of clean-tech investment should be promoted by increasing the leveraging effects of appropriate policies. More importantly, R&D (i.e., research and development), especially the application of appropriate techniques used in divergent regions and industries should be emphasized to increase the efficiency and effectiveness of clean-tech.
Second, environmental governance system should be further improved to enhance managerial efficiency and the catching-up effect. Monitoring and fulfillment over time of the environmental policy is effective in achieving the technological progress [13]. Acceleration of internationalization, urbanization, industrialization, and household consumption have all contributed to weakening the efforts made for environment protection by the Chinese government in the period of the 11th and 12th five-year plans. This implies that government should adhere to the line of implementing policies that accelerate the production and application of green technology. Therefore, construction of ecological civilization should be set as a long-term strategy and a fundamental national policy. Accordingly, development of updated policies, regulations, standards, and administrative systems of environmental protection and ecological restoration is in great need to achieve green growth targets. Multi-level agencies and importance of multi-agent governance in the field is necessary for effective integration of high-level policies with implementation in the field.
Last but not least, environmental technical gaps should be further narrowed down. Although impressive technical progress has been made by China and many corporates have been identified as global leaders in certain fields, the technical level is still lagging for some industries and regions as a whole [36]. The most advanced techniques and top-tier patents in green industries are still owned by developed counties [37]. To further catch up with global technique frontier, technical roadmaps of advanced economies including the U.S., the U.K., and Japan should be referenced by considering the situation of China to boost breakthroughs of environmental field techniques. International and intra-industrial spillover effects should also be further amplified to boost green technology development. Moreover, research results transformation and application should be advocated to eliminate technical disparities across regions and sectors within the country to benefit efficiency gains and optimization on a macro level.
6. Future Studies
Future studies can be conducted in the following ways to expand the discussion. First, more countries in addition to the group 20 can be selected as research sample to get a bigger picture of global environmental efficiency status. Second, more driving factors, including scale change effect, structural change effect, and environmental regulation effect, can be incorporated into the discussion with the help of panel regression models to reveal determinants of efficiency gains. Third, in-depth case study on representative countries in terms of catching-up effect (i.e., chasers), leading effect (i.e., leaders in technology), and best practice effect (i.e., best practitioners) can be conducted to supplement the pure quantitative analyses.
Author Contributions
X.W. conceived of the research, undertook data analysis, and drafted the article. M.Z. contributed significantly to the research design and result interpretation. J.N. played important role in positioning, supervising, and peer-reviewing the article. F.Y. takes care of data collection, model processing, and paper editing.
Funding
The authors are grateful for the support provided by the National Natural Science Foundation (NSF) of China (71704010, 71771024, 71673022, 71602008, and 71320107006), the Science Foundation of Ministry of Education of China (17YJC630163), the Social Science Research Foundation of Beijing (17JDGLA010 and 18JDYJB021), and Fundamental Research Funds for the Central Universities (FRF-BD-18-008A and DUT18RC(3)034). Jatin Nathwani, Ontario Research Chair in Public Policy for Sustainable Energy at the University of Waterloo, acknowledges the assistance of the Ontario Council of Universities for the financial endowment of the Research Chair.
Conflicts of Interest
The authors declare no conflict of interest.
References
- Yale Center for Environmental Law & Policy. Environmental Performance Index: 2016 Report; Yale Center for Environmental Law & Policy: New Haven, CT, USA, 2016. [Google Scholar]
- Ramli, N.A.; Munisamy, S. Eco-efficiency in greenhouse emissions among manufacturing industries: A range adjusted measure. Econ. Model. 2015, 47, 219–227. [Google Scholar] [CrossRef]
- Song, M.; Wang, S.; Liu, W. A two-stage DEA approach for environmental efficiency measurement. Environ. Monit. Assess. 2014, 186, 3041–3051. [Google Scholar] [CrossRef]
- Ramanathan, R.; Ramanathan, U.; Zhang, Y. Linking operations, marketing and environmental capabilities and diversification to hotel performance: A data envelopment analysis approach. Int. J. Prod. Econ. 2016, 176, 111–122. [Google Scholar] [CrossRef] [Green Version]
- Ma, D.; He, F.; Li, G.; Chen, L. Estimation and Comparative Analysis of Environmental Efficiency in China, with and without Consideration of Haze. Pol. J. Environ. Stud. 2018, 27, 201–211. [Google Scholar] [CrossRef] [Green Version]
- Zhou, P.; Ang, B.W.; Poh, K.L. Measuring environmental performance under different environmental DEA technologies. Energy Econ. 2008, 30, 1–14. [Google Scholar] [CrossRef]
- Song, M.; An, Q.; Zhang, W.; Wang, Z.; Wu, J. Environmental efficiency evaluation based on data envelopment analysis: A review. Renew. Sust. Energy Rev. 2012, 16, 4465–4469. [Google Scholar] [CrossRef]
- Vlontzos, G.; Niavis, S.; Manos, B. A DEA approach for estimating the agricultural energy and environmental efficiency of EU countries. Renew. Sust. Energy Rev. 2014, 40, 91–96. [Google Scholar] [CrossRef]
- Kounetas, K. Heterogeneous technologies, strategic groups and environmental efficiency technology gaps for European countries. Energy Policy 2015, 83, 277–287. [Google Scholar] [CrossRef]
- Zhang, J.; Zeng, W.; Shi, H. Regional environmental efficiency in China: Analysis based on a regional slack-based measure with environmental undesirable outputs. Ecol. Indic. 2016, 71, 218–228. [Google Scholar] [CrossRef]
- Ewertowska, A.; Galán-Martín, A.; Guillén-Gosálbez, G.; Gavaldá, J.; Jiménez, L. Assessment of the environmental efficiency of the electricity mix of the top European economies via data envelopment analysis. J. Clean Prod. 2016, 116, 13–22. [Google Scholar] [CrossRef]
- Chen, L.; Jia, G. Environmental efficiency analysis of China’s regional industry: A data envelopment analysis (DEA) based approach. J. Clean. Prod. 2017, 142, 846–853. [Google Scholar] [CrossRef]
- Sanz-Díaz, M.T.; Velasco-Morente, F.; Yñiguez, R.; Íaz-Calleja, E. An analysis of Spain’s global and environmental efficiency from a European Union perspective. Energy Policy 2017, 104, 183–193. [Google Scholar] [CrossRef]
- Song, M.; Peng, J.; Wang, J.; Dong, L. Better resource management: An improved resource and environmental efficiency evaluation approach that considers undesirable outputs. Resour. Conserv. Recycl. 2018, 128, 197–205. [Google Scholar] [CrossRef]
- Halkos, G.; Petrou, K.N. Assessing 28 EU member states’ environmental efficiency in national waste generation with DEA. J. Clean Prod. 2019, 208, 509–521. [Google Scholar] [CrossRef]
- Aigner, D.; Lovell, C.K.; Schmidt, P. Formulation and estimation of stochastic frontier production function models. J. Econ. 1977, 6, 21–37. [Google Scholar] [CrossRef]
- Dyson, R.G.; Shale, E.A. Data envelopment analysis, operational research and uncertainty. J. Oper. Res. Soc. 2010, 61, 25–34. [Google Scholar] [CrossRef]
- Weyman-Jones, T.; Boucinha, J.M.; Inacio, C.F. Measuring electric energy efficiency in Portuguese households: A tool for energy policy. Manag. Environ. Qual. Int. J. 2015, 26, 407–422. [Google Scholar] [CrossRef]
- Zhang, F.; Fang, H.; Wu, J.; Ward, D. Environmental efficiency analysis of listed cement enterprises in China. Sustainability 2016, 8, 453. [Google Scholar] [CrossRef]
- Lee, T.; Yeo, G-T.; Thai, V.V. Environmental efficiency analysis of port cities: Slacks-based measure data envelopment analysis approach. Transp. Policy 2014, 33, 82–88. [Google Scholar] [CrossRef]
- Charnes, A.; Cooper, W.W.; Rhodes, E. Measuring the efficiency of decision making units. Eur. J. Oper. Res. 1978, 2, 429–444. [Google Scholar] [CrossRef]
- Wang, X.; Han, L.; Yin, L. Environmental Efficiency and Its Determinants for Manufacturing in China. Sustainability 2016, 9, 47. [Google Scholar] [CrossRef]
- Li, M.; Wang, Q. International environmental efficiency differences and their determinants. Energy 2014, 78, 411–420. [Google Scholar] [CrossRef]
- Oh, D.H. A global Malmquist–Luenberger productivity index. J. Prod. Anal. 2010, 34, 183–197. [Google Scholar] [CrossRef]
- Tone, K.; Tsutsui, M. Dealing with Undesirable Outputs in DEA: A Hybrid Measure of Efficiency Approach. In Proceedings of the 2006 Spring National Conference of Operations Research Society of Japan, Tokyo, Japan, April 2006; p. 34. [Google Scholar]
- United Nations Environment Programme (UNEP). Global Green New Deal: An Update for the G20 Pittsburgh Summit; UNEP: Pittsburgh, PA, USA, 2009. [Google Scholar]
- Lee, J.W. The contribution of foreign direct investment to clean energy use, carbon emissions and economic growth. Energy Policy 2013, 55, 483–489. [Google Scholar] [CrossRef]
- Zhang, Y.; Jin, P.; Feng, D. Does civil environmental protection force the growth of China’s industrial green productivity? Evidence from the perspective of rent-seeking. Ecol. Indic. 2015, 51, 215–227. [Google Scholar] [CrossRef]
- Wei, C.; Ni, J.L.; Sheng, M.H. China’s energy inefficiency: A cross-country comparison. Soc. Sci. J. 2011, 48, 478–488. [Google Scholar] [CrossRef]
- King, R.G.; Levine, R. Capital Fundamentalism, Economic Development, and Economic Growth. Carnegie-Rochester Conf. Ser. Public Policy 1994, 40, 259–292. [Google Scholar] [CrossRef]
- Easterly, W.; Kremer, M.; Pritchett, L.; Summers, L.H. Good policy or good luck? Country growth-performance and temporary shocks. J. Monet. Econ. 1993, 32, 459–483. [Google Scholar] [CrossRef]
- Moutinho, V.; Madaleno, M.; Robaina, M. The economic and environmental efficiency assessment in EU cross-country: Evidence from DEA and quantile regression approach. Ecol. Indic. 2017, 78, 85–97. [Google Scholar] [CrossRef]
- Chiu, C.R.; Liou, J.L.; Wu, P.I.; Fang, C.L. Decomposition of the environmental inefficiency of the meta-frontier with undesirable output. Energy Econ. 2012, 34, 1392–1399. [Google Scholar] [CrossRef]
- Van Der Hoeven, M. Energy and climate change—World energy outlook special report. International. Energy Agency (IEA), 2015; Energy Agency (IEA): France, Paris, 2015. [Google Scholar]
- Yuan, L.K.; Han, Q.F.; Xie, F.; Yin, Z.X. What kind of technological level of environmental field in China—Empirical evidence from technological competition investigation in environmental field. Sci. Technol. Prog. Policy 2016, 33, 50–58. [Google Scholar]
- Wei, C.; Zheng, X.Y. A new perspective on energy efficiency enhancement: A test based on market segmentation. Soc. Sci. China 2017, 10, 90–111. [Google Scholar]
- Luo, L.J.; Zhu, S.L.; Zou, Z.X. Key technical challenges of Chinese new energy strategy and its countermeasures. J. Quant. Tech. Econ. 2015, 2, 113–128. [Google Scholar]
Figure 1.
Concept of the metafrontier Malmquist productivity index (revised based on ref [24]).
Figure 1.
Concept of the metafrontier Malmquist productivity index (revised based on ref [24]).


Table 1.
Data source, attribute, and statistical description of variables
| Variable | Mean | SD | Min | Max | Unit | Attribute | Source |
|---|---|---|---|---|---|---|---|
| capital stock | 1694.60 | 1524.69 | 218.24 | 8707.01 | billion GK dollars | non-radial input | WB |
| employees | 100.20 | 182.71 | 6.10 | 798.37 | million people | non-radial input | PWT |
| energy consumption | 436.95 | 614.70 | 58.34 | 2970.60 | MTOE | radial input | BP |
| real GDP | 3070.90 | 3542.19 | 436.20 | 17406.24 | billion GK dollars | non-radial expected output | WB |
| GHG emissions | 1450.36 | 2156.77 | 263.98 | 11911.71 | MTOE | radial undesirable output | WRI |
Abbreviations: SD, GK, MTOE, GDP, GHG, WB, PWT, BP, WRI stand for Standard deviation, Geary-Khamis, Million tons of oil equivalent, Gross domestic production, Greenhouse gas, Word bank, Penn world table, British Petroleum, and World Resources Institute, respectively.
Table 2.
Average mean of Hybrid Malmquist–Luenberger index under the meta-frontier (MHML) and its decompositions of G20. Efficiency change (EC), Best Practice Change (BPC) and Technological Gap Change (TPC).
Table 2.
Average mean of Hybrid Malmquist–Luenberger index under the meta-frontier (MHML) and its decompositions of G20. Efficiency change (EC), Best Practice Change (BPC) and Technological Gap Change (TPC).
| country | MHML | EC | BPC | TGC | country | MHML | EC | BPC | TGC |
|---|---|---|---|---|---|---|---|---|---|
| AUS | 1.040 | 1.016 | 1.023 | 1.000 | BRA | 1.024 | 1.000 | 1.022 | 1.003 |
| CAN | 1.035 | 1.007 | 1.028 | 1.000 | CHN | 1.137 | 1.000 | 1.099 | 1.035 |
| DEU | 1.043 | 1.000 | 1.043 | 1.000 | IND | 1.070 | 1.027 | 1.039 | 1.003 |
| ESP | 1.037 | 1.012 | 1.025 | 1.000 | RUS | 1.049 | 1.030 | 1.038 | 0.980 |
| FRA | 1.040 | 1.000 | 1.040 | 1.000 | SAF | 1.037 | 1.000 | 1.051 | 0.987 |
| GBR | 1.053 | 1.025 | 1.027 | 1.000 | BRICS group | 1.063 | 1.011 | 1.050 | 1.002 |
| ITA | 1.017 | 1.000 | 1.004 | 1.013 | ARG | 1.021 | 1.000 | 1.054 | 0.969 |
| JAP | 1.025 | 0.999 | 1.026 | 1.000 | IDN | 1.075 | 1.000 | 1.066 | 1.008 |
| KOR | 1.057 | 1.025 | 1.031 | 1.000 | MEX | 1.013 | 0.971 | 1.050 | 0.994 |
| USA | 1.051 | 1.000 | 1.051 | 1.000 | SAU | 0.998 | 1.000 | 1.000 | 0.998 |
| Advanced group | 1.040 | 1.008 | 1.030 | 1.001 | TUR | 1.038 | 1.000 | 1.042 | 0.996 |
| G20 | 1.044 | 1.005 | 1.041 | 0.999 | Developing group | 1.029 | 0.994 | 1.042 | 0.993 |
Abbreviations: Australia (AUS), Canada (CAN), Germany (DEU), Spain (ESP), France (FRA), the United Kingdom (GBR), Italy (ITA), Japan (JAP), South Korea (KOR), the United States (USA), Brazil (BRA), China (CHN), India (IND), Russia (RUS), South Africa (SAF), Argentina (ARG), Indonesia (IDN), Mexico (MEX), Saudi Arabia (SAU), and Turkey(TUR).
© 2019 by the authors. Licensee MDPI, Basel, Switzerland. This article is an open access article distributed under the terms and conditions of the Creative Commons Attribution (CC BY) license (http://creativecommons.org/licenses/by/4.0/).
Share and Cite
MDPI and ACS Style
Wang, X.; Zhang, M.; Nathwani, J.; Yang, F. Measuring Environmental Efficiency through the Lens of Technology Heterogeneity: A Comparative Study between China and the G20. Sustainability 2019, 11, 461. https://doi.org/10.3390/su11020461
AMA Style
Wang X, Zhang M, Nathwani J, Yang F. Measuring Environmental Efficiency through the Lens of Technology Heterogeneity: A Comparative Study between China and the G20. Sustainability. 2019; 11(2):461. https://doi.org/10.3390/su11020461
Chicago/Turabian StyleWang, Xiaoling, Manyin Zhang, Jatin Nathwani, and Fangming Yang. 2019. "Measuring Environmental Efficiency through the Lens of Technology Heterogeneity: A Comparative Study between China and the G20" Sustainability 11, no. 2: 461. https://doi.org/10.3390/su11020461
Note that from the first issue of 2016, this journal uses article numbers instead of page numbers. See further details here.