Embodied Energy Flow Patterns of the Internal and External Industries of Manufacturing in China

1
School of Economic and Management, Dongguan University of Technology, Dongguan 523808, China
2
College of System Engineering, National University of Defense Technology, Changsha 410073, China
*
Author to whom correspondence should be addressed.
Sustainability 2019, 11(2), 438; https://doi.org/10.3390/su11020438
Submission received: 12 December 2018
/
Revised: 6 January 2019
/
Accepted: 10 January 2019
/
Published: 15 January 2019
Abstract
:The Sino–US trade war has prompted China to re-examine the development of manufacturing, while the energy crisis restricts such development. Scientifically planning industrial energy allocation is important for supporting industrial transformation and the upgrading of manufacturing. The embodied energy flow in China’s manufacturing was investigated by reconstructing the energy flow network; taking a systems perspective, a fine-grained analysis of the emerging patterns and evolution of these flows in the internal and external manufacturing industries was performed, thus providing useful insights for energy planning. The results show that in the internal and external networks of Chinese manufacturing, most of the embodied energy convergence and transmission is concentrated in a few industries Moreover, it is clear that industries with stronger embodied energy convergence and conductivity are generally more likely to be associated with industries with weak convergence and conductivity. Preferential selection is an important mechanism for the generation of embodied energy flow paths. The choices of the embodied energy flow paths of various industries exhibit the preference that ‘the rich get richer,’ and newly generated flow paths are more likely to be chosen for connectivity to a path of strong convergence or conductivity. The embodied energy flow patterns of the internal network of manufacturing mainly include two-focus and multi-focus convergence patterns, while that of the external network of manufacturing is mainly a two-focus transmission pattern. Within in-edge networks, communities of high-end manufacturing have gathered most of the embodied energy, while in out-edge networks, communities of traditional manufacturing have been key in the transmission of embodied energy. The impacts of the internal and external network types, and of the in-edge and out-edge types on the stability of the embodied energy flow pattern are separate, and the embodied energy flow pattern is stable. Based on these findings, an ‘energy-related industrial cluster’ model is proposed here to aid in energy convergence and transmission, as well as to realize network cluster synergy.
1. Introduction
Manufacturing is the core component of industry in China, and its overall size has ranked first in the world. However, the Sino–US trade war that began in 2018 has raised awareness that Chinese manufacturing still has many problems, including core technological shortcomings. Sustainable development and the transformation and upgrading of manufacturing and are important issues that must be solved quickly. In addition to the core technological shortcomings that restrict the development of manufacturing, China is also facing the challenges of an energy crisis, with pronounced energy inefficiency and serious conflicts between the supply and demand for energy, due to the high dependency of manufacturing on energy resources [1,2]. From 2002 to 2012, China’s total energy production—including raw coal, crude oil, natural gas, primary electricity, and other energy sources—has grown, but its growth rate has been declining during the volatility. In 2012, the total energy production was 28,563.12 TWh, with a growth rate of 3.19%. The total energy consumption was always greater than the total energy production, and the growth rate of total energy consumption was always greater than the growth rate of total energy production. The total energy consumption in 2012 was 32,720.75 TWh, with a growth rate of 3.90% [3]. Therefore, China’s energy security issues are very prominent.
Additionally, total carbon emissions remain high, especially in consideration of the Paris Climate Agreement, which promises that the CO2 emissions per unit of GDP will be 60–65% lower than that of 2005 by 2030. The environmental constraints derived from this are important factors affecting the development of manufacturing [4,5,6]. In order to overcome energetic and environmental constraints, and for manufacturing to continue to play a role in the economy, the optimization of energy structures and the promotion of industrial restructuring and technological progress are vital. However, technological progress requires long-term accumulation and development, and there is little room for optimization of energy structures. Currently, industrial restructuring strategies are being widely adopted [7,8], yet the development of industry is closely related to energy consumption. Adjustments to industrial structures need also to consider the network correlation effect of energy transmission on industrial development. Moreover, it is insufficient to use the total direct energy consumption of an industry to reflect the energy consumption of that industry [9]. In order to more comprehensively analyze the impact of energy convergence and transmission on industrial development, we can use the concept of embodied energy from system ecology, which is the total energy embodied in goods and services, including direct and indirect energy required by products and services [10]. The transfer of products and services between industries means that embodied energy has the characteristics of flow [11]. By analyzing the flow of embodied energy, especially by accurately portraying the network structure formed by the embodied energy flow of the industry, we can reveal the embodied energy flow patterns between the internal and external industries of China’s manufacturing industry based on their evolution. This approach has important theoretical significance and application value for the rational planning of energy allocation, supporting industrial transformation, and the upgrading and adjusting of the structure of the manufacturing industry, and is the goal of our research.
Recent research on embodied energy has been mainly focused on trade (including various direct energy commodity trades) [10,12,13,14], carbon emissions [15], global sectors [16,17,18], and the whole industry [9,11,19]. The main feature of these studies is the analysis of the network structure formed by embodied energy flows based on the network perspective, which is an important idea to understand complex systems. Chen et al. [10] used complex network analysis tools to reveal the structure of the embodied energy flow network at the global, regional, and national levels, based on the environmental expansion input–output analysis method. Gao et al. [19] built an embodied energy trade network model and tracked the main energy flows of multiple layers through a combination of energy embodied in bilateral trade methods and complex network analysis methods. Quantitative analysis of the hidden energy of coal, oil, natural gas, and non-fossil fuels at the provincial level in 30 provinces of China was then conducted. An et al. [9] constructed a directed weight network for embodied exergy flows, based on 135 industrial sectors in China in 2007. On this basis, the structural characteristics of the network were analyzed, and the block community was used to classify the network community. Sun et al. [11] built three indirect energy flow networks with directional weights, which consisted of 28 departments corresponding to the input, output, and output tables of 1997, 2002, and 2007, respectively. These networks were then used to reveal the structure and changes of the indirect energy flow network during the period 1993–2007. Shi et al. [16] used the world input–output table data from 1995 to 2009 to study the evolutionary characteristics of global embodied energy flows between different industrial sectors, using complex network theory. Similar to the above researches, we also study embodied energy based on the network perspective, but the difference is that our research is on the embodied energy flow model of Chinese manufacturing. Moreover, we not only use the network perspective, but we also focus on the mining of China’s manufacturing embodied energy flow model, based on industrial interactions and their evolution. As far as we know, this is the first study of its kind, and is of great value for understanding the interaction process and characteristics of China’s manufacturing industry based on embodied energy.
In addition, due to the limitations of direct energy research, most of the current research on manufacturing energy uses the concept of embodied energy, even from embedded energy to embodied exergy [9,20,21,22]. For instance, May [23] and Jovanović et al. [24] studied energy management issues in manufacturing, while Kara et al. [25] investigated the impact of global manufacturing on the embodied energy of products. They put forward an important point: that studying the embodied energy issues of a product must be in the context of global manufacturing, rather than studying the energy efficiency associated with a specific product life cycle. Kara et al. [26] explored the embodied energy issues in the product lifecycle of different manufacturing supply chains through a case, and proposed relevant influencing factors. Tao et al. [13] used an empirically validated environmental input–output life cycle assessment model to calculate and decompose the total amount of embodied energy in China’s and the EU’s manufacturing trade in 1995–2011. Andersen et al. [27] mainly analyzed the energy and material flow problems of the US steel industry. Compared with our research, this article focuses on the energy and material consumption patterns within the steel industry, based on energy end-use models and process processing models. Although many of the above researchers have studied manufacturing from the perspective of embodied energy or even embodied exergy, the current research lacks in-depth analysis from a network perspective, and does not dig deep into the complexity of manufacturing embodied energy flows. That is, the embodied energy flow pattern exists in the interaction between various industries within the manufacturing industry, between manufacturing and other industries, and this interaction process is constantly evolving. Different from the above research, this paper does not study the energy management of the specific industries within the manufacturing industry, nor does it study the calculation and decomposition of the total amount of embodied energy in the manufacturing industry. We are committed to understanding the complexities of embodied energy flows in manufacturing, thereby supporting the expansion and deepening of energy research in manufacturing.
We take the problem of China’s manufacturing embodied energy flow as the research object, and use the perspective of China’s manufacturing embodied energy flow network to deeply explore the pattern and its evolutionary trends of embodied energy, which are based on the interactions between various industries within the manufacturing industry, and between manufacturing and other industries. The purpose is to provide an effective way to understand the role of energy in the convergence and transmission of various industries and the role of specific industries in the energy flow process, and to rationally plan energy allocation policies to support the transformation, upgrading, and sustainable development of China’s manufacturing industry. It also provides theoretical and empirical evidence for supporting China’s manufacturing industry to break through existing development bottlenecks.
2. Model Construction
Most studies on manufacturing and energy consumption use attribute data, and take manufacturing and the entire Chinese industry as a black box by measuring and statistically analyzing the relationship between manufacturing and energy consumption [28,29,30]. These studies mainly focus on issues, such as industry differences, regional differences, and factors, affecting energy consumption. From the perspective of system theory, if manufacturing or Chinese industry is regarded as an industrial system, the aforementioned research paradigm will focus on the influence of external factors on the system, ignoring the underlying structure and relationships among the internal components of the system. The energy consumption of China’s manufacturing industries and other industries are not independent, but are closely related to the demand and supply processes of products and services. They constitute the system of the Chinese manufacturing industry, and even of the entire Chinese industry.
Structure determines function. If only attribute data are used and relational data are not used, the correlation effect inside and outside the manufacturing industry will not be considered, and the collective and conductive relationships of energy consumption inside and outside of manufacturing will be ignored, rendering it impossible to reveal the complex structure and the effects of manufacturing and energy consumption. Additionally, with the concept of ‘embodied energy,’ establishing a model of embodied energy flow can not only reasonably reflect the conduction processes of direct and indirect energy consumption inside and outside of the manufacturing industry, but it also can represent the interrelated structures between various industries. This cannot be achieved using indicators, such as the total direct energy consumption or energy intensity. Therefore, based on the theory of network science, an embodied energy flow network was constructed from the perspective of system evolution and used to explore the emerging patterns and their evolutionary properties in China’s manufacturing embodied energy flow process.
2.1. Embodied Energy Flow Model
The embodied energy flow model proposed in the literature [31] is mainly based on the principle of ecological inputs and outputs, but may also be used to calculate the embodied energy flow among industries. Figure 1a shows the inflow and outflow of capital flows from industry (). Among them, as part of the capital inflow, indicates the investment of other industries into a given industry, and are the foreign investment into domestic industry, . As part of the capital outflow, is the investment of domestic industry into industries in other countries, where , , and are the parts of the output of industry used for exporting abroad and for final consumption in the country of export. On this basis, it is necessary to convert the capital flow of the industry, i, into energy flow, as shown in Figure 1b, where is the direct input of the k-type energy in industry , is the quantity of the k-type energy embodied in the products and services obtained from other domestic industries j, is the quantity of the k-type energy embodied in the products and services obtained from foreign industry , and is the quantity of the k-type energy in the export products and services of industry . Here, the added value of the industry, such as taxes and wages, is set to zero. In order to calculate the amount of embodied energy contained in the flow of money, the key is to introduce the concept of embodied energy intensity, as shown in Figure 1c, where is the implied energy intensity of the k-type energy source of industry , which indicates that the industry produces one unit of product or service that reflects the quantity of the k-type energy source. The embodied energy flow in Figure 1b can be expressed as the product of the embodied energy intensity and the capital flow of each industry. For example, indicates the quantity of the first energy reflected in the input of products and services of industry to industry .
In the embodied energy flow model, the core principle is that of material energy balance, where the total input of embodied energy is equal to the total output of embodied energy in an industrial sector:
Because China’s input–output table does not distinguish between domestic and foreign parts of intermediate inputs (i.e., ), considering the availability of data and the need to simplify the model, we also made the assumption that the domestic industry and the foreign industry have the same embodied energy intensities (i.e., that ) with reference to An’s method [31]. Additionally, the total domestic output of the industry is , and thus Equation (1) may be converted to:
Further, the definitions of total imports, total intermediate inputs, and the total final consumption in industry are:
Therefore, in matrix form is: . The net resource input matrix is , the embodied energy intensity matrix is , the economic input–output matrix is , and the total domestic output matrix is , when j and , otherwise it is . Since the embodied energy intensity solution is the key, and the embodied energy intensity matrix, ε, can be expressed as , by setting as the net energy input matrix of the industrial unit output, , the embodied energy intensity can be solved by multiplying the unit output–net energy input matrix by the Lyon-Cove inverse matrix:
Finally, the amount of embodied energy flow between various industries can be obtained as , where , and is the amount of embodied energy that industry j flows into industry i.
2.2. Embodied Energy Flow Network
The Chinese manufacturing embodied energy flow network constructed here is based on network science theory, but differs from a traditional static network. Based on the calculations of the embodied energy flows between various industries, an industrial embodied energy flow network containing directions, weights, and time factors was constructed. The industrial embodied energy flow network is given as , where is a network node, representing each industry; is a network edge, representing the embodied energy flow relationship between various industries; W is the edge weight, which is represented by the amount of embodied energy; and is time.
Contrary to sparse networks, the nodes of the embodied energy flow network studied here include the various industrial sectors in the input–output table of Chinese industry. The links among these sectors are close, and there are internal linkages within individual industrial sectors. Therefore, the embodied energy flow network is dense and has a self-looping network. In order to effectively represent the embodied energy flow network and interface with the relevant indicators of undirected networks in mature network science theory [32], the directed industrial embodied energy flow network was further decomposed into the in-edge network and the out-edge network , according to the direction of the network edge. Additionally, in order to deal with the problem of self-looping, the concept of an ‘internal node’ was proposed to expand the construction method of embodied energy flow networks.
Due to the self-looping in the network, the complexity of the model was greatly increased. Most of the traditional network science theories do not consider the problem of self-looping, or ignore the phenomenon entirely. The main way to deal with the existence of a self-looping network is to add a self-looping edge directly to the node; however, since most of the existing mature network calculation indicators are based on the assumption of no self-looping, this process will cause most network calculation indicators to become inapplicable. In order to solve both the self-looping problem and to apply the existing network calculation indicators, the concept of an internal node is proposed here, such that each node of the original network is fictitiously constructed with an internal node, and the internal node only has a connecting edge with the node; the edge weight is the self-loop weight. By fictionalizing an internal node, not only does it not destroy the self-loop assumption of most network calculation indicators, but it also reflects the relationships among industries. The concept of the embodied energy flow network with internal nodes constructed in this study is shown in Figure 2.
3. Samples and Data
To construct an embodied energy flow network to study the patterns and evolutionary trends of the embodied energy flows of the internal and external industries of Chinese manufacturing, input and output data from the China 2012 Input-Output Table [33], containing 42 sectors over five periods, including 2002, 2005, 2007, 2010, and 2012, and the total energy consumption data from the China Energy Statistics Yearbook 2013 [34] were used. It should be noted that the total energy consumption data we use in our research is the sum of different types of energy such as coal, petroleum, natural gas, hydro power, nuclear power, and other power. Moreover, as we have pointed out in the ‘2.1 Embodied energy flow model’ section, this study uses data from the China Input-Output Table, which contains only the imported portion, but does not distinguish between energy types. Therefore, we only study the embodied energy between various industries in China’s manufacturing industry, and between these industries and other industries, based on the total energy consumption. In addition, although the input and output data officially announced by China are current to 2012, the updated public data are limited; it was found that the embodied energy flow patterns were stable over time, so the conclusions of this study are not limited by the data.
Since the classifications of intermediate inputs in each year of the China Input-Output Table [33] (42 Sectors) are not completely consistent, the relevant subjects were adjusted. Among them, ‘instrumentation’ and ‘metal products, machinery, and equipment repair services’ were merged into the class, ‘manufacturing of measuring instruments and repair of metal products, machinery, and equipment.’ Additionally, ‘wholesale and retail’ and ‘accommodation and catering’ were combined into ‘wholesale and retail trades and accommodation and catering’; ‘information transmission, software, and information technology services,’ ‘finance,’ ‘real estate,, ‘lease and business services,’ ‘scientific and technical services,’ ‘water conservancy, environmental and public facilities management,’ ‘resident services, repairs, and other services,’ ‘education,’ ‘health and social work,’ ‘culture, sports, and entertainment,’ and ‘public administration, social security, and social organization’ were merged into the class, ‘service industry.’ ‘Other manufactured products’ and ‘waste scrap’ were combined into the class, ‘other manufacturing and comprehensive use of waste resources.’
Due to the lack of data from 2002 in the total energy consumption of the sub-sectors in the China Energy Statistics Yearbook 2013 [34], the data for 2002 were extracted from the total energy consumption of the industry in the China Energy Statistics Yearbook 2005 [35]. However, due to differences in the statistical subjects of the total energy consumption in the China Energy Statistics Yearbook 2013 [34] and the China Energy Statistics Yearbook 2005 [35], it was necessary to adjust the statistical subjects to ensure correspondence between the two data sources. Specifically, in the China Energy Statistics Yearbook 2013 [34], ‘mining assistance activities’ was merged into ‘other mining industries’; ‘automotive manufacturing’ and ‘railway, marine, aerospace, and other transportation equipment manufacturing’ were combined into ‘manufacturing of transport equipment’; and ‘metal products, machinery, and equipment repair industry’ and ‘manufacture of instrumentation’ were merged into ‘manufacturing of measuring instruments and repair of metal products, machinery, and equipment’. In the China Energy Statistics Yearbook 2005 [35], for the data in 2002, the ‘rubber products industry’ and the ‘plastic products industry’ were merged into the class, ‘rubber and plastic products industry,’ and the ‘arts and other manufacturing industries’ category was changed to the class, ‘other manufacturing.’
Although the China Energy Statistics Yearbooks [34,35] have divisions for seven categories of each subject, including agriculture, forestry, animal husbandry, fishery and water conservancy, industry (including mining and quarrying, manufacturing, production and supply of electricity, and water and gas), and construction, transportation, storage and post, wholesale and retail, lodging and catering, and other industries, as well as consumer spending, they do not further divide the manufacturing category, and the subject categories also differ from those of the China Input-Output Table [33] (42 sectors). Since the focus here is on the embodied energy flow patterns between the internal and external industries of manufacturing, a new classification of ‘daily industry,’ which includes the construction, wholesale retail accommodation, warehousing, postal services, and other industries, was added in this study in order to rationally divide the types of models, based on the three categories of ‘resource-based industry,’ ‘high-end manufacturing,’ and ‘traditional manufacturing’ proposed by Zhu et al. [36] and in combination with other industries related to Chinese manufacturing. In this way, all industries inside and outside the manufacturing industry could be included in the manufacturing embodied energy flow pattern of China. The adjusted subjects and classifications are shown in Table 1.
According to Figure 2, in order to deal with the self-looping problem, corresponding internal nodes were added to the industrial sectors shown in Table 1. Additionally, since the weight of the embodied energy flow network of manufacturing constructed here depends on the embodied energy intensity between various industries, the data must be standardized to avoid a data imbalance. If the data for different years are used directly, the merging process will lose its temporal information. Therefore, the corresponding edge weight data of different years were normalized based on the median values.
To comprehensively analyze the embodied energy flow patterns and their evolutionary trends for the internal and external industries, the embodied energy flow network constructed in this study contained two types of networks, namely the internal network of manufacturing and the external network of manufacturing. The internal network of manufacturing is an associated network formed by the embodied energy flow between various industries within the manufacturing industry. The external network of manufacturing included other industries outside of manufacturing as a merger node, focusing on the associated network formed by the embodied energy flow between the manufacturing industries and other external industries. Meanwhile, each type of network included network slices of five time periods, 2002, 2005, 2007, 2010, and 2012, and the network in each time period was divided into an in-edge network and an out-edge network. The in-edge network reflects the convergence of embodied energy, and the out-edge network reflects the transmission of embodied energy. Twenty embodied energy flow networks of different types and times were constructed. In this study, the first time period was 2002, which served as the base year. The in-edge and out-edge networks corresponding to the internal and external networks of the manufacturing industry are shown in Figure 3.
4. Results and Discussion
The embodied energy flow patterns of the internal and external industries of Chinese manufacturing were used as the embodied energy flow patterns of manufacturing in China in this study. The trends that emerged in the flow processes of embodied energy between various industries were considered here. In order to deeply analyze the embodied energy flow patterns of China’s manufacturing industry from the perspective of system theory and based on the evolution of the energy flow network, fine-grained analyses of the embodied energy flow patterns and their evolution were performed for two aspects: the structural features of the embodied energy flow network, and the evolutionary trends in the embodied energy flow pattern.
4.1. Structural Features of Embodied Energy Flow Network of China’s Manufacturing Industry
The embodied energy flow network of China’s manufacturing industry constructed in this study included the internal and the external networks of manufacturing; their basic structural features are shown in Table 2. Among them, the densities of the internal and external networks of manufacturing reveal that they are sparse networks. Four node centrality indicators were used to measure the importance of network nodes, and they are indicators for measuring the importance of various industrial sectors in China’s manufacturing embodied energy flow network. The degree centrality measures the connectivity of the nodes, and the closeness centrality measures the distance from a given node to other nodes. The betweenness centrality represents the degree to which a node lies between other pairs of nodes. The eigenvector centrality measures the importance of nodes, and is implicitly defined based on concepts such as state, ranking, and reputation [37]. The specific calculation methods of these four centrality indicators are provided in a previous study [38].
Since the embodied energy flow network is a weighted network, the node strength is the sum of the edge weights of the node. Therefore, the node strength distribution shows the general characteristics of the inputs and outputs of the embodied energy in various industries within the network (Figure 4). Each row corresponds to a different type of network, and each column corresponds to one of the five time periods (i.e., 2002, 2005, 2007, 2010, and 2012). Figure 4 shows that the general characteristics of the inputs and outputs of embodied energy in various industries are similar, whether they are from the internal network or the external network of manufacturing. The total inputs and outputs of embodied energy in most industries are small, and the convergence and transmission of most of the embodied energy is concentrated within a few industries. The internal network and external network of the manufacturing industry have essentially maintained this characteristic during their evolution.
Upon further analysis of the conclusions of Figure 4, we can find out which are the top four industries of node strength, as shown in Figure 5. From the perspective of industrial nature and energy flow, these industries belong to the hub nodes in the network [38]. Since transport, storage, and postal services (M), production and distribution of electric power and heat power and tap water (M), and construction (M) are merged nodes, they merge the industries in their category, which means that the embodied energy flow among other industries and all industries within these categories is counted; it is therefore natural that these are hub nodes, thus we focus on industries other than the merged industries.
It should be noted that manufacturing of chemical products and smelting and processing of metals are the two industries with the strongest node strengths in the in-edge network and out-edge network of the internal and external networks of manufacturing. We further analyzed and found that the manufacturing of chemical products has the strongest node strength in the in-edge network, while the smelting and processing of metals has the strongest node strength in the out-edge network, which means that the high-end manufacturing industry mainly absorbs and converges embodied energy, while the resource-based industry transmits embodied energy. This discovery is in line with the characteristics of the industry; these two industries bring together a large number of embodied energies in China’s manufacturing industry and are key industries in China’s manufacturing industry. In addition, it is worth noting that the manufacturing of chemical products belongs to high-end manufacturing, while the smelting and processing of metals is a resource-based industry. In the scarcity of resources and the market competitive environment, these two different types of industries have played a role of double-headed competition in the embodied energy flow network of China’s manufacturing industry from the two extremes of the convergence and transmission of embodied energy, and formed a bipolar balance feature. This is a very important discovery. Moreover, from the perspective of evolution, the internal and external networks of manufacturing have basically maintained this overall feature in the process of evolution.
In addition to the distribution of the node strength, this study is concerned with how the nodes of different strengths are connected to each other. To measure this feature, the average strength of the neighboring nodes can be used. Figure 6 shows the relationship between the node strength and the average strength of the neighboring nodes of the internal and external networks of the manufacturing industry.
It can be seen that although the internal and external networks contain different industry categories, the node strengths and the average strengths of the neighboring nodes reflect similar negative correlations, indicating that the two types of networks are heterogeneous (i.e., the nodes with high strengths prefer to connect to weaker nodes). According to previous findings in the field of network science [38], biological networks and technological networks are generally heterogeneous, while social networks are generally homogenous; however, there is no relevant research on this issue with respect to industrial networks
Since the implied energy flow network of Chinese manufacturing is essentially an industrial network, this study provides evidence for the heterogeneity of industrial-related networks. Additionally, the results of the study reveal that industries with stronger embodied energy convergences and conductivities are generally more likely to be associated with weakly converging and conducting industries (Figure 6). These results provide an important theoretical basis for the rational planning of energy allocation policies.
In addition to node features, the features of the edge of the embodied energy flow network, including edge betweenness centrality and the distribution of the edge weight, were considered in this study. Among these features, edge betweenness centrality is the generalization of the betweenness centrality of the node, which indicates the number of shortest paths through each edge [38]. Here, the edge betweenness centrality was used to analyze which edges of the embodied energy flow network were the most important for the flow of energy. Table 3 shows the highest edge betweenness centralities in the internal and external networks corresponding to the five time periods (i.e., 2002, 2005, 2007, 2010, and 2012).
Table 3 shows that within the in-edge and out-edge networks of the internal network of manufacturing, three edges (TM_1-HM_6, RI_6-HM_5, and HM_6-TM_6), as the edges with the highest values of edge betweenness centrality, appeared twice in the five time periods. Within the in-edge and out-edge networks of the external network of manufacturing, four edges (HM_6-DI_1(M), TM_4-HM_5, HM_6-RI_1(M), and RI_6-RI_1(M)), as the edges with the highest values of edge betweenness centrality, appeared twice in the five time periods. These edges played an important intermediary role in the process of embodied energy flow, and this result can provide guidance in the formulation of energy allocation planning policies.
The edge weight of the embodied energy flow network reflects the correlation intensity of the embodied energy flow of various industries. Figure 7 shows the distribution of the contiguous weights of the in-edge network and out-edge network of the internal and external manufacturing networks over the five time periods studied. These results show that, regardless of whether it is within the internal network of manufacturing or the external network of manufacturing, the distribution of the weights of the various types of network edges follows an approximate power-law distribution. In the field of network science, a power-law distribution exists widely in the degree of node distribution in scale-free networks, indicating the formation of a ‘rich get richer’ mechanism in the network [38]. As Figure 6 reflects the distribution of the edge weight, unlike the degree of node distribution, the edge is treated as the main body, and the function of the node is to connect the two edges. This means that in the internal and external networks of manufacturing, whether it is an in-edge or out-edge network, the choice of the embodied energy flow path of various industries also has this preference of ‘the rich get richer’. That is to say, the results shown in Figure 7 indicate that newly generated embodied energy flow paths are more likely to be chosen for connection to a path of strong convergence or conductivity. This reveals an important mechanism for the generation of embodied energy flow paths in China’s manufacturing industry. Further, it provides important theoretical evidence for the dynamic control and guidance of the flow of embodied energy over time, and the rational planning of energy allocation.
4.2. Evolution of Embodied Energy Flow Patterns in China’s Manufacturing Industry
In network science, ‘community’ is not only a structural feature of the network, but it is also a mechanism for network generation. It is used to measure the extent to which a subset of nodes in the network and the corresponding connected edges are aggregated, reflecting the aggregation mode of nodes in the network [38]. Based on this, the embodied energy flow pattern of China’s manufacturing industry was defined as the aggregation mode between various industrial sectors inside and outside the manufacturing industry, based on their embodied energy flow relationships. China’s manufacturing embodied energy flow network is the carrier of embodied energy flow. On the basis of understanding the characteristics of its network structure, the embodied energy flow patterns of Chinese manufacturing and the differences and stability of these patterns were analyzed in detail.
The key to analyzing the embodied energy flow pattern of China’s manufacturing industry lies in the community relationships and evolution of various industries, based on the relationships of embodied energy flow. On the basis of the literature [39], the random walk algorithm was adopted in this study, with the edge weight as the preference for classifying communities of the in-edge and out-edge networks included in the internal and external networks of manufacturing. The results of the community classification of China’s manufacturing embodied energy flow network in the base year served as the benchmark for analyzing the evolutionary trends in the model. Figure 8 presents the result of network community classification in the base year.
Based on the partitioning of communities and the industrial classifications shown in Table 1, the embodied energy flow patterns emerging in the internal and external networks of manufacturing are shown in Figure 8. Among them, in the internal and external networks of manufacturing, in addition to the separate aggregation of high-end manufacturing, traditional manufacturing, and resource-based industry, each industry also presents a mixed-node aggregate pattern of various industrial types, which are here referred to as ‘hybrid industrial communities,’ and which represent the aggregated form of the four industrial classifications in Table 1. The percentage of each type of community in Figure 8 represents the proportion of that type of community in all communities of the corresponding network.
The in-edge network represents the convergence of embodied energy, while the out-edge network represents the transmission of embodied energy. A vertical comparison of the four panels in Figure 8 reveals that the embodied energy flow pattern of the internal network of manufacturing mainly includes two patterns. The first pattern is a multi-focus convergence model consisting of communities of high-end manufacturing, communities of traditional manufacturing, communities of resource-based industry, and communities of hybrid industry. The second pattern is a two-focus convergence model consisting of communities of high-end manufacturing and communities of hybrid industry. The embodied energy flow pattern of the external network of manufacturing is mainly a two-focus transmission mode consisting of communities of traditional manufacturing and communities of hybrid industry.
A horizontal comparison of the four panels of Figure 8 shows that within the in-edge and out-edge networks, high-end manufacturing, traditional manufacturing, and resource-based industry not only are aggregated separately, but have also played an important role in the industrial integration of communities of hybrid industry. The combined role of daily industry is weak. Additionally, within the in-edge network, communities of high-end manufacturing have gathered most of the embodied energy, while within the out-edge network, communities of traditional manufacturing have played a major role in the transmission of embodied energy.
On the basis of analyzing the embodied energy flow patterns and their differences in China’s manufacturing industry, an important question is whether or not these patterns and their differences are stable over time. Figure 9 and Figure 10 show community evolution flow graphs of the internal and external networks of the manufacturing industry, respectively. In each figure, the in-edge network and the out-edge network are shown, along with the various industries and the number of communities in the corresponding time periods. These figures intuitively reflect the patterns and evolution of the relationships of embodied energy flows among various industries.
It can be seen in Figure 9 and Figure 10 that for the internal and external networks of manufacturing, whether we examine an out-edge network or an in-edge network, the evolution of communities is volatile, but does this volatility affect the embodied energy flow pattern? In the process of network evolution, the co-occurrence of community nodes reflects the changes in community composition. By quantitatively analyzing the co-occurrence of community nodes, the stability of embodied energy flow patterns inside and outside the manufacturing industry can be further analyzed.
As the communities of various industries change in each period, the results of community partitioning in each period are not the same. In order to track and compare community changes, a key question is how to determine the corresponding community in different time periods. In this study, the ideas presented in the literature [40,41] were used to judge the corresponding communities of nodes in different time periods by the consistency of their core members. In essence, the consistency of core members reflects those nodes that are stable within the community; they are the core for maintaining the cohesiveness of the community. The formula for calculating the consistency of core members in a node is as shown in Equation (7):
where is a community of the benchmark network, and is a community of the network in another time period. The node contained in the community A is represented as |A|, and represents the number of nodes included in the community . Here, and and are two different communities. As represents the nodes contained in community , represents the set of nodes common to communities and , and represents the set of nodes of the communities and . The indicator is the core member consistency, which is used to measure the degree to which the nodes in community are included in community . Generally, and .
According to Equation (7), and based on the results of the network community partitioning in the first time period, the community with the highest degree of consistency of its core members is defined as the corresponding community by iteratively solving for the network communities in other time periods. This can be used to quantify the co-occurrence of community nodes, and to compare the consistency of the core members of each community in the internal and external networks of manufacturing over time. The results of the stability analysis of the embodied energy flow pattern of China’s manufacturing industry can thus be obtained.
To find the co-occurrence of community members, the stable and free members of the community can be divided by means of threshold setting, which respectively represents the core strength of maintaining the cohesiveness of the community, and the destructive factors of the stability of the community. In this study, nodes with no more than three co-occurrences in the five studied time periods were considered free members. The results show that there were 10 communities in the in-edge network of the internal network of manufacturing, and the nodes included in each community were stable members. In the out-edge network there were a total of 5 communities, of which the only free member was the manufacturing of transportation equipment (HM_3; Table 1). Within the in-edge network of the external network of manufacturing there were 5 communities, among which the free members included other manufacturing and comprehensive use of waste resources (TM_6); processing of petroleum, coking, and processing of nuclear fuel (RI_6); and the processing of timber and furniture (TM_4) (Table 1). Within the out-edge network of the external network of manufacturing there were a total of 8 communities, among which the free members included the manufacturing of transportation equipment (HM_3); the manufacturing of communication equipment, computers, and other electronic equipment (HM_5); the manufacturing of measuring instruments and repair of metal products, machinery, and equipment (HM_6); and wholesale and retail trades, and accommodation and catering (DI_2) (Table 1).
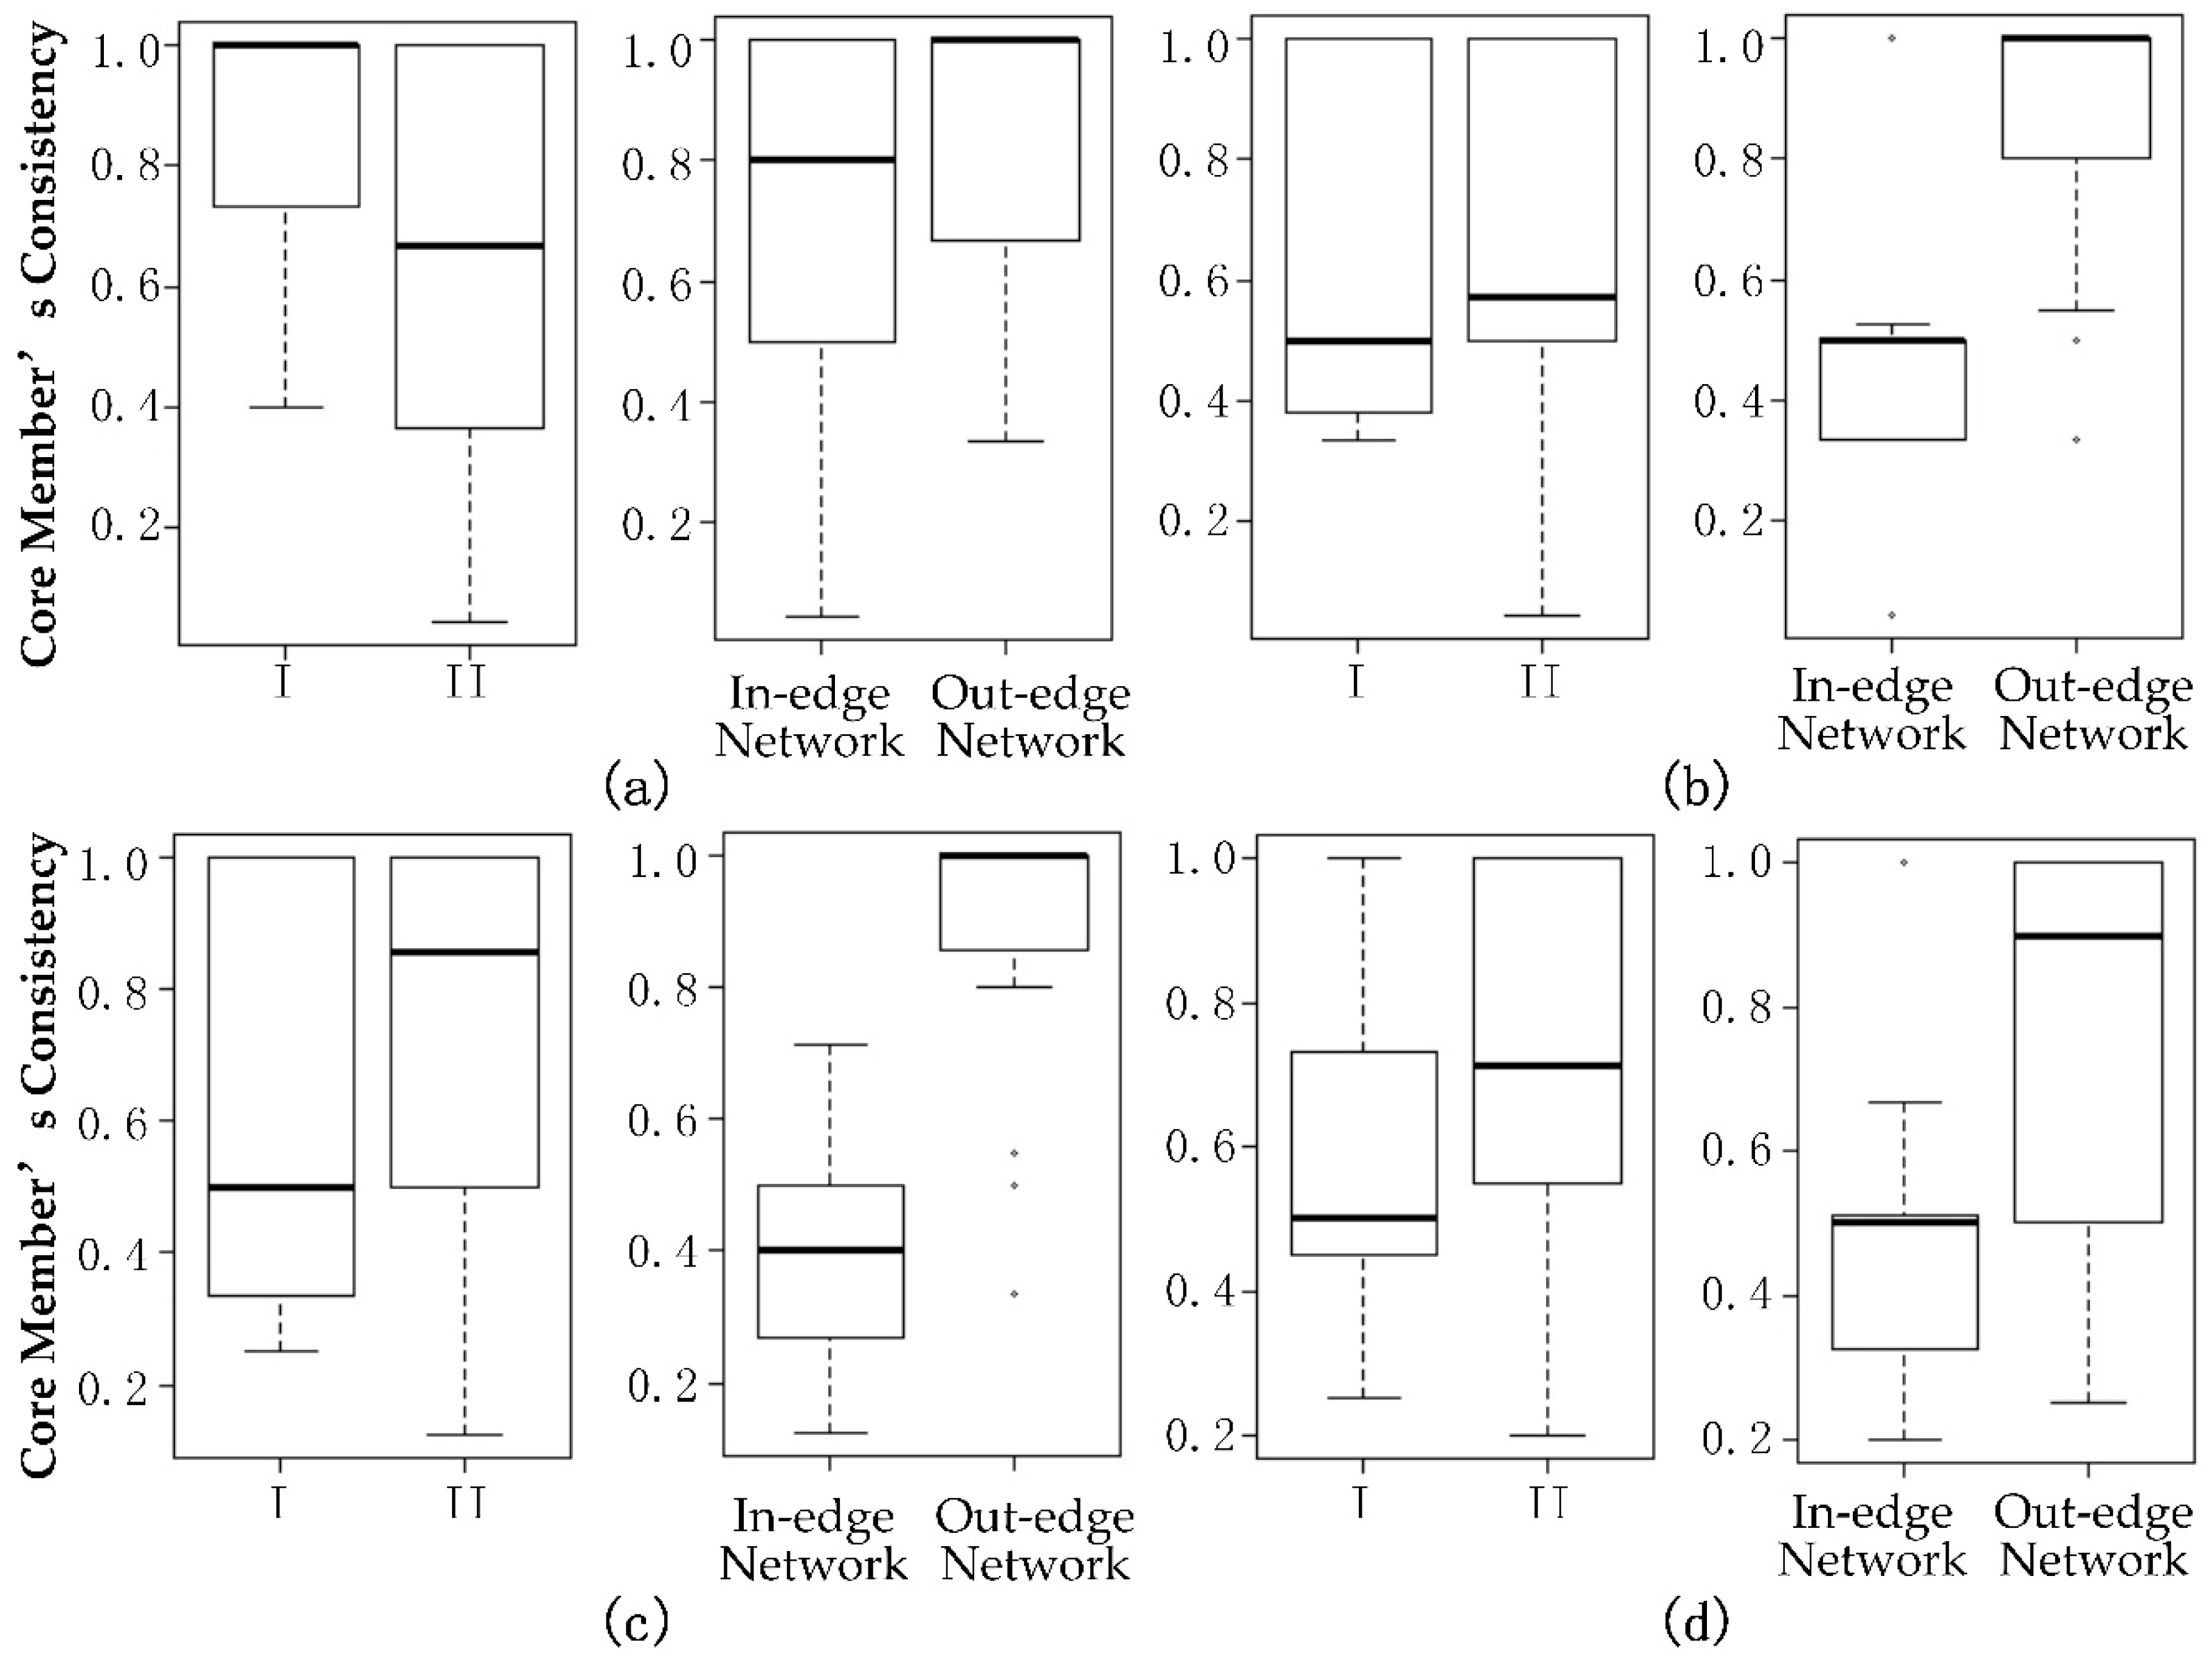
To analyze the stability of core member consistency, the internal and external networks types and the in-edge and out-edge networks of manufacturing can be used as influencing factors to compare the stability of core member consistency over time. Figure 11 shows the results of the analysis of two network types and the in-edge and out-edge networks as two factors in the comparison between different time periods. Since there were five time periods, comparative results were generated for four time periods. Figure 11 shows that in the comparisons of four time periods, each level of the two factors had a different degree of difference. The analysis of the two factors was verified by using the variance model . The results are shown in Table 4.
It can be seen in Table 4 that in the comparison of time periods 2005 and 2002, the network type had a significant influence on the consistency of core members. In the comparisons of times periods 2007 and 2002, 2010 and 2002, and 2012 and 2002, the impact of the in-edge and out-edge networks on the consistency of core members was highly significant. It is worth noting that no matter which time periods were compared, the interaction between the network types and the in-edge and out-edge networks had no significant effect on the consistency of core members, which indicates that the impacts of the internal and external network types and the types of in-edge and out-edge network on the stability of the embodied energy flow pattern were discrete from one another.
After analyses of variance, further analyses of the equality of variances were needed. Since Levene’s test is insensitive to the normality of the data and the results are relatively robust, the four time periods were compared to the first time period (2002) using Levene’s test for the equality of variances. The results are shown in Table 5, and reveal that in the comparison of the four time periods, the p-values corresponding to the network type were greater than 0.05, which indicates that the equality was satisfied at the 0.05 α-level. That is, in the comparison of these time periods, the consistencies of core members had the same variance regardless of the network type or the different levels of the in-edge and out-edge networks. This means that China’s manufacturing embodied energy flow pattern has been stable over time.
Figure 8, Figure 9, Figure 10 and Figure 11 show the results of community partitioning of the manufacturing embodied energy flow network and the stability of its evolution. It is worth noting that the industrial groups suggested by these communities were not classified according to their functions, but rather based on their embodied energy flow relationships. They form an ‘energy-related industrial cluster’ in the process of embodied energy flow. By planning and configuring the energy supplies of key industrial sectors, it is possible to rely on the embodied energy flow network to generate correlations to achieve cluster synergy. Therefore, it is very important to tap key industry sectors based on the perspective of energy-related industrial clusters.
Based on the results of the node strength, edge betweenness centrality, and edge weight obtained during the structural analysis of China’s manufacturing embodied energy flow network, key industry sectors were extracted as the cores, and the communities they are in were defined as the ‘energy-related industrial clusters’. In order to comprehensively consider the results of the in-edge and out-edge networks, the key industrial sectors mined within the in-edge and out-edge networks in the internal and external manufacturing networks were merged. The results show that in the internal network of manufacturing, the key industrial sectors that existed in the five time periods included the manufacturing of chemical products (HM_1); smelting and processing of metals (RI_8); manufacturing of general and special purpose machinery (HM_2); manufacturing of measuring instruments and repair of metal products, machinery, and equipment (HM_6); and other manufacturing and comprehensive use of waste resources (TM_6) (Table 1). The key industrial sectors that existed within the in-edge and out-edge networks were the manufacturing of chemical products (HM_1) and the smelting and processing of metals (RI_8) (Table 1). Within the external network of manufacturing, the key industrial sectors that existed in the five time periods included the manufacturing of chemical products (HM_1); smelting and processing of metals (RI_8); construction (combination; DI_1(M)); agriculture, forestry, animal husbandry, and fishery (combination; RI_1(M)); the processing of petroleum, coking, and processing of nuclear fuel (RI_6); and the manufacturing of non-metallic mineral products (RI_7) (Table 1). The key industrial sectors that existed within the in-edge and out-edge networks were the manufacturing of chemical products (HM_1) and smelting and processing of metals (RI_8). It is worth noting that the two industrial sectors of the manufacturing of chemical products (HM_1) and the smelting and processing of metals (RI_8) were the key industries in both the in-edge and out-edge networks of the internal and external networks of manufacturing. This indicates that the manufacturing of chemical products (HM_1) and the smelting and processing of metals (RI_8) are the sectors that should be planned in the internal and external networks of China’s manufacturing industry.
We have found many important conclusions in our research, but our research is inevitably limited. In terms of model rationality, as far as we know, this is the first analysis of the embodied energy flow pattern of China’s manufacturing industry and its evolution characteristics, and there is no similar research on manufacturing in the world or in other countries; thus, we cannot find other similar results for comparison. However, it should be pointed out that the model we studied has a widely recognized theoretical and practical basis, and that in recent years, many studies in trade, global sectors, and other aspects have been successfully carried out using similar approaches [9,10,11,16,19]. This explains the rationality of our research ideas to a certain extent. In terms of model applicability, due to the need of data availability and model simplification in the modeling process, it was assumed that domestic and foreign industries have the same embodied energy intensity, although this assumption is not necessarily true in reality. In cases where other countries have data available in this area, our model can modify this assumption, which is also our future research direction. In terms of the sensitivity of the model, we have analyzed the stability of the embodied energy flow pattern of the manufacturing industry and reached the conclusion that the Chinese manufacturing embodied energy flow model has stability in its evolution, which proves that our model has stability. It must be acknowledged that since we only studied the embodied energy flow pattern of China’s manufacturing industry, and only considered the total energy consumption data, we can further consider more energy types in future research, and research on a broader range of industrial embodied energy flows.
5. Conclusions and Policy Recommendations
5.1. Conclusions
In contrast to the traditional method of using attribute data to study manufacturing and energy consumption, an embodied energy flow approach to China’s manufacturing industry was taken in this study. Based on network science theory, through the construction of an embodied energy flow network, and from the perspective of system theory, fine-grained analyses were performed on the emerging patterns and evolution of the embodied energy flows in the internal and external industries of Chinese manufacturing. The methods applied here can not only reasonably reflect the collection and transmission relationships between direct and indirect energy consumption inside and outside the manufacturing industry, but they can also reveal the complex correlation between Chinese manufacturing and energy consumption, which cannot be achieved using indicators such as the total direct energy consumption or energy intensity. The main findings and conclusions are as follows:
First, whether a given network is an internal or an external network of manufacturing, the general characteristics of the input and output of embodied energy across various industries are similar. The total inputs and outputs of embodied energy in most industries are small, and the convergence and conduction of most embodied energy is concentrated within a few industries. The internal and external networks of manufacturing have generally maintained this characteristic while evolving. Moreover, this property reveals that industries with stronger embodied energy convergence and conductivity are generally more likely to be associated with industries with weaker convergence and conductivity.
Second, the choice of the embodied energy flow path of various industries has the preference that may be summarized by the phrase ‘the rich get richer,’ and newly generated embodied energy flow paths are more likely to be selected for connection to a path of strong convergence or conductivity. These results reveal that preference selection is an important mechanism for the generation of embodied energy flow paths in Chinese manufacturing, and provide important theoretical support for the dynamic control and guidance of the flow of embodied energy over time, and the rational planning of energy allocation.
Third, the embodied energy flow patterns of the internal network of manufacturing mainly include the multi-focus convergence pattern and the two-focus convergence pattern. The embodied energy flow pattern of the external network of manufacturing is mainly characterized by the two-focus transmission pattern. In addition to the separate aggregation, high-end manufacturing, traditional manufacturing, and resource-based industries have also played important roles in the industry consolidation of communities of hybrid industry, while the consolidation of daily industries is weak. Additionally, within the in-edge network, communities of high-end manufacturing have gathered most of the embodied energy, while in the out-edge network, communities of traditional manufacturing have played a major role in transmitting embodied energy. The impacts of the internal and external networks types, and of the in-edge and out-edge types, on the stability of the embodied energy flow pattern are separate, and the embodied energy flow patterns are stable.
5.2. Policy Recommendations
According to these results on the emerging patterns and evolution of embodied energy flows in Chinese manufacturing, three main policy recommendations are proposed here.
First, deep understanding of the embodied energy convergence and transmission among industries inside and outside of Chinese manufacturing, innovative solutions to the contradiction between energy supply and demand, and the rational planning of energy allocation policies to support the transformation, upgrading, and sustainable development of manufacturing are needed. From the perspective of energy consumption, since the consumptions of various industries inside and outside of the manufacturing industry do not exist independently, each industry generates complex energy-related structural forms based on the embodied energy flow. Therefore, it is necessary to allow full play to market mechanisms and government macroeconomic control functions, and create favorable conditions for optimizing the energy consumption distribution structure of the industrial sector by using energy linkages.
Secondly, based on the correlation of embodied energy that exists between various industries inside and outside of the manufacturing industry, the concept of industrial energy allocation planning should be revised, and a scientific industrial energy allocation planning method should be devised. In order to solve the increasingly serious energy shortages and resolve the energetic and environmental constraints, in addition to accelerating the adjustment of energy production structures and improving energy utilization efficiencies, under the premise of limited energy supplies and energy consumption constraints, it is also necessary to scientifically plan the energy allocations of various manufacturing industries from the perspective of energy consumption [42]. Due to the correlation of the embodied energy consumption between the internal and external industries of manufacturing, when planning the energy supplies of various manufacturing industries, it is necessary to consider not only the energy supply, but also the characteristics of the embodied energy-related structure of the industries inside and outside of the manufacturing industry, and the impact of the energy flow pattern on the energy supply.
Finally, in planning the energy allocation of various manufacturing industries, key industries must be distinguished, so as not to focus on each industry. Meanwhile, no industry can be considered in isolation. Instead, the ‘energy-related industrial clusters’ model should be used to understand the emerging energy flows in Chinese manufacturing. This model may also play a role in the energy convergence and transmission of key industrial sectors, and in realizing synergy among the clusters of the network based on the correlations generated by the embodied energy flow network, so as to positively influence the scientific planning of energy flows for sustainable development of the manufacturing industry in China.
Author Contributions
Conceptualization, Z.F.; Data curation, W.Z.; Formal analysis, Z.F.; Methodology, W.Z.; Writing—original draft, Q.M.; Writing—review and editing, Q.M.
Funding
This research was funded by [the National Natural Science Foundation of China] grant number [71603048], [the Foundation of College’s Key Research base on Humanities and Social Science in Guangdong Province] grant number [2016WZJD005], [Quality and Brand Development Research Center in Dongguan University of Technology] grant number [GB200101], [Innovation and Strong School Project in Higher Education] grant number [2016GXJK157], and The APC was funded by [71603048].
Acknowledgments
All researchers are also grateful to the Associate Editor and all reviewers who proposed the constructive comments, which helped greatly to improve our paper.
Conflicts of Interest
The author declares that there are no conflicts of interest.
References
- Zeng, B.; Duan, H.; Bai, Y.; Meng, W. Forecasting the output of shale gas in China using an unbiased grey model and weakening buffer operator. Energy 2018, 151, 238–249. [Google Scholar] [CrossRef]
- Tian, Y.; Xiong, S.; Ma, X.; Ji, J. Structural path decomposition of carbon emission: A study of China’s manufacturing industry. J. Clean. Prod. 2018, 193, 563–574. [Google Scholar] [CrossRef]
- National Bureau of Statistics of China. China Statistical Yearbook; National Bureau of Statistics of China: Beijing, China, 2017.
- Zeng, B.; Zhou, M.; Zhang, J. Forecasting the Energy Consumption of China’s Manufacturing Using a Homologous Grey Prediction Model. Sustainability 2017, 9, 1975. [Google Scholar] [CrossRef]
- Hou, J.; Chen, H.; Xu, J. External Knowledge Sourcing and Green Innovation Growth with Environmental and Energy Regulations: Evidence from Manufacturing in China. Sustainability 2017, 9, 342. [Google Scholar] [CrossRef]
- Chen, X.; Gong, Z. DEA Efficiency of Energy Consumption in China’s Manufacturing Sectors with Environmental Regulation Policy Constraints. Sustainability 2017, 9, 210. [Google Scholar] [CrossRef]
- Lin, B.; Zhang, G. Can Industrial Restructuring Significantly Reduce Energy Consumption? Evidence from China. Emerg. Mark. Financ. Trade 2018, 5, 1082–1095. [Google Scholar] [CrossRef]
- Zhang, J.; Jiang, H.; Liu, G.; Zeng, W. A Study on The Contribution of Industrial Restructuring to Reduction of Carbon Emissions in China During the Five Five-Year Plan Periods. J. Clean. Prod. 2018, 176, 629–635. [Google Scholar] [CrossRef]
- An, Q.; An, H.; Wang, L.; Gao, X.; Lv, N. Analysis of Embodied Exergy Flow between Chinese Industries Based on Network Theory. Ecol. Model. 2015, 318, 26–35. [Google Scholar] [CrossRef]
- Chen, B.; Li, J.; Wu, X.; Han, M.; Zeng, L.; Li, Z.; Chen, G. Global Energy Flows Embodied in International Trade: A Combination of Environmentally Extended Input-Output Analysis and Complex Network Analysis. Appl. Energy 2018, 210, 98–107. [Google Scholar] [CrossRef]
- Sun, X.; An, H.; Gao, X.; Jia, X.; Liu, X. Indirect Energy Flow between Industrial Sectors in China: A Complex Network Approach. Energy 2016, 94, 195–205. [Google Scholar] [CrossRef]
- Liu, H.; Xi, Y.; Guo, J.E.; Li, X. Energy Embodied in the International Trade of China: An Energy Input–Output Analysis. Energy Policy 2010, 38, 3957–3964. [Google Scholar] [CrossRef]
- Tao, F.; Xu, Z.; Duncan, A.A.; Xia, X.; Wu, X.; Li, J. Driving Forces of Energy Embodied in China-EU Manufacturing Trade from 1995 to 2011. Resour. Conserv. Recyl. 2018, 136, 324–334. [Google Scholar] [CrossRef]
- Yang, R.; Long, R.; Yue, T.; Shi, H. Calculation of Embodied Energy in Sino-USA Trade: 1997–2011. Energy Policy 2014, 72, 110–119. [Google Scholar] [CrossRef]
- Liu, H.; Liu, C.; Chen, M. Inter-Industry Transmission Network and Coordinated Emission Reduction of Industrial CO2 Emissions in China. China Pop. Resour. Environ. 2016, 4, 90–99. [Google Scholar]
- Shi, J.; Li, H.; Guan, J.; Sun, X.; Guan, Q.; Liu, X. Evolutionary Features of Global Embodied Energy Flow between Sectors: A Complex Network Approach. Energy 2017, 140, 395–405. [Google Scholar] [CrossRef]
- Chen, G.Q.; Wu, X.F. Energy Overview for Globalized World Economy: Source, Supply Chain and Sink. Renew. Sustain. Energy Rev. 2017, 69, 735–749. [Google Scholar] [CrossRef]
- Chen, Z.M.; Chen, G.Q. Demand-Driven Energy Requirement of World Economy 2007: A Multi-Region Input–Output Network Simulation. Commun. Nonlinear Sci. 2013, 18, 1757–1774. [Google Scholar] [CrossRef]
- Gao, C.; Su, B.; Sun, M.; Zhang, X.; Zhang, Z. Interprovincial Transfer of Embodied Primary Energy in China: A Complex Network Approach. Appl. Energy 2018, 215, 792–807. [Google Scholar] [CrossRef]
- Hao, X.; An, H.; Qi, H.; Gao, X. Evolution of the Exergy Flow Network Embodied in the Global Fossil Energy Trade: Based on Complex Network. Appl. Energy 2016, 162, 1515–1522. [Google Scholar] [CrossRef]
- Rocco, M.V.; Di Lucchio, A.; Colombo, E. Exergy Life Cycle Assessment of Electricity Production from Waste-To-Energy Technology: A Hybrid Input-Output Approach. Appl. Energy 2017, 194, 832–844. [Google Scholar] [CrossRef]
- Miller, J.; Foxon, T.J.; Sorrell, S. Exergy Accounting: A Quantitative Comparison of Methods and Implications for Energy-Economy Analysis. Energies 2016, 9, 947. [Google Scholar] [CrossRef]
- May, G.; Stahl, B.; Taisch, M.; Kiritsis, D. Energy Management in Manufacturing: From Literature Review to A Conceptual Framework. J. Clean. Prod. 2017, 167, 1464–1489. [Google Scholar] [CrossRef]
- Jovanović, B.; Filipović, J.; Bakić, V. Energy Management System Implementation in Serbian Manufacturing–Plan-Do-Check-Act Cycle Approach. J. Clean. Prod. 2017, 162, 1144–1156. [Google Scholar] [CrossRef]
- Kara, S.; Manmek, S.; Herrmann, C. Global Manufacturing and the Embodied Energy of Products. CIRP Ann. 2010, 59, 29–32. [Google Scholar] [CrossRef]
- Kara, S.; Ibbotson, S. Embodied Energy of Manufacturing Supply Chains. CIRP J. Manuf. Sci. Technol. 2011, 4, 317–323. [Google Scholar] [CrossRef]
- Andersen, J.P.; Hyman, B. Energy and Material Flow Models for the US Steel Industry. Energy 2001, 26, 137–159. [Google Scholar] [CrossRef]
- Zeng, B.; Liu, S. A self-adaptive intelligence gray prediction model with the optimal fractional order accumulating operator and its application. Math. Method Appl. Sci. 2017, 23, 1–15. [Google Scholar] [CrossRef]
- Zeng, B.; Li, C. Improved multi-variable grey forecasting model with a dynamic background-value coefficient and its application. Comput. Ind. Eng. 2018, 118, 278–290. [Google Scholar] [CrossRef]
- Zeng, B.; Tan, Y.; Xu, H.; Quan, J.; Wang, L.; Zhou, X. Forecasting the Electricity Consumption of CommercialSector in Hong Kong Using a Novel Grey Dynamic Prediction Model. J. Grey Syst. 2018, 30, 157–172. [Google Scholar]
- An, Q.; An, H.; Wang, L. Analysis of Embodied Energy Flow Network between Chinese Industries. J. Syst. Eng. 2014, 6, 754–762. [Google Scholar]
- Wang, X.; Li, X.; Chen, G. Introduction to Network Science; Higher Education Press: Beijing, China, 2012. [Google Scholar]
- National Bureau of Statistics of China. China Input-Output Table; National Bureau of Statistics of China: Beijing, China, 2018.
- National Bureau of Statistics of China. China Energy Statistics Yearbook; National Bureau of Statistics of China: Beijing, China, 2013.
- National Bureau of Statistics of China. China Energy Statistics Yearbook; National Bureau of Statistics of China: Beijing, China, 2005.
- Zhu, Q.; Sun, H.; Wang, S. The Relationship between China’s Resource-Based Industries and Manufacturing Carbon Emissions and Industrial Economic Development. China Pop. Resour. Environ. 2014, 11, 112–119. [Google Scholar]
- Kolaczyk, E.D.; Csardi, G. Statistical Analysis of Network Data with R; Springer: New York, NY, USA, 2014. [Google Scholar]
- Newman, M.E.J.; Girvan, M. Finding and Evaluating Community Structure in Networks. Phys. Rev. E 2004, 69, 026113. [Google Scholar] [CrossRef] [PubMed]
- Zhang, L.; Yin, Y.; Zhu, C. Research on Industry Importance Algorithm in Industrial Correlation Network: Based on Complex Network Centrality. J. Econ. Manag. 2014, 3, 96–102. [Google Scholar]
- Wilson, J.D.; Palowitch, J.; Bhamidi, S.; Nobel, A.B. Community Extraction in Multilayer Networks with Heterogeneous Community Structure. J. Mach. Learn. Res. 2017, 18, 5458–5506. [Google Scholar]
- Gauvin, L.; Panisson, A.; Cattuto, C. Detecting the Community Structure and Activity Patterns of Temporal Networks: A Non-Negative Tensor Factorization Approach. PLoS ONE 2014, 9, e86028. [Google Scholar] [CrossRef] [PubMed]
- Schulze, M.; Nehler, H.; Ottosson, M.; Thollander, P. Energy Management in Industry–A Systematic Review of Previous Findings and An Integrative Conceptual Framework. J. Clean. Prod. 2016, 112, 3692–3708. [Google Scholar] [CrossRef]
Figure 1.
Model of the embodied energy flow [31].
Figure 1.
Model of the embodied energy flow [31].
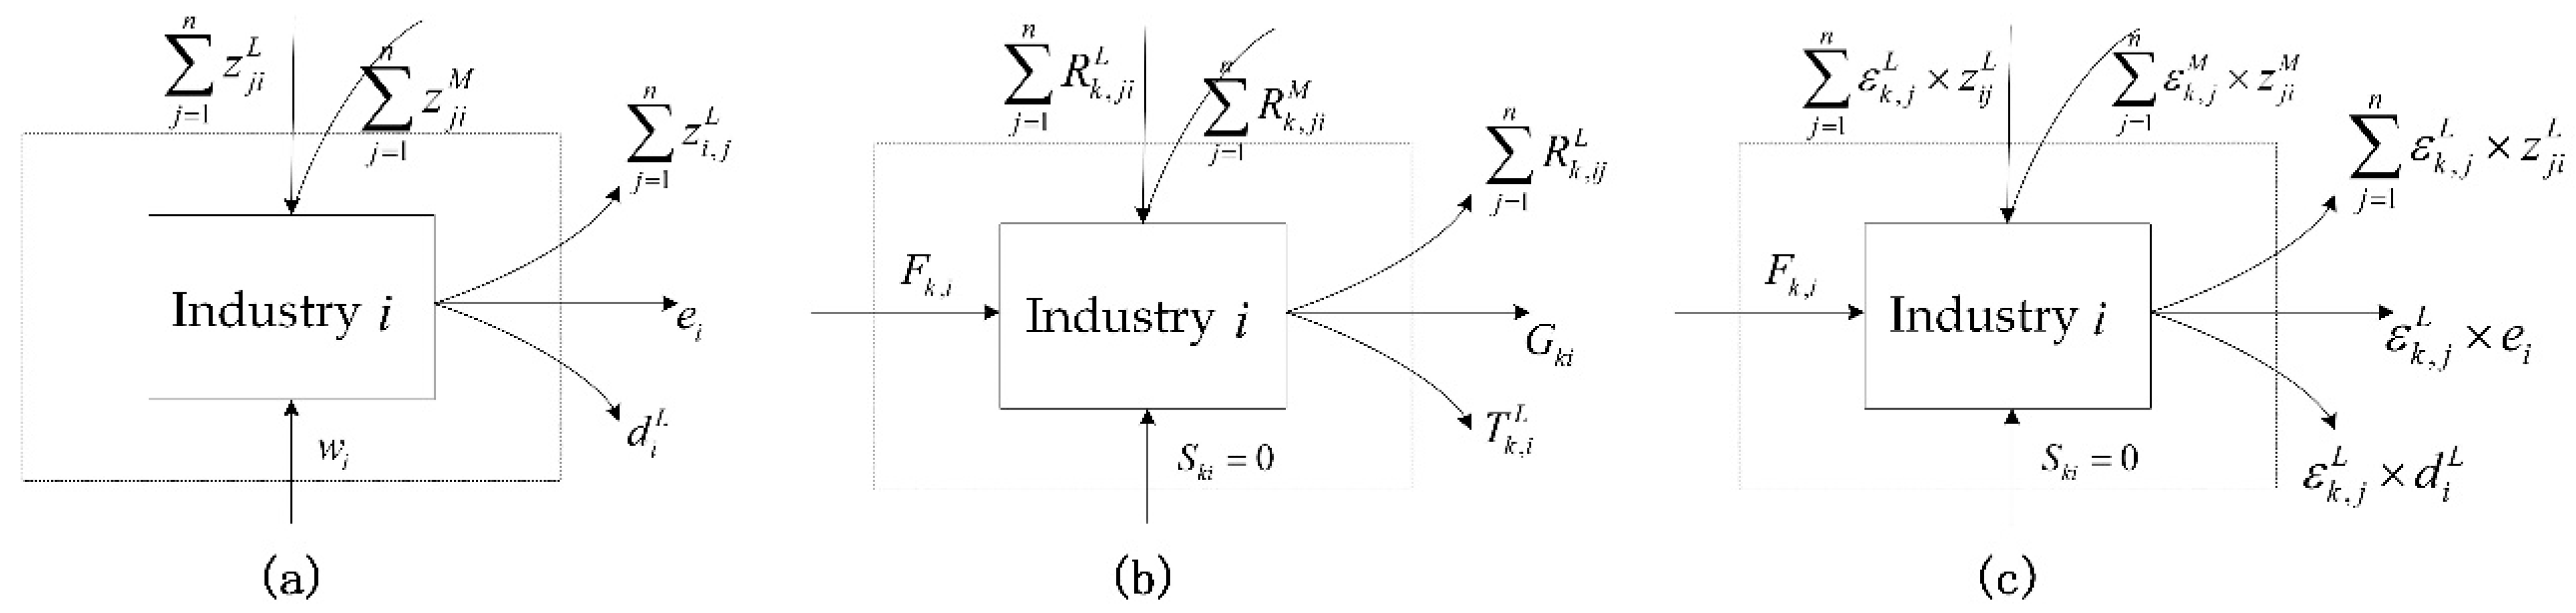
Figure 2.
Conceptual diagram of the change process of self-looping networks: (a) a network with self-loops, and (b) the change process from a self-looping network to a network only containing inner nodes.
Figure 2.
Conceptual diagram of the change process of self-looping networks: (a) a network with self-loops, and (b) the change process from a self-looping network to a network only containing inner nodes.

Figure 3.
Embodied energy flow network of the manufacturing industry in China during a base year (2002): (a,b) the in-edge network and out-edge network of the internal network of manufacturing, respectively; (c,d) the in-edge network and out-edge network of the external network of manufacturing, respectively.

Figure 4.
Node strength distribution of the embodied energy flow network of the manufacturing industry: (a) the node strength distribution of the internal network of manufacturing in five periods, including the years of 2002, 2005, 2007, 2010, and 2012, and (b) the same status, only in the external network of manufacturing.

Figure 5.
Top four industries of node strength in the embodied energy flow network of manufacturing industry. (a,b) The top 4 industries of node strength in the in-edge network and out-edge network of the internal network of manufacturing, respectively; (c,d) the same components, only in the external network of manufacturing. Colored circles represent different industries.
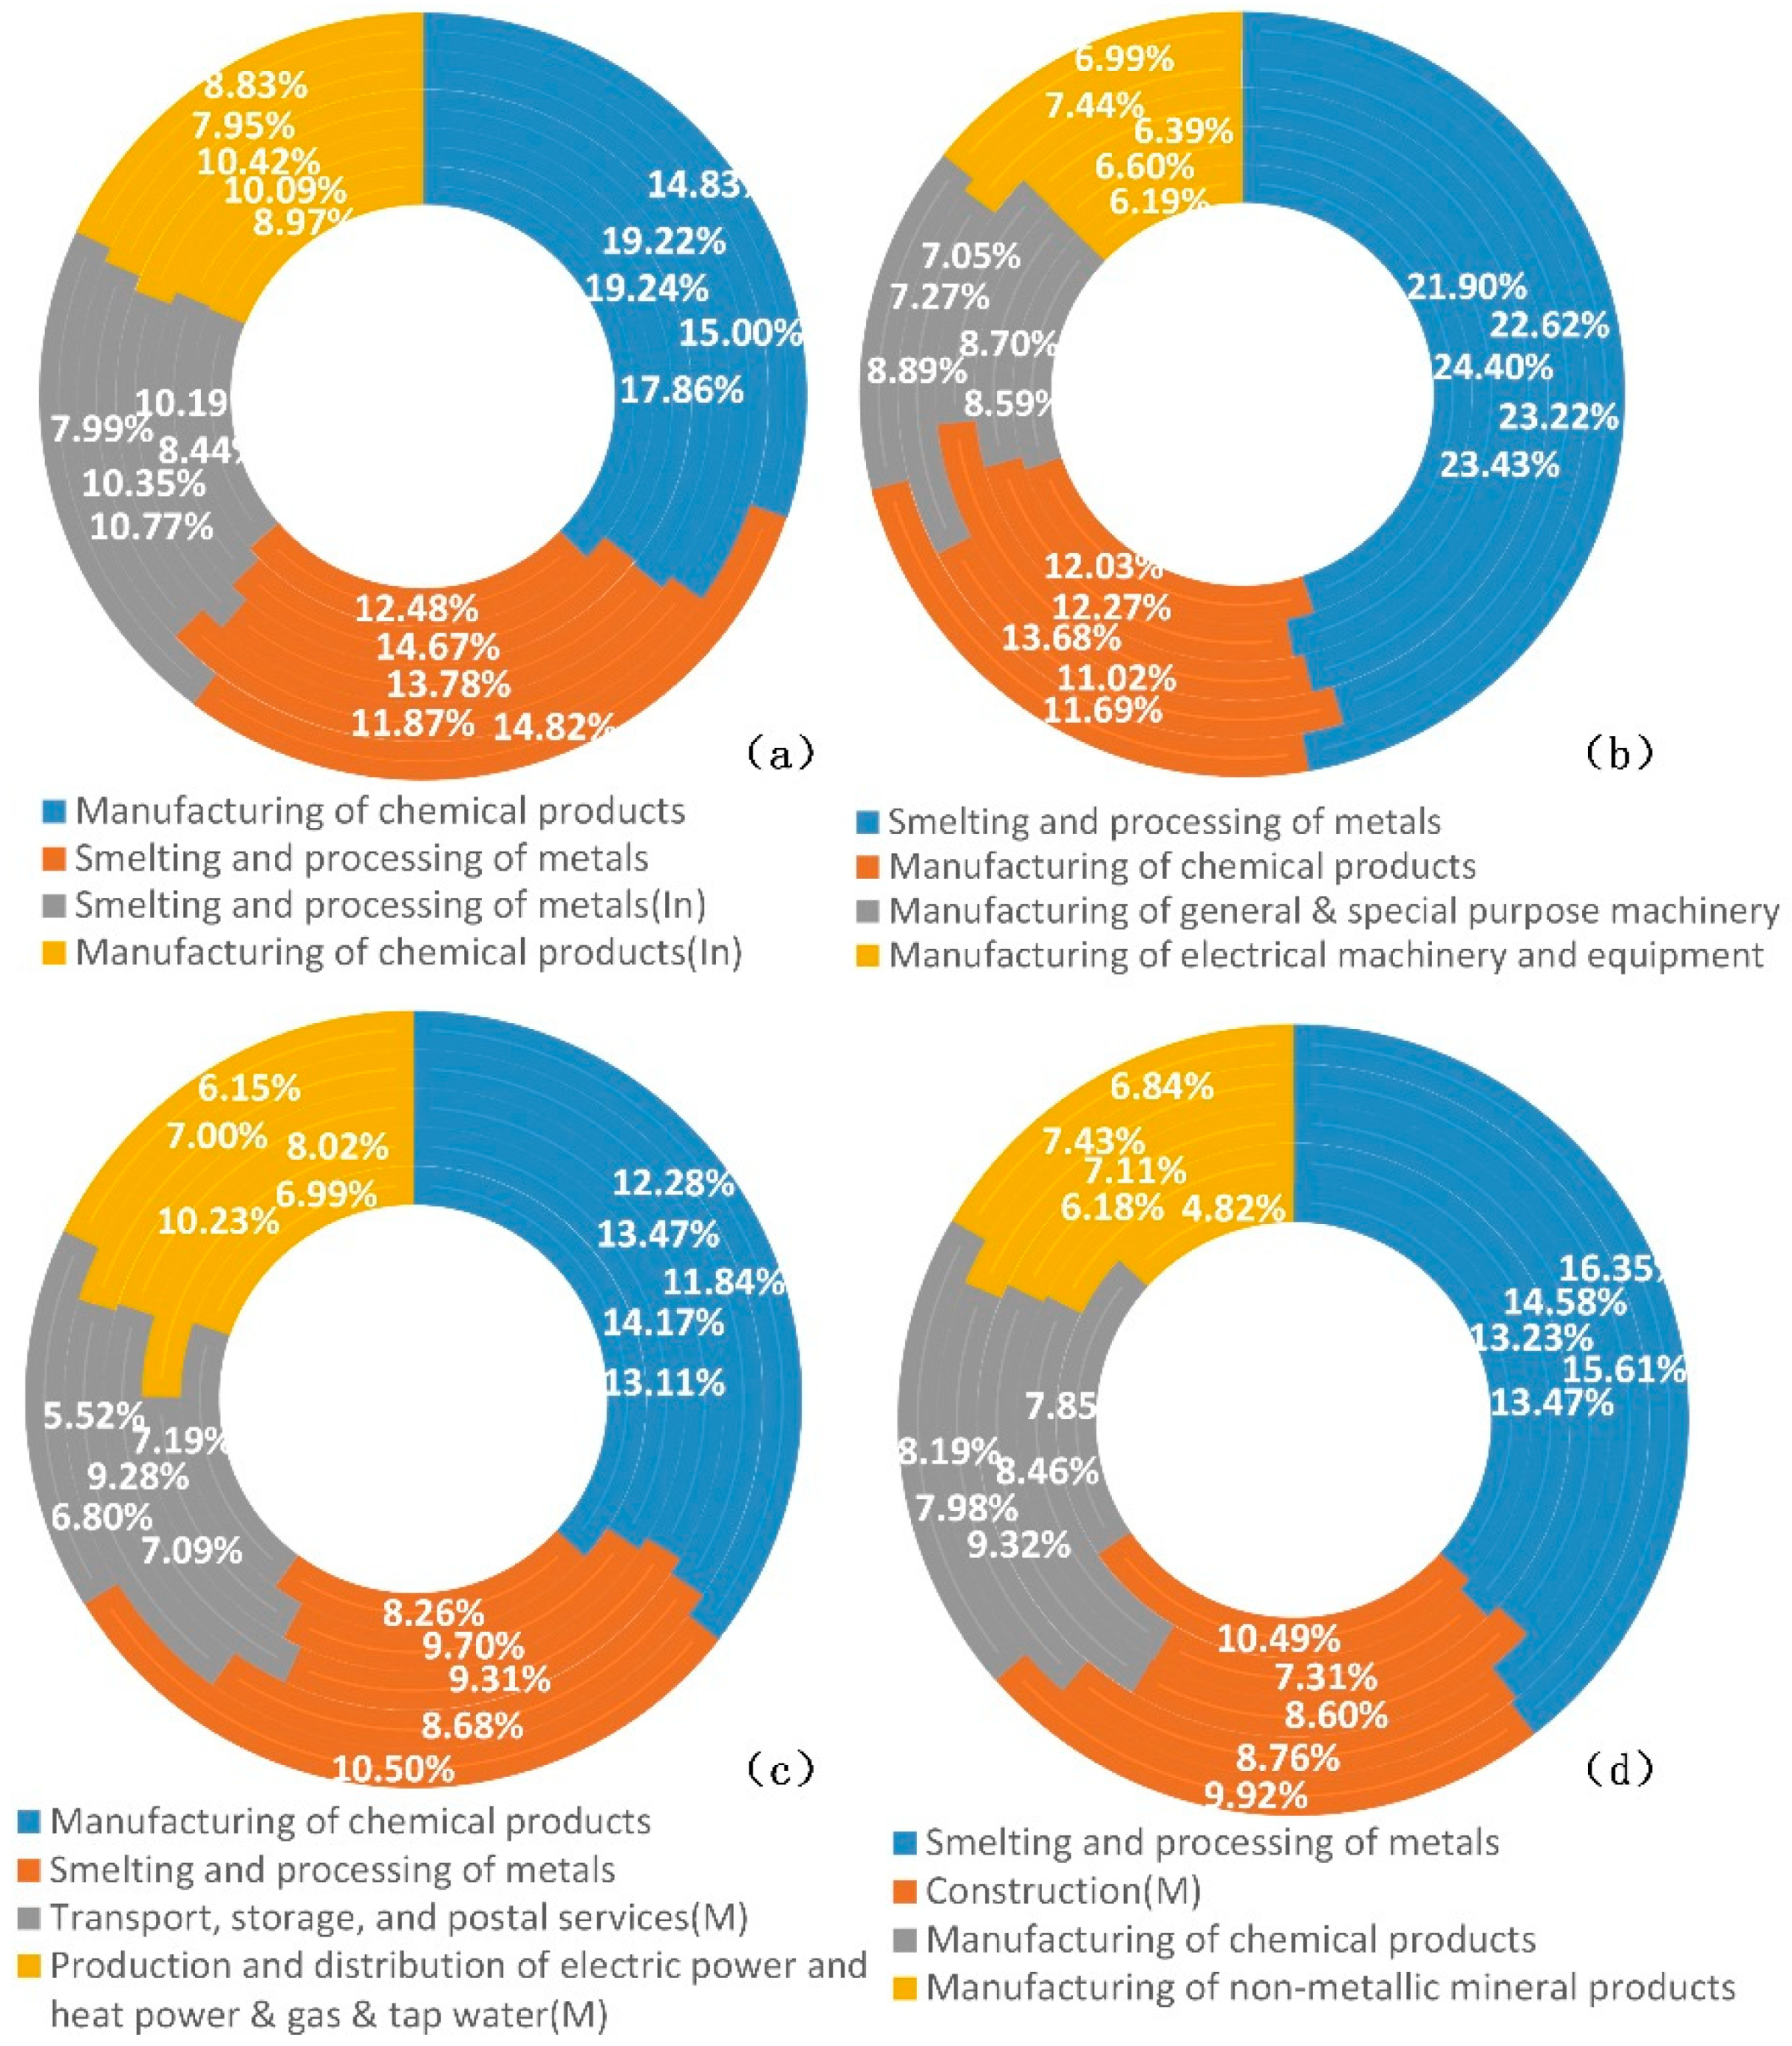
Figure 6.
Relationships between node strength and mean of the node strength of the neighbors in the embodied energy flow network of manufacturing: (a) the result of node strength vs. the mean node strength of the neighbors in the internal network of manufacturing in five periods, including the years of 2002, 2005, 2007, 2010, and 2012, and (b) the same status, only in the external network of manufacturing.

Figure 7.
Edge weight distribution of the embodied energy flow network of manufacturing: (a) the edge weight distribution of the internal network of manufacturing in five periods, including the years of 2002, 2005, 2007, 2010, and 2012; and (b) the same status, only in the external network of manufacturing.
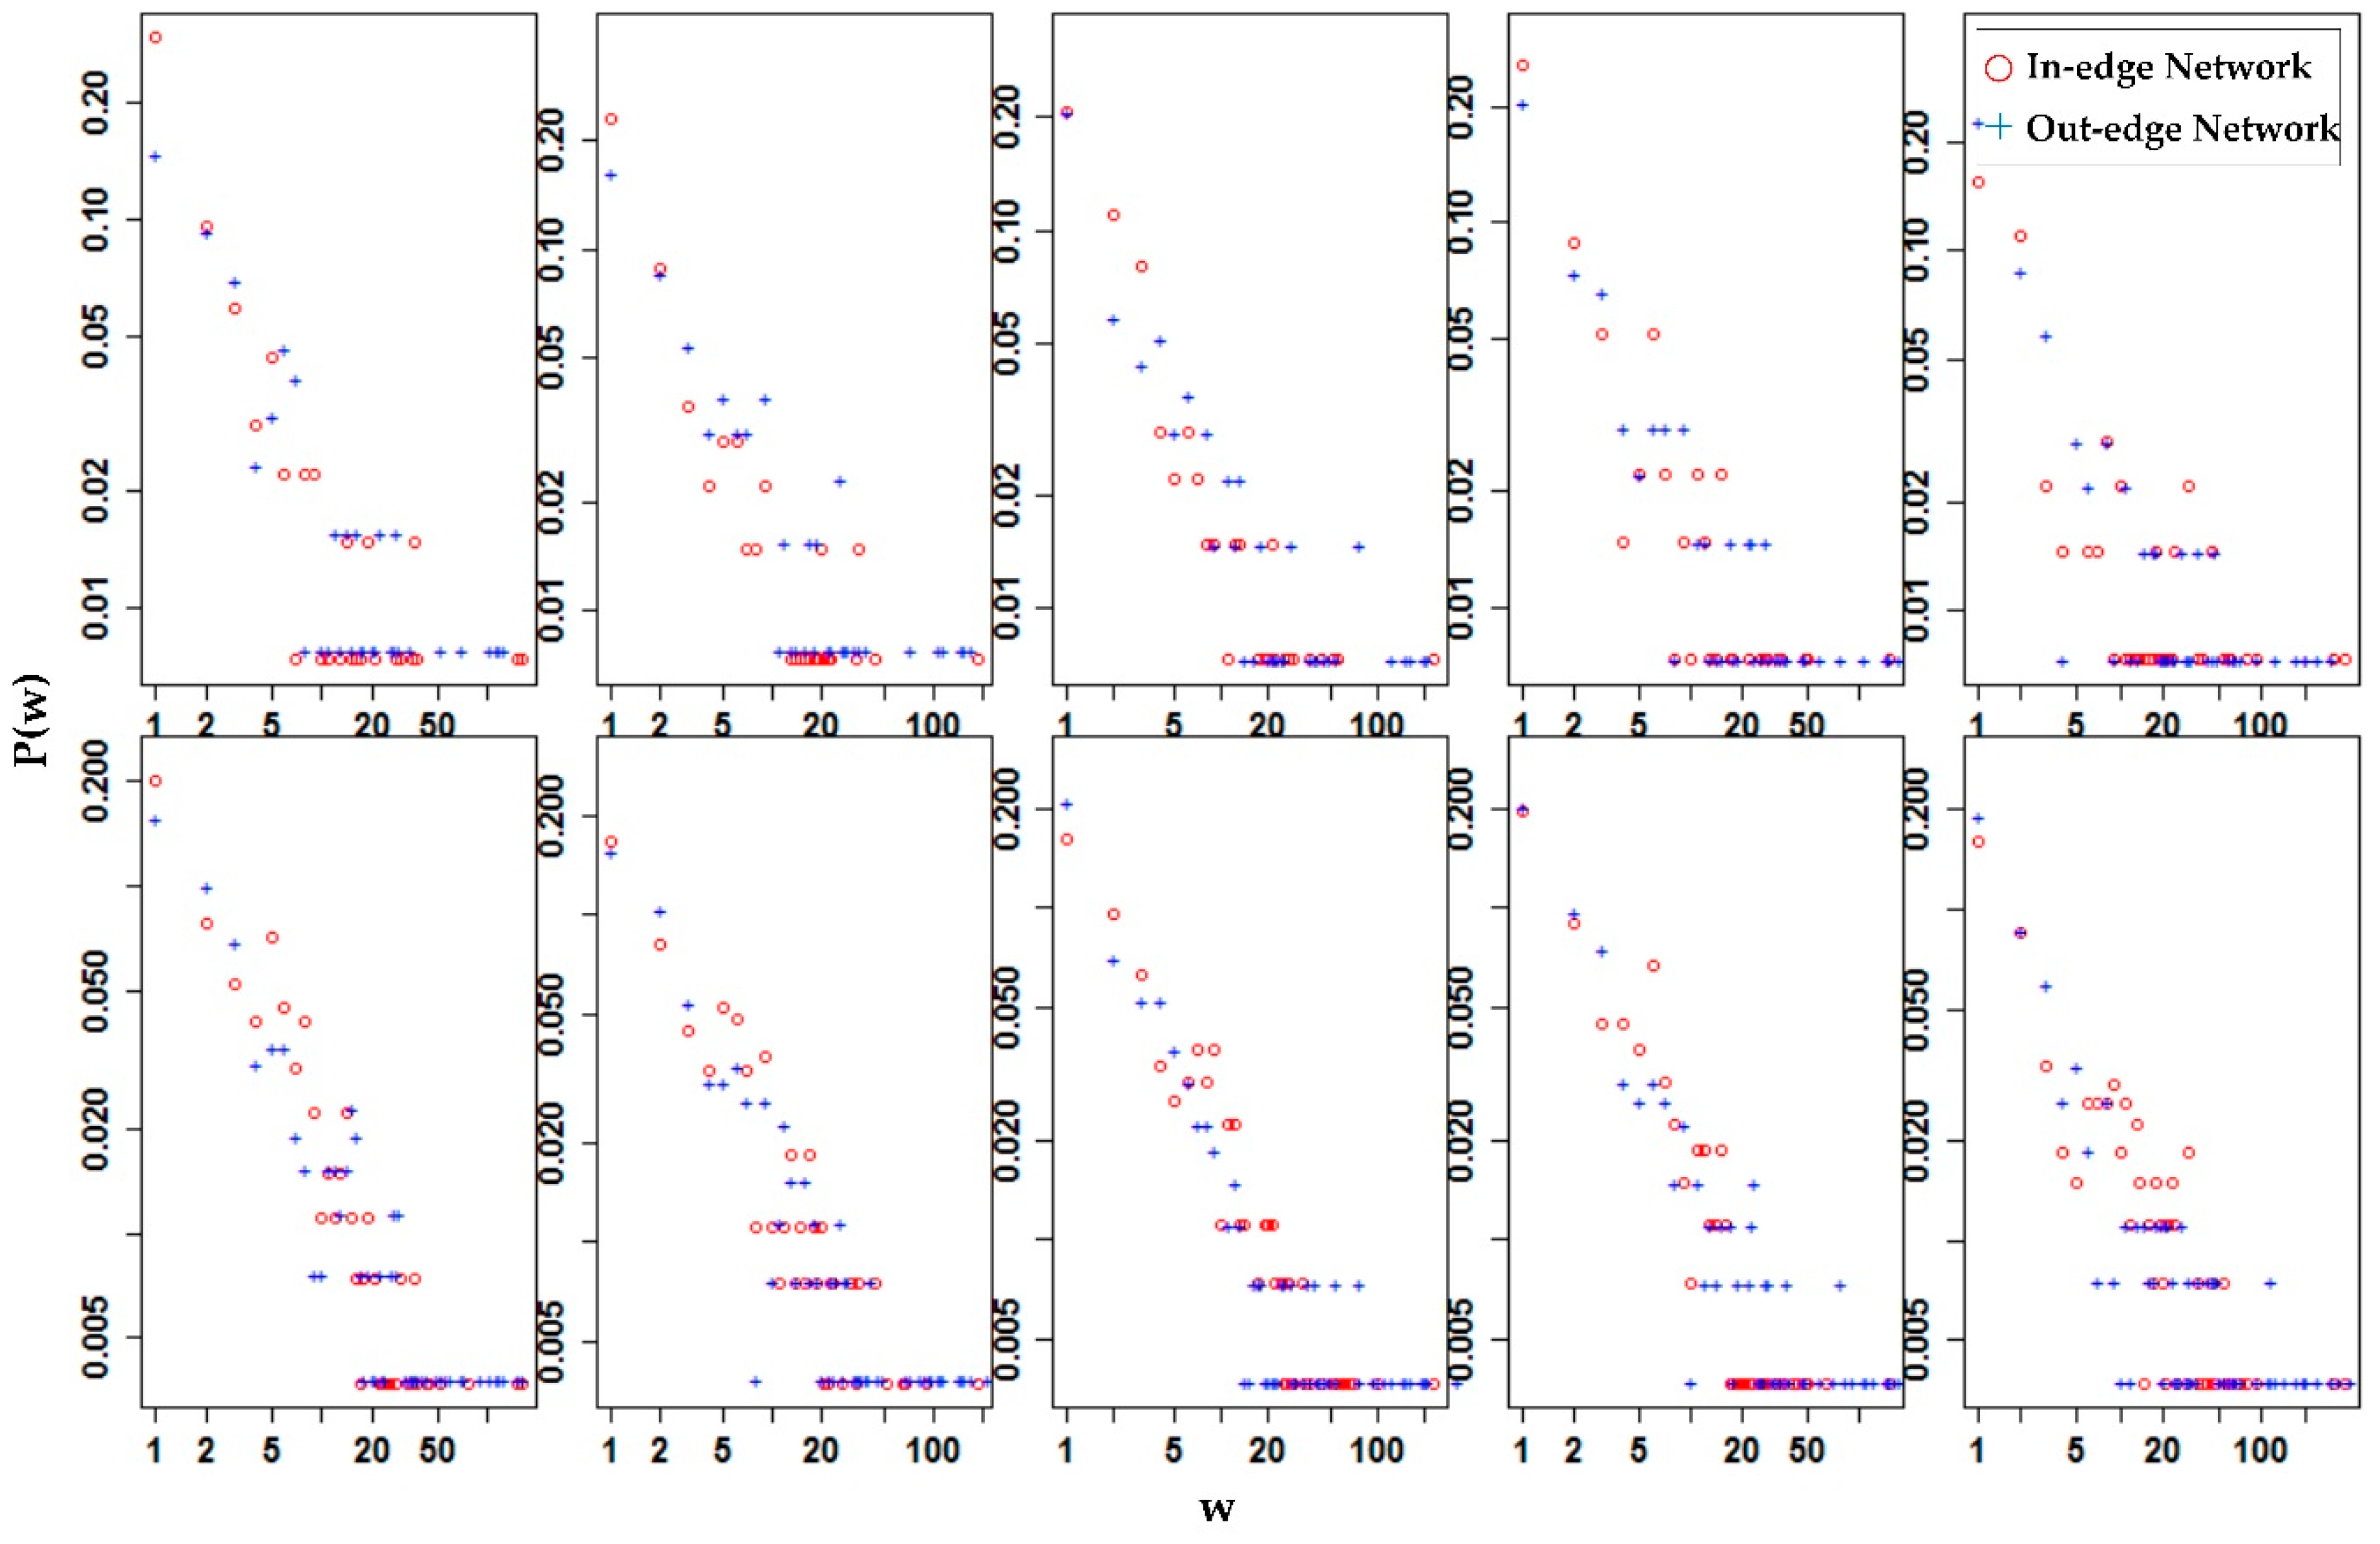
Figure 8.
Communities and embodied energy flow modes in the embodied energy flow network of manufacturing in the base year (2002): (a,b) the communities and embodied energy flow models of the in-edge network and out-edge network of the internal network of manufacturing, respectively; (c,d) the same components, only in the external network of manufacturing. Colored circles represent different communities.
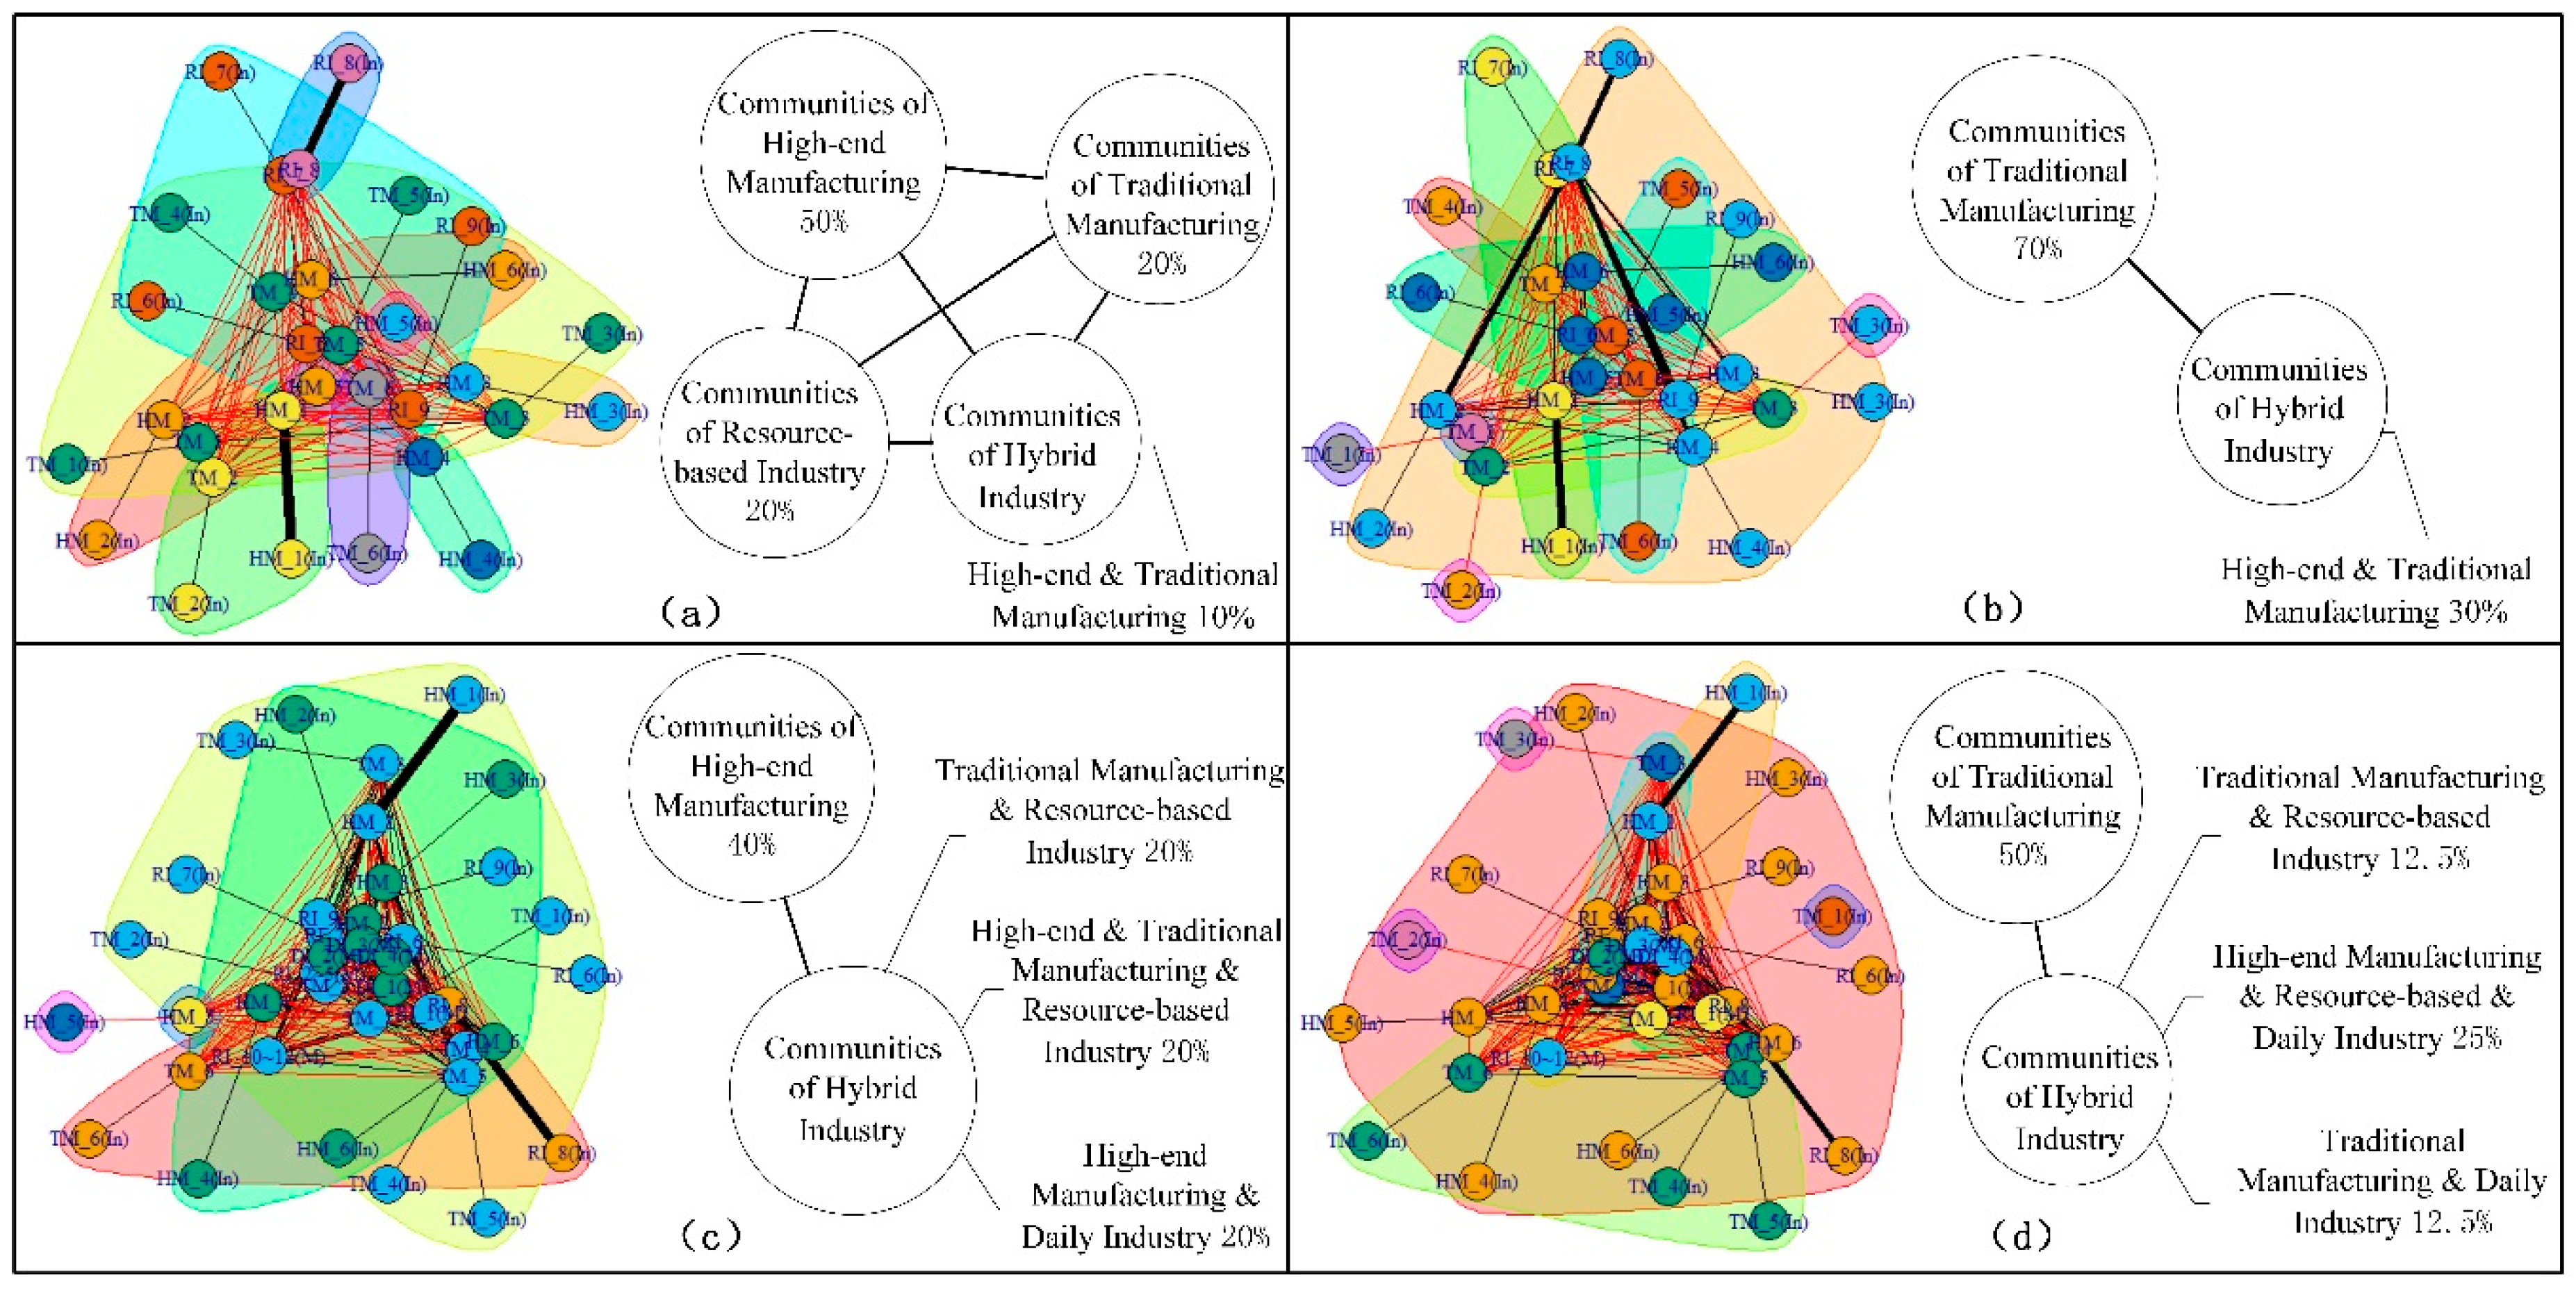
Figure 9.
Evolution of communities in the internal network of manufacturing for (a) the in-edge network, and (b) the out-edge network.
Figure 9.
Evolution of communities in the internal network of manufacturing for (a) the in-edge network, and (b) the out-edge network.
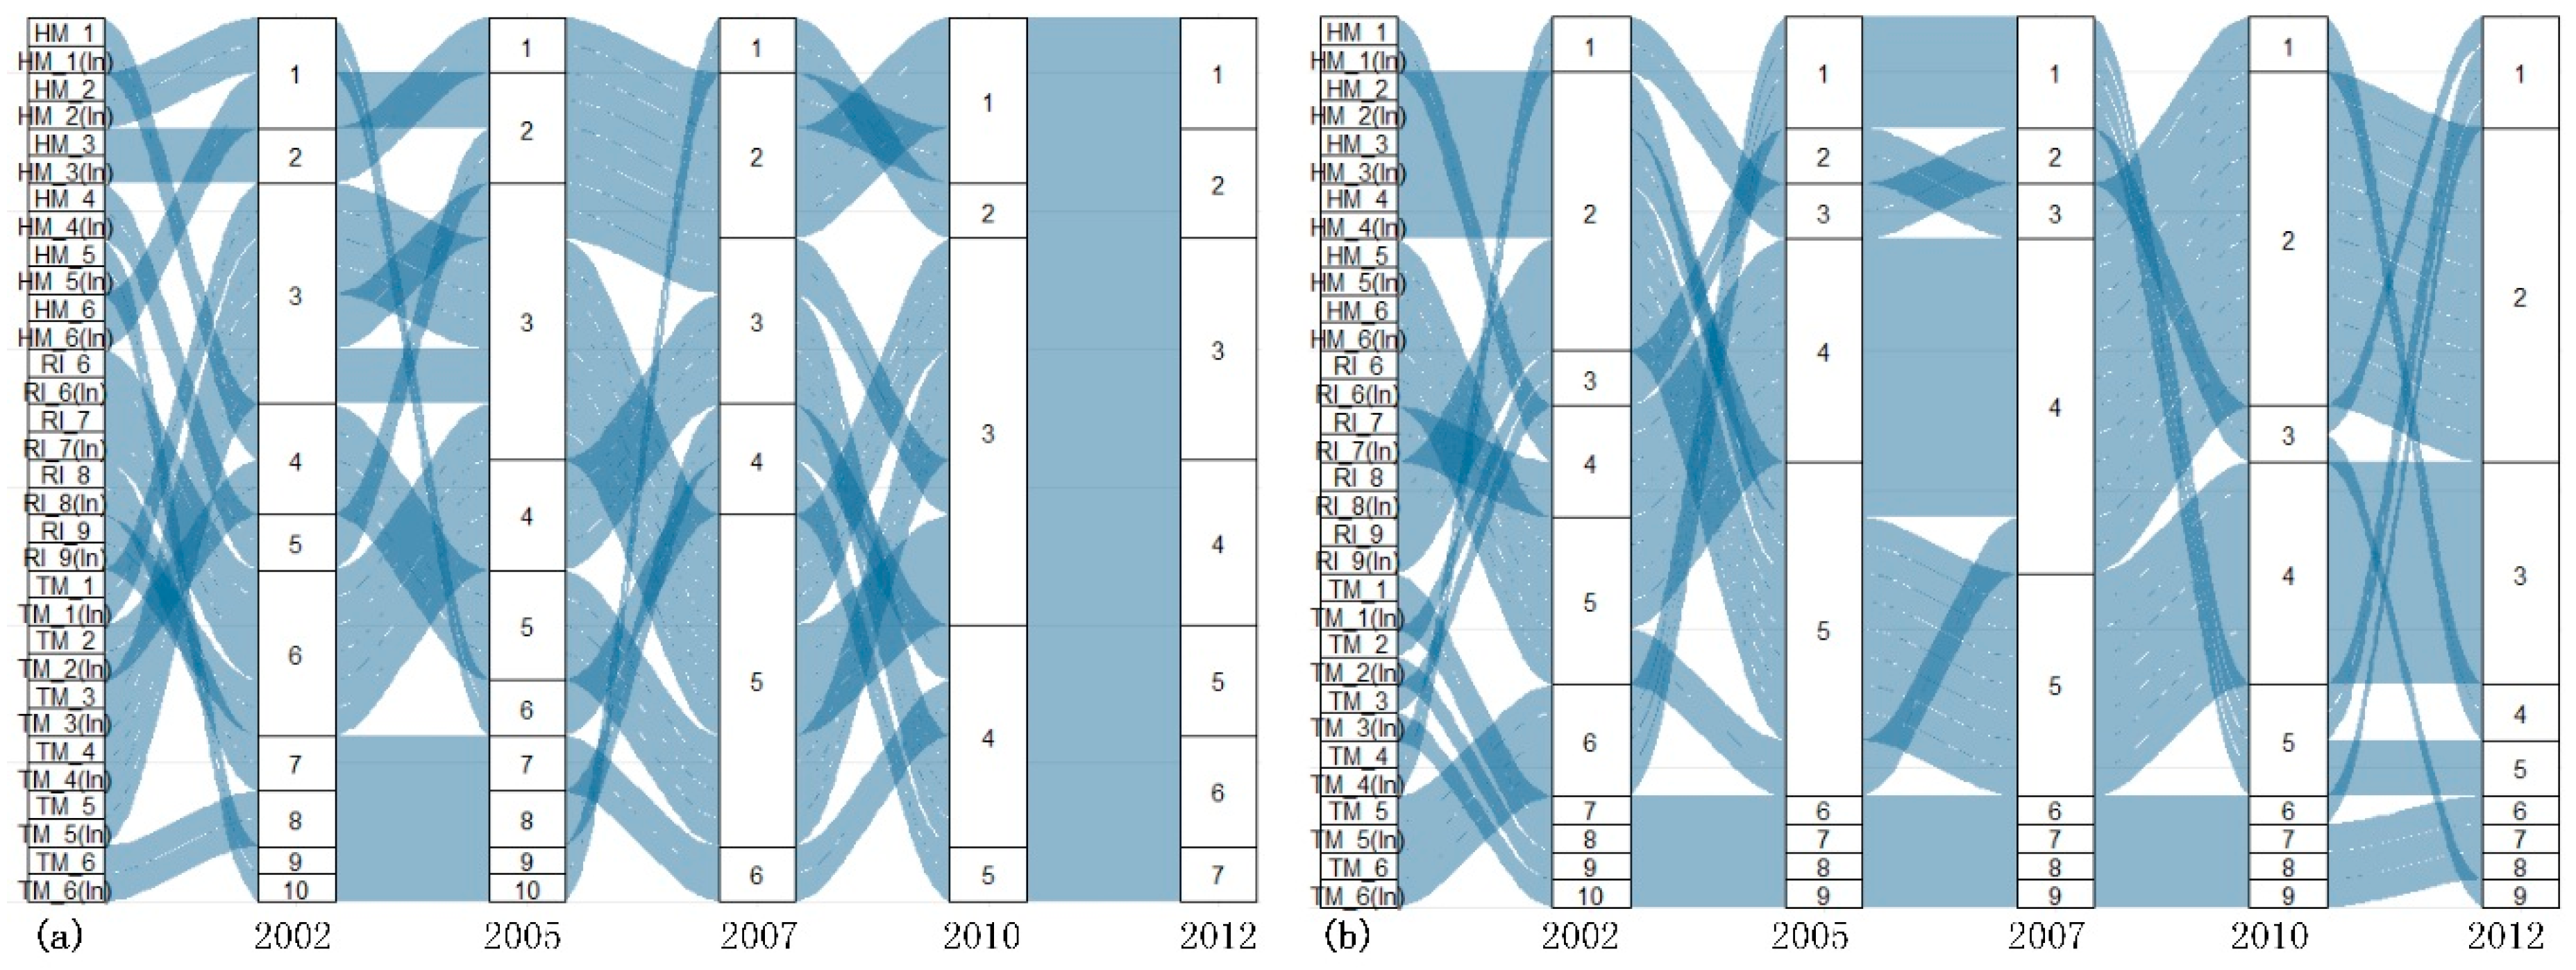
Figure 10.
Evolution of communities in the external network of manufacturing for (a) the in-edge network, and (b) the out-edge network.
Figure 10.
Evolution of communities in the external network of manufacturing for (a) the in-edge network, and (b) the out-edge network.
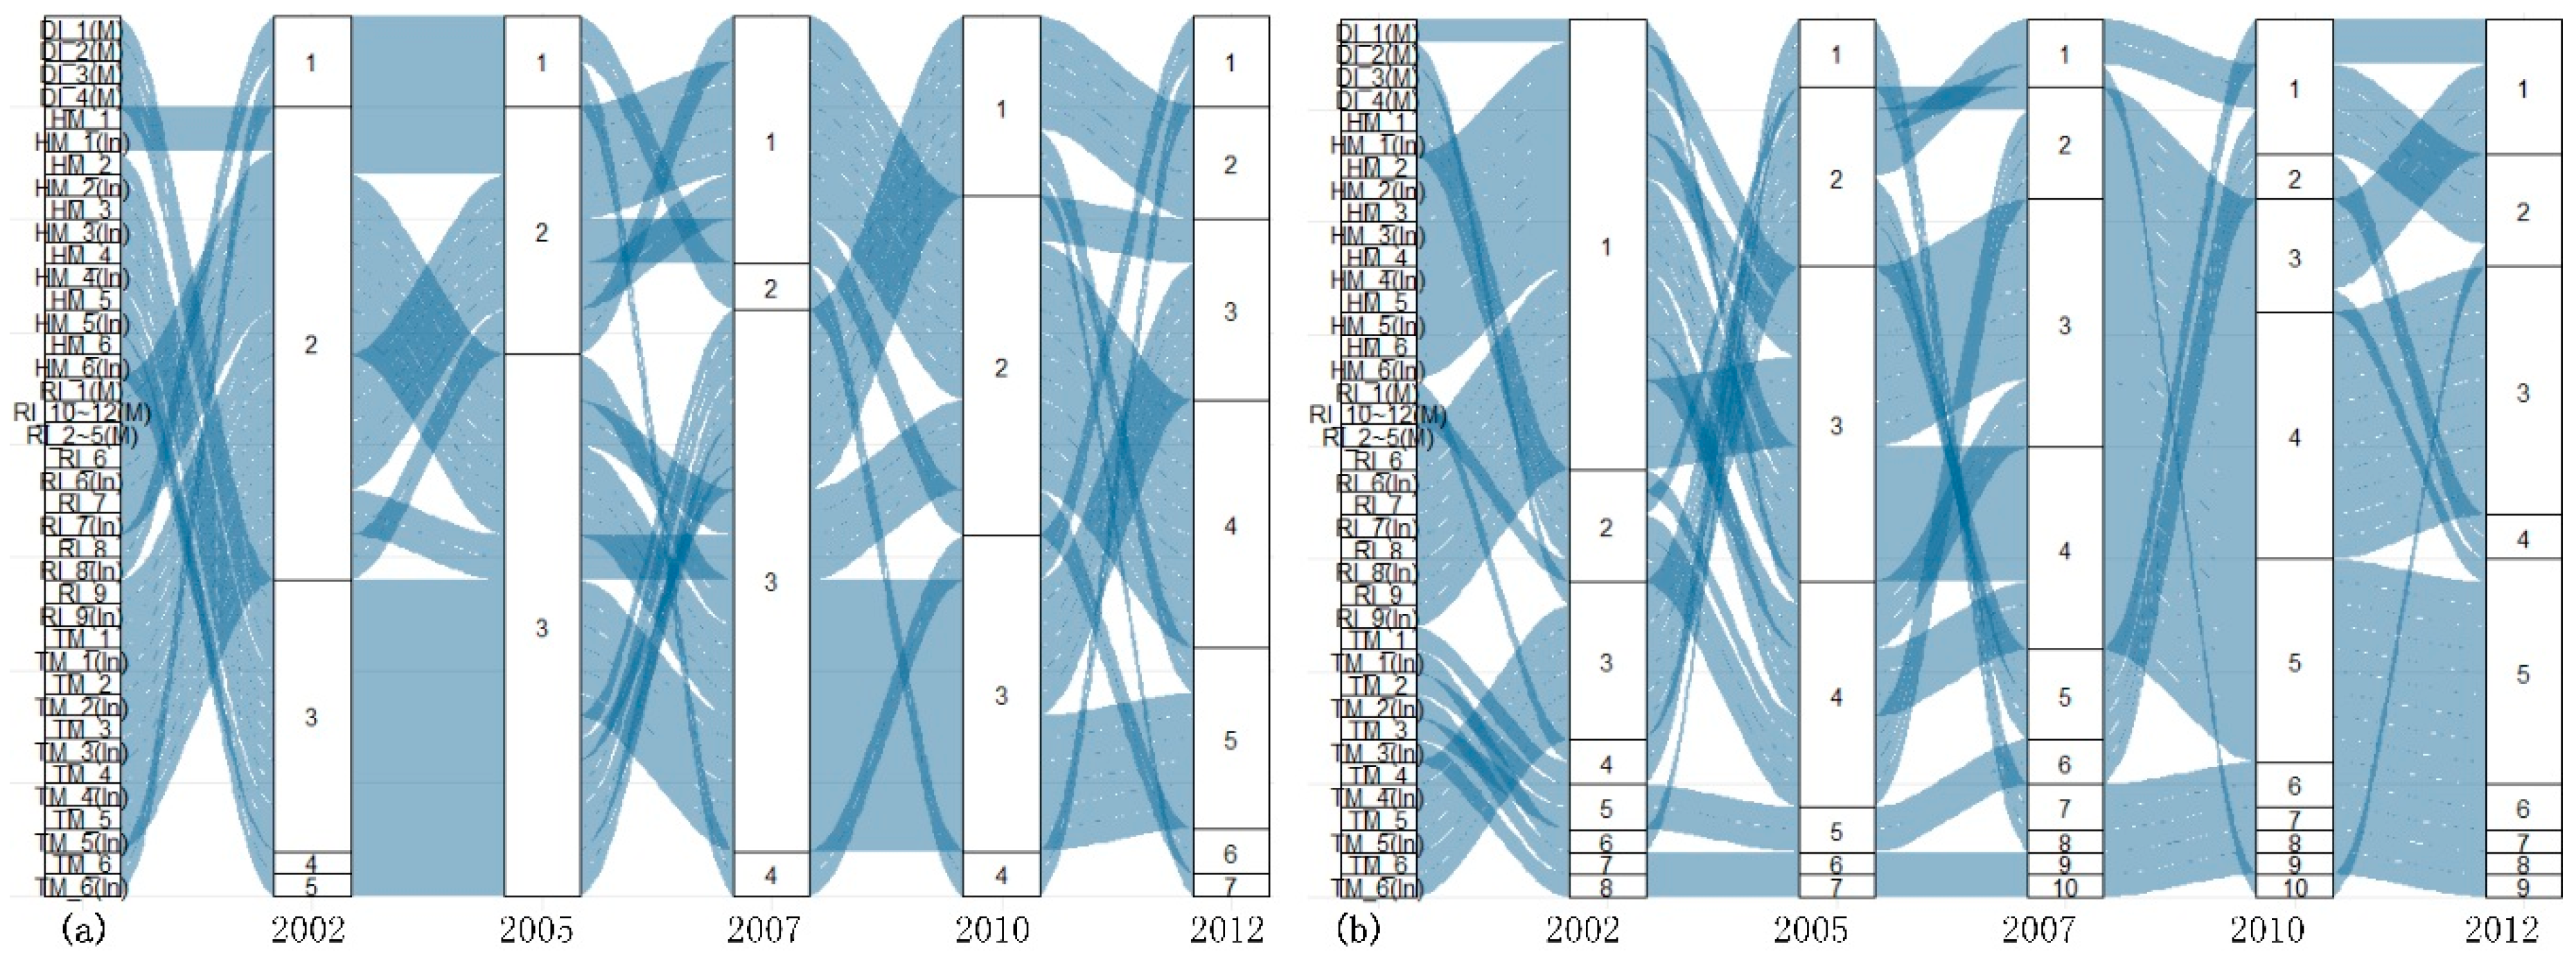
Figure 11.
Two-factor analysis between network types (I or II) and in-edge and out-edge networks, with the results of comparison in four pairs of periods: (a) 2002 and 2005, (b) 2002 and 2007, (c) 2002 and 2010, and (d) 2002 and 2012.
Figure 11.
Two-factor analysis between network types (I or II) and in-edge and out-edge networks, with the results of comparison in four pairs of periods: (a) 2002 and 2005, (b) 2002 and 2007, (c) 2002 and 2010, and (d) 2002 and 2012.

Table 1.
Adjusted subjects and classification.
| Type of Industry | Name of Industry | Abbrev. |
|---|---|---|
| High-end manufacturing | Manufacturing of chemical products | HM_1 |
| Manufacturing of general and special purpose machinery | HM_2 | |
| Manufacturing of transportation equipment | HM_3 | |
| Manufacturing of electrical machinery and equipment | HM_4 | |
| Manufacturing of communication equipment, computers, and other electronic equipment | HM_5 | |
| Manufacturing of measuring instruments and repair of metal products, machinery, and equipment | HM_6 | |
| Traditional manufacturing | Food and tobacco processing | TM_1 |
| Textile industry | TM_2 | |
| Manufacturing of leather, fur, and related products | TM_3 | |
| Processing of timber and furniture | TM_4 | |
| Manufacturing of paper, printing, and articles for cultural, educational, and sports activities | TM_5 | |
| Other manufacturing and comprehensive use of waste resources | TM_6 | |
| Resource-based industry | Agriculture, forestry, animal husbandry and fishery | RI_1 |
| Mining and washing of coal | RI_2 | |
| Extraction of petroleum and natural gas | RI_3 | |
| Mining and processing of metal ores | RI_4 | |
| Mining and processing of nonmetals and other ores | RI_5 | |
| Processing of petroleum, coking, and processing of nuclear fuel | RI_6 | |
| Manufacturing of non-metallic mineral products | RI_7 | |
| Smelting and processing of metals | RI_8 | |
| Manufacturing of metal products | RI_9 | |
| Production and distribution of electric power and heat power | RI_10 | |
| Production and distribution of gas | RI_11 | |
| Production and distribution of tap water | RI_12 | |
| Daily industry | Construction | DI_1 |
| Wholesale and retail trades and accommodation and catering | DI_2 | |
| Transport, storage, and postal services | DI_3 | |
| Others | DI_4 |
Table 2.
Structural features of the embodied energy flow network of manufacturing.
| Internal Network of Manufacturing | External Network of Manufacturing | |||
|---|---|---|---|---|
| In-Edge Network | Out-Edge Network | In-Edge Network | Out-Edge Network | |
| Node count | 32 | 32 | 39 | 39 |
| Edge count | 136 | 129 | 269 | 261 |
| Network density | 0.274 | 0.269 | 0.363 | 0.358 |
| Degree centrality | 0.242 | 0.248 | 0.242 | 0.248 |
| Closeness centrality | 0.033 | 0.036 | 0.032 | 0.033 |
| Betweenness centrality | 0.279 | 0.292 | 0.257 | 0.269 |
| Eigenvector centrality | 0.498 | 0.507 | 0.413 | 0.421 |
Table 3.
Top values of edge betweenness centrality in the embodied energy flow network of manufacturing by year.
Table 3.
Top values of edge betweenness centrality in the embodied energy flow network of manufacturing by year.
| 2002 | 2005 | 2007 | 2010 | 2012 | ||
|---|---|---|---|---|---|---|
| Internal network of manufacturing | In-edge network | TM_5-HM_6 | TM_4-HM_6 | RI_6-HM_5 | RI_6-HM_5 | TM_2-HM_5 |
| Betweenness | 60 | 108 | 136 | 144 | 152 | |
| Out-edge network | TM_1-HM_6 | TM_1-HM_6 | HM_6-TM_6 | TM_2-RI_6 | HM_6-TM_6 | |
| Betweenness | 220 | 220 | 148 | 148 | 144 | |
| External network of manufacturing | In-edge network | HM_6-DI_1(M) | HM_6-DI_1(M) | TM_4-HM_5 | TM_4-HM_5 | TM_2-HM_5 |
| Betweenness | 148 | 129 | 203 | 228 | 232 | |
| Out-edge network | HM_6-RI_1(M) | HM_6-RI_1(M) | RI_6-RI_1(M) | RI_6-RI_1(M) | RI_1(M)-RI_10~12(M) | |
| Betweenness | 380 | 361 | 312 | 332 | 243 |
Table 4.
Result of the analysis of variance of two-factor effects between network types andin-edge and out-edge networks, comparing multiple time periods.
Table 4.
Result of the analysis of variance of two-factor effects between network types andin-edge and out-edge networks, comparing multiple time periods.
| df | QS | MSE | F-Statistic | p-Value | ||
|---|---|---|---|---|---|---|
| Comparison between time periods 2005 and 2002 | Network type | 1 | 0.458 | 0.458 | 6.422 | 0.017 * |
| In-edge and out-edge network | 1 | 0.156 | 0.156 | 2.181 | 0.151 | |
| Network type: In-edge and Out-edge network | 1 | 0.165 | 0.165 | 2.312 | 0.139 | |
| Residuals | 29 | 2.068 | 0.071 | —— | —— | |
| Comparison between time periods 2007 and 2002 | Network type | 1 | 0.000 | 0.000 | 0.000 | 0.984 |
| In-edge and out-edge network | 1 | 1.682 | 1.682 | 33.426 | 2.9 × 10⁻⁶ *** | |
| Network type: In-edge and out-edge network | 1 | 0.063 | 0.063 | 1.249 | 0.273 | |
| Residuals | 29 | 1.459 | 0.050 | —— | —— | |
| Comparison between time periods 2010 and 2002 | Network type | 1 | 0.060 | 0.060 | 1.576 | 0.219 |
| In-edge and out-edge network | 1 | 2.020 | 2.020 | 52.719 | 5.38 × 10⁻⁸ *** | |
| Network type: In-edge and out-edge network | 1 | 0.011 | 0.011 | 0.290 | 0.594 | |
| Residuals | 29 | 1.111 | 0.038 | —— | —— | |
| Comparison between time periods 2012 and 2002 | Network type | 1 | 0.184 | 0.184 | 3.085 | 0.090 |
| In-edge and out-edge network | 1 | 0.596 | 0.596 | 10.015 | 0.004 ** | |
| Network type: In-edge and out-edge network | 1 | 0.021 | 0.021 | 0.351 | 0.558 | |
| Residuals | 29 | 1.725 | 0.060 | —— | —— | |
Notes: #, *, **, and *** indicate levels of significance at the 10%, 5%, 1%, and 0.1% confidence intervals, respectively; df = degrees of freedom; QS = quadratic sum; MSE = mean standard error.
Table 5.
Result of Levene’s test for equality of variances, comparing multiple time periods.
| df | F-Statistic | p-Value | ||
|---|---|---|---|---|
| Comparison between time periods 2005 and 2002 | Network type | 1/31 | 4.153 | 0.050 # |
| In-edge and out-edge network | 1/31 | 1.406 | 0.245 | |
| Comparison between time periods 2007 and 2002 | Network type | 1/31 | 0.215 | 0.646 |
| In-edge and out-edge network | 1/31 | 0.081 | 0.777 | |
| Comparison between time periods 2010 and 2002 | Network type | 1/31 | 0.036 | 0.852 |
| In-edge and out-edge network | 1/31 | 0.188 | 0.668 | |
| Comparison between time periods 2012 and 2002 | Network type | 1/31 | 1.501 | 0.230 |
| In-edge and out-edge network | 1/31 | 2.828 | 0.103 | |
Notes: #, *, **, and *** indicate levels of significance at the 10%, 5%, 1%, and 0.1% confidence intervals, respectively; df = degrees of freedom.
© 2019 by the authors. Licensee MDPI, Basel, Switzerland. This article is an open access article distributed under the terms and conditions of the Creative Commons Attribution (CC BY) license (http://creativecommons.org/licenses/by/4.0/).
Share and Cite
MDPI and ACS Style
Feng, Z.; Zhou, W.; Ming, Q. Embodied Energy Flow Patterns of the Internal and External Industries of Manufacturing in China. Sustainability 2019, 11, 438. https://doi.org/10.3390/su11020438
AMA Style
Feng Z, Zhou W, Ming Q. Embodied Energy Flow Patterns of the Internal and External Industries of Manufacturing in China. Sustainability. 2019; 11(2):438. https://doi.org/10.3390/su11020438
Chicago/Turabian StyleFeng, Zhijun, Wen Zhou, and Qian Ming. 2019. "Embodied Energy Flow Patterns of the Internal and External Industries of Manufacturing in China" Sustainability 11, no. 2: 438. https://doi.org/10.3390/su11020438
Note that from the first issue of 2016, this journal uses article numbers instead of page numbers. See further details here.