A Long-Term Analysis of Demographic Processes, Socioeconomic ‘Modernization’ and Forest Expansion in a European Country


1
Council for Agricultural Research and Economics (CREA), Viale Santa Margherita 80, I-52100 Arezzo, Italy
2
Department of Agricultural and Forestry Sciences (DAFNE), Tuscia University, Via San Camillo de Lellis, I-01100 Viterbo, Italy
*
Author to whom correspondence should be addressed.
Sustainability 2019, 11(2), 388; https://doi.org/10.3390/su11020388
Submission received: 24 October 2018
/
Revised: 26 December 2018
/
Accepted: 4 January 2019
/
Published: 14 January 2019
(This article belongs to the Special Issue Urbanization and Demographic Change: A New Step Ahead in Understanding of World Regional Complexity)
Abstract
:This article investigates long-term forest decline and expansion vis-à-vis demographic processes in Italy, evidencing changes in the underlying socioeconomic context considering the ‘modernization theory’. An exploratory data analysis of 58 indicators assessing five basic research dimensions (territory, demography, education, trade and agriculture) and evolving rapidly over the study period (1862–2009), was run to ascertain similarity patterns among indicators and to identify time intervals characterized by homogeneous conditions in different analysis’ domains. Complementing indicators of forest expansion, changes in population structure and dynamics allow an empirical investigation of temporal coherence among demographic and forest transitions in Italy. The time window encompassing the two World Wars, approximately between 1931 and 1951, was identified as a turning point in the forest-socioeconomic system, being characterized by two groups of indicators that follow diverging (linear vs. nonlinear) time trends. A secondary turning point was identified at the beginning of the 1970s. Distinct temporal trends in the studied indicators were also identified using multivariate statistics (before the 1930s, between the 1930s and the 1950s, between the 1950s and the 1970s, from the 1970s onwards) and represent conditions of dynamic equilibrium between socio-ecological contexts, highlighting latent transitions in both population and environment conditions. Our work definitely contributes to an empirical understanding of economic, political and social forces associated with forest transition and demographic transition in advanced economies.
1. Introduction
The latent interplay between population dynamics, socioeconomic context and environmental conditions has been frequently investigated in multifaceted research fields dealing with climate change, soil degradation, land-use, desertification, acid deposition and other key issues involving global, regional and local spatial scales [1]. Since ecological consequences of population growth became increasingly dynamic, the concept that environmental degradation increases in percentage to population size seems excessively optimistic, besides negative reactions of such relationship may trigger complex processes of land degradation [1,2]. In these regards, the ‘modernization’ represents a theory which hypothesizes a process-based alteration from out-of-date (and mainly underdeveloped) societies toward contemporary cultures with an innovative economy. With developmental progresses within societies, modernization is linked to: agricultural mechanization, industrial developments and the rapid shift towards more innovative services. The latter appear as pivotal forces in the process of economic expansion [3]. These transformations are chiefly apparent when revising the enduring expansion of a country (or a region) based on cultural, political and socioeconomic indicators [4].
‘Modernization’ theory emerged in the 1950s with the aim of explaining how industrial societies in North America and Western Europe developed due to socio-political and cultural consequences of economic growth. This theory postulates that societies evolve through predictable stages of increasing complexity. These stages proceed through non-linear transitions leading to articulated transformations of societal components [5]. Modernization theory also assumes economic development as depending on technology and additional socio-political, productive, cultural and institutional forces. These include—but are not limited to—increased development of transport, logistic, communication and mass media, levels of education, international trade, urbanization and demographic change, such as population aging, fertility decline and a progressive rearrangement of traditional families [6]. At the same time, the transition to modern economies oriented toward globalization, technology and high value-added services has both positive and negative environmental externalities. These were generally less studied in respect with the most widely investigated implications of economic growth in terms of social development and population dynamics [7].
However, it was hypothesized that significant response mechanisms of the modernization theory remain intimately linked with demographic transitions and ecological processes in a long-term perspective [2], justifying a comparative analysis of environmental and demographic contexts co-evolving together with socioeconomic development in each country or region. More specifically, the present study proposes an integrated analysis of consequences and implications of socioeconomic development under the assumption that demographic and environmental spheres are the most relevant dimensions responding to economic development and social change in the long run. This analysis identifies similarities and differences in temporal patterns of population changes and specific aspects of ecological change linked with forest dynamics—likely the most sensitive dimension to continuous economic expansion—with a specific focus on the European context. Long-term population and forest dynamics were investigated adopting two well-known interpretative frameworks (o theory): (i) the Demographic Transition (DT) and (ii) the Forest Transition (FT).
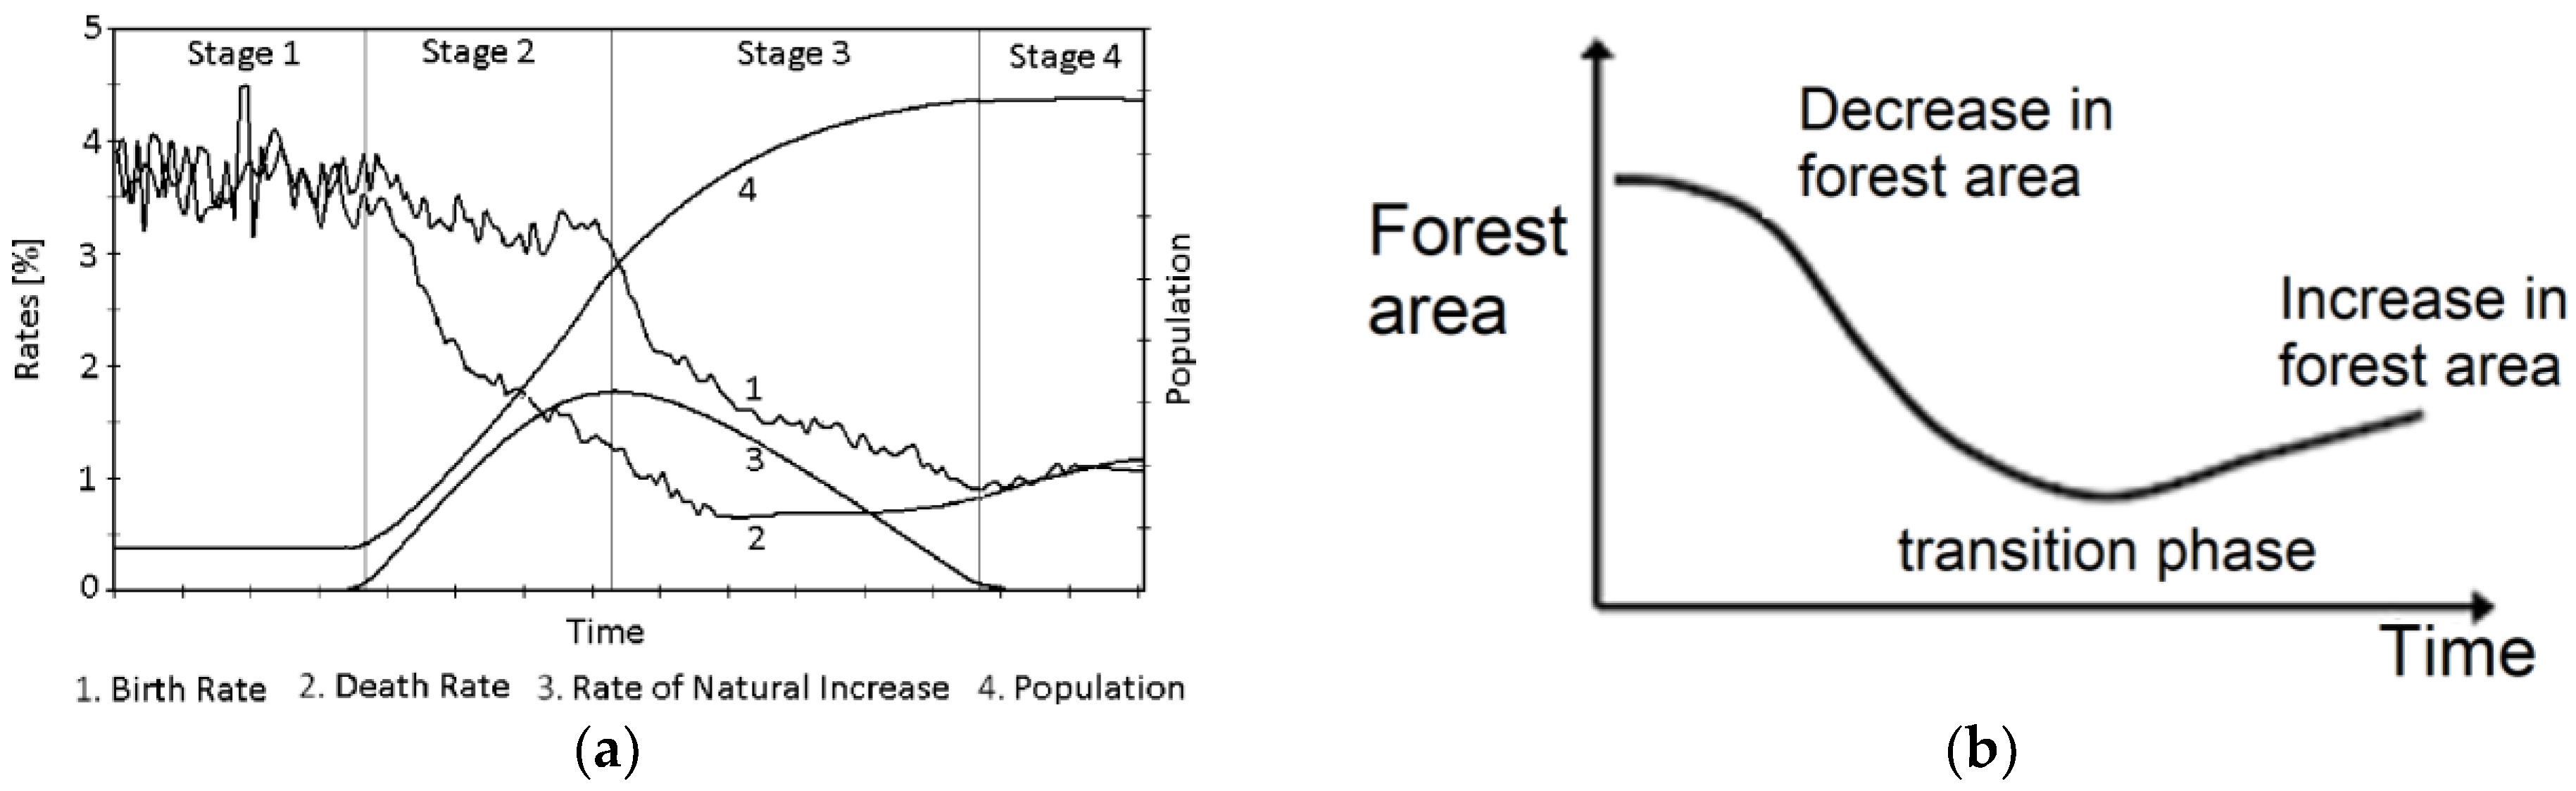
The notion of DT refers to a continuous population trend from high birth and death rates to low birth and death rates (Figure 1a). This transition involves countries developing from pre-industrial to advanced economic systems with consequent socio-environmental changes traditionally identified and classified into four stages [7]. In the first stage (pre-industrial society), both birth and death rates result very high and balanced [8]. Death rates drop quickly owing to enhancements in food supply and sanitation in the second stage, increasing life spans and reducing diseases. In the third stage, birth rates fall due to access to contraception, and there is continuous increase in wages, urbanization, reduced agricultural subsidies, increasing status and education of women, containment of children’s work and an intense expansion of parental investments in the education of children [9]. During the fourth stage (modern societies), low birth and death rates are extensively detected [10].
Among advanced economies, a declining birth rate was observed for the first time in Europe in the late 19th century. Through the end of the 20th century, birth rates and death rates levelled off at lower rates, especially in northern countries. Fertility decline was usually greater between younger women, which advises postponement rather than forgoing of births [11]. However, other studies showed that, beyond a certain degree of development, fertility rates may increase again (e.g., [8,9,10]), as distinguished in France and, to a lesser extent, in Spain and Italy. Considerable increases happened in the percentage of young single adults who lived with their parents, contributing to long-term trends toward intergenerational co-residence [12]. A slight decline in divorce and separation was also recorded in socioeconomic contexts characterized by high unemployment [13]. At the same time, variations in mortality rate and socioeconomic disparities are the outcome of a multifaceted combination of dissimilar reasons [14].
Like population dynamics, the comprehensive knowledge of environmental—and especially forest—processes may benefit from methods integrating ecological and socioeconomic variables on a country scale [15]. When related to changes concerning local environments [16,17,18], Forest Transition (FT) specifies a process with differing trends in land-use (from decline to extension of national/regional forest area and vice versa) depending on socioeconomic and ecological situations [19,20,21,22]. The FT theory (Figure 1b) is based on the results of empirical studies investigating forest dynamics and the underlying territorial context at various spatial scales [23,24,25]. Results from case studies [23,24,25,26,27,28,29,30] validate that variations from net deforestation to net reforestation count on several influences e.g., degree of industrialization, population dynamics (such as lined to rural abandonment and urbanization), education level, agricultural intensification, quality of policies/governance and improved ecological consciousness [17,31,32,33,34]. In these regards, theories grounded on forest transition provide a useful knowledge to a better understanding of land-use change and environmental degradation processes [35,36,37,38]. Results from earlier studies referring to the FT theory provide an informative base to policies promoting sustainable land management in both developed and developing countries [39].
Due to feedback relationships between changes in forest cover and population dynamics, a comprehensive understanding of demographic and land-use transitions may shed light on complex population–environment interplays [2,40,41]. While interpretative models based on DT and FT theories are taken as generalizations applied to a group of countries that may not accurately describe each individual case, a multivariate analysis matching the most relevant attributes of demographic and forest transitions with external factors supposed to influence both processes are a tool to identify specific patterns and dynamics within a homogeneous group of countries (or regions). Based on these premises, our analysis contributes to a permanent assessment of population and land-use factors associated with long-term demographic and forest transitions in Italy, an emblematic case for southern Europe. More specifically, the present study investigates long-term population–environment interplays considering together demographic and forest transitions in Italy and adopting an exploratory data analysis of 58 socioeconomic indicators over a relatively long-time interval between 1862 and 2009. The aims of this analysis are (i) to explore and clarify the empirical linkage between the investigated indicators and (ii) to define homogeneous time intervals according to the dominant socioeconomic context, possibly reflecting different ‘modernization’ stages. An explicit analysis of two dimensions of global change (DT and FT) allows a more comprehensive investigation of the transforming socioeconomic contexts at the base of ‘modernization’ stages, providing an informative base to developmental strategies that promote sustainability, equity and cohesion in complex socio-environmental systems.
2. Methodology
2.1. Study Area
The investigated area extends 301,330 km2 of Italy’s land, where 23% of land is constituted of lowland, 42% upland and the remaining 35% mountains), displaying a north–south division in environmental circumstances (e.g., landscape, climate regimes, vegetation, soils and cropping systems) and socioeconomic influences (job market, per-capita income, demographic and other socio-spatial factors). Some recent demographic trends in the country were presented and discussed in Billari et al. [42] and Caltabiano et al. [43].
2.2. Indicators
According with the hypothesis formulated earlier in this study, we investigated the co-evolution of demographic patterns, environmental conditions and the underlying socioeconomic context referring to relevant dimensions of development that are supposed to be sensitive to ‘modernization’ processes [44,45]: territorial patterns, agricultural development, education levels, job market dynamics, as well as the structure of trade (import and export). Co-evolution of different developmental dimensions was analyzed with an exploratory thinking rationale [38], considering many indicators comparable along a time period of nearly 150 years in Italy. In this perspective, our study made use of a homogenized dataset composed of 58 indicators (Table 1) derived from a country-level database of time-series annual data (1862–2009) recently released by the Italian National Institute of Statistics (ISTAT). Indicators were collected and coordinated from several official data sources (e.g., national census and population register combined with socioeconomic and forest/environmental statistics) with the aim to investigate the recent socioeconomic and environmental history of the country. More specifically, indicators investigate five thematic domains: (i) environment and territory (7 indicators), (ii) demography (12), (iii) education and labor market (7), (iv) economy and trade (8) and (v) agriculture (24), in line with the conceptual background (Forest transition theory and Demographic transition theory) and the underlying socioeconomic dimensions discussed earlier (Chapter 1). The identification of thematic domains allows definition of indicators’ sub-sets suitable to (directly or indirectly) assess forest and demographic transitions (themes (i) and (ii)) and to define additional socioeconomic factors underlying both transitional processes (themes (iii), (iv) and (v)).
2.3. Data Analysis
The indicators illustrated in Section 2.2 were calculated yearly from elementary variables between 1862 and 2009 and analyzed using a mixed statistical framework grounded on descriptive analysis, Spearman non-parametric correlation, step-wise multiple regression and Principal Component Analysis (PCA). Spearman analysis was aimed at identifying relevant pair-wise correlations between relevant variables in forest transition (e.g., percentage of forests in total landscape, FOR, and per-capita forest land, FOP) and the remaining indicators (themes (i) to (v)) over time; significant correlations were defined at p < 0.01 after Bonferroni’s correction for multiple comparisons. Multiple regression was aimed at identifying the most relevant predictors (i.e., indicators) associated with the percentage of forests in total landscape (FOR) or per-capita forest land (FOP), both taken as dependent variables in separate models. Predictor’s selection was run adopting a backward stepwise regression with significance level fixed at p < 0.01. Separate PCAs were finally run on indicators referring to each of the five research domains to identify latent correlations among variables. Components with eigenvalues > 1 were extracted and separate biplots, illustrating component loadings (58 indicators) and scores (148 years) together, were analyzed.
3. Results
3.1. Descriptive Statistics
Italy underwent relevant socioeconomic transformations along the last century reflecting a progressive ‘modernization’ process, as indicated in the evolution of the 58 indicators considered here. Figure 2 illustrates temporal trends in selected indicators assessing demographic and forest transition in Italy. Empirical evidence indicates a progressive decline of fertility and mortality rates, with values approaching the lowest rate since the early 1950s and the mid-1980s, respectively for deaths and births. The time interval between the early 1950s and the mid-1980s was thus characterized by massive population expansion fueled by positive natural balance and migratory balance. In particular, natural increase of population followed the distinct temporal pattern of birth and death rates, with positive and particularly high values since the early 1970s, declining rapidly afterwards; spikes corresponded with demographic shocks caused by World Wars I and II. A more stable population was observed since the early 1990s. Migration balance was negative (emigration > immigration) since the early 1970s, with a progressive increase afterward and a structural peak recorded since the mid-2000s. Marriage rate declined progressively over time (with time series’ spikes corresponding to both World Wars I and II) and stabilized to the lowest values in the mid-1980s (c). Infant mortality followed a similar time pattern, decreasing rapidly and linearly up to the mid-1950s and then declining slowly up to a quasi-zero value recorded since the early 2000s. Finally, forest decline was particularly evident in a time interval encompassing 55 years between 1862 and 1917 (d). Although with a non-linear time trend, forest land expanded continuously since World War I. Per-capita forest land followed a similar U-shaped pattern, with a rapid decrease in the first 60 years of investigation, a moderate decrease in the following 50 years and a stabilization in the final 40 years.
3.2. Correlation Analysis
Results of a Spearman non-parametric correlation between indicators of forest transition and demographic/contextual indicators are illustrated in Table 2. Indicators receiving the highest positive correlation coefficients with the percentage of forest land in total landscape (FOR) were associated with urbanization patterns. The reverse pattern was observed for demographic indicators (birth and death rates, infant mortality). An opposite correlation profile was observed for per-capita forest land (FOP).
Two step-wise multiple regression models were run separately with the aim of identifying the most relevant predictors of (i) the percentage of forests in total landscape or (ii) per-capita forest land, both considered as dependent variables (Table 3). For both variables, step-wise selection of the predictors delineated models with a moderately-high adjusted R2. Respectively, 11 and 9 variables were identified as significant predictors for FOR and FOP. Increase in university students attending economic and scientific faculties and decrease of fertility, sex ratio (males > females) and marriage rates were overall associated with forestation trends. By contrast, per-capita forest land decreased coherently with infant mortality and with both fertility and mortality rates. Conversely, per-capita forest land increased with per-capita agricultural production and with the percentage of students attending scientific and economic faculties.
3.3. Multivariate Analysis
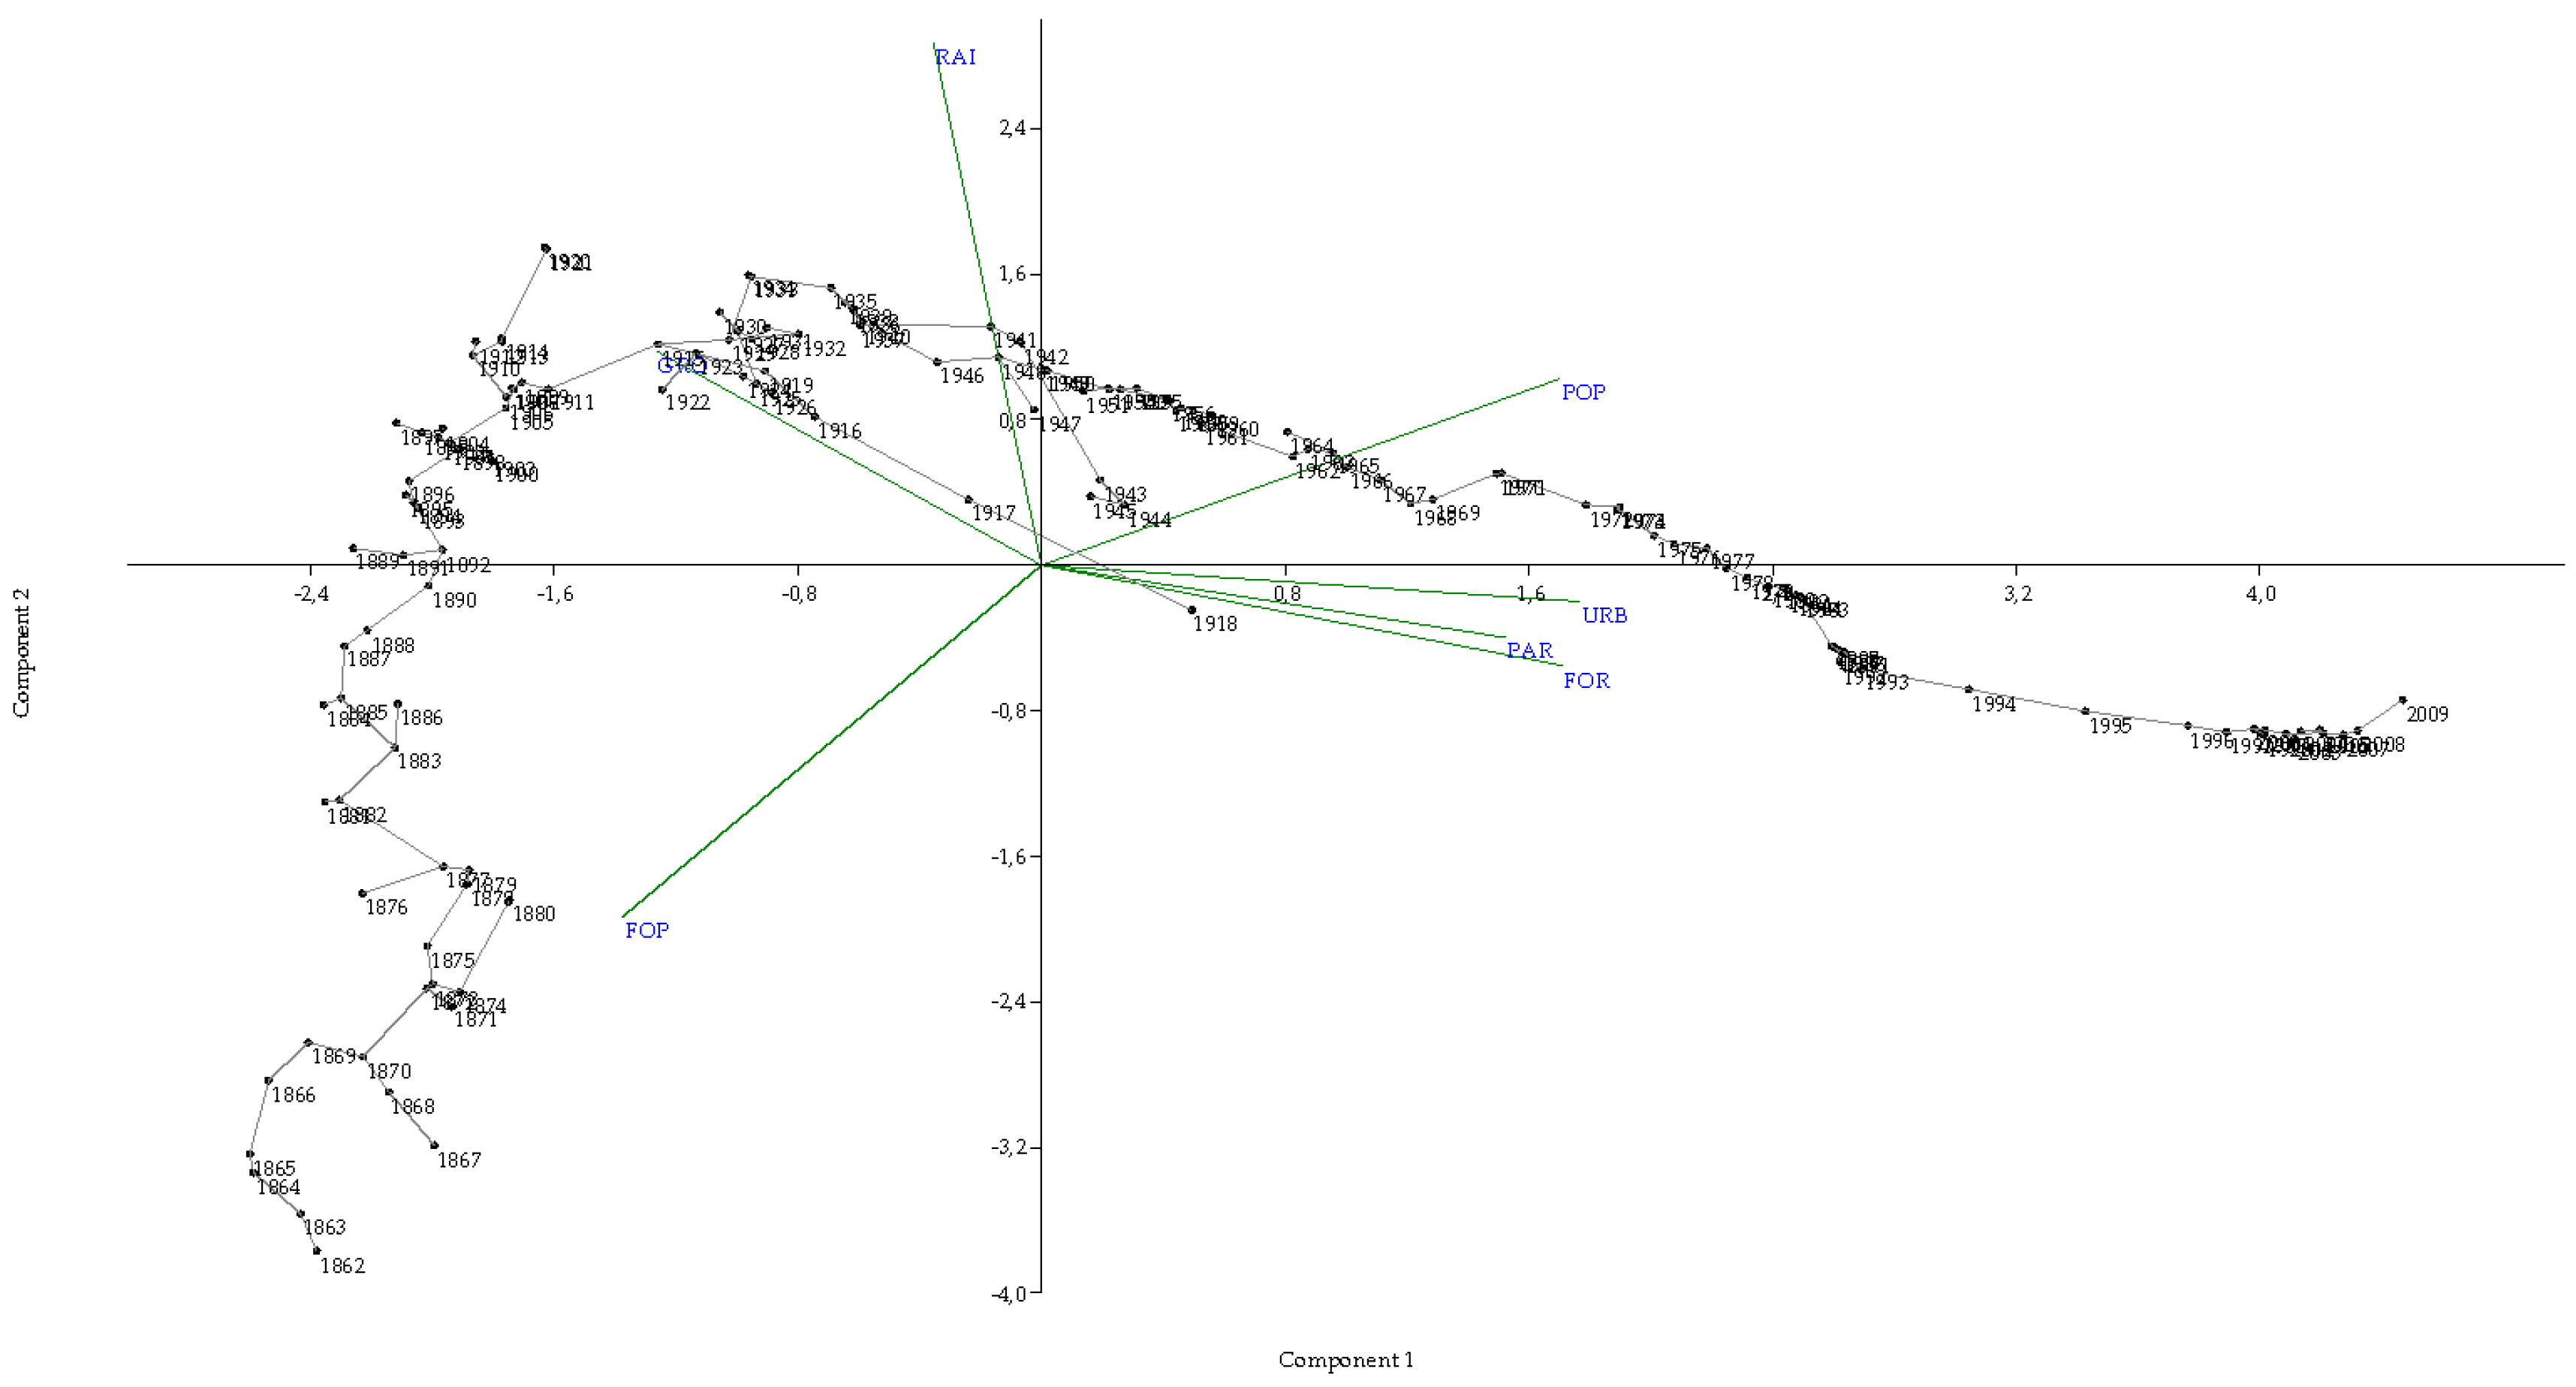
A Principal Component Analysis was separately performed for each thematic field evidencing coherent temporal trends and association with the most relevant indicators in each domain (Table 4). The first two components accounted for a cumulated variance larger than 80% for environment and demography themes, larger than 70% for education and agriculture and close to 65% for economy and trade. Component loadings and scores were illustrated separately in five biplots (Figure 3), summarizing peculiar time patterns for each thematic domain and the indicators contributing the most to such trends.
Concerning the environmental domain, component 1 described the 63% of the total variance. A positive correlation was detected for PC1 with urbanization processes, percent share of protected zones in total country area and forest land in total landscape. This axis designates a modernization tendency in the direction of a more densely populated and built-up areas, in turn associated with forest expansion and increase in the level of environmental protection. These dynamics may impact negatively agricultural areas, as suggested by the progressive decline of cropland in the last century. Population growth rate was negatively related to this axis signifying a non-linear inclination, reflecting a ‘demographic boom’ in the aftermath of World War II. Density of railways was related to PC2, which is characterized by the 23% of the total variance, indicating a real technological axis, where depicts that a modernization inclination was possibly founded on sequential development waves over a specific time.
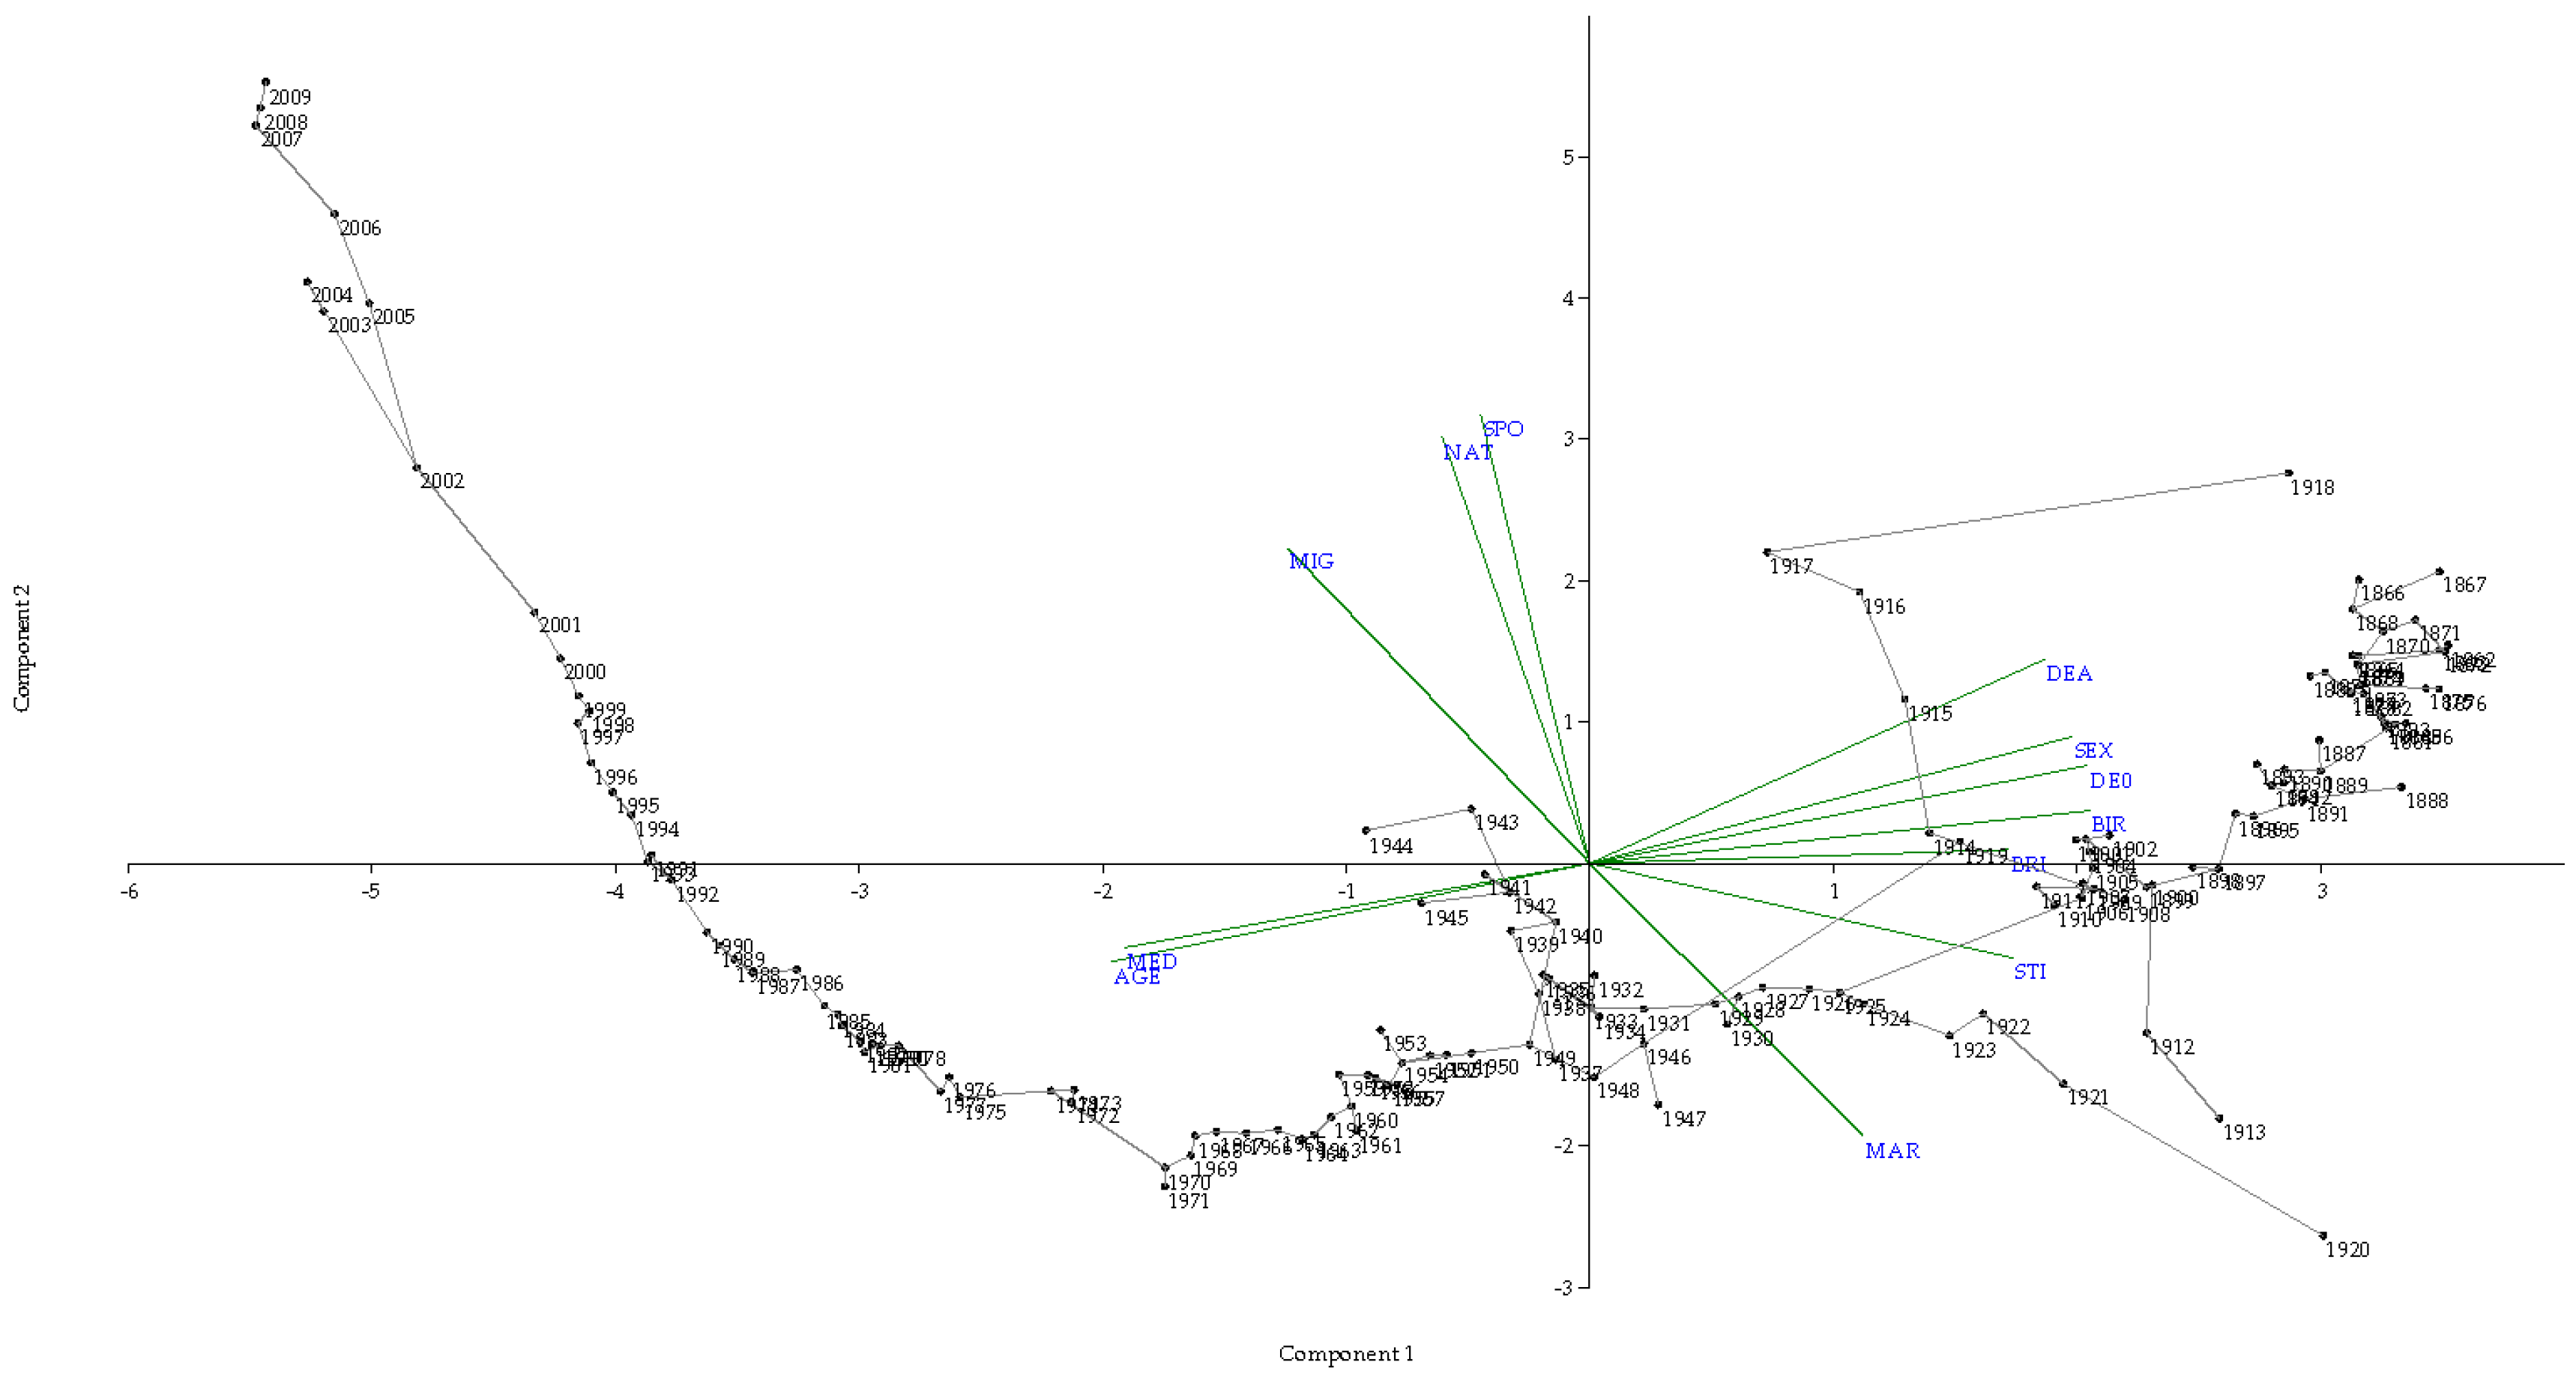
Describing the primary two components (PC1 and PC2), the analysis run on demographic indicators extracted 82% of total variance. Component 1 was interrelated to basic population trends (birth and death rates) and the resulting age structure. This axis may satisfactorily describe the demographic transition in Italy. Component 2 was associated with both demographic dynamics and socioeconomic variables (migration rate, marriage rate, rate of natural births, average age e.g., at marriage); this component may provide a dynamic description of social ‘modernization’ trends in Italy (Figure 4).
Concerning the education variables, the PCA run on extracted 77% of total variance associated with the first two components (PC1 and PC2). In fact, the continuous increase of graduated people, especially having a secondary and tertiary degree, were by illustrated PC1 exposing the latent change in the attractiveness of different university disciplines. In the most current decades, an increasing number or students joined in economic classes was detected, differing from the number of students enrolled in medicine and law faculties, which was higher in the early decades of the 20th century. As a representation of the concept of ‘modernization’, PC2 was connected to the proportion of students sign up in scientific disciplines, growing in the mid-point of the temporal period analyzed, during (or immediately afterward) events e.g., World Wars (Figure 5).
Concerning the rural variables, the PCA exposed a more complex shape, taking out 74% of the total variance and demonstrating the disagreement among crops with growing production (MAI, BAR, TOB, in conjunction with PIG and EGG) and further out-of-date crops with reducing production (RYE, BRO, HOR, ALM) along the first component. Though with the second component, temporal patterns connected with the crop production located in definite areas, e.g., ALM and OAT, emerged (Figure 6).
Furthermore, PCA run on trade variables, the discloses an explicit modernization outline, demonstrated by the first two axes. Explaining 67% of the total variance, it is chiefly founded on the rise of importation from (and export to) North America, principally the United States of America, and the resultant decay of import and export trade from (and even to) Europe. Component 2 emphasized additional component, i.e., the improved addiction on oil contrary to carbon for supporting the national energy request (Figure 7).
4. Discussion
Modernization is considered a changing process towards types of socioeconomic and political organizations that developed and consolidated in economically advanced countries of Western Europe and North America over nearly two centuries (17th–19th century), spreading (more or less) rapidly to other countries [4,5,6,7,46]. Modernization theory provides a conceptual and operational perspective to understand developing trends at national and regional scale, with a special focus on previous pre-modern societies and their changeover toward a more ‘Westernized’ forms of economic progress and alteration in their socio-political organizations. By involving multiple dimensions difficult to identify and acting as drivers of change, the interplay between DT and FT is particularly relevant in advanced areas considering the ‘modernization’ theory.
Our study provides a multivariate overview of the long-term transition toward modernization in a European country, focusing on the link between environmental (forest) variables and demographic processes, under a specific socioeconomic context [36,37,38,39]. This study contributes to an improved understanding of forest and demographic transitions in a European country by adopting a wide set of yearly-based indicators that reflect different analysis’ dimensions over a sufficiently long-time span in Italy. A comprehensive interpretation of heterogeneous sets of variables, as performed in this study, may benefit from analysis’ strategies integrating multivariate exploratory statistics with more traditional time series inferential approaches defining indicators with similar patterns over time. By classifying specific time intervals into homogeneous groups of years that reflect defined socioeconomic trends, the proposed analysis may characterize distinct waves of ‘modernization’, with specific implications for both forest and demographic dynamics. This research rationale may thus highlight the intimate, long-term linkage between population and the environment, evidencing homogeneous (or heterogeneous) responses to local and global changes driven by socioeconomic development.
For instance, advanced economies have exhibited turning points from forest decline to expansion in the years belonging to a transitional epoch within the two World Wars, although with a relatively large spatial variability across countries and/or regions [24,28,30]. This transitional period has coincided with important demographic changes [11] and latent social transformations. The relationship between demographic change and forest transition was likely influenced by the evolving socioeconomic context [47,48], reflecting a tight relationship between economic development and the environment. At the same time, highly variable time patterns characterized land-use variables, with a strong correlation between urbanization and forest expansion at the expenses of cropland [2]. In these regards, the empirical findings of this study corroborate earlier evidence supporting the assumption that sequential, country-scale decreases and increases of forest land are more likely associated with a broad spectrum of socioeconomic processes influenced by industrialization, urbanization and agricultural intensification [16,36,37,38,39].
As far as the ‘modernization’ transition in Italy, our study contributes to identify homogeneous time intervals intended as progressive waves of development featuring distinct demographic attributes and environmental profiles [10]. A dynamic equilibrium between environmental and socioeconomic factors is assumed to characterize each developmental wave. For instance, drivers of forest degradation are intimately linked with an increased population that requires agricultural land, economic ‘modernization’ through development of agricultural production and forest exploitation [49,50,51]. All at once, increased environmental responsiveness and expanded networks of protected areas, associated with depopulation and land abandonment in rural areas were considered basic drivers of increasing forest cover in Italy [52]. The increasing percentage of students who graduated in scientific disciplines in more recent times is an indirect proof of technological change possibly associated with a growing forest cover. Moreover, demographic dynamics have indirectly influenced this process, polarizing population distribution in high-density and low-density settlements and referring national large areas to marginal economic situations, low accessibility and uneven demographic structures with aging [53]. These areas contribute to the highest rate of forest gain all over the country through processes of natural forest expansion [44,54].
Based on these premises, our study may confirm the interpretative framework of the forest transition theory outlining the intimate relationship between historical development trends and the long-term forest expansion in Italy. A coherent analysis of changes in the socioeconomic context and their impact on forest transition in Italy allows identification of three decades (1930s, 1940s and 1970s) as important turning points in the complex socio-environmental system outlining different groups of indicators according to divergent (e.g., linear vs. non-linear) time trends. In these regards, the linkage between the rapid expansion of protected areas and forest transition in Italy is a particularly interesting result, outlining the increased mindfulness of environmental apprehensions together a reduced pressure on forest ecosystems because of depopulation and abandonment of internal districts, driven by agricultural decline, spatial rationalization of the industrial structure and a shift towards advanced services and tourism [36,37,38,39,55,56,57,58,59,60,61,62,63]. In other words, natural expansion of forests in inland areas—mainly governed by demographic processes (population aging and the consequent land abandonment) and economic forces (urbanization. rural-urban migration and rural development of most accessible farmland)—added to governance issues (e.g., the increase of protected areas), ensuring heterogeneous and spatially mixed conditions in terms of growth, stability and quality of forest stands [35,59,64]. Since these changes have unquestionably influenced forest transition in Italy, an integrated analysis of forest and demographic transitions vis-à-vis socioeconomic development revealed a critical tool to understand complex interplays between modern societies and the environment. Future studies should clarify even more complex interplays between socioeconomic processes of land abandonment, forest management and soil quality in rural areas [65]. In this perspective, the exploratory approach developed in this study was revealed to be an appropriate base to shed light on mechanisms of co-evolution between local communities and ecological systems, providing a generalized knowledge on human–nature interactions. However, further approaches can also be oriented to methodological improvements, trying to clarify the causal relationship between analysis’ dimensions (or individual variables) or testing the performance of non-linear explicative techniques, such as artificial neural networks, that may replace more traditional regression approaches.
5. Conclusions
Integrating assumptions derived from two transitional theories (demography and environment) provides an original contribution to define and interpret apparent and more latent ‘modernization’ waves typical of advanced economies. The approach proposed here allows the identification of demographic patterns and processes most associated to changes in forest cover at country scale, considering the evolving socioeconomic context over a relatively long-time interval [47,48]. The exploratory data analysis performed in this study identified time intervals with the most evident changes in land-use/population interactions in Italy, indicating distinctive groups of indicators that characterize pre-transitional, transitional and post-transitional developmental phases. Our findings emphasize the importance of joint assessment backgrounds assessing both environmental and socio-demographic matters. Further future approaches may be oriented towards methodological improvements, expounding causal relationship among the dimensions of the analysis of the variables considered, e.g., identifying complex interactions among socioeconomic processes and forest and rural management, performing non-linear explanatory techniques and replacing traditional approaches.
Author Contributions
Conceptualization, V.M. and L.S.; methodology, V.M. and L.S.; validation, L.S. and I.Z.; formal analysis, V.M. and L.S.; investigation, V.M.; data curation, L.S.; writing—original draft preparation, I.Z.; writing—review and editing, L.S., I.Z. and M.C.; visualization, M.C.; supervision, L.S.
Funding
This research received no external funding.
Conflicts of Interest
The authors declare no conflict of interest.
References
- Simou, E.; Koutsogeorgou, E. Effects of the economic crisis on health and healthcare in Greece in the literature from 2009 to 2013: A systematic review. Health Policy 2014, 115, 111–119. [Google Scholar] [CrossRef] [PubMed] [Green Version]
- Harte, J. Human population as a dynamic factor in environmental degradation. Popul. Environ. 2007, 28, 223–236. [Google Scholar] [CrossRef]
- Levy, M., Jr. Modernization and the Structures of Societies; Princeton University Press: Princeton, NJ, USA, 1966. [Google Scholar]
- Chesnais, J.C. The Demographic Transition: Stages, Patterns, and Economic Implications: A Longitudinal Study of Sixty-Seven Countries Covering the Period 1720–1984; Oxford University Press: Oxford, UK, 1993. [Google Scholar]
- Khan, J.S. Modernity and Exclusion; Sage: London, UK, 2001. [Google Scholar]
- Parsons, T. The Social System; Free Press: New York, NY, USA, 1951. [Google Scholar]
- Dudley, K. The Demographic Transition. Popul. Stud. 1996, 50, 361–387. [Google Scholar]
- Myrskyla, M.; Kohler, H.P.; Billari, F. Advances in development reverse fertility declines. Nature 2009, 460, 741–743. [Google Scholar] [CrossRef] [PubMed]
- Baudelle, G.; Olivier, D. Changement Global, Mondialisation et Modèle De Transition Démographique: Réflexion sur une exception française parmi les pays développés. Hist. Géogr. 2006, 98, 177–204. [Google Scholar]
- Walford, N.; Kurek, S. Outworking of the Second Demographic Transition: National Trends and Regional Patterns of Fertility Change in Poland, and England and Wales, 2002–2012. Popul. Space Place 2016, 22, 508–525. [Google Scholar] [CrossRef]
- Ogden, P.E.; Hall, R. Households, reurbanisation and the rise of living alone in the principal French cities 1975–1990. Urban Stud. 2000, 37, 367–390. [Google Scholar] [CrossRef]
- Cherlin, A.; Cumberworth, E.; Morgan, S.P.; Wimer, C. The effects of the Great Recession on family structure and fertility. Ann. Am. Acad. Political Soc. Sci. 2013, 650, 214–231. [Google Scholar] [CrossRef]
- Valkonen, T.; Martikainen, P.; Jalovaara, M.; Koskinen, S.; Martelin, T.; Mäkelä, P. Changes in socioeconomic inequalities in mortality during an economic boom and recession among middle-aged men and women in Finland. Eur. J. Public Health 2000, 10, 274–280. [Google Scholar] [CrossRef] [Green Version]
- Meyfroidt, P.; Lambin, E.F. Global Forest Transition: Prospects for an End to Deforestation. Annu. Rev. Environ. Resour. 2011, 36, 343–371. [Google Scholar] [CrossRef]
- Mather, A.S. The forest transitions. Area 1992, 24, 367–379. [Google Scholar]
- Mather, A.S.; Needle, C.; Coull, J. From resource crisis to sustainability: The forest transition in Denmark. Int. J. Sustain. Dev. World Ecol. 1998, 5, 183–192. [Google Scholar] [CrossRef]
- Rudel, T.K. Tree farms: Driving forces and regional patterns in the global expansion of forest plantations. Land Use Policy 2009, 26, 545–550. [Google Scholar] [CrossRef]
- Gutiérrez, L.; Rodríguez, M.; Ruiz, P. Recent changes in Chinese forestry seen through the lens of Forest Transition theory. Int. For. Rev. 2013, 15, 456–470. [Google Scholar] [Green Version]
- Mather, A.S. Forest transition theory and the reforesting of Scotland. Scott. Geogr. J. 2004, 120, 83–98. [Google Scholar] [CrossRef]
- Mather, A.S. Recent Asian Forest Transitions in Relation to Forest-Transition Theory. Int. For. Rev. 2007, 9, 491–502. [Google Scholar] [CrossRef]
- Redo, D.J.; Graub, H.R.; Aidea, T.M.; Clark, M.L. Asymmetric forest transition driven by the interaction of socio-economic development and environmental heterogeneity in Central America. Proc. Natl. Acad. Sci. USA 2012, 109, 8839–8844. [Google Scholar] [CrossRef] [PubMed]
- Bray, D.B.; Klepeis, P. Deforestation, forest transitions, and institutions for sustainability in southeastern Mexico, 1900–2000. Environ. Hist. 2005, 11, 195–223. [Google Scholar] [CrossRef]
- DeFries, R.S.; Pandey, D. Urbanization, the energy ladder and forest transitions in India’s emerging economy. Land Use Policy 2010, 27, 130–138. [Google Scholar] [CrossRef]
- He, J.; Lang, R.; Xu, J. Local Dynamics Driving Forest Transition: Insights from Upland Villages in Southwest China. Forests 2014, 5, 214–233. [Google Scholar] [CrossRef] [Green Version]
- Hecht, S.B.; Kandel, S.; Gomes, I.; Cuellar, N.; Rosa, H. Globalization, forest resurgence, and environmental politics in El Salvador. World Dev. 2006, 34, 308–323. [Google Scholar] [CrossRef]
- Klooster, D. Forest transitions in Mexico: Institutions and forests in a globalized countryside. Prof. Geogr. 2003, 55, 227–237. [Google Scholar] [CrossRef]
- Meyfroidt, P.; Lambin, E.F. The causes of the reforestation in Vietnam. Land Use Policy 2008, 25, 182–197. [Google Scholar] [CrossRef]
- Rudel, T.K.; Bates, D.; Machinguiashi, R. A tropical forest transitions? Agricultural change, out-migration, and secondary forests in the Ecuadorian Amazon. Ann. Assoc. Am. Geogr. 2002, 92, 87–102. [Google Scholar] [CrossRef]
- Yackulic, C.B.; Fagan, M.; Jain, M.; Jina, A.; Lim, Y.; Marlier, M.; Muscarella, R.; Adame, P.; DeFries, R.; Uriarte, M. Biophysical and socio-economic factors associated with forest transitions at multiple spatial and temporal scales. Ecol. Soc. 2011, 16, 1–22. [Google Scholar] [CrossRef]
- De Jong, W. Forest rehabilitation and its implication for forest transition theory. Biotropica 2009, 42, 3–9. [Google Scholar] [CrossRef]
- Barbier, E.B.; Burgess, J.C.; Grainger, A. The forest transition: Towards a more comprehensive theoretical framework. Land Use Policy 2009, 27, 98–107. [Google Scholar] [CrossRef]
- Pagnutti, C.; Bauch, C.T.; Anand, M. Outlook on a Worldwide Forest Transition. PLoS ONE 2013, 8, e75890. [Google Scholar] [CrossRef]
- Ceccarelli, T.; Bajocco, S.; Perini, L.; Salvati, L. Urbanisation and Land Take of High-Quality Agricultural Soils—Exploring Long-term Land Use Changes and Land Capability in Northern Italy. Int. J. Environ. Res. 2014, 8, 181–192. [Google Scholar]
- Biasi, R.; Colantoni, A.; Ferrara, C.; Ranalli, F.; Salvati, L. In-between Sprawl and Fires: Long-term Forest Expansion and Settlement Dynamics at the Wildland-Urban Interface in Rome, Italy. Int. J. Sustain. Dev. World Ecol. 2015, 22, 467–475. [Google Scholar] [CrossRef]
- Colantoni, A.; Mavrakis, A.; Sorgi, T.; Salvati, L. Towards a ‘polycentric’ landscape? Reconnecting fragments into an integrated network of coastal forests in Rome. Rendiconti Accademia Nazionale dei Lincei 2015, 26, 615–624. [Google Scholar] [CrossRef]
- Duvernoy, I.; Zambon, I.; Sateriano, A.; Salvati, L. Pictures from the other side of the fringe: Urban growth and peri-urban agriculture in a post-industrial city (Toulouse, France). J. Rur. Stud. 2018, 57, 25–35. [Google Scholar] [CrossRef]
- Recanatesi, F.; Clemente, M.; Grigoriadis, S.; Ranalli, F.; Zitti, M.; Salvati, L. A fifty-years sustainability assessment of Italian Agro-forest Districts. Sustainability 2016, 8, 32. [Google Scholar] [CrossRef]
- Lee, K.O.; Painter, G. What happens to household formation in a recession? J. Urban Econ. 2013, 76, 93–109. [Google Scholar] [CrossRef]
- Zitti, M.; Ferrara, C.; Perini, L.; Carlucci, M.; Salvati, L. Long-term Urban Growth and Land-use Efficiency in Southern Europe: Implications for Sustainable Land Management. Sustainability 2015, 7, 3359–3385. [Google Scholar] [CrossRef]
- Salvati, L.; Petitta, M.; Ceccarelli, T.; Perini, L.; Di Battista, F.; Venezian Scarascia, M.E. Italy’s renewable water resources as estimated on the basis of the monthly water balance. Irrig. Drain. 2008, 57, 507–515. [Google Scholar] [CrossRef]
- Billari, F.C.; Kohler, H.P.; Andersson, G.; Lundström, H. Approaching the limit: Long-term trends in late and very late fertility. Popul. Dev. Rev. 2007, 33, 149–170. [Google Scholar] [CrossRef]
- Caltabiano, M.; Castiglioni, M.; Rosina, A. Lowest-low fertility: Signs of a recovery in Italy? Demogr. Res. 2009, 21, 681–718. [Google Scholar] [CrossRef]
- Colantoni, A.; Ferrara, C.; Perini, L.; Salvati, L. Assessing Trends in Climate Aridity and Vulnerability to Soil Degradation in Italy. Ecol. Indic. 2015, 48, 599–604. [Google Scholar] [CrossRef]
- Ciganda, D. Unstable work histories and fertility in France: An adaptation of sequence complexity measures to employment trajectories. Demogr. Res. 2015, 32, 843–876. [Google Scholar] [CrossRef]
- Harrison, D. The Sociology of Modernization and Development; Unwin Hyman: London, UK, 1988. [Google Scholar]
- Zambon, I.; Benedetti, A.; Ferrara, C.; Salvati, L. Soil Matters? A Multivariate Analysis of Socioeconomic Constraints to Urban Expansion in Mediterranean Europe. Ecol. Econ. 2018, 146, 173–183. [Google Scholar] [CrossRef]
- Singh, M.P.; Singh, M.P.; Bhojvaid, P.P.; de Jong, W.; Ashraf, J.; Reddy, S.R. Forest transition and socio-economic development in India and their implications for forest transition theory. For. Policy Econ. 2017, 76, 65–71. [Google Scholar] [CrossRef]
- Salvati, L.; Carlucci, M. The economic and environmental performances of rural districts in Italy: Are competitiveness and sustainability compatible targets? Ecol. Econ. 2011, 70, 2446–2453. [Google Scholar] [CrossRef]
- Karamesouti, M.; Detsis, V.; Kounalaki, A.; Vasiliou, P.; Salvati, L.; Kosmas, C. Land-use and land degradation processes affecting soil resources: Evidence from a traditional Mediterranean cropland (Greece). Catena 2015, 132, 45–55. [Google Scholar] [CrossRef]
- Salvati, L.; Zitti, M. Land degradation in the Mediterranean basin: Linking bio-physical and economic factors into an ecological perspective. Biota 2005, 5, 67–77. [Google Scholar]
- Tomao, A.; Quatrini, V.; Corona, P.; Ferrara, A.; Lafortezza, R.; Salvati, L. Resilient landscapes in Mediterranean urban areas: Understanding factors influencing forest trends. Environ. Res. 2017, 156, 1–9. [Google Scholar] [CrossRef] [PubMed] [Green Version]
- Fardusi, M.J.; Chianucci, F.; Barbati, A. Concept to practice of geospatial-information tools to assist forest management and planning under precision forestry framework: A review. Ann. Silvic. Res. 2017, 41, 3–14. [Google Scholar]
- De Meo, I.; Ferretti, F.; Paletto, A.; Cantiani, M.G. An approach to public involvement in forest landscape planning in Italy: A case study and its evaluation. Ann. Silvic. Res. 2017, 41, 54–66. [Google Scholar]
- Green, B.; Vos, W. Threatened Landscapes: Conserving Cultural Environments; Taylor Francis: London, UK, 2012. [Google Scholar]
- Falagas, M.E.; Vouloumanou, E.K.; Mavros, M.N.; Karageorgopoulos, D.E. Economic crises and mortality: A review of the literature. Int. J. Clin. Pract. 2009, 63, 1128–1135. [Google Scholar] [CrossRef]
- Lesthaeghe, R.J.; Neidert, L. The second demographic transition in the United States: Exception or textbook example? Popul. Dev. Rev. 2006, 32, 669–698. [Google Scholar] [CrossRef]
- Munafò, M.; Salvati, L.; Zitti, M. Estimating soil sealing at country scale—Italy as a case study. Ecol. Indic. 2013, 26, 36–43. [Google Scholar] [CrossRef]
- Pili, S.; Grigoriadis, E.; Carlucci, M.; Clemente, M.; Salvati, L. Towards Sustainable Growth? A Multi-criteria Assessment of (Changing) Urban Forms. Ecol. Indic. 2017, 76, 71–80. [Google Scholar] [CrossRef]
- Salvati, L.; Perini, L.; Sabbi, A.; Bajocco, S. Climate aridity and land use changes: A regional-scale analysis. Geogr. Res. 2012, 50, 193–203. [Google Scholar] [CrossRef]
- Salvati, L.; Zitti, M.; Ceccarelli, T. Integrating economic and environmental indicators in the assessment of desertification risk: A case study. Appl. Ecol. Environ. Res. 2008, 6, 129–138. [Google Scholar] [CrossRef]
- Stockdale, A. Contemporary and ‘Messy’ Rural In-migration Processes: Comparing Counterurban and Lateral Rural Migration. Popul. Space Place 2016, 22, 599–616. [Google Scholar] [CrossRef]
- Colantoni, A.; Allegrini, E.; Boubaker, K.; Longo, L.; Di Giacinto, S.; Biondi, P. New insights for renewable energy hybrid photovoltaic/wind installations in Tunisia through a mathematical model. Energy Convers. Manag. 2013, 75, 398–401. [Google Scholar] [CrossRef]
- Cecchini, M.; Zambon, I.; Pontrandolfi, A.; Turco, R.; Colantoni, A.; Mavrakis, A.; Salvati, L. Urban sprawl and the ‘olive’ landscape: Sustainable land management for ‘crisis’ cities. GeoJournal 2018, 1–19. [Google Scholar] [CrossRef]
- Martínez-Hernández, C.; Rodrigo-Comino, J.; Romero-Díaz, A. Impact of lithology and soil properties on abandoned dryland terraces during the early stages of soil erosion by water in south-east S pain. Hydrol. Process. 2017, 31, 3095–3109. [Google Scholar] [CrossRef]
- Rodrigo-Comino, J.; Martínez-Hernández, C.; Iserloh, T.; Cerdà, A. Contrasted impact of land abandonment on soil erosion in Mediterranean agriculture fields. Pedosphere 2018, 28, 617–631. [Google Scholar] [CrossRef]
Figure 1.
A schematic representation of demographic transition (a) and forest transition (b) from traditional to advanced economies.
Figure 1.
A schematic representation of demographic transition (a) and forest transition (b) from traditional to advanced economies.

Figure 2.
Trends over time in population dynamics/forest transition (1862–2009) in Italy (time series spikes in the 1910s and the 1940s respectively due to World War I and World War II): (a) crude birth rate vs. crude death rate; (b) Natural increase of population vs. migration rate; (c) Marriage rate vs. infant mortality (0–4 years); (d) Per cent forests in total landscape vs. per-capita forest land.

Figure 3.
Biplot illustrating loadings and scores to principal components (environmental indicators).
Figure 3.
Biplot illustrating loadings and scores to principal components (environmental indicators).

Figure 4.
Biplot illustrating loadings and scores to principal components (demographic indicators).

Figure 5.
Biplot illustrating loadings and scores to principal components (education indicators).

Figure 6.
Biplot illustrating loadings and scores to principal components (agriculture indicators).

Figure 7.
Biplot illustrating loadings and scores to principal components (economy and trade indicators).
Figure 7.
Biplot illustrating loadings and scores to principal components (economy and trade indicators).


Table 1.
Indicators adopted in the present study by thematic domain.
| Theme | Acronym | Indicator | Source |
|---|---|---|---|
| Environment and territory | FOR | Forest land (% in total land) | Forest statistics |
| FOP | Per-capita forest area (m2 per inhabitant) | Forest statistics | |
| GRO | Population growth rate (% per year) | Demographic statistics | |
| POP | Resident population (logarithm) | Demographic statistics | |
| PAR | Protected area (% in total land) | Environmental statistics | |
| RAI | Railway network (km/1000 inhabitants) | Economic statistics | |
| URB | Population residing in urban centers (% in total popul.) | Demographic statistics | |
| Demography | SEX | Sex ratio (males vs. females) | Demographic statistics |
| BIR | Crude birth rate (% in total population) | Demographic statistics | |
| DEA | Crude death rate (% in total population) | Demographic statistics | |
| MIG | Migration rate (% in total population) | Demographic statistics | |
| NAT | Natural birth rate (% in total births) | Demographic statistics | |
| STI | Still birth rate (% in total births) | Demographic statistics | |
| BRI | Age difference between groom and bride (years) | Demographic statistics | |
| MAR | Marriage rate (% in total population) | Demographic statistics | |
| SPO | Average age of the groom at the marriage (years) | Demographic statistics | |
| AGE | Median age at death for males (years) | Demographic statistics | |
| MER | Difference in female vs. male median age (years) | Demographic statistics | |
| DE0 | Death at age 0-4 years (% in total population) | Demographic statistics | |
| Education | TER | Third-level graduated (% in total population) | University statistics |
| GRA | Second-level graduated (% in total population) | School statistics | |
| SCI | Enrolled at the university in science faculties (%) | University statistics | |
| MED | Enrolled at the university in medicine faculties (%) | University statistics | |
| AGR | Enrolled at the university in agrarian faculties (%) | University statistics | |
| ECO | Enrolled at the university in economy faculties (%) | University statistics | |
| LAW | Enrolled at the university in law faculties (%) | University statistics | |
| Agriculture | WHP | Wheat production (per 1000 quintals) | Agricultural statistics |
| RYE | Rye production (per 1000 quintals) | Agricultural statistics | |
| BAR | Barley production (per 1000 quintals) | Agricultural statistics | |
| OAT | Oat production (per 1000 quintals) | Agricultural statistics | |
| RIC | Rice production (per 1000 quintals) | Agricultural statistics | |
| MAI | Maize production (per 1000 quintals) | Agricultural statistics | |
| BRO | Broad bean production (per 1000 quintals) | Agricultural statistics | |
| BEA | Bean production (per 1000 quintals) | Agricultural statistics | |
| POT | Potatoes production (per 1000 quintals) | Agricultural statistics | |
| TOB | Tobacco production (per 1000 quintals) | Agricultural statistics | |
| GRA | Wine grapes production (per 1000 quintals) | Agricultural statistics | |
| OLI | Olive production (per 1000 quintals) | Agricultural statistics | |
| ORA | Orange production (per 1000 quintals) | Agricultural statistics | |
| TAN | Tangerine and clementine production (per 1000 quintals) | Agricultural statistics | |
| LEM | Lemon production (per 1000 quintals) | Agricultural statistics | |
| OTH | Other agrume’s production (per 1000 quintals) | Agricultural statistics | |
| ALM | Almond production (per 1000 quintals) | Agricultural statistics | |
| HAZ | Hazel production (per 1000 quintals) | Agricultural statistics | |
| CRO | Per capita agricultural production (quintals) | Agricultural statistics | |
| CAT | Total density of cattle and buffaloes (animals) | Agricultural statistics | |
| SHE | Total density of sheep and goats (animals) | Agricultural statistics | |
| PIG | Total density of pigs (animals) | Agricultural statistics | |
| HOR | Total density of horses (animals) | Agricultural statistics | |
| EGG | Total number of eggs produced (per 1000 units) | Agricultural statistics | |
| Economy and trade | IEU | Import from Europe (% in total import) | Trade statistics |
| IAM | Import from north America (% in total import) | Trade statistics | |
| EEU | Export to Europe (% in total import) | Trade statistics | |
| EAM | Export to north America (% in total export) | Trade statistics | |
| DEP | Bank deposit amount / total loan amount | Economic statistics | |
| OIL | Imported oil / imported carbon | Trade statistics | |
| WHE | Wheat production / wheat import | National accounts | |
| BAL | Total import / total export | Trade statistics |
Table 2.
Spearman Rank correlation coefficients between indicators of forest transition and demographic/contextual indicators (significance tested at p < 0.01 after Bonferroni’s correction for multiple comparisons; bold indicates significant coefficients).
Table 2.
Spearman Rank correlation coefficients between indicators of forest transition and demographic/contextual indicators (significance tested at p < 0.01 after Bonferroni’s correction for multiple comparisons; bold indicates significant coefficients).
| Variable | FOR | FOP | Variable | FOR | FOP |
|---|---|---|---|---|---|
| GRO | −0.45 | 0.24 | RIC | 0.59 | −0.54 |
| POP | 0.60 | −0.79 | MAI | 0.58 | −0.54 |
| PAR | 0.76 | −0.65 | BRO | −0.63 | 0.44 |
| RAI | −0.40 | −0.01 | BEA | −0.41 | 0.12 |
| URB | 0.72 | −0.64 | POT | 0.13 | −0.50 |
| SEX | −0.56 | 0.71 | TOB | 0.57 | −0.71 |
| BIR | −0.58 | 0.71 | GRA | −0.35 | 0.22 |
| DEA | −0.50 | 0.75 | OLI | 0.43 | −0.16 |
| MIG | 0.36 | −0.16 | ORA | 0.57 | −0.70 |
| NAT | −0.02 | 0.35 | TAN | 0.59 | −0.77 |
| STI | −0.75 | 0.34 | LEM | 0.18 | −0.26 |
| BRI | −0.49 | 0.48 | OTH | 0.40 | −0.65 |
| MAR | −0.23 | 0.19 | ALM | −0.50 | 0.45 |
| SPO | −0.08 | 0.33 | HAZ | −0.01 | 0.08 |
| AGE | 0.63 | −0.73 | CRO | −0.08 | 0.20 |
| MED | 0.62 | −0.62 | CAT | 0.32 | −0.72 |
| DE0 | −0.63 | 0.75 | SHE | −0.08 | 0.00 |
| TER | 0.60 | −0.74 | PIG | 0.61 | −0.73 |
| GRA | 0.51 | −0.82 | HOR | −0.62 | 0.25 |
| SCI | −0.13 | 0.15 | EGG | 0.64 | −0.63 |
| MED | −0.52 | 0.55 | IEU | −0.02 | 0.43 |
| AGR | −0.34 | 0.24 | IAM | −0.22 | −0.17 |
| ECO | 0.46 | −0.58 | EEU | −0.09 | 0.41 |
| LAW | −0.46 | 0.65 | EAM | −0.17 | −0.08 |
| WHP | 0.47 | −0.69 | DEP | −0.13 | −0.07 |
| RYE | −0.54 | 0.45 | OIL | 0.65 | −0.60 |
| BAR | 0.58 | −0.39 | WHE | −0.24 | 0.21 |
| OAT | −0.03 | −0.24 | BAL | −0.37 | 0.16 |
Table 3.
Results of a step-wise multiple regression run separately on (i) the percentage of forests in total landscape and (ii) per-capita forest land as dependent variables.
Table 3.
Results of a step-wise multiple regression run separately on (i) the percentage of forests in total landscape and (ii) per-capita forest land as dependent variables.
| Variable | Forest Land (%) | Per-Capita Forest Land | ||
|---|---|---|---|---|
| Coeff. | Std. Err. | Coeff. | Std. Err. | |
| Adjusted R2 | 0.977 | 0.979 | ||
| ECO | 0.296 | 0.049 | 0.326 | 0.050 |
| SCI | 0.177 | 0.019 | 0.127 | 0.017 |
| BRI | −0.237 | 0.038 | −0.475 | 0.018 |
| MED | 0.102 | 0.036 | 0.187 | 0.036 |
| SEX | −0.717 | 0.077 | −0.380 | 0.092 |
| RAI | −0.392 | 0.026 | ||
| MAR | −0.126 | 0.020 | ||
| DEP | −0.046 | 0.019 | ||
| TOB | 0.161 | 0.037 | ||
| BIR | −0.484 | 0.097 | 0.220 | 0.084 |
| EGG | 0.156 | 0.068 | ||
| DE0 | 0.923 | 0.098 | ||
| CRO | 0.069 | 0.013 | ||
| DEA | 0.213 | 0.059 | ||
Table 4.
Component extraction by thematic principal component analyses (PCAs).
| Environment | Population | Education | Agriculture | Economy and Trade | |
|---|---|---|---|---|---|
| No. Variables | 7 | 12 | 7 | 24 | 8 |
| Component 1 | 62.9 | 60.5 | 61.9 | 56.8 | 45.9 |
| Component 2 | 22.5 | 21.6 | 15.1 | 17.4 | 18.7 |
| Cum. vari. (%) | 85.4 | 82.1 | 77.0 | 74.2 | 64.6 |
© 2019 by the authors. Licensee MDPI, Basel, Switzerland. This article is an open access article distributed under the terms and conditions of the Creative Commons Attribution (CC BY) license (http://creativecommons.org/licenses/by/4.0/).
Share and Cite
MDPI and ACS Style
Moretti, V.; Salvati, L.; Cecchini, M.; Zambon, I. A Long-Term Analysis of Demographic Processes, Socioeconomic ‘Modernization’ and Forest Expansion in a European Country. Sustainability 2019, 11, 388. https://doi.org/10.3390/su11020388
AMA Style
Moretti V, Salvati L, Cecchini M, Zambon I. A Long-Term Analysis of Demographic Processes, Socioeconomic ‘Modernization’ and Forest Expansion in a European Country. Sustainability. 2019; 11(2):388. https://doi.org/10.3390/su11020388
Chicago/Turabian StyleMoretti, Valerio, Luca Salvati, Massimo Cecchini, and Ilaria Zambon. 2019. "A Long-Term Analysis of Demographic Processes, Socioeconomic ‘Modernization’ and Forest Expansion in a European Country" Sustainability 11, no. 2: 388. https://doi.org/10.3390/su11020388
Note that from the first issue of 2016, this journal uses article numbers instead of page numbers. See further details here.