A Vulnerability Assessment of Urban Emergency in Schools of Shanghai

1
Faculty of Education, East China Normal University, Shanghai 200062, China
2
Key Laboratory of Geographic Information Science (Ministry of Education), East China Normal University, Shanghai 200241, China
3
Institute of Eco-Chongming, East China Normal University, Shanghai 200062, China
4
Department of Geography, Loughborough University, Loughborough LE11 3TU, UK
5
School of Environmental and Geographical Sciences, Shanghai Normal University, Shanghai 200234, China
*
Author to whom correspondence should be addressed.
Sustainability 2019, 11(2), 349; https://doi.org/10.3390/su11020349
Submission received: 16 December 2018
/
Revised: 30 December 2018
/
Accepted: 8 January 2019
/
Published: 11 January 2019
(This article belongs to the Special Issue Sustainable Urban and Regional Management)
Abstract
:Schools and students are particularly vulnerable to natural hazards, especially pluvial flooding in cities. This paper presents a scenario-based study that assesses the school vulnerability of emergency services (i.e., Emergency Medical Service and Fire & Rescue Service) to urban pluvial flooding in the city center of Shanghai, China through the combination of flood hazard analysis and GIS-based accessibility mapping. Emergency coverages and response times in various traffic conditions are quantified to generate school vulnerability under normal no-flood and 100-y pluvial flood scenarios. The findings indicate that severe pluvial flooding could lead to proportionate and linear impacts on emergency response provision to schools in the city. Only 11% of all the schools is predicted to be completely unreachable (very high vulnerability) during flood emergency but the majority of the schools would experience significant delay in the travel times of emergency responses. In this case, appropriate adaptations need to be particularly targeted for specific hot-spot areas (e.g., new urbanized zones) and crunch times (e.g., rush hours).
1. Introduction
Flooding from pluvial sources, as one of the most common natural hazards around the world, can lead to not only considerable personal injuries and property damages but also cascading impacts on public service provision and socio-economic activities [1,2,3,4,5,6,7]. Pluvial flooding is generally characterized by heavy rain and inadequate drainage capacity, especially in the cities where growth of population has significantly outpaced the constructions of urban infrastructure such as the sewer system [8]. Pluvial flash flood events are usually characterized by a very fast evolution in a short time, mostly less than 6 h [9], allowing little warning and response time. Indeed, pluvial flooding appear to be increasing owing to rapid urbanization and climatic change [10,11,12,13,14,15,16] and it is attracting more public concern and media coverage. This can be evidenced by the most recent pluvial flood events in mega cities globally, such as Beijing (July 2012), London (June 2016) and Houston (August 2017). It has been found that critical facilities such as school buildings and vulnerable people such as school children were mostly affected by the pluvial flood events [17].
As a response to the High Level Dialogue Communiqué at the 2013 Global Platform for Disaster Risk Reduction, the United Nations (UN) Office for Disaster Risk Reduction (UNISDR) is facilitating a comprehensive school safety framework “Worldwide Initiative for Safe Schools” which is composed of three elements: 1) safe learning facilities; 2) school disaster management; and 3) disaster risk reduction and resilience education. “Substantially reducing disaster damage to educational facilities” was listed as one of seven global targets for The Sendai Framework for Disaster Risk Reduction 2015–2030, which was issued at the third UN World Conference on Disaster Risk Reduction in 2015. The major indicators for estimating the target are directed to reduce the degree of disruptions to education activities and the number of damaged or destroyed educational facilities caused by disasters [18]. However, schools in areas which are less concerned with seasonal and/or predictable hazards including storm and flooding, are less likely to have emergency preparedness and contingency planning, in comparison with those in areas which are attacked by unpredictable disasters such as earthquakes [19]. Although most of the school communities have contingency plans for response and evacuation, a lot of schools do not regularly conduct drills and do not coordinate with local emergency response authorities such as Fire & Rescue Service (FRS) and Emergency Medical Service (EMS) [20].
When an emergency situation occurs on campus, school administrators and staffs may perform as the first responders before local emergency response services reaching. Although a high percentage of schools have simple and light facilities and equipment such as fire extinguishers and small medical instruments to conduct preliminary emergency aid [21,22,23,24,25], past experiences show that emergency response trainings for school teachers and students is insufficient [26,27,28]. Therefore, emergency services are especially important to provide professional responses and rescues for all schools and students. Emergency responders are often required to dispatch emergency rescue vehicles to reduce losses and save lives within specific timeframes. For example, EMS are mandated or recommended by NYC and London to meet 10 min, including End-to-End response time of pickup, dispatching, processing and traveling. Compared to the normal no-flood conditions, there is always a significant increase in water rescues and the other emergency calls during a flood event. Urban transport network can be inundated in a varying degrees by pluvial flooding, leading to significant travel delay and extensive interruption of emergency responses. The performance of emergency services to schools and students may be largely limited during pluvial flood emergencies.
Although there is a huge demand for addressing school safety and emergency management to natural hazards, until now, very little studies have attempt to systematically investigate the flood impacts on emergency service provisions to schools and students at city scale. The majority of published literature have been conducted on school-based disaster preparedness, school disaster safety education and school disaster emergency management and plan, mostly in the English-speaking countries such as Australia, the United Kingdom and the United States. For instance, Boon et al. [29] assessed school emergency management policies and guidelines in natural disaster emergencies for disabled students in schools in Australia, indicating that emergency preparedness planning and management is under resourced and possibly neglected with respect to addressing the needs of such students. Students with physical disabilities may be not able to escape to the evacuation places on higher ground in a pluvial flash flood event. In another research conducted by Kibble [30] in the United Kingdom, the crisis management guidance given by local education authorities to schools has been examined, suggesting that preventive and precautionary measures should be paid more attention to cope with fires, floods, incidents and structural damages. In addition, Shah et al. [31] investigated the school emergency preparedness in a province of Pakistan which had recently been severely affected by floods. The study revealed that although sample schools have undertaken many steps towards flood preparedness, most of the schools in the survey have experienced more than one flood event.
Within this paper, a scenario-based approach was proposed by incorporating flood inundation detection, GIS-based network analysis and school vulnerability assessment, to identify the cascading impacts of pluvial flash flooding on emergency responses for vulnerable schools and students in cities. The downtown of Shanghai, China where a lot of schools and students are susceptible to pluvial flooding, is used as the study area, in respect to EMS and FRS. The focuses of this study are: (1) to delineate emergency service coverages within defined timeframes under normal and flood conditions; (2) to assess the vulnerability of emergency responses to schools and students during pluvial flood emergencies; (3) to develop future adaptations to help vulnerable schools and emergency responders improve emergency response provisions. The rest of the study is organized as follows: Section 2 introduces the materials and methods, including the description of conceptual framework, study site and sample, pluvial flood scenarios, emergency service mapping and school vulnerability assessment; Section 3 presents the results and discusses the major findings; and Section 4 finally summarizes the conclusions and provides suggestions for future researches.
2. Materials and Methods
2.1. Conceptual Framework
This study employs recent advances in flood scenario analysis and spatial accessibility mapping to develop a framework for the vulnerability assessment of school-based flood emergency response in cities. A preliminary overview of the conceptual framework is shown in Figure 1. This contextual picture emphasizes on evaluating operational responses from emergency nodes to schools and students under normal and pluvial flood conditions. Based on adequate knowledge, attitude, coordination and communication between schools and responders, we establish the core concept of school flood emergency management demands [32]. We firstly compile comprehensive, up-to-date and accurate information regarding urban pluvial flooding (e.g., extent and depth) through probability analysis and rainfall-runoff modeling. After identification of flood restrictions for road network, emergency response accessibility to schools can be mapped under no flood and flood scenarios by using big data and GIS network analysis. Next, school vulnerability in terms of flood emergency services can be assessed according to the responses times. Finally, the operational contingency plan should be formulated to provide robust decision making support for policy makers, school headmasters, emergency responders and other concerned stakeholders.
2.2. Study Site and Sample
The city center of Shanghai, China is selected as the study area because it is a typical flood-prone area and is particularly vulnerable to pluvial flash flooding. The area covers about 666 km2 and has a permanent population of 11.35 million in 2017. It is frequently affected by tropical cyclones and strong convective weather which always bring heavy and extreme rainfalls between June and September (i.e., the flood season). Quan [33] indicates that pluvial flood events makes up 54% of total flood disasters in Shanghai from AD 251 to 2000. In recent years, severe pluvial flood event occurs every few years and the recorded precipitation events can be witnessed in succession (i.e., August 2008, 117.5 mm/h and September 2013, 124 mm/h), resulting in widespread interruption of urban traffic and emergency services to schools. Urban drainage network including pumps and sewer pipes is the major way to take excess storm water and prevent increased pluvial flooding. At present, distributed drainage capacity in the study site is designed to cope with 1 in 3 or 5 year precipitation (49.6 mm/h or 56.3 mm/h) for some critical regions (e.g., central business districts) and 1 in 1 year precipitation (36mm/h) for the common regions.
The study area has been the downtown part of the city historically and thus consists of a typical urban patterns such as heavy traffic, crowded buildings and extensive imperviousness. Most of the schools and over 2.5 million students distribute within the city’s outer ring. There are 2020 schools scattered in both the inner and outer ring, accounting for 61% of the total in Greater Shanghai. Among the target schools, 964 (47.7%) are nursery schools, 488 (24.2%) are primary schools and 568 (28.1%) are middle schools. Moreover, a total of 57 EMS stations and 61 fire houses across the study area provide emergency services for all schools and students. The location map of schools and responders is shown in Figure 2.
2.3. Pluvial Flood Scenarios
Existing city-wide pluvial flood inundation maps are directly obtained from the Key Laboratory of Geographic Information Science (Ministry of Education), East China Normal University. Pluvial flood event with 100-year return period is considered in this study as the recorded flood magnitude actually occurred during the past years and greatly overwhelmed the design capacity of local drainage systems, leading to city-wide severe inundation. A calibrated/validated inundation model (FloodMap-HydroInundation2D) which couples hydrological module (e.g., evapotranspiration and infiltration) with flood routing technique, is used to derive urban pluvial flood risks in the modelling. A spatially uniform precipitation involved in the modelling, is calculated for design storm hyetograph of one-hour duration by using Shanghai rainstorm formula and Chicago hydrographic model. A relatively high Manning’s n value of 0.06 is applied in the modelling process, representing the effect of urban surface features on flood routing. The flood modelling also includes a default evapotranspiration value of 3 mm/day and a uniform capacity of 36 mm/h to account for drainage/infiltration in the urban environment. Based upon a high resolution (5 m) Digital Surface Model provided by Shanghai Municipal Institute of Surveying and Mapping, the inundation modeling is performed to generate the potential areas that are subject to pluvial flash flooding in the city. Detailed information on the urban pluvial flood modelling employed in the analysis can be referenced in Yin et al. [34] and Li et al. [35].
2.4. Accessibility Mapping and Vulnerability Assessment
The analysis process is carried out via three steps for emergency response accessibility mapping and school vulnerability assessment. In the first stage, flood restrictions should be defined by the data presented in the previous section and can be treated as barriers in the road network. Water depths between 25 and 30 cm may stall a vehicle and even cause loss of control and are generally adopted as critical thresholds for road closures in many cities around the world [36]. Due to a greater tolerance of emergency vehicles, water depth of 30 cm is set as a tipping point in this study. Surface road segments with water depths higher than 30 cm are manually identified and then are processed as impedances in the network. The second step is conducted for the construction of transport network topology, on the basis of a GIS dataset of city-wide road geometry derived from widely used AMAP Data Portal in China. An integrated transport network is generated in ArcGIS by defining connectivity rules and network attributes (e.g., speed limits, turn restrictions and traffic directions). In the next step, based upon the quickest routing algorithm, emergency response accessibility is quantified using two metrics: (1) service coverages from emergency stations within the specified timeframes; and (2) the shortest time between facilities and schools under normal and pluvial flood scenarios. As traffic flows show a significant variation in a working day, two temporal scenarios (i.e., T1-rush hours and T2-daytime) of average travel speed for each road type are derived from a real-time traffic report of AMAP Navigation and implemented into network analysis to account for the effect of traffic conditions such as congestion. With the network-based spatial analysis tools in Network Analyst toolbar, optimized routes, drive times, closest facilities, service areas and location allocation can be performed on a configurable transportation networks in ArcMap. Despite a strong capability, there are inherent limitations associated with GIS network analysis approaches, including the difficulty and complexity of accounting for live traffic conditions.
In the last stage of vulnerability assessment, the ranking scheme of school vulnerability is primarily based on the definition of emergency response times. Many students always have not enough time to evacuate or find a safe place within the building during a pluvial flash flood event which generally occurred in a very short time [37]. In terms of EMS, 8 min are commonly regarded as the Golden Time and increasingly recommended to be the criterion of medical emergency response [38]. However, the average response time at current state in Shanghai is just only 15 min but try to reach 12 min in near future (2020). For FRS, the time limits of 5 min are mandated by China legislation. In actual operation, FRS is just required to reach incident within 10 min for built-up region and 15 min for suburban district. Therefore, three response time targets are defined for EMS (8, 12 and 15 min) and FRS (5, 10 and 15 min), respectively. Consequently, schools which fall into emergency service areas within different response timeframes, would be classified into 5 vulnerability categories as follows: (1) very low, within 5 and 8 min for FRS and EMS; (2) low, within 5–10 and 8–12 min for FRS and EMS; (3) medium, within 10–15 and 12–15 min for FRS and EMS; (4) high, beyond 15 min for FRS and EMS; and (5) very high, completely inaccessible for FRS and EMS.
3. Results and Discussion
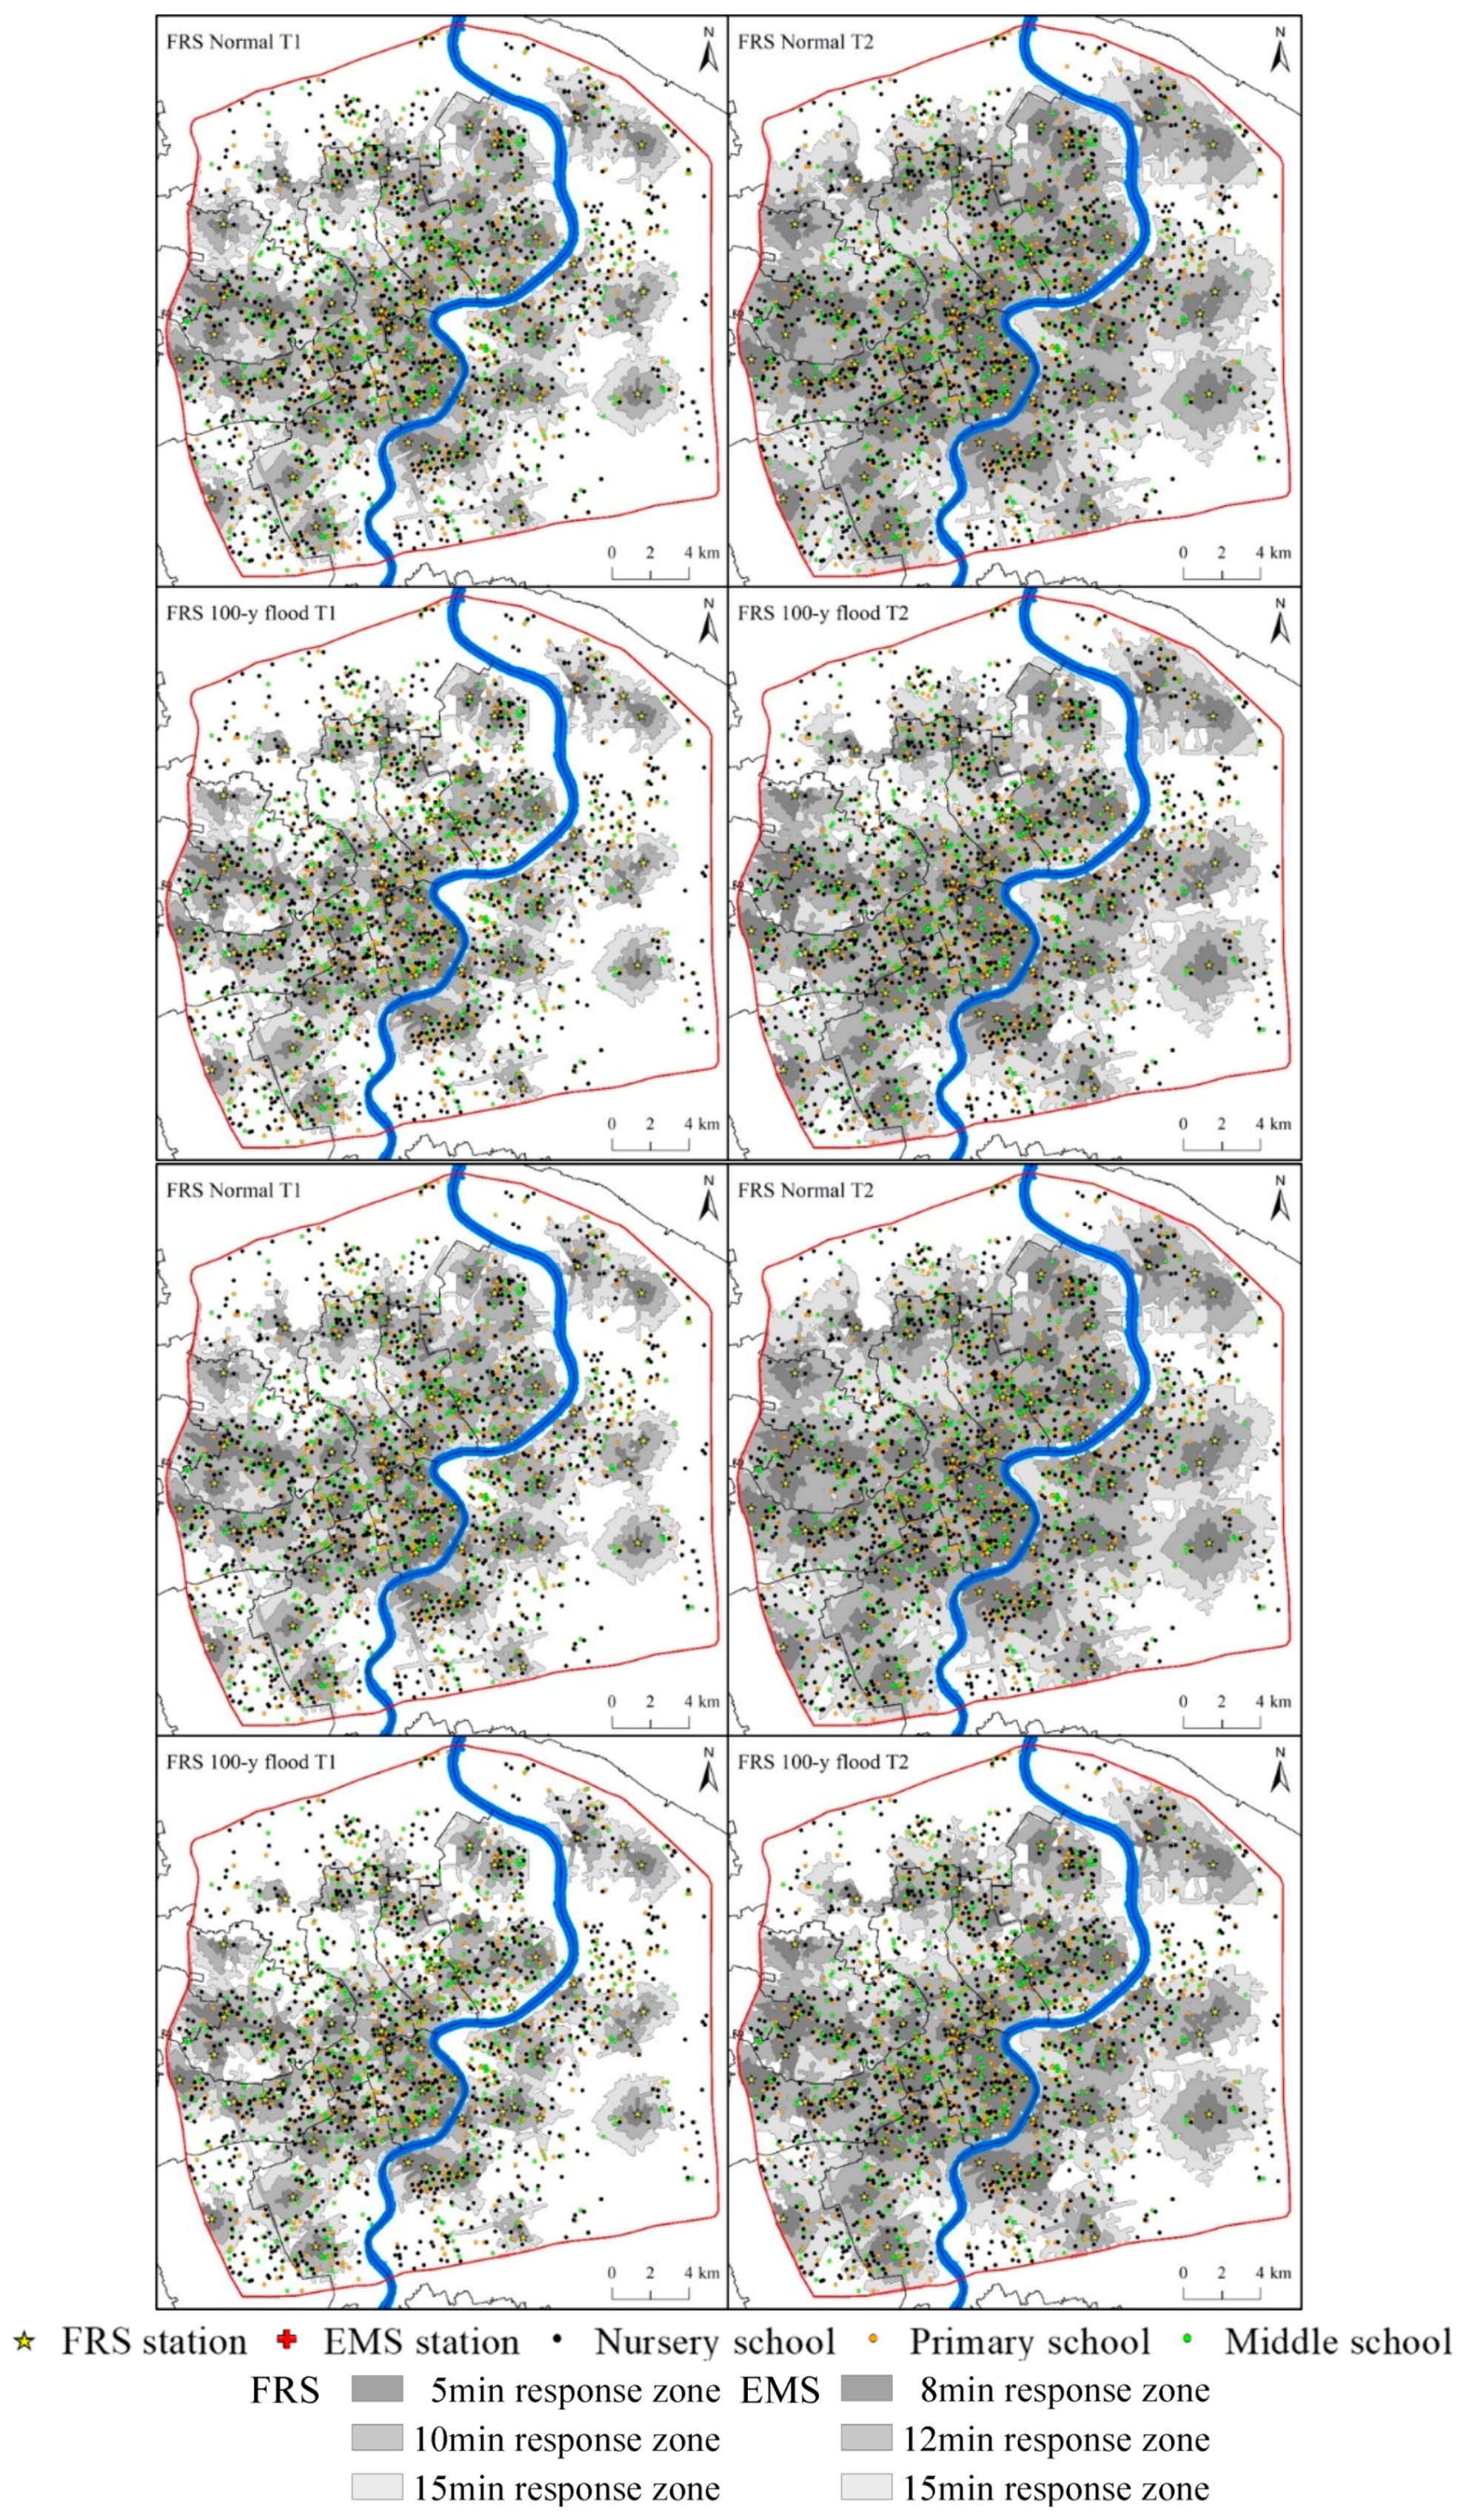
EMS and FRS to schools within specific timeframes under normal and 100-y flood scenarios have been presented and summarized in Figure 3 and Table 1, respectively. Results show that under no-flood condition, all schools in the study site are expected to be accessible for emergency responses. Although EMS and FRS could reach most of the schools in 15 min, the targets of emergency response would not be completely achievable even when operating under normal conditions. This can be principally attributed to uneven distribution of emergency stations and some notable “blind spots” of emergency services. These can be observed in the northern and western parts of the study area which generally are the rural-urban fringe zones. Another important finding is that traffic conditions exert a significant impact on daily emergency responses to schools. Compared with EMS and FRS coverages in daytime, emergency service to schools in rush hours are shown to experience a 10–30% reduction in response areas. Despite less stations, EMS is predicted to provide more service coverages for schools than FRS. This is due to its relatively strategic positioning over the central Shanghai. In addition, emergency provisions to nursery schools are slightly less than those for primary and middle schools.
When 100-y pluvial flood restrictions are incorporated into the network analysis, the modelling suggested that 84.1% and 68.8% of the schools would be accessible within 15 min or less under normal (daytime) and congested (rush hours) traffic conditions respectively (Table 1). 11% of the schools is predicted to be inaccessible, among which 138 (14%) nursery schools is shown to be completely unreachable by emergency services (Table 1). Compared with normal operating condition, 100-y pluvial flooding results in minor to moderate impacts on response coverages to schools. This is primary due to the overlaps in emergency station coverages, particularly in downtown areas. The overlaps, to a great degree, compensate for significant reductions in the service areas caused by pluvial flood inundation. Although the west of the Huangpu River appears to be able to maintain most of the spatial coverage to schools, areas to the east and north of Shanghai city center would experience significant disruptions in emergency provisions. This is because that there would be insufficient overlap between service areas of individual station and a lot of key access routes surrounding certain emergency stations are inundated. For example, the flood impact on EMS is predicted to be more pronounced compared to that of FRS, because several EMS centers are directly isolated by pluvial floodwater and thus cannot provide any services for schools (loss of function).
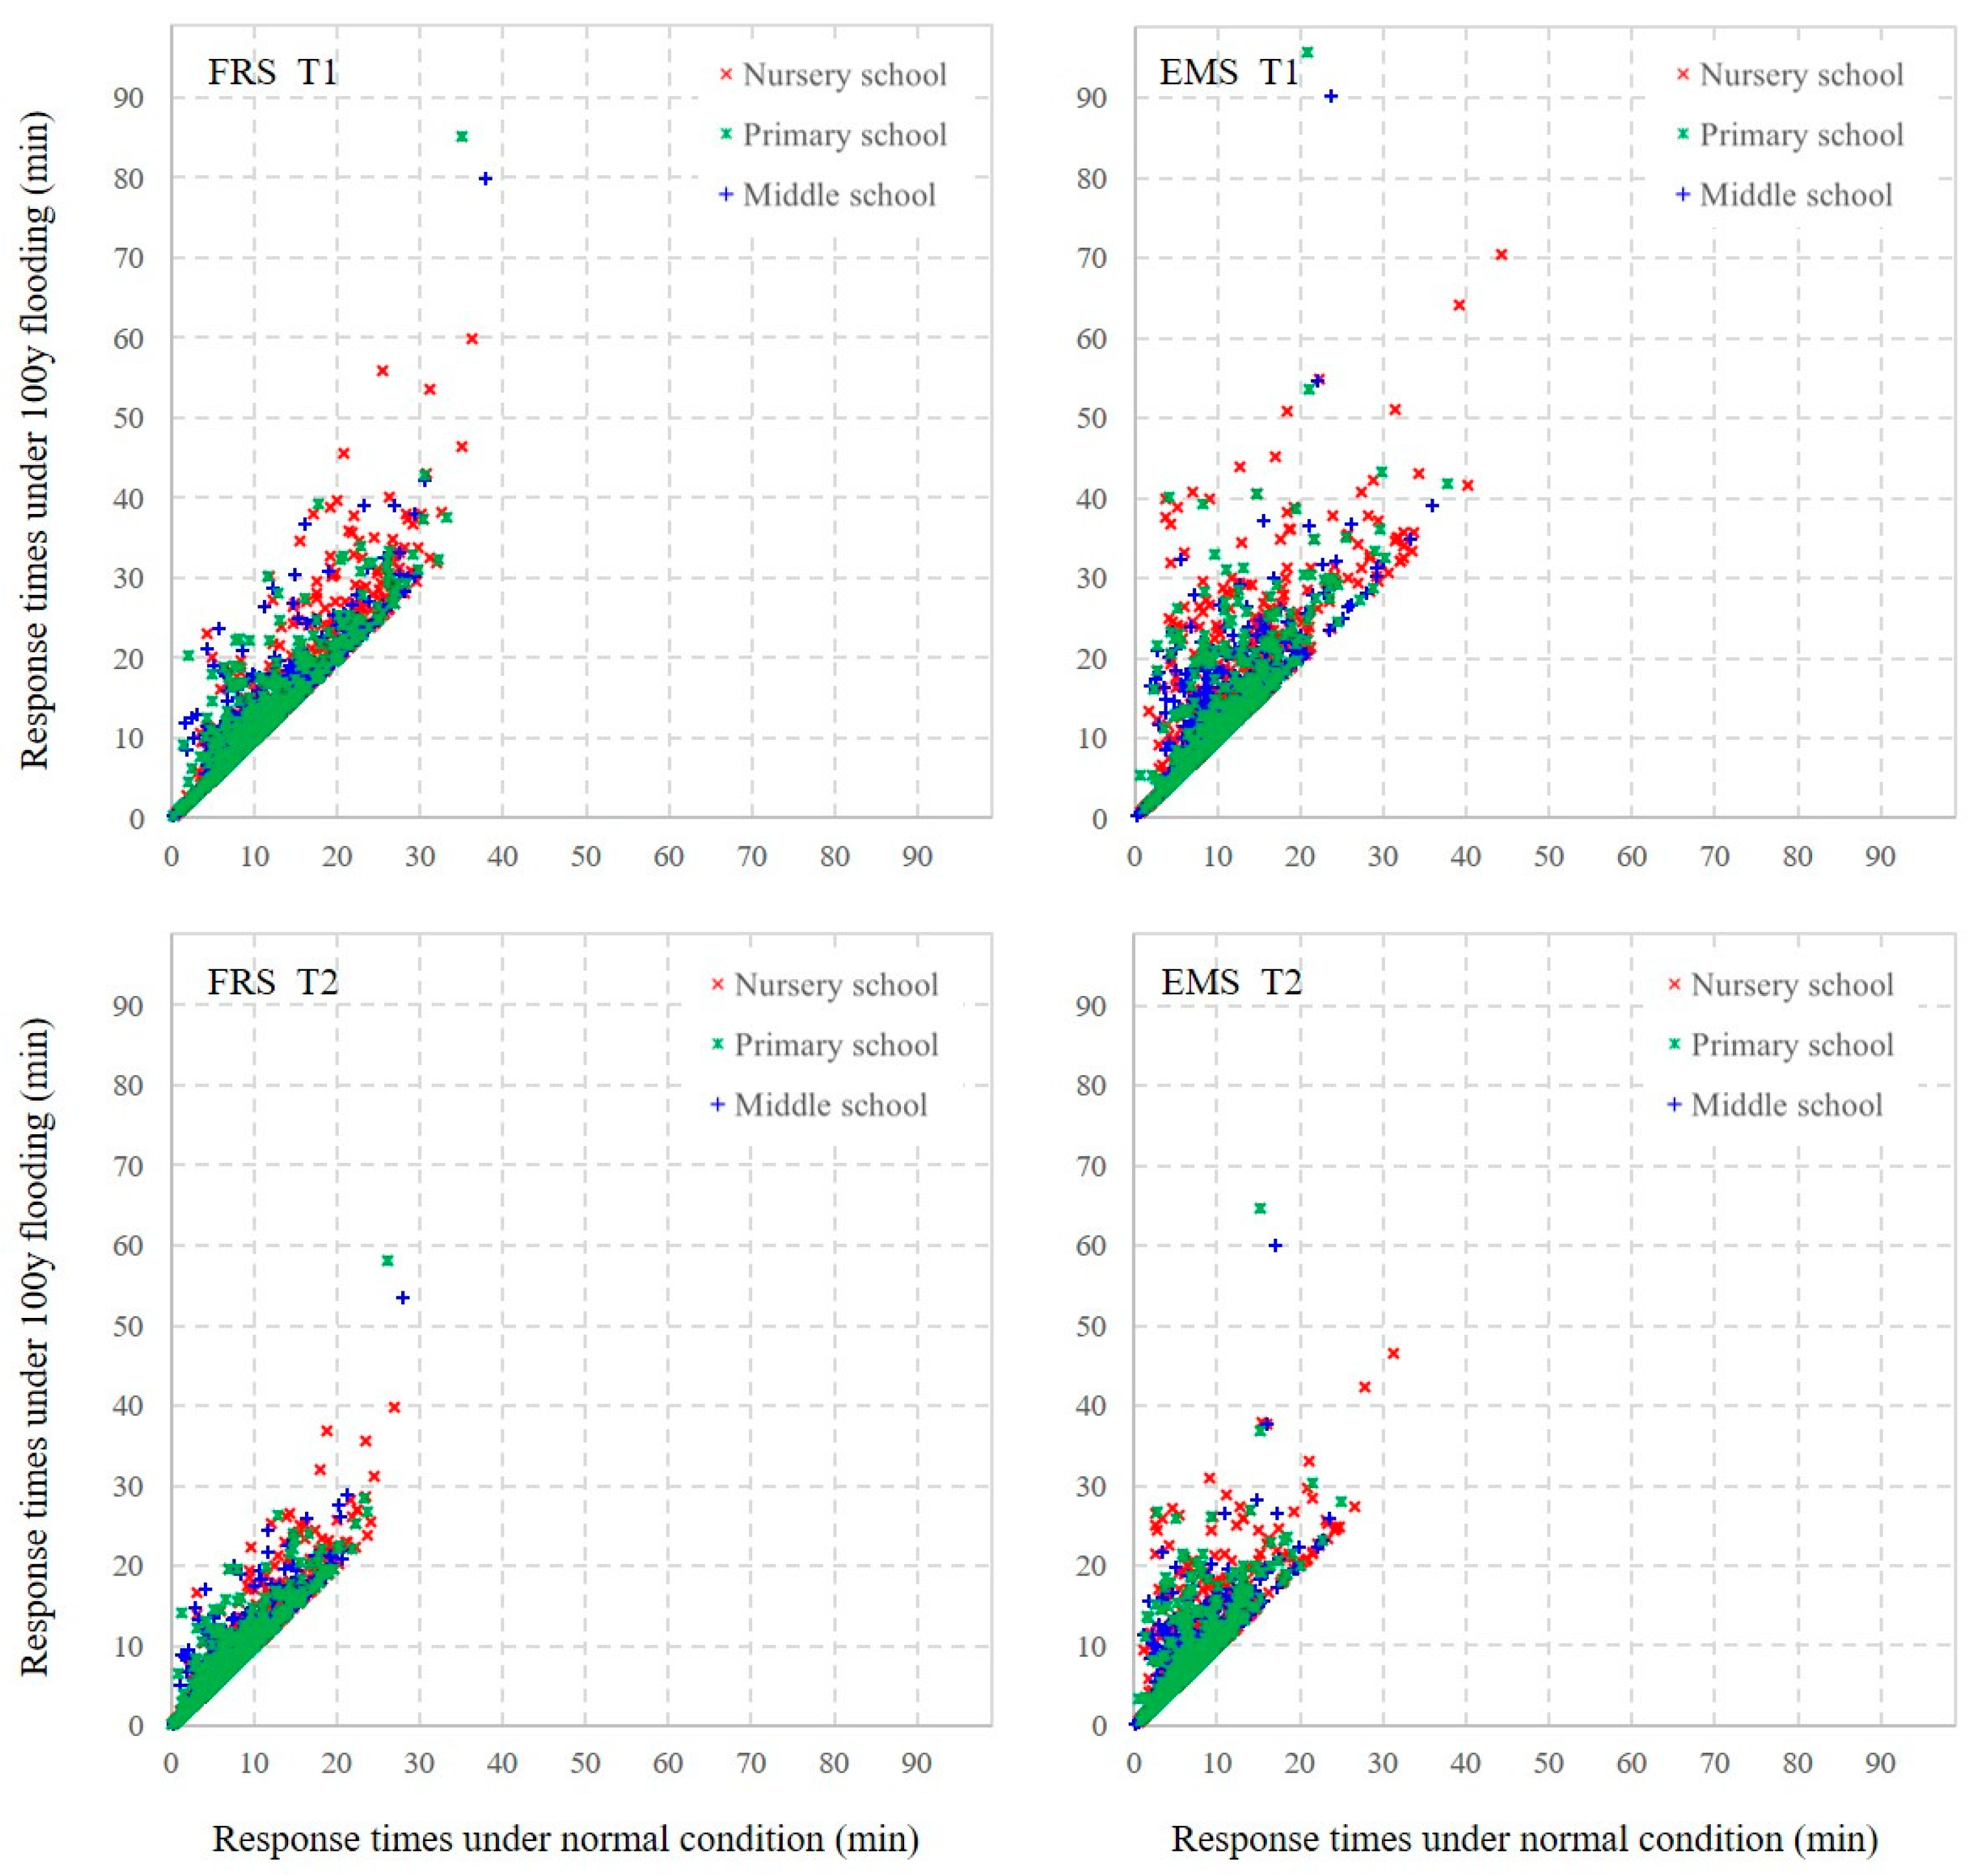
The vulnerability ranking of emergency response to schools under normal and flood condition are illustrated in Figure 4. It can be found that under normal no-flood condition, schools located in the traditional and mature communities of downtown are mostly classified as very low or low vulnerability as emergency stations have been strategically placed to provide sufficient coverages. By contrast, emergency responses would be less accessible to schools in the new urbanized areas (e.g., periphery of outer ring) where a variety of facilities and public services have not been well established. However, the school vulnerability show variations in spatial distribution in 100-y flood scenario. Due to the flood impacts on emergency provisions, a large number of schools would experience significant increases in vulnerabilities, particularly in the city center such as Lujiazui financial district. A comparison of modeled response times under normal and 100-y flood scenarios shown in Figure 5 also confirms the visual inspection in Figure 3 and Figure 4. Significant deviations in the modelled response times can be clearly observed between normal and 100-y flood scenarios, especially in terms of EMS and in rush hours (T1). The impact in terms of response time is generally proportionate to the magnitude of flood event. It is found that 100-y pluvial flooding would lead to on average 1–3 min delay in the travel times of emergency responses to schools. The primary schools would be most severely affected by the flooding in terms of travel delay and the nursery schools take second place. For example, compared to normal condition, the average response times to the primary schools are shown to increase by 2.8 min with a maximum delay of 75 min in rush hours when 100-y flood restrictions are presented.
It should also be noted that the results presented herein does not consider all the complexity of flood emergency response to schools and thus some factors may introduce uncertainties into the final estimates. For example, a flood scenario could lead to “chaos” in the city and the emergency responders would have their hands full. Due to limited resources (e.g., manpower, vehicles and equipment), schools and students maybe not prioritized by the emergency responders in such cases. Many buildings and groups would be at risk and some maybe more so than the schools and students. Given the scenario-based nature, the possible errors are assumed to be reasonable and acceptable in this study.
Since emergency responses to schools and students in Shanghai are particularly susceptible to the impacts of urban flooding from pluvial source, adaptation measures must be initiated to alleviate the potential negative consequences. These could be divided into two aspects, one related to emergency responders and the other relevant to school authorities. As the first emergency service providers, FRS and EMS should more strategically place emergency resources such as stations and stand-by vehicles to minimize the “blind spots” and maximize spatial coverages within specific timeframes throughout the city. Furthermore, inflatable boats and waterproof emergency vehicles could be implemented by the first responders for water rescue operations. These recommendations resemble the suggestions in terms of urban flood emergency response made by Green et al. [5], Coles et al. [6] and Yin et al. [7]. From the perspectives of education agencies/organizations, school emergency management activities including emergency planning, preparedness, education and training should be carried out to avoid or mitigate the flood impacts on teachers and students. Schools can also cooperate with their local partners including police department, fire department, emergency medical centers and hospitals for technical guidance and assistance when offering first aid treatment to students during flood emergencies. The major findings are similar to what other studies have called for [18,29,31,32].
4. Conclusions
This study assesses the vulnerability of schools and educational facilities against urban pluvial flooding in the city center of Shanghai in terms of emergency response perspectives using flood hazard analysis and GIS-based accessibility mapping. On the basis of the research outcomes, a couple of conclusions can be drawn. Findings indicate that a number of schools and students in Shanghai City could be “not safe” enough even under normal no-flood conditions. Urban pluvial flood events could result in limited and linear impacts on emergency response provision to schools. Schools with high and/or very high flood vulnerability in terms of emergency responses mostly located at specific sites (e.g., new urbanized and/or fringe zones) where public facilities and infrastructures have not been well placed. It also exposes the fact that the performance of emergency services to schools greatly depends on traffic conditions. Therefore, school authorities should coordinate with emergency responders and other local partners in order to strengthen emergency preparedness efforts.
The analysis may assist school administrators, emergency responders and other concerned stakeholders to better understand the potential school vulnerability of emergency services to urban pluvial flood events and helps to develop policy-making for flood risk management and school contingency planning. However, limitations of this study must be acknowledged. To gain more robust conclusions, further researches can be undertaken in three aspects: (1) including more flood scenarios with various return periods would give a fuller picture of the flood risks faced by the city and schools; (2) consideration should also be given to model calibration and validation aspects in terms of both traffic modeling and student behavior during flood emergency; (3) incorporating the effect of existing emergency preparedness activities conducted by schools would be a significant progress. The methodology proposed here provides a flexible and feasible framework for assessing the flood vulnerability of school emergency responses. Taking into account the above limitations and suggestions, this approach could be readily applied in other cities where schools and students are particularly vulnerable to increasing threat from urban flooding in a changing environment.
Author Contributions
Conceptualization, J.Y. and B.L.; methodology, J.Y.; software, J.Y. and D.Y.; validation, J.Y., D.Y. and Y.Y.; formal analysis, J.Y.; investigation, Y.J.; resources, D.Y.; data curation, Y.J.; writing—original draft preparation, J.Y.; writing—review and editing, J.Y. and M.Y.; visualization, J.Y.; supervision, J.Y.; project administration, J.Y.; funding acquisition, J.Y.
Funding
This work is sponsored by Peak Discipline Construction Project of Education at East China Normal University, the National Natural Science Foundation of China (Grant no: 41871164, 41601568 and 51761135024), the National Social Science Fund of China (Grant no: 18ZDA105), the National Key Research and Development Program of China (Grant no: 2017YFE0100700 and 2017YFE0107400), the Humanities and Social Science Project of Education Ministry of China (Grant no: 17YJAZH111), the Natural Science Foundation of Shanghai (Grant no: 18ZR1410800) and the Fundamental Research Funds for the Central Universities (Grant no: 2018ECNU-QKT001 and 2017ECNU-KXK013).
Conflicts of Interest
The authors declare no conflict of interest.
References
- Ramos, M.H.; Creutin, J.D.; Leblois, E. Visualization of storm severity. J. Hydrol. 2005, 315, 295–307. [Google Scholar] [CrossRef]
- Mejía, A.I.; Moglen, G.E. Impact of the spatial distribution of imperviousness on the hydrologic response of an urbanizing basin. Hydrol. Process. 2010, 24, 3359–3373. [Google Scholar] [CrossRef]
- Smith, J.A.; Baeck, M.L.; Villarini, G.; Welty, C.; Miller, A.J.; Krajewski, W.F. Analyses of a long-term, high-resolution radar rainfall data set for the Baltimore metropolitan region. Water Resour. Res. 2012, 48, W04504. [Google Scholar] [CrossRef]
- Wright, D.B.; Smith, J.A.; Villarini, G.; Baeck, M.L. Hydroclimatology of flash flooding in Atlanta. Water Resour. Res. 2012, 48, W04524. [Google Scholar] [CrossRef]
- Green, D.; Yu, D.; Pattison, I.; Wilby, R.; Bosher, L.; Patel, R.; Thompson, P.; Trowell, K.; Draycon, J.; Halse, M.; et al. City-scale accessibility of emergency responders operating during flood events. Nat. Hazards Earth. Syst. Sci. 2017, 17, 1–16. [Google Scholar] [CrossRef] [Green Version]
- Coles, D.; Yu, D.; Wilby, R.L.; Green, D.; Herring, Z. Beyond ‘flood hotspots’: Modelling emergency service accessibility during flooding in York, UK. J. Hydrol. 2017, 546, 419–436. [Google Scholar] [CrossRef] [Green Version]
- Yin, J.; Yu, D.; Lin, N.; Wilby, R.L. Evaluating the cascading impacts of sea level rise and coastal flooding on emergency response spatial accessibility in Lower Manhattan, New York City. J. Hydrol. 2017, 555, 648–658. [Google Scholar] [CrossRef]
- Pitt, M. Learning Lessons from the 2007 Floods; An Independent Review by Sir Michael Pitt; Cabinet Office: London, UK, 2008.
- Naulin, J.P.; Payrastre, O.; Gaume, E. Spatially distributed flood forecasting in flash flood prone areas: Application to road network supervision in Southern France. J. Hydrol. 2013, 486, 88–99. [Google Scholar] [CrossRef] [Green Version]
- Du, J.K.; Qian, L.; Rui, H.Y.; Zuo, T.H.; Zheng, D.P.; Xu, Y.P.; Xu, C.Y. Assessing the effects of urbanization on annual runoff and flood events using an integrated hydrological modeling system for Qinhuai river basin, China. J. Hydrol. 2012, 464–465, 127–139. [Google Scholar] [CrossRef]
- Suriya, S.; Mudgal, B.V. Impact of urbanization on flooding: The thirusoolam sub watershed—A case study. J. Hydrol. 2012, 412, 210–219. [Google Scholar] [CrossRef]
- Zhou, Q.; Mikkelsen, P.S.; Halsnæs, K.; Arnbjerg-Nielsen, K. Framework for economic pluvial flood risk assessment considering climate change effects and adaptation benefits. J. Hydrol. 2012, 414, 539–549. [Google Scholar] [CrossRef]
- Wu, X.; Yu, D.; Chen, Z.; Wilby, R.L. An evaluation of land surface modification, storm sewer development and rainfall variation on waterlogging risk in Shanghai. Nat. Hazards 2012, 63, 305–323. [Google Scholar] [CrossRef]
- IPCC (Intergovernmental Panel on Climate Change). Climate Change 2013: The Physical Science Basis; Cambridge University Press: Cambridge, UK, 2013. [Google Scholar]
- Xia, J.; Zhang, Y.Y.; Xiong, L.H.; Shan, H.E.; Wang, L.F.; Zhongbo, Y.U. Opportunities and challenges of the Sponge City construction related to urban water issues in China. Sci. China Earth Sci. 2017, 60, 652–658. [Google Scholar] [CrossRef]
- Jiang, Y.; Zevenbergen, C.; Ma, Y. Urban pluvial flooding and storm water management: A contemporary review of China’s challenges and “sponge cities” strategy. Environ. Sci. Policy 2018, 80, 132–143. [Google Scholar] [CrossRef]
- UNISDR (United Nations International Strategy for Disaster Reduction). Towards a Culture of Prevention: Disaster Risk Reduction Begins at School—Good Practices and Lessons Learned; Valency, R.A., Lazarte, J., Eds.; UNISDR: Geneva, Switzerland, 2007; Available online: https://www.unisdr.org/files/761_education-good-practices.pdf (accessed on 16 May 2018).
- Sakurai, A.; Bisri, M.B.F.; Oda, T.; Oktari, R.S.; Murayama, Y.; Nizammudin; Affan, M. Exploring minimum essentials for sustainable school disaster preparedness: A case of elementary schools in Banda Aceh City, Indonesia. Int. J. Disaster Risk Reduct. 2018, 29, 73–83. [Google Scholar] [CrossRef]
- Kano, M.; Bourque, L.B. Experiences with and preparedness for emergencies and disasters among public schools in California. NASSP Bull. 2007, 91, 201–218. [Google Scholar] [CrossRef]
- Graham, J.; Shirm, S.; Liggin, R.; Aitken, M.E.; Dick, R. Mass-casualty events at schools: A national preparedness survey. Pediatrics 2006, 117, 8–15. [Google Scholar] [CrossRef]
- Allen, K.; Ball, J.; Helfer, B. Preventing and managing childhood emergencies in schools. J. Sch. Nurs. 1998, 14, 20–24. [Google Scholar]
- Abrunzo, T.; Gerardi, M.; Dietrich, A.; Lampell, M.; Sanford, W.C.; Smith, D.M. The role of emergency physicians in the care of the child in school. Ann. Emerg. Med. 2000, 35, 155–161. [Google Scholar] [CrossRef]
- Jones, S.E.; Brener, N.D.; McManus, T. Prevalence of school policies, programs and facilities that promote a healthy physical school environment. Am. J. Public Health 2003, 93, 1570–1575. [Google Scholar] [CrossRef]
- Bobo, N.; Hallenbeck, P.; Robinson, J. Recommended minimal emergency equipment and resources for schools: National consensus group report. J. Sch. Nurs. 2003, 19, 150–156. [Google Scholar] [CrossRef] [PubMed]
- Brener, N.D.; Pejavara, A.; Barrios, L.C.; Crossett, L.; Lee, S.M.; McKenna, M.; Michael, S.; Wechsler, H. Applying the School Health Index to a nationally representative sample of schools. J. Sch. Health 2006, 76, 57–66. [Google Scholar] [CrossRef] [PubMed]
- Gagliardi, M.; Neighbors, M.; Spears, C.; Byrd, S.; Snarr, J. Emergencies in the school setting: Are public school teachers adequately trained to respond? Prehosp. Disaster Med. 1994, 9, 222–225. [Google Scholar] [CrossRef]
- Sapien, R.E.; Allen, A. Emergency preparation in schools: A snapshot of a rural state. Pediatr. Emerg. Care 2001, 17, 329–333. [Google Scholar] [CrossRef] [PubMed]
- Chung, S.; Danielson, J.; Shannon, M. School-Based Emergency Preparedness: A National Analysis and Recommended Protocol; Prepared under Contract No. 290-00-0020; AHRQ Publication No. 09-0013; Agency for Healthcare Research and Quality: Rockville, MD, USA, 2008.
- Boon, H.J.; Pagliano, P.; Brown, L.; Tsey, K. An Assessment of Policies Guiding School Emergency Disaster Management for Students with Disabilities in Australia. J. Policy Pract. Intell. 2012, 9, 17–26. [Google Scholar] [CrossRef]
- Kibble, D.G. A survey of LEA guidance and support for the management of crises in schools. Sch. Leadersh. Manag. 1999, 19, 373–384. [Google Scholar] [CrossRef]
- Shah, A.A.; Ye, J.; Pan, L.; Ullah, R.; Shah, S.I.A.; Fahad, S. Schools’ flood emergency preparedness in Khyber Pakhtunkhwa Province, Pakistan. Int. J. Disaster Risk Sci. 2018, 9, 181–194. [Google Scholar] [CrossRef]
- Wang, J.J. Study on the context of school-based disaster management. Int. J. Disaster Risk Reduct. 2016, 19, 224–234. [Google Scholar] [CrossRef]
- Quan, R.S. Risk assessment of flood disaster in shanghai based on spatial–temporal characteristics analysis from 251 to 2000. Environ. Earth Sci. 2014, 72, 4627–4638. [Google Scholar] [CrossRef]
- Yin, J.; Yu, D.; Wilby, R.L. Modelling the impact of land subsidence on urban pluvial flooding: A case study of downtown Shanghai, China. Sci. Total Environ. 2016, 544, 744–753. [Google Scholar] [CrossRef] [Green Version]
- Li, M.; Kwan, M.; Yin, J.; Yu, D.; Wang, J. The potential effect of a 100-year pluvial flood event on metro accessibility and ridership: A case study of central Shanghai, China. Appl. Geogr. 2018, 100, 21–29. [Google Scholar] [CrossRef]
- Pregnolato, M.; Ford, A.; Wilkinson, S.M.; Dawson, R.J. The impact of flooding on road transport: A depth-disruption function. Transport. Res. D Transp. Environ. 2017, 55, 67–81. [Google Scholar] [CrossRef]
- Yin, J.; Yu, D.; Yin, Z.; Liu, M.; He, Q. Evaluating the impact and risk of pluvial flash flood on intra-urban road network: A case study in the city center of Shanghai, China. J. Hydrol. 2016, 537, 138–145. [Google Scholar] [CrossRef] [Green Version]
- Pons, P.T.; Markovchick, V.J. Eight minutes or less: Does the ambulance response time guideline impact trauma patient outcome? J. Emerg. Med. 2002, 23, 43–48. [Google Scholar] [CrossRef]
Figure 1.
Conceptual framework for the vulnerability assessment of school-based flood emergency responses in cities.
Figure 1.
Conceptual framework for the vulnerability assessment of school-based flood emergency responses in cities.

Figure 2.
Location of the study site.

Figure 3.
Emergency response zones within specific timeframes (5, 10, 15 min for FRS and 8, 12, 15 min for EMS) considering various traffic conditions under normal and 100-y flood scenarios.
Figure 3.
Emergency response zones within specific timeframes (5, 10, 15 min for FRS and 8, 12, 15 min for EMS) considering various traffic conditions under normal and 100-y flood scenarios.

Figure 4.
Vulnerability map of emergency responses to schools (i.e., nursery school, primary school and middle school) considering various traffic conditions under normal and 100-y flood scenarios.
Figure 4.
Vulnerability map of emergency responses to schools (i.e., nursery school, primary school and middle school) considering various traffic conditions under normal and 100-y flood scenarios.

Figure 5.
A comparison of modeled response times under normal and 100-y flood scenarios for FRS and EMS considering various traffic conditions.
Figure 5.
A comparison of modeled response times under normal and 100-y flood scenarios for FRS and EMS considering various traffic conditions.


Table 1.
Numbers and percentages (%) of schools (NS-nursery school, PS-primary school and MS-middle school) located within the specific timeframes of emergency services considering various traffic conditions under normal and 100-y flood scenarios.
Table 1.
Numbers and percentages (%) of schools (NS-nursery school, PS-primary school and MS-middle school) located within the specific timeframes of emergency services considering various traffic conditions under normal and 100-y flood scenarios.
| Emergency Services | Normal Condition and T1 | Normal Condition and T2 | 100-y Flood and T1 | 100-y Flood and T2 | ||||||||
|---|---|---|---|---|---|---|---|---|---|---|---|---|
| NS | PS | MS | NS | PS | MS | NS | PS | MS | NS | PS | MS | |
| FRS within 5 min | 126 (13%) | 77 (16%) | 94 (17%) | 272 (28%) | 165 (34%) | 214 (38%) | 97 (10%) | 55 (11%) | 75 (13%) | 211 (22%) | 125 (26%) | 162 (29%) |
| FRS within 10 min | 470 (49%) | 264 (54%) | 333 (59%) | 706 (73%) | 379 (78%) | 449 (79%) | 384 (40%) | 206 (42%) | 265 (47%) | 620 (64%) | 334 (68%) | 399 (70%) |
| FRS within 15 min | 718 (74%) | 377 (77%) | 464 (82%) | 859 (89%) | 453 (93%) | 536 (94%) | 634 (66%) | 340 (70%) | 416 (73%) | 779 (81%) | 420 (86%) | 500 (88%) |
| FRS out of 15 min | 964 (100%) | 488 (100%) | 568 (100%) | 964 (100%) | 488 (100%) | 568 (100%) | 826 (86%) | 445 (91%) | 525 (92%) | 826 (86%) | 445 (91%) | 525 (92%) |
| FRS inaccessible | 0 (0%) | 0 (0%) | 0 (0%) | 0 (0%) | 0 (0%) | 0 (0%) | 138 (14%) | 43 (9%) | 43 (8%) | 138 (14%) | 43 (9%) | 43 (8%) |
| EMS within 8 min | 377 (39%) | 180 (37%) | 251 (44%) | 616 (64%) | 337 (69%) | 413 (73%) | 272 (28%) | 132 (27%) | 182 (32%) | 473 (49%) | 253 (52%) | 330 (58%) |
| EMS within 12 min | 647 (67%) | 341 (70%) | 424 (75%) | 856 (89%) | 435 (89%) | 524 (92%) | 483 (50%) | 259 (53%) | 338 (60%) | 717 (74%) | 372 (76%) | 459 (81%) |
| EMS within 15 min | 788 (82%) | 412 (84%) | 500 (88%) | 906 (94%) | 464 (95%) | 547 (96%) | 633 (66%) | 335 (69%) | 415 (73%) | 791 (82%) | 413 (85%) | 505 (89%) |
| EMS out of 15 min | 964 (100%) | 488 (100%) | 568 (100%) | 964 (100%) | 488 (100%) | 568 (100%) | 825 (86%) | 445 (91%) | 525 (92%) | 825 (86%) | 445 (91%) | 525 (92%) |
| EMS inaccessible | 0 (0%) | 0 (0%) | 0 (0%) | 0 (0%) | 0 (0%) | 0 (0%) | 139 (14%) | 43 (9%) | 43 (8%) | 139 (14%) | 43 (9%) | 43 (8%) |
© 2019 by the authors. Licensee MDPI, Basel, Switzerland. This article is an open access article distributed under the terms and conditions of the Creative Commons Attribution (CC BY) license (http://creativecommons.org/licenses/by/4.0/).
Share and Cite
MDPI and ACS Style
Yin, J.; Jing, Y.; Yu, D.; Ye, M.; Yang, Y.; Liao, B. A Vulnerability Assessment of Urban Emergency in Schools of Shanghai. Sustainability 2019, 11, 349. https://doi.org/10.3390/su11020349
AMA Style
Yin J, Jing Y, Yu D, Ye M, Yang Y, Liao B. A Vulnerability Assessment of Urban Emergency in Schools of Shanghai. Sustainability. 2019; 11(2):349. https://doi.org/10.3390/su11020349
Chicago/Turabian StyleYin, Jie, Yameng Jing, Dapeng Yu, Mingwu Ye, Yuhan Yang, and Banggu Liao. 2019. "A Vulnerability Assessment of Urban Emergency in Schools of Shanghai" Sustainability 11, no. 2: 349. https://doi.org/10.3390/su11020349
Note that from the first issue of 2016, this journal uses article numbers instead of page numbers. See further details here.