Tradeoff between Hydropower and River Visual Landscape Services in Mountainous Areas

1
Institute of Mountain Hazards and Environment, Chinese Academy of Sciences, Chengdu 610041, Sichuan, China
2
University of the Chinese Academy of Sciences, Beijing 100049, China
3
State Key Laboratory of Hydraulics and Mountain River Engineering, College of Water Resource & Hydropower, Sichuan University, Chengdu 610065, Sichuan, China
*
Author to whom correspondence should be addressed.
Sustainability 2019, 11(19), 5509; https://doi.org/10.3390/su11195509
Submission received: 9 August 2019
/
Revised: 4 September 2019
/
Accepted: 25 September 2019
/
Published: 5 October 2019
Abstract
:Water retention is one of the important services provided by ecosystems. Water retention is also the basis for multiple other services, such as hydropower development, river continuity, and biodiversity. However, there are clear tradeoffs among these services. Tradeoffs are already a hot topic in ecosystem services research, but the tradeoff between hydropower and river visual landscape services (RVLS) has not yet been investigated. In this study, we used the Integrated Valuation of Ecosystem Services and Trade-offs (InVEST) hydropower model for spatial mapping of watershed services. The proportion of the inflow of power stations to annual flow was proposed as the indicator for RVLS. Finally, based on an evaluation of historical hydropower development, different flow recovery scenarios were set up, and the tradeoff relationship between hydropower and landscape services was analyzed. The results showed that the tradeoff between the hydropower service and RVLS in mainstream displayed obvious spatial and temporal changes. With the development of hydropower, the increase of hydropower services caused a rapid decline in RVLS. The difference of two service scores fell from 1.0 in 1958 to 0.52 in 2015. The tradeoff intensity showed a turbulent decline downstream, which was closely related to the cascades’ development. The tradeoff was reversible. Through the flow scheduling of the reservoir group, the RVLS of each river section can be basically restored, while the hydropower service decline was only 29%.
1. Introduction
Ecosystem services are the benefits that humans obtain from ecosystems [1]. The provision of ecosystem services depends on the structure and function of various ecosystems. Based on ecology and economics, different classifications of ecosystem services are developed. Among them, the four types of classification of supporting, provision, regulation, and culture service proposed by the Millennium Assessment are the most popular [2].
Rivers provide a variety of services in these four aspects, directly affecting human wellbeing [3]. Rivers provide a habitat for aquatic animals, which is a supporting service for maintaining aquatic biodiversity [4]. Provision services are the most important services of rivers. For instance, many urban water supplies rely heavily on surface water delivered by rivers. About 16% of global electricity demand is also met by hydropower services [5]. Adjusting services are also prominent. In the process of transporting water and energy, rivers regulate the local climate along the river [6], and runoff is purified due to the river self-cleaning effect [7]. Compared to these services that are not easily perceived by the public, swimming, fishing, sightseeing, environmental education, and other activities are more common for people to enjoy rivers ecosystem services, reflecting the cultural ecosystem services of rivers [8,9].
The multiple services of the river interact with each other, resulting in tradeoffs and synergies. For example, the river affects people’s activities such as walking or sightseeing by changing the temperature and humidity in the waterfront. This reflects the tradeoff between climate regulation services and recreational services. In general, tradeoffs usually occur between food production and water purification, while water quality regulation and fishery production are synergy [10].
Tradeoff is the variation among multiple ecosystem services [11]. This topic is a hotspot in current ecosystem service research. Tradeoffs can generally be divided into time tradeoffs, spatial tradeoffs, and reversible tradeoffs [11]. Research focuses on the interaction of multiple ecosystem services, quantification of tradeoff relationships, mechanisms, and scale effects [12,13,14].
Case studies reflect an in-depth understanding of the interrelationships between multiple ecosystem services, confirming that tradeoffs or synergies are common. They often involve tradeoffs between supply services and regulation services [12], and there is a synergy between regulation and support services [15].
Tradeoff research provides an important foundation for ecosystem-based management. Tradeoffs can be used to analyze the preferences of multiple stakeholder groups for cultural services [16], or to assess the integration of traditional agriculture with modern agriculture [17], or to manage the grazing activities in pastures [18]. When designing wind power plants in the ocean, tradeoff can be used to identify potential conflicts among the wind energy, commercial fishing, and whale watching industries [19]. For watershed management, tradeoffs can be used to assess the benefits of increased hydropower relative to potential fishery production losses [20], or to discuss the relationship between energy production and flood protection [21].
The tradeoff relationship can vary with the region. For example, vegetation carbon sequestration and freshwater supply services are synergy in the Baiyangdian watershed, China [22], while they are tradeoff in the Urduba natural reserve area in Spain [23]. Coastal protection and tourism recreation services are synergy in Quebec, Canada [24], but tradeoffs in Bonaire, the Netherlands [25].
Regional differences suggest that ecosystem service space assessment is the basis for tradeoffs. The spatial and temporal characteristics of ecosystem services were explored through ecosystem services mapping [26,27], explaining the scale characteristics of ecosystem services [28]. The importance of spatial relationships in the assessment of ecosystem services is highlighted. A more complex integrated modeling approach that combines spatial and temporal changes in ecosystems with socioeconomic feedback can help to assess ecosystem services impacted by human activities [29].
River ecosystems have obvious multiscale characteristics, and it is hard to determine spatial boundaries. Therefore, ecosystem services assessment for a specific river or river section is rare. Most studies of river ecosystem services are carried out from the perspective of freshwater ecosystems or watersheds. Some studies analyze the spatial characteristics of rivers from a landscape scale [27,28], but lacking the combination of hydrological characteristics and landscape.
The European Landscape Convention defines landscapes as places that people perceive, and which are characterized by a natural and/or human factor [30]. Landscapes include not only natural and artificial elements perceived visually, but also through olfaction, taste, and even the historical and cultural values [31]. The river vision landscape service (RVLS) is an integral part of river cultural services, resulting from the shape, color, and flow of rivers. RVLS is different from the spatial landscape unit, which produces different ecosystem services from single ecosystems [32].
The indicators for landscape visual service evaluation vary with the objective. A comparison of the modeling methods of InVEST and ARIES found that different models have more similar carbon evaluation indicators, but it is hard to compare visual landscape evaluation [26]. Visual field indicators have a good application on the analysis of mountain landscapes. However, the main component of the river visual landscape is the water body, and the horizontal perspective does not fully reflect the characteristics of the river vision. Runoff is of paramount importance in water services [33]. Water quantity is a decisive factor affecting the aesthetic and recreational functions of river ecosystems and their economic value [34].
The scientific assessment of the tradeoffs of multiple services requires a study of the impact of multiple human activities and their associated stressors on the ecosystem [35]. Hydropower development is the main way to address energy demand and is especially important in developing countries. However, hydropower development, while meeting energy needs, also causes adverse environmental impacts such as biodiversity loss, river erosion, and water temperature changes [36,37], leading to a drop in ecosystem services [38]. Although the problem of river landscape change brought by hydropower is very prominent, the tradeoff relationship between hydropower development and landscape services has rarely been studied. Darvill found that cultural ecosystem services are more important to participants than supply ecosystem services, especially aesthetics/landscape values [16]. However, there is no discussion of the tradeoff between hydropower services and cultural services.
Southwest China is a hydropower enrichment area. The upper reaches of the Minjiang River are the earliest developed area in the region, where water retention and biodiversity are the two most concerned services. The rapid hydropower development process experienced before 2015 has exceeded the development limits in many river basins [29]. As the demand for energy has decreased in current, the demand for cultural services has begun to increase, but the tradeoff between hydropower development and RVLS has not been reported. Based on a quantitative assessment of hydropower and RVLS, scenario analysis was used in this study to examine tradeoffs with ecosystem services, following which proposals for corresponding management strategies were developed.
2. Materials and Methods
2.1. Study Area
The study area is located in the River Zagunao basin in Western Sichuan (Figure 1). The River Zagunao is a primary tributary of the River Minjiang with an area of 4300 km2 and a length of 158 km. The river basin belongs to Li County, Sichuan Province, and its economic center is located in Zagunao. This is the main area inhabited by the Yi people. In 2017, the registered population was 44,459, and the GDP was 245.92 million yuan. The county landforms are dominated by alpine valleys, with forests and grasslands widely distributed, accounting for 56.6% and 25.5%, respectively, of the total area. Natural ecosystems provide important ecosystem services downstream, the most important of which is water retention. The average annual runoff of the river basin is 110.0 m3/s, and the large drop in elevation produces abundant water energy. In 1958, the first hydropower station on the upper reaches of the River Minjiang was built, and hydropower development became an important driving force for the region’s economy [39]. At the same time, rich natural and human resources have also formed the basis of important cultural services that attract many tourists. The main scenic spots include the Miyaluo Redleaf Scenic Area and Taoping Qiang Village.
2.2. Research Framework
The main method of ecosystem service tradeoff investigation is to compare the differences among various ecosystem services at different time and space scales through scenario analysis and spatial mapping using the InVEST model, the ARIES model, etc [40]. In addition, methods such as the Pareto curve, root mean square deviation, multiobjective decision making, redundancy analysis, and hierarchical cluster analysis have been used [41,42].
The InVEST toolset provides a variety of models for ecosystem services assessment and can be used to analyze the tradeoffs among different services effectively. The outstanding features of InVEST software are structured and have low data requirements, leading to wide application [40]. The ARIES model has powerful spatial analysis capabilities, but there have not been enough case studies in China [43].
The Pareto curve is derived from economics, also known as the production possibility boundary or the efficiency frontiers [44]. The point of the curve is that the tradeoffs of the two services can be visually reflected in graphs, but they do not reflect the quantitative relationship [45].
Scenario analysis is an effective decision support tool that assesses climate change, land use change, and changes in ecosystem services under different resource management models to identify their tradeoffs [46,47].
We combined the InVEST model, the Pareto curve, and scenario analysis to analyze the tradeoff between hydropower and landscape services. The main process is as follows (Figure 2):
Step 1: Carrying field investigations to clarify the pattern and process of hydropower development. In May 2014, we conducted a survey of the hydropower station in the Zagunao watershed. We visited each power station along the mainstream and determined the location of dams and plants. We collected basic information on the power station, including the construction time, type, scale, inflow, and annual generated electrical energy. According to the distribution of dams and plants, the Zagunao watershed was divided into 18 sub-basins. The runoff amount of each dam was calculated according to the sub-watershed boundary.
Step 2: Using the InVEST water production model to assess water retention. Referring to the method proposed by Fu et al., the value of hydropower services is calculated based on the amount of electricity generated by the hydropower station. Flow proportion was used as an indicator to evaluate RVLS.
Step 3: Tradeoff varied with time and space. The Pareto curve was used to analyze the tradeoff direction between hydropower service and RVLS, and tradeoff intensity was constructed to discuss the quantitative relationship of the two services. According to the development process of the mainstream, the number and size of new hydropower stations in different periods were analyzed, the changes in hydropower production value were calculated, as well as the RVLS, and then the time tradeoff was analyzed. We compared the services between divided sub-watershed and conduct spatial tradeoff analysis.
Step 4: Scenario analysis: We set up 2015 as the baseline since the mainstream hydropower development was completed, and six flow management scenarios were set according to the evaluated hydropower services and RVLS.
2.3. Water Retention Assessment
The water retention service was evaluated using the InVEST water yield model. The InVEST tools is widely used for ecosystem service tradeoff analysis, land use assessment, watershed management, biodiversity conservation planning, and ecological compensation due to its clear concepts, intuitive results, and small data requirements [48,49]. Water retention has become a necessary assessment in most case studies. The water yield model was developed based on the water balance principle. The water yield is equal to the precipitation minus the actual evapotranspiration, the latter being related to climate, soil, and vegetation:
where Yjx is the water yield, Px is the precipitation, and AETxj is the actual evapotranspiration of the grid unit x on the land use type j.
The actual evapotranspiration is determined by the potential evapotranspiration and the crop coefficient. The former is calculated using the Penman–Monteith approach. The model has high applicability because the theoretical basis includes the energy balance and water vapor diffusion [50]. The data imported into the model include land use from local government departments. The average annual precipitation comes from the China Meteorological Data Network (http://data.cma.cn/). We downloaded the yearly precipitation data of the meteorological stations within and surrounding the study area and carried out the Kriging spatial interpolation in ARCGIS software to create a 100 m x 100 m precipitation grid.
Other input parameters are soil saturated hydraulic conductivity, crop coefficient (ETK), root depth (Root Depth) and flow coefficient (Vel_coef). The crop coefficient refers to the ratio of the actual evapotranspiration of plants to the evapotranspiration of open grassland with abundant growth, uniform coverage, high uniformity (8–15 cm), and sufficient soil water supply. The crop coefficient is related to the species, growth period, and population of vegetation. We determined crop coefficients by referring to the crop coefficient from “Guidelines for Crop Evapotranspiration—Crop Water Demand Calculation” [51], and some Chinese cases studies [52,53]. The soil saturated hydraulic conductivity was calculated using NeuroTheta software developed by the University of Wales, Australia [30]. Other parameters are referenced in the user manual [54].
2.4. Valuation Hydropower Services
We used the catchment of the hydropower station as the evaluation unit, and the value for each power station was accumulated to obtain the final value. The electricity price was determined as 0.288 Yuan/Kwh according to the regulation from Sichuan Development and Reform Commission price, in which the method is consistent with the 2014 method of Fu et al. [39], but the land use patterns in 2015 were used here.
2.5. River Visual Landscape Services
We used flow rate as an indicator for RVLS evaluation. There are four reasons for this: First, runoff is the top priority in the structure and function of the river ecosystem and is the decisive factor affecting the aesthetic and recreational functions of river ecosystems and their economic value [33,34]. Second, river continuity is an important foundation for the creation of river visual landscape services [55], and flow is the material basis for river mobility. Third, runoff is also a major controlling factor affecting vegetation succession in the waterfront [28]. Fourth, landscape aesthetic evaluation usually considers the quality of the landscape itself or the subjective preferences of the visitors. The use of runoff as an indicator can objectively reflect the objective quality of the RVLS and reduce the uncertainty of the tradeoff analysis.
The RVLS was calculated as follows:
where Eslandscape is the score of RVLS for i-th power station. The average annual flow rate at the dam site when no hydropower development is carried out is Qn, the inflow of the hydropower station is Qin, and the actual flow rate Qf equal to Qn minus Qin.
When the inflow is zero, the river maintains its natural condition, and the RVLS is the maximum one. When inflow reaches the maximum at each dam site, the actual flow rate falls to zero, as does the RVLS. However, RVLS should be gradually increased downstream because of the recharge capacity downstream of the dam.
The method described above is applicable to a single power station. To evaluate the RVLS of the entire mainstream under cascade development, the RVLS in each river section was weighted and accumulated:
where the total RVLS is ESlandscape t, Leni is the weight, the ratio of the length of each river section to the total length of mainstream, and ESlandscape i is the RVLS of each section. Depending on the degree of development, the mainstream landscape services have changed in different periods.
2.6. Tradeoffs
Using the Pareto curve, the RVLS and the hydropower service were incorporated into a scatter plot in a two-dimensional coordinate system, and a curve was fitted by regression analysis. The tradeoff relationship was qualitatively analyzed according to the classification of time tradeoffs, spatial tradeoffs, and reversible tradeoffs, and changes in the curve were analyzed based on the production–possibility frontier (PPF) curve.
The Pareto curve refers to how to allocate resources to achieve overall optimality when resources are limited. This approach was introduced into ecology to explain ecosystem service tradeoffs. For example, Yang et al. used the Pareto curve to analyze the tradeoff among carbon sequestration, water conservation, and soil conservation [56]. Ager analyzed the conflict between recovery policies and socioeconomic values in forest restoration [45]. We normalized the scores for hydropower services and RVLS, then ranked them in ascending order, using the landscape service on abscissa, and the hydropower service on ordinate, drawing a scatter plot. Regression fitting was performed using the binomial formula.
A quantitative expression of tradeoff relationships was seldom reported. In this paper, a tradeoff intensity index is proposed to discuss the quantitative relationship among tradeoffs. The design of the tradeoff intensity index can be considered in two ways. The first is the tradeoff relationship for the entire basin, which can be expressed using different time periods of hydropower service and RVLS as:
TI = (ESpower i+1 – ESpower i)/(ESlandscape i+1 – ESlandscape i).
The second is to analyze the tradeoff relationship between different river sections based on the current status of hydropower development in 2015.
2.7. Scenario Analysis
Scenario analysis is very popular in ecosystem service tradeoff studies. In this study, six scenarios were set up according to different flow control methods (Table 1), including unified recovery scenarios M1–M5 (all hydropower stations increase ecological flow by the same proportion) and the optimized recovery scenario M6. Scenario M6 is based on the analysis of the water use efficiency of each power station. The specific process is to first calculate the power production value of each power station on unit flow and then sort all the stations. The lowest efficiency power plant has the highest proportion of reduced flow.
3. Results
3.1. Hydropower Service
The ecosystem water retention service was assessed based on land cover in 2015. There was a gradual decrease from upstream to downstream, but there was a high-value zone between the mainstream and the main tributary, the River Mengtun (Figure 3). The water retention service averaged 800 mm, and the total water production was 3.44 billion cubic meters.
Figure 4 showed the hydropower service at different stages of development (Figure 4). Hydropower development in the study area took place early, and the first hydropower station in the basin, Xiazhuang Hydropower Station, was established in the last 50 years of the 20th Century. This power station is still supplying electricity to the local area. However, in the following 30 years, no new power stations were added to the mainstream. This situation continued into the 1990s. With the building of power stations such as those at Ganbao and Lixian, hydropower development in the basin entered a rapid development stage. By 2010, the current new hydropower service had reached 400 million yuan. This growth continued until 2015, when the total value of water and gas services in the basin reached one billion yuan.
Figure 5a shows the total value of hydropower services in each watershed according to the upstream–downstream relationship. Clearly, the upstream ecosystem provided higher hydropower services than the downstream system. Among the power stations, the Luganqiao station provided the maximum of 232.89 million Yuan, and the Weizhou power station had the lowest, only 0.29 million Yuan. The elevation statistics showed more clearly that the high value area was in the area of 3500–4500 m altitude (Figure 5b), but not in the highest altitude area. This showed that the value of hydropower services was related to the distribution of water retention services and power stations.
3.2. River Visual Landscape Services
Figure 6 shows two typical river landscapes. Power stations in the study area were basically developed by diversion. Due to this diversion, river flow was greatly reduced, creating a water shortage. Although the river still maintains a certain base flow, the shortage causes severe damage to the river landscape, with the unpleasant visual impact of the exposed riverbed (Figure 6a). Figure 6b shows the river landscape downstream of the plant of the same power station, which is just 100 m away from the site in Figure 6a. In this case, the runoff that was originally led through the turbine had been returned to the river, and the river had resumed normal flow, forming a mountain river landscape (Figure 6b).
Figure 7 shows the relationship between distance to source (DTS) and flow of the power stations. As DTS increased, the catchment area of the river increased, and the flow rate increased. DTS and flow have a significant power relationship. By comparing the changes in flow before and after hydropower development, it can be seen that hydropower development led to a rapid decline in river flow. At 48 and 86 km, the hydropower station basically uses all the runoff of the river channel for power generation, resulting in the runoff flow tending to zero and the river channel basically breaking.
3.3. Tradeoff of the Two Services
Figure 8a shows the changes in RVLS and hydropower services at different stages of development. Before 1958, the entire mainstream had low development intensity, hydropower services were less than 5% of their present value, and RVLS remained at one. The mainstream was basically in a natural undeveloped state. This state lasted until 1990, when hydropower services were rated at only 0.1, whereas the RVLS remained close to one. In the following years, hydropower development began to grow steadily. By 2007, it had reached a high level. During this time, the RVLS gradually dropped to 0.85. After this, although the basin was affected by the 2008 Wenchuan earthquake, more hydropower plants were built, and the development of the mainstream was basically complete by 2015. By this time, the RVLS had dropped to 0.48. The figure shows that in 2009, RVLS and hydropower services got the same score. The tradeoff intensity reflected changes in the two services (Figure 8b). From −3.5 in 1990 to −0.79 in 2015, the tradeoff intensity gradually decreased, indicating that the relationship between hydropower service and RVLS was stabilized.
The Pareto curve was plotted in Figure 9 using the scores of the two services. The tradeoff between hydropower service and RVLS was very obvious. As the hydropower services rose from zero to one, the RVLS decreased from 1.0 to 0.4, which showed a significant negative correlation. To ensure that the scattered points fall below the curve, the requirements of the Pareto boundary were met. A quadratic function was used to fit the points, resulting in a significant functional relationship.
Figure 10 shows that the tradeoff intensity varied downstream and that the tradeoff intensity decreased in an oscillating fashion. It was the highest (−0.3) in the upstream Luganqiao station and the lowest (0.003) in the downstream Weizhou station. The whole curve could be divided into three sections. The upstream section was above the Hongye 2nd plant (more than 60 km to the outlet), showing a strong oscillation with an amplitude between 0.3 and 0.1. In the middle section between the Ganbao station and the Hongye 2nd plant (45–60 km to the outlet), the amplitude dropped rapidly and remained below 0.05. The tradeoff intensity downstream of the Ganbao station (less than 45 km to the outlet) suddenly increased to 0.1 and then rapidly dropped to zero. Actually, the hydropower service in the basin dropped to zero, but the RVLS still maintained a certain amount.
3.4. Flow Management Scenario
To compare the effects of different flow management scenarios, the value of hydropower services per unit of flow was calculated. Table 2 shows that the efficiency of Shiziping Power Station was the highest, with a power generation output per unit flow of 0.26 yuan/m3. Xiazhuang Power Station was the lowest, with only 0.01 yuan/m3. This amounted to a twentyfold difference between the two stations, which reflected the development of hydropower technology. Xiazhuang Power Station was the earliest developed power station in the Zagunao basin, at 60 years old (built in 1958), and uses low dam diversion. Shiziping Power Station was built in 2010 and uses the high dam diversion method.
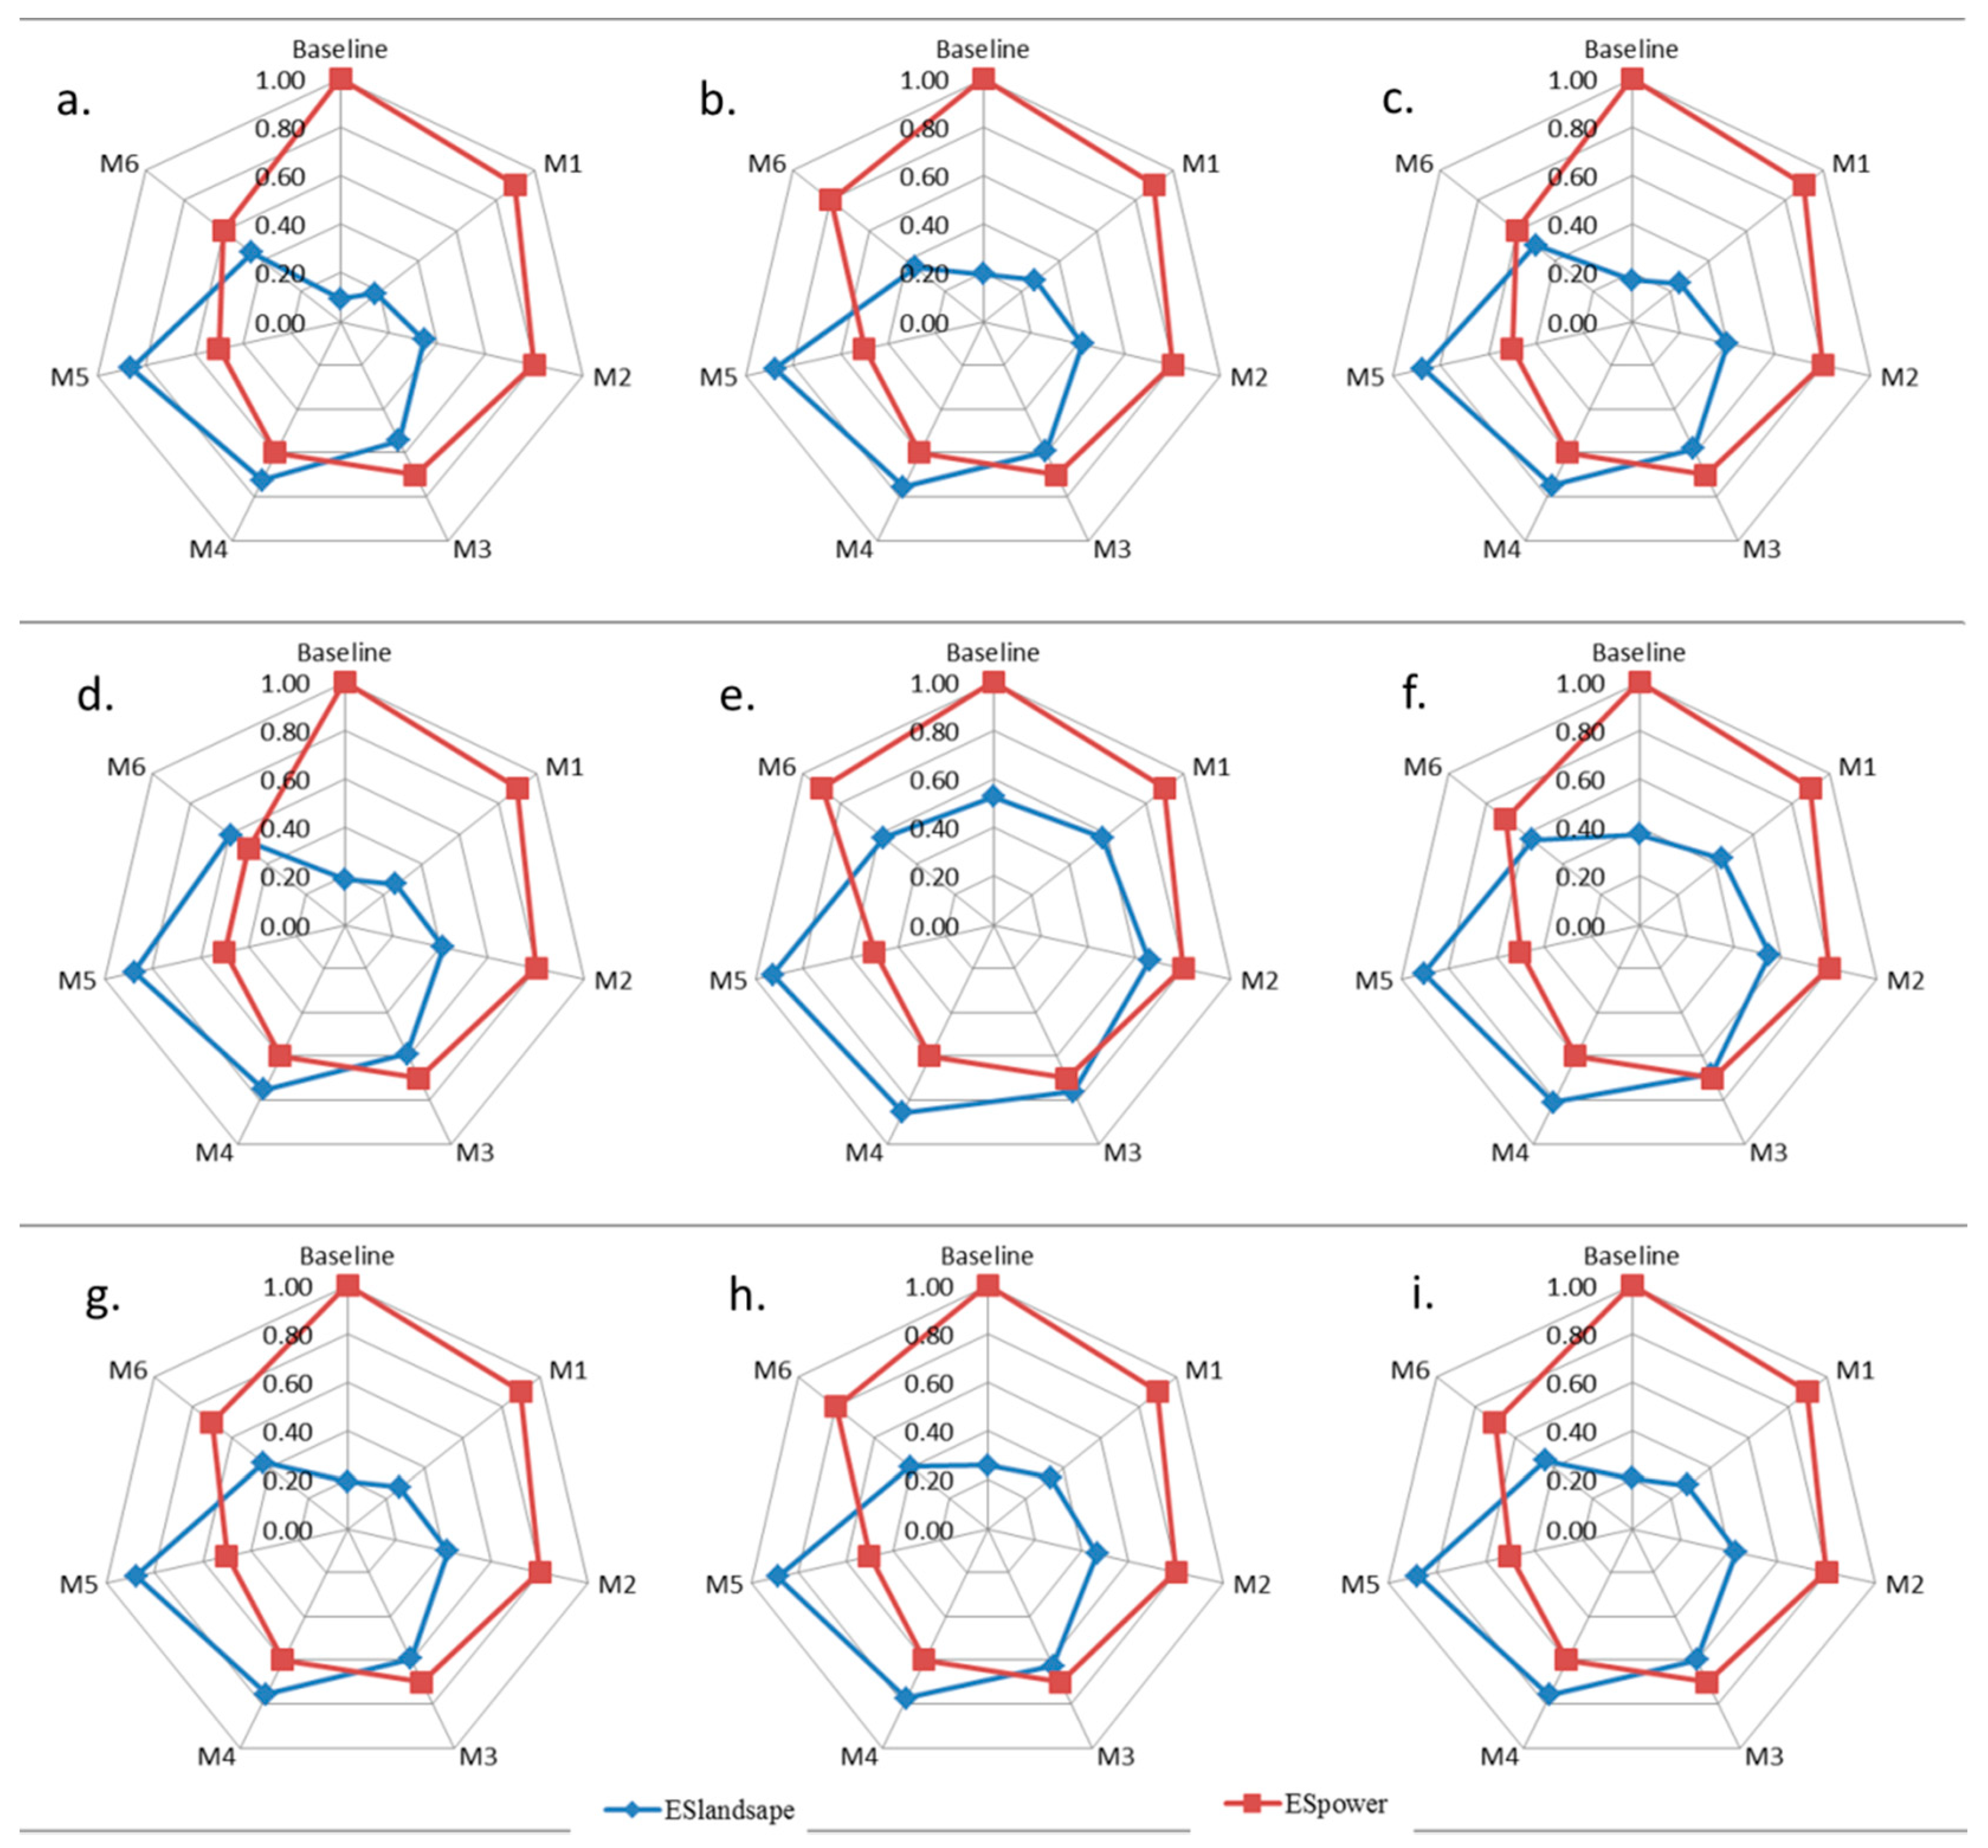
Hydropower service and RVLS were assessed using the power plant watershed as a unit. As the flow rate increased, the river flow increased, and the RVLS of each sub-basin increased. The first to be considered was the Ganbao station. The development intensity of this power station was very small. Under the scenario of reducing the reference flow by 10% (Scenario M1) (Figure 11), the river basically recovered continuously. At this time, except for the scenic score of Xuecheng Station, other power stations were still basically in a cutoff state. In Scenario M2, Xuecheng Station and Xiazhuang Station were also returned to a continuously operating state. In Scenario M3, except for Luganqiao Station and Hongye Secondary Station, the other power stations resumed operation. In Scenarios M4 and M5, all the power stations resumed operation, and the landscape scores no longer changed. However, from Scenario M1 to Scenario M5, the hydropower services dropped from 1 to 0.5. The value of the lost hydropower services reached 50%.
To coordinate hydropower development and landscape restoration, the allocation of runoff flow was optimized in Scenario M6. We aimed at the basic recovery of each station RVLS (score greater than 0.4). We set the flow according to the power generation efficiency. Low efficient plants reduce inflow more. The inflow of each station was gradually adjusted in the range of 10%–50%, and the corresponding hydropower service and RVLS were calculated. Among the schemes that satisfied the requirement of RVLS reaching 0.4, the scheme with the smallest drop in hydropower service was selected as Scenario M6.
In Scenario M6, the Lixian station reduced its inflow rate by up to 50%, followed by the Luganqiao station by 40%, and further followed by the Ganbao station, which reduced its inflow by only 10%. Under this scenario, both hydropower and RVLS were satisfactory. Except for the Shiziping station, the control sections of other power stations continuously recovered, with hydropower service scores of 0.7, which was higher than the 0.6 in Scenario M4.
4. Discussion
4.1. Tradeoff between Hydropower Service and RVLS
Mountain rivers provide enormous ecosystem services. Among them, hydropower services have achieved economic value. From the 1950s to the present, hydropower services have been valued 27.5 times and reached 1.04 billion Yuan in 2015. This represents an important source of ecological services in the mountains [32]. However, RVLS have declined as hydropower services have increased.
Considering the basin as a whole, there is a clear tradeoff between hydropower services and RVLS (Figure 8). This is similar to the tradeoff between hydropower and other services such as fisheries and biodiversity [38]. This situation exists primarily because the two services have a common source and because the ecosystem provides water conservation services. These services can produce a variety of benefits, with power generation and RVLS being the two most closely related services. Development, whether by damming or diversion, leads to a reduction in river flow, which will inevitably affect the river landscape. The impact of diversion is particularly prominent. Because the distance of water diversion ranges from several kilometers to tens of kilometers (Figure 6), diversion results in long-distance dehydration of river courses, affecting the quality of the river landscape. Therefore, the tradeoff relationship between diversion and landscape is very obvious.
The tradeoffs with other services are also different. For example, the impact of hydropower development on biodiversity is multifaceted, mainly because dams block the migration routes of aquatic animals, affect habitats, change the structure of aquatic ecosystems, and affect the catch of fisheries [20,57,58]. However, the impact of hydropower development on RVLS is more direct. The landscape of the mountain river is characterized by rushing water, which gives people a huge visual and auditory shock. This is the core content of the RVLS and relies heavily on the huge flow of the river. Water diversion from dams directly reduces the amount of water in the river and has a significant impact on the river landscape.
The time tradeoff means the service utilization of one period affects the supply and demand of services in another period. As the watershed development began in the 1950s, hydropower services continued to rise, while RVLS continued to decline. It reflects the change in the number of two services in two different periods. Since there is no direct correlation between the two periods, it is not a time tradeoff in the strict sense.
With the completion of the cascade development of the basin, the hydropower and RVLS in the basin reached a stable state. This stability was determined with two reasons. First, new power plants were not an economic feasibility in the current development condition. Second, the Chinese government strengthened watershed management. The construction of new power stations in the study area is forbidden. The location and quantity of water taken by hydropower stations need to be issued by the water conservancy department.
The current state showed a clear spatial tradeoff. Figure 10 illustrates that the tradeoff intensity of hydropower and RVLS fluctuates downstream and is closely related to cascade development. The farther upstream the development is, the greater the value of the hydropower service, but also the greater the impact on RVLS. As the river runs downstream, runoff continues to be replenished, and there is a decrease in plants’ inflow. The value of hydropower service has declined as the impact on the landscape has decreased.
The spatial tradeoff is not only reflected in the difference in the strength of the upstream and downstream tradeoffs, but also in the tradeoff direction, resulting in more tradeoffs and synergies. This has been the focus of research on tradeoffs in ecosystem services [22,35]. The spatial tradeoff between hydropower and RVLS has spatial characteristics. The tradeoff direction between adjacent catchments is often reversed. In other words, the tradeoff direction of one sub-watershed is different from the tradeoff direction of the next sub-basin downstream. The reason for this is that the RVLS increase and decrease regularly between two adjacent catchments. However, the hydropower services are different. Due to the size of the catchment area and the distribution of water production services, there is no obvious change for services in adjacent catchments. Changes in hydropower services may or may not have the same effect as RVLS. Hence, tradeoffs or synergies occur. Therefore, river cascade development creates regular changes in spatial tradeoffs.
RVLS are also typical reversible tradeoffs [11]. As shown in Figure 5, behind a power plant, the tailwater returns to the river, and the RVLS can be effectively restored. At the same time, based on the results of the scenario analysis, the RVLS can be significantly increased if the inflow into the plant is reduced. There have been numerous reports on river ecological restoration [28,59]. Examples of successes and failures are available [4]. However, whether the goal of recovery is water quality or biodiversity, the most basic considerations include flow recovery.
In the tradeoff relationship, tradeoff intensity is often overlooked [3]. Grazing intensity is comparable to hydropower development intensity. When grazing intensity increases from low to medium, grassland production services show significant tradeoffs with biodiversity [18], but at high grazing intensity, production services and biodiversity decline and may cease to exist. This relationship needs to be weighed. The results of this study show that the tradeoff strength between hydropower and landscape services is between 0.3 and 0. This shows that the two services experience moderate tradeoffs. This situation is mainly determined by the characteristics of hydropower development. The number of hydropower site locations suitable for construction in the basin is limited. Even in such high-intensity development basins as the study area, the length of the undeveloped river section of the mainstream is still greater than the developed length. This means that the minimum value of the landscape service cannot be less than 0.5. It is then necessary to consider the economic and technical conditions of development and other factors. Hydropower development may be further limited, which is not the same as grazing.
4.2. Policy Implications
The environmental impact of hydropower development is already a global issue. Researchers have proposed various measures to reduce environmental impacts in different regions. Among these, the most representative ones include ecological flow systems, monitoring measures, and hydropower dispatching [60]. Most of these are technical measures that have a role in mitigating impact [61,62]. In developed countries, more extreme measures to demolish dams and restore the natural state of rivers have been proposed [63]. However, this entails a higher cost in lost power. For areas with less developed economies, hydropower is still needed to meet energy demand.
The findings of this study demonstrated that tradeoffs between hydropower and RVLS could be used to optimize watershed management [64], especially for the ubiquitous cascade development of basins. The results of Scenario M6 showed that the RVLS could be significantly restored after flow recovery in various river sections (Figure 10). For some sections of a river, only a small amount of flow will restore RVLS. From the perspective of the entire basin, different proportions of recovery could be used to avoid a rapid decline in hydropower services.
The tradeoff between hydropower and RVLS is insignificant within a certain range. When hydropower development intensity is low, the continuity of the river will not be affected. In Scenarios M4 and M5, a 40%–50% reduction in the flow rate taken could substantially restore RVLS, which reflected the elasticity of river ecosystems [65,66].
The whole of China is currently in a critical period of industrial restructuring. Sichuan Province, as an important hydropower base, is facing a serious water abandonment problem [59]. The main reason for this is adjustments in the regional industrial structure, in particular, the fact that existing high-energy-consuming industries are in a surplus state. Therefore, the hydropower services that provide energy for high-energy-consuming industries are facing problems of excess supply. However, this provides a good opportunity for restoration of river ecosystems. As income levels increase, the demand for urban cultural services by urban residents has also increased rapidly. Naturally flowing rivers can produce diverse cultural services such as rafting, photography, painting, and nature education [8,60]. These services depend on the recovery of river flows and landscapes.
The environmental impact of hydropower development must be mitigated through payment for ecosystem services. However, the loss of hydropower development can be offset by the development of ecotourism. Numerous studies have shown that ecological restoration does not always have a negative impact on the economy: It can bring about higher value with scientific management [67,68]. Scenario analysis indicates that river restoration is carried out in key river sections and that the development of hydropower services has not declined much. However, the value of tourism brought about by these changes is higher. According to the relevant literature, the study area is an important tourist destination for tourists from the surrounding areas because it is close to the Chengdu megacity. The red leaf landscape with the river and the human landscape are all attractive to foreign tourists. However, these landscapes do not form an organic connection with the river landscape. If the river flow landscape is restored by increasing the discharge flow of the hydropower stations, this will play an important role in enhancing ecotourism in the area.
We discussed the relationship between hydropower service and RVLS based on runoff. In fact, there are many other environmental impacts in hydropower development. Using the tradeoff analysis in this paper helps to effectively assess the complex relationships of multiple services. For example, feedback relationships formed in energy–ecology (landscape)–climate regulation. Hydropower not only meets the energy demand for social and economic development, but more importantly, hydropower is the main clean energy, which can effectively reduce carbon emissions [69]. However, hydropower stations are also a potentially important carbo source with greenhouse gas emissions, as large areas of land submerged in the reservoir area could result in loss of carbon stocks [70]. Through ecological compensation for watershed land use, carbon pool balance can be achieved within the basin [71].
5. Conclusions
River development and protection are a common challenge worldwide. This study has evaluated RVLS and hydropower services using biophysical model and scenario analysis methods. Significant tradeoffs between the two services were found, and tradeoffs with hydropower development are gradually emerging. The main pattern of tradeoffs was upstream and downstream of a dam, with the most obvious being the dam-to-plant section. Tradeoffs can be used as a basis for optimizing watershed management, guiding the evolution of watersheds from hydropower to landscape utilization. In particular, most river basins are developed as a cascade of dams and plants, which provides conditions for comprehensive utilization. Scientific assessment and analysis of the tradeoffs between hydropower development and RVLS can provide an optimal solution. In a period of major changes in social demand, the original development and utilization model cannot adapt to new needs, and the utilization of different services can be re-evaluated to generate suggestions for river recovery. Such an evaluation can provide effective advice for the protection and sustainable development of watersheds.
Rivers have multiple services, and cultural services, in particular, may be an important factor in supporting sustainable mountain development. Cultural services are closely linked to other services such as biodiversity conservation, water supply, energy, and climate regulation. We only analyzed the relationship between the two services from the hydrological and explained part of the tradeoff relationship. However, the RVLS has richer connotations. It needs to be refined through further monitoring and evaluation. Hydropower development and complex issues such as energy, ecological protection, and climate change form complex feedback mechanisms. These issues require in-depth research in the future. A socioecological comprehensive analysis method provides a useful reference for exploring these issues [72].
Author Contributions
B.F. completed the data analysis and draft writing. N.L. designed research framework and participated the discussion.
Funding
This This research was funded by [the Major Scientific and Technological Special Program of Sichuan Province, China] grant number [2018SZDZX0027], [Natural Science Foundation of China project -Coupled relationship and regulation mechanism between rural livelihoods and ecosystem services in the Three Gorges Reservoir Area] grant number [41371539] and [Chinese Academy of Sciences project (Land Development Pattern Optimization of Mountainous Areas in Southwest China)] grant number [Y7K2260263). And The APC was funded by [the Major Scientific and Technological Special Program of Sichuan Province, China] grant number [2018SZDZX0027]. The authors hereby would like to express their thanks.
Conflicts of Interest
The authors declare no conflicts of interest.
References
- Daily, G.C. Nature’s Service; Island Press: Washington, DC, USA, 1997. [Google Scholar]
- MEA. Millennium Ecosystem Assessment 2005. Ecosystems and Human Well-Being: Synthesis; Island Press: Washington, DC, USA, 2005. [Google Scholar]
- Jianjia, Z. Characteristic of tradeoffs between timber production and carbon storage for plantation under harvesting impact: Acasestudy of HuitongNational Research Station of Forest Ecosystem. J. Geogr. Sci. 2018, 73, 1085–1098. [Google Scholar]
- Fisher, W. Stream Ecology: Structure and Function of Running Waters. Trans. Am. Fish. Soc. 2010, 125, 5. [Google Scholar] [CrossRef]
- Hamududu, B.; Killingtveit, A. Assessing climate change impacts on global hydropower. Energies 2012, 5, 305–322. [Google Scholar] [CrossRef]
- Leach, J.A.; Moore, R.D. Above-stream microclimate and stream surface energy exchanges in a wildfire-disturbed riparian zone. Hydrol. Process. 2010, 24, 2369–2381. [Google Scholar] [CrossRef]
- Nayyeri, H.; Zandi, S. Evaluation of the effect of river style framework on water quality: Application of geomorphological factors. Environ. Earth Sci. 2018, 77, 343. [Google Scholar] [CrossRef]
- Hutcheson, W.; Hoagland, P.; Di, J. Valuing environmental education as a cultural ecosystem service at Hudson River Park. Ecosyst. Serv. 2018, 31, 387–394. [Google Scholar] [CrossRef]
- Vermaat, J.E.; Wagtendonk, A.J.; Brouwer, R.; Sheremet, O.; Ansink, E.; Brockhoff, T.; Plug, M.; Hellsten, S.; Aroviita, J.; Tylec, L. Assessing the societal benefits of river restoration using the ecosystem services approach. Hydrobiologia 2015, 769, 1–15. [Google Scholar] [CrossRef]
- Butler, J.R.A.; Wong, G.Y.; Metcalfe, D.J.; Honzák, M.; Pert, P.L.; Rao, N.; Grieken, M.E.V.; Lawson, T.; Bruce, C.; Kroon, F.J. An analysis of trade-offs between multiple ecosystem services and stakeholders linked to land use and water quality management in the Great Barrier Reef, Australia. Agric. Ecosyst. Environ. 2013, 180, 176–191. [Google Scholar] [CrossRef]
- Rodríguez, J.P.; Beard, T.D., Jr.; Bennett, E.M.; Cumming, G.S. Trade-offs across Space, Time, and Ecosystem Services. Ecol. Soc. 2006, 11, 709–723. [Google Scholar] [CrossRef]
- Aillery, M.; Shoemaker, R.; Caswell, M. Agriculture and Ecosystem Restoration in South Florida: Assessing Trade-Offs from Water-Retention Development in the Everglades Agricultural Area. Am. J. Agric. Econ. 2001, 83, 183–195. [Google Scholar] [CrossRef]
- Lester, S.E.; Costello, C.; Halpern, B.S.; Gaines, S.D.; White, C.; Barth, J.A. Evaluating tradeoffs among ecosystem services to inform marine spatial planning. Mar. Policy 2013, 38, 80–89. [Google Scholar] [CrossRef] [Green Version]
- Turner, K.G.; Odgaard, M.V.; Bøcher, P.K.; Dalgaard, T.; Svenning, J.C.; Landurbplan, J. Bundling ecosystem services in Denmark: Trade-offs and synergies in a cultural landscape. Landsc. Urban Plan. 2014, 125, 89–104. [Google Scholar] [CrossRef]
- Chisholm, R.A. Trade-offs between ecosystem services: Water and carbon in a biodiversity hotspot. Ecol. Econ. 2010, 69, 1973–1987. [Google Scholar] [CrossRef]
- Darvill, R.; Lindo, Z. The inclusion of stakeholders and cultural ecosystem services in land management trade-off decisions using an ecosystem services approach. Landsc. Ecol. 2016, 31, 1–13. [Google Scholar] [CrossRef]
- Zhang, D.; Min, Q.; Liu, M.; Cheng, S. Ecosystem service tradeoff between traditional and modern agriculture: A case study in Congjiang County, Guizhou Province, China. Front. Environ. Sci. Eng. 2012, 6, 743–752. [Google Scholar] [CrossRef]
- Divinsky, I.; Becker, N.; Bar, P. Ecosystem service tradeoff between grazing intensity and other services—A case study in Karei-Deshe experimental cattle range in northern Israel. Ecosyst. Serv. 2017, 24, 16–27. [Google Scholar] [CrossRef]
- Crow, W.; Halpern, B.S.; Kappel, C.V. Ecosystem service tradeoff analysis reveals the value of marine spatial planning for multiple ocean uses. Proc. Natl. Acad. Sci. USA 2012, 109, 4696–4701. [Google Scholar] [Green Version]
- Deines, A.M.; Bee, C.A.; Katongo, C.; Jensen, R.; Lodge, D.M. The potential trade-off between artisanal fisheries production and hydroelectricity generation on the Kafue River, Zambia. Freshw. Biol. 2013, 58, 640–654. [Google Scholar] [CrossRef]
- Corbu, I.; Lau, P.C.K. Trade-Off Decisions in Streamflow Forecasting for Multiobjective River Basins—The Ottawa River Case. Can. Water Resour. J. 1984, 9, 47–61. [Google Scholar] [CrossRef]
- Yang, B.; Zhuang, C.; Ouyang, Z.; Hua, Z.; Bo, J. Spatial characteristics between biodiversity and ecosystem services in a human-dominated watershed. Ecol. Complex. 2011, 8, 177–183. [Google Scholar]
- Onaindia, M.; de Manuel, B.F.; Madariaga, I.; Rodríguez-Loinaz, G. Co-benefits and trade-offs between biodiversity, carbon storage and water flow regulation. For. Ecol. Manag. 2013, 289, 1–9. [Google Scholar] [CrossRef]
- Raudsepp-Hearne, C.; Peterson, G.D.; Bennett, E.M. Ecosystem service bundles for analyzing tradeoffs in diverse landscapes. Proc. Natl. Acad. Sci. USA 2010, 107, 5242–5247. [Google Scholar] [CrossRef] [PubMed] [Green Version]
- Dixon, J.A.; Fallon Scura, L.; van’t Hof, T. Meeting ecological and economic goals: Marine parks in the Caribbean. AMBIO 1993, 22, 117–125. [Google Scholar]
- Bagstad, K.J.; Semmens, D.J.; Winthrop, R. Comparing approaches to spatially explicit ecosystem service modeling: A case study from the San Pedro River, Arizona. Ecosyst. Serv. 2013, 5, 40–50. [Google Scholar] [CrossRef]
- Ward, J.V.; Malard, F.; Tockner, K. Landscape ecology: A framework for integrating pattern and process in river corridors. Landsc. Ecol. 2002, 17, 35–45. [Google Scholar] [CrossRef]
- Datry, T.; Pella, H.; Leigh, C.; Bonada, N.; Hugueny, B. A landscape approach to advance intermittent river ecology. Freshw. Biol. 2016, 61, 1200–1213. [Google Scholar] [CrossRef] [Green Version]
- Pan, H.; Zhang, L.; Cong, C.; Deal, B.; Wang, Y. A dynamic and spatially explicit modeling approach to identify the ecosystem service implications of complex urban systems interactions. Ecol. Indic. 2019, 102, 426–436. [Google Scholar] [CrossRef]
- Neuro Theta, B.M. Pedotransfer Functions for Predicting Soil Hydraulic Properties for Australia Soil; The University of Sydney: Sydney, Australia, 2003. [Google Scholar]
- Tallis, H.T.; Ricketts, T.; Guerry, A.D.; Wood, S.A.; Sharp, R.; Nelson, E.; Ennaanay, D.; Wolny, S.; Olwero, N.; Vigerstol, K.; et al. InVEST 2.4.1 User’s Guide; The Natural Capital Project, Stanford: Stanford, CA, USA, 2011. [Google Scholar]
- Grêt-Regamey, A.; Brunner, S.H.; Kienast, F. Mountain Ecosystem Services: Who Cares? Mt. Res. Dev. 2012, 32, S23–S34. [Google Scholar] [CrossRef]
- Brauman, K.A.; Daily, G.C.; Duarte, T.K.E.; Mooney, H.A. The Nature and Value of Ecosystem Services: An Overview Highlighting Hydrologic Services. Annu. Rev. Environ. Resour. 2007, 32, 67–98. [Google Scholar] [CrossRef]
- Lu, C.X.; Xie, G.D.; Cheng, S.K. Economic Evaluation of River Ecosystem Service in Recreation. Resour. Sci. 2001, 23, 77–81. [Google Scholar]
- Mach, M.E.; Martone, R.G.; Chan, K.M.A. Human impacts and ecosystem services: Insufficient research for trade-off evaluation. Ecosyst. Serv. 2015, 16, 112–120. [Google Scholar] [CrossRef]
- Xie, Y.; Yue, T.; Xinsheng, C.; Feng, L.; Zhengmiao, D. The impact of Three Gorges Dam on the downstream eco-hydrological environment and vegetation distribution of East Dongting Lake. Ecohydrology 2015, 8, 738–746. [Google Scholar] [CrossRef]
- Eloranta, A.P.; Finstad, A.G.; Helland, I.P.; Ugedal, O.; Power, M. Hydropower impacts on reservoir fish populations are modified by environmental variation. Sci. Total Environ. 2018, 618, 313–322. [Google Scholar] [CrossRef] [PubMed]
- Intralawan, A.; Wood, D.; Frankel, R.; Costanza, R.; Kubiszewski, I. Tradeoff analysis between electricity generation and ecosystem services in the Lower Mekong Basin. Ecosyst. Serv. 2018, 30, 27–35. [Google Scholar] [CrossRef]
- Fu, B.; Wang, Y.K.; Xu, P.; Yan, K.; Li, M. Value of ecosystem hydropower service and its impact on the payment for ecosystem services. Sci. Total Environ. 2014, 472, 338–346. [Google Scholar] [CrossRef] [PubMed]
- Nelson, E.; Mendoza, G.; Regetz, J.; Polasky, S.; Tallis, H.; Cameron, D.R.; Chan, K.M.A.; Daily, G.C.; Goldstein, J.; Kareiva, P.M. Modeling Multiple Ecosystem Services, Biodiversity Conservation, Commodity Production, and Tradeoffs at Landscape Scales. Front. Ecol. Environ. 2009, 7, 4–11. [Google Scholar] [CrossRef]
- Sherrouse, B.C.; Semmens, D.J.; Ancona, Z.H.; Brunner, N.M. Analyzing land-use change scenarios for trade-offs among cultural ecosystem services in the Southern Rocky Mountains. Ecosyst. Serv. 2018, 26, 431–444. [Google Scholar] [CrossRef]
- Bukoski, J.J.; Broadhead, J.S.; Donato, D.C.; Murdiyarso, D.; Gregoire, T.G. The Use of Mixed Effects Models for Obtaining Low-Cost Ecosystem Carbon Stock Estimates in Mangroves of the Asia-Pacific. PLoS ONE 2017, 12, e0169096. [Google Scholar] [CrossRef] [PubMed]
- Bagstad, K.J.; Johnson, G.W.; Voigt, B.; Villa, F. Spatial dynamics of ecosystem service flows: A comprehensive approach to quantifying actual services. Ecosyst. Serv. 2013, 4, 117–125. [Google Scholar] [CrossRef]
- Carson, N.; Tsigaris, P. Illustrating Environmental Issues by Using the Production-Possibility Frontier: A Classroom Experiment. J. Econ. Edu. 2011, 42, 243–254. [Google Scholar] [CrossRef]
- Ager, A.A.; Day, M.A.; Vogler, K. Production possibility frontiers and socioecological tradeoffs for restoration of fire adapted forests. J. Environ. Manag. 2016, 176, 157–168. [Google Scholar] [CrossRef] [PubMed] [Green Version]
- Li, Z.; Deng, X.; Wu, F.; Hasan, S. Scenario Analysis for Water Resources in Response to Land Use Change in the Middle and Upper Reaches of the Heihe River Basin. Sustainability 2015, 7, 3086–3108. [Google Scholar] [CrossRef] [Green Version]
- Victor, P.A. Growth, degrowth and climate change: A scenario analysis. Ecol. Econ. 2012, 84, 206–212. [Google Scholar] [CrossRef]
- Jie, G.; Feng, L.; Hui, G.; Zhou, C.; Zhang, X. The impact of land-use change on water-related ecosystem services: A study of the Guishui River Basin, Beijing, China. J. Clean. Prod. 2015, 163, 148–155. [Google Scholar]
- Bouguerra, S.; Jebari, S. Identification and prioritization of sub-watersheds for land and water management using InVEST SDR model: Rmelriver basin, Tunisia. Arab. J. Geosci. 2017, 10, 348. [Google Scholar] [CrossRef]
- Sentelhas, P.C.; Gillespie, T.J.; Santos, E.A. Evaluation of FAO Penman-Monteith and alternative methods for estimating reference evapotranspiration with missing data in Southern Ontario, Canada. Agric. Water Manag. 2010, 97, 635–644. [Google Scholar] [CrossRef]
- Pereira, L.S.; Allen, R.G.; Smith, M.; Raes, D. Crop evapotranspiration estimation with FAO56: Past and future. Agric. Water Manag. 2015, 147, 4–20. [Google Scholar] [CrossRef]
- Wang, Y.; Zhou, G.S. Evapotranspiration characteristics and crop coefficient of rain-fed maize agroecosystem. Chin. J. Appl. Ecol. 2010, 21, 647–653. [Google Scholar]
- Liang, W.Q.; Cai, H.J.; Wang, J. Experimental Study on Crop Coefficient of Maize in Guanzhong Region of Shaanxi Province. Water Sav. Irrig. 2011, 12, 1–4. [Google Scholar]
- Sharp, R.; Tallis, H.T.; Ricketts, T.; Guerry, A.D.; Wood, S.A.; Chaplin-Kramer, R.; Nelson, E.; Ennaanay, D.; Wolny, S.; Olwero, N.; et al. InVEST User’s Guide; The Natural Capital Project, Stanford: Stanford, CA, USA, 2014. [Google Scholar]
- Mitchell, M.G.E.; Bennett, E.M.; Gonzalez, A. Linking Landscape Connectivity and Ecosystem Service Provision: Current Knowledge and Research Gaps. Ecosystems 2013, 16, 894–908. [Google Scholar] [CrossRef]
- Yang, X.; Zhou, Z.; Jing, L.I.; Xin, F.U.; Xingmin, M.U.; Ting, L.I. Trade-offs between carbon sequestration, soil retention and water yield in the Guanzhong-Tianshui Economic Region of China. J. Geogr. Sci. 2016, 26, 1449–1462. [Google Scholar] [CrossRef]
- Ziv, G.; Baran, E.; Nam, S.; Rodrígueziturbe, I.; Levin, S.A. Trading-off fish biodiversity, food security, and hydropower in the Mekong River Basin. Proc. Natl. Acad. Sci. USA 2012, 109, 5609–5614. [Google Scholar] [CrossRef] [PubMed] [Green Version]
- Winemiller, K.O.; Mcintyre, P.B.; Castello, L.; Fluetchouinard, E.; Giarrizzo, T.; Nam, S.; Baird, I.G.; Darwall, W.; Lujan, N.K.; Harrison, I. Balancing hydropower and biodiversity in the Amazon, Congo, and Mekong. Science 2016, 351, 128–129. [Google Scholar] [CrossRef] [PubMed] [Green Version]
- Zhang, B. Great Policy Benefits for the Hydropower Development in China. Hydropower New Energy 2018, 32, 1. [Google Scholar]
- Burke, M.; Jorde, K.; Buffington, J.M.; Tullos, D.; Tilt, B.; Liermann, C.R. Application of a hierarchical framework for assessing environmental impacts of dam operation: Changes in streamflow, bed mobility and recruitment of riparian trees in a western North American river. J. Environ. Manag. 2009, 90, S224–S236. [Google Scholar] [CrossRef] [PubMed]
- Fahrenkamp-Uppenbrink, J. Reducing the ecosystem impacts of dams. Science 2016, 353, 1109–1111. [Google Scholar] [CrossRef]
- Poff, N.L.; Olden, J.D. Can dams be designed for sustainability? Science 2017, 358, 1252. [Google Scholar] [CrossRef] [PubMed]
- Bednarek, A.T. Undamming rivers: A review of the ecological impacts of dam removal. Environ. Manag. 2001, 27, 803–814. [Google Scholar] [CrossRef]
- Hurford, A.P.; Huskova, I.; Harou, J.J. Using many-objective trade-off analysis to help dams promote economic development, protect the poor and enhance ecological health. Environ. Sci. Policy 2014, 38, 72–86. [Google Scholar] [CrossRef]
- Kharrazi, A.; Akiyama, T.; Yu, Y.; Li, J. Evaluating the evolution of the Heihe River basin using the ecological network analysis: Efficiency, resilience, and implications for water resource management policy. Sci. Total Environ. 2016, 572, 688–696. [Google Scholar] [CrossRef]
- Vander Vorste, R.; Mermillod-Blondin, F.; Hervant, F.; Mons, R.; Forcellini, M.; Datry, T. Increased depth to the water table during river drying decreases the resilience of Gammarus pulex and alters ecosystem function. Ecohydrology 2016, 9, 1177–1186. [Google Scholar] [CrossRef]
- Lin, H.; Shao, Q.; Liu, J. Forest restoration to achieve both ecological and economic progress, Poyang Lake basin, China. Ecol. Eng. 2012, 44, 53–60. [Google Scholar]
- Shaw, W.D.; Wlodarz, M. Ecosystems, Ecological Restoration, and Economics: Does Habitat or Resource Equivalency Analysis Mean Other Economic Valuation Methods Are Not Needed? AMBIO 2013, 42, 628–643. [Google Scholar] [CrossRef] [PubMed]
- Berga, L. The Role of Hydropower in Climate Change Mitigation and Adaptation: A Review. Engineering 2016, 2, 313–318. [Google Scholar] [CrossRef] [Green Version]
- Demarty, M.; Bastien, J. GHG emissions from hydroelectric reservoirs in tropical and equatorial regions: Review of 20 years of CH emission measurements. Energy Policy 2011, 39, 4197–4206. [Google Scholar] [CrossRef]
- Bing, Y.; Xu, L.; Yang, Z. Ecological compensation for inundated habitats in hydropower developments based on carbon stock balance. J. Clean. Prod. 2016, 114, 334–342. [Google Scholar]
- Pan, H.; Page, J.; Zhang, L.; Chen, S.; Cong, C.; Destouni, G.; Kalantari, Z.; Deal, B.M. Using comparative socio-ecological modeling to support Climate Action Planning (CAP). J. Clean. Prod. 2019, 232, 30–42. [Google Scholar] [CrossRef]
Figure 1.
Hydropower development in the study area.
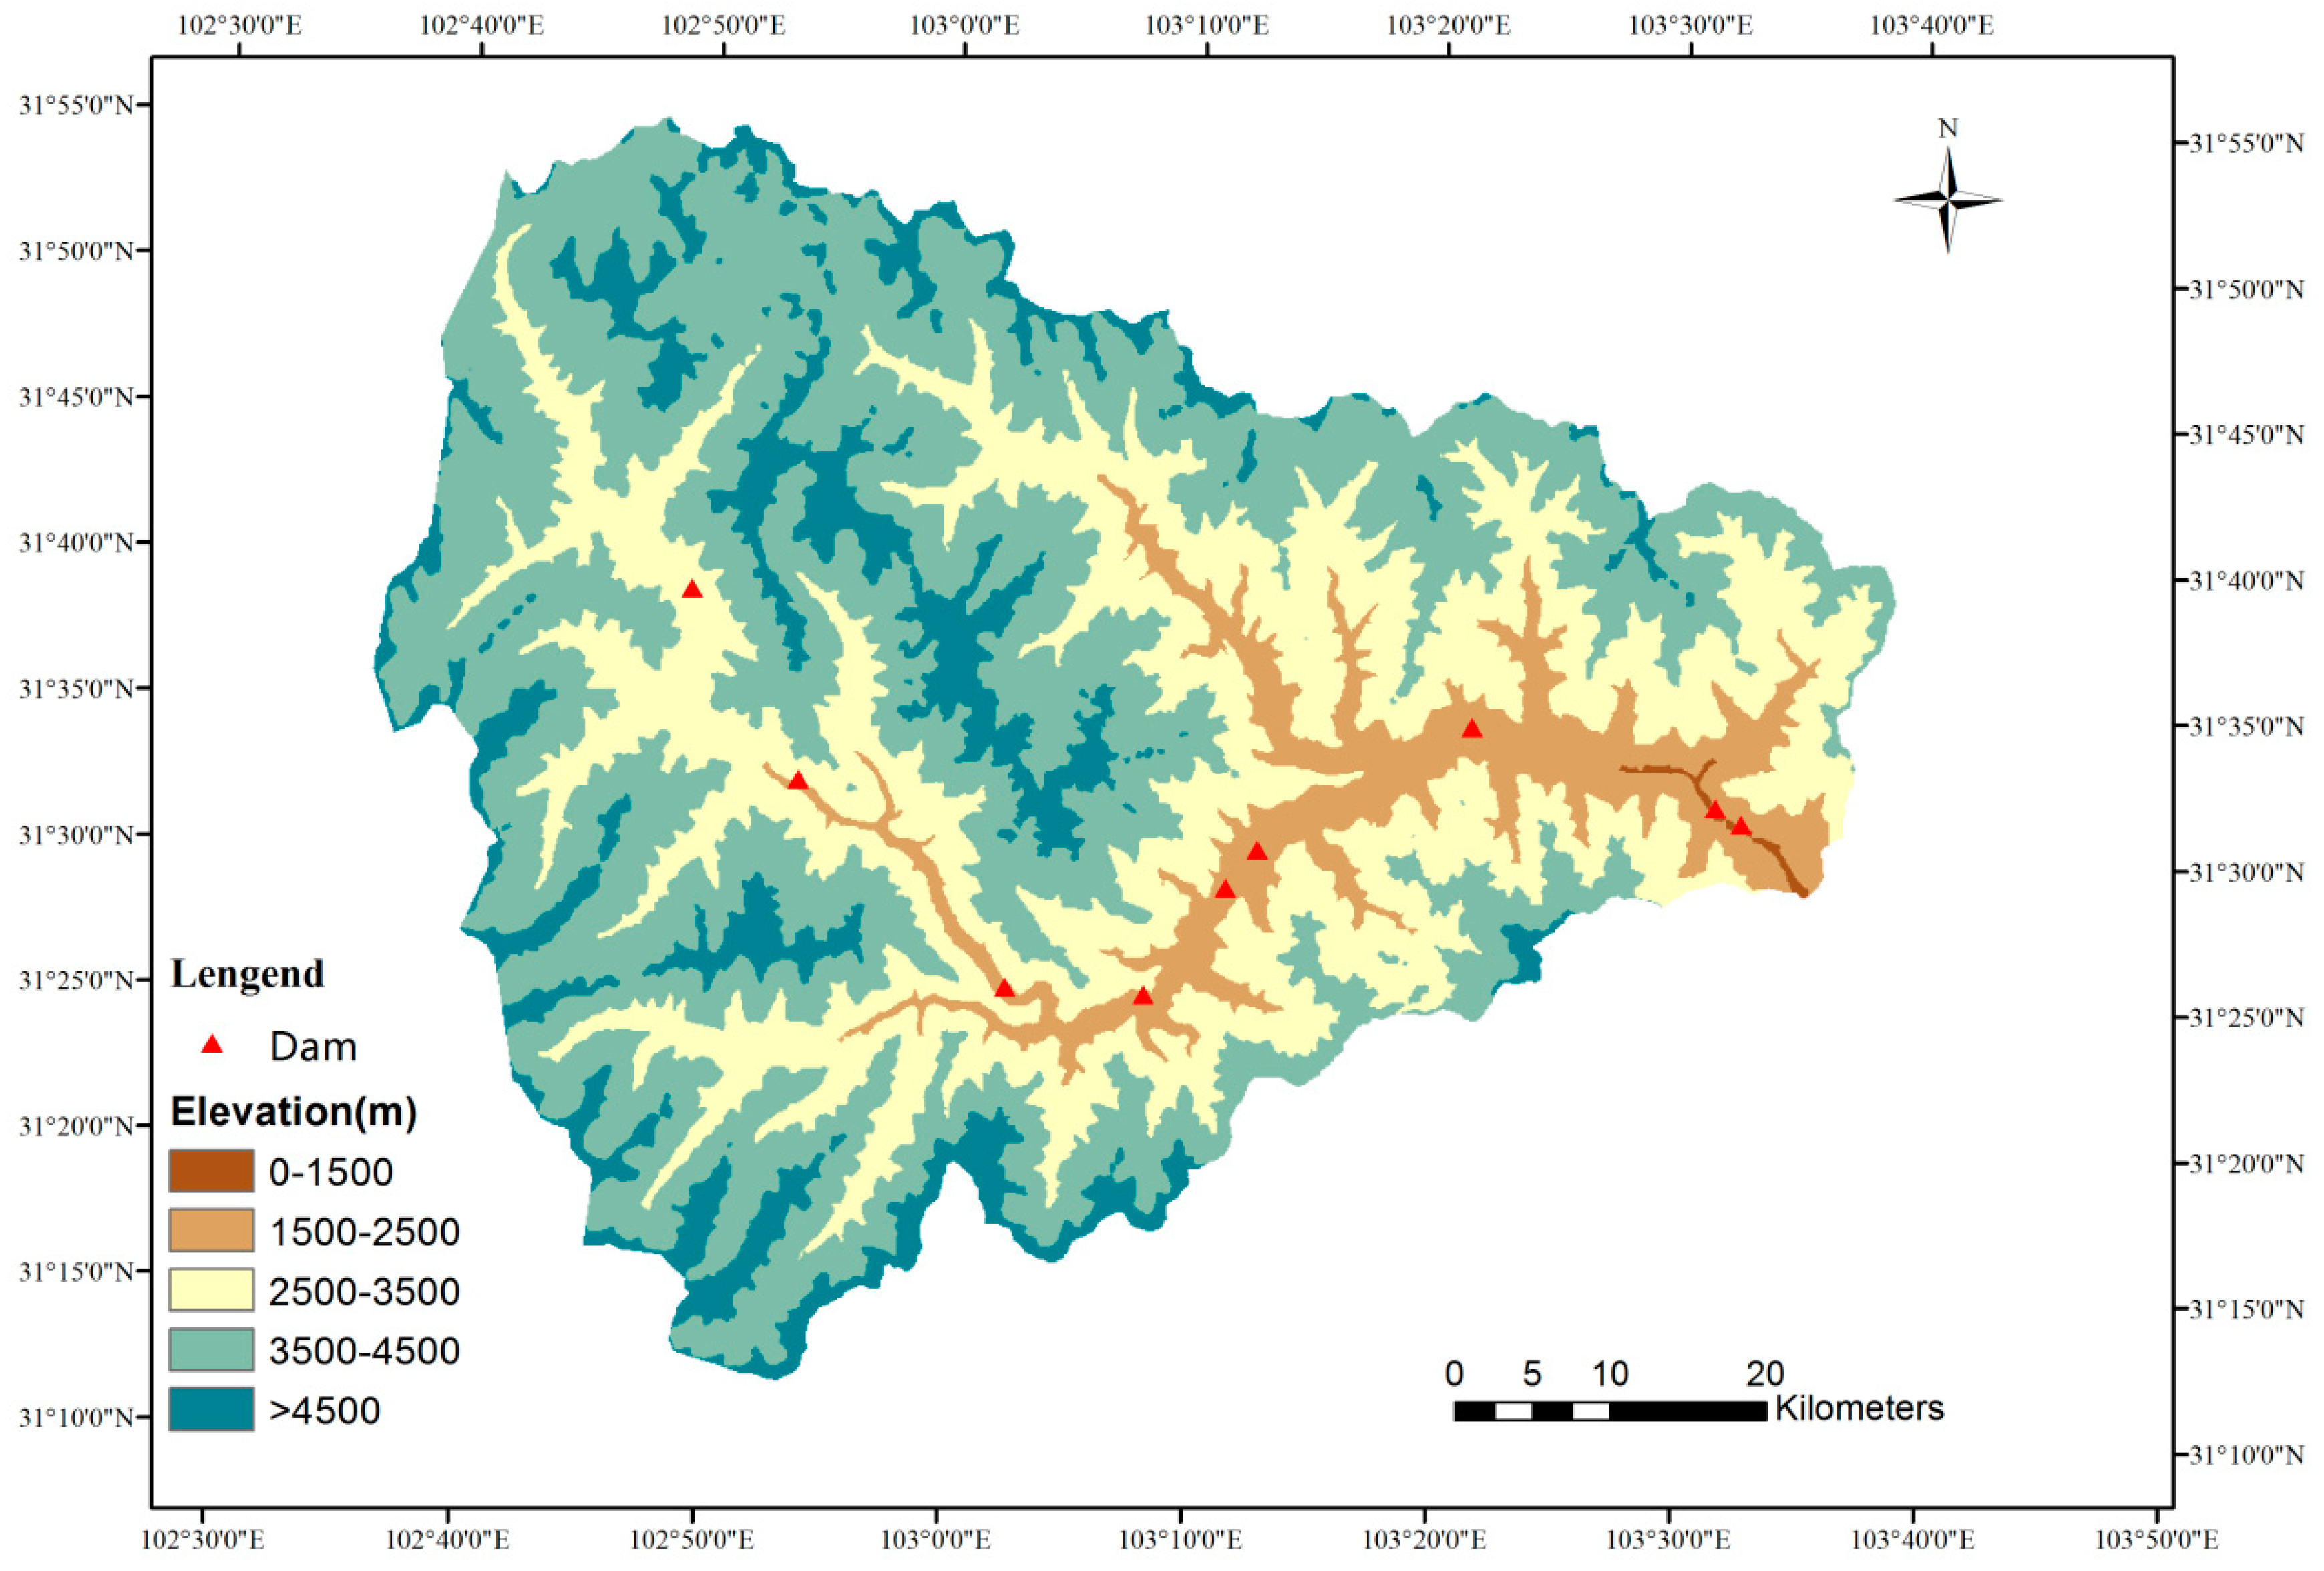
Figure 2.
The framework for tradeoff in the hydropower service and river landscape service.
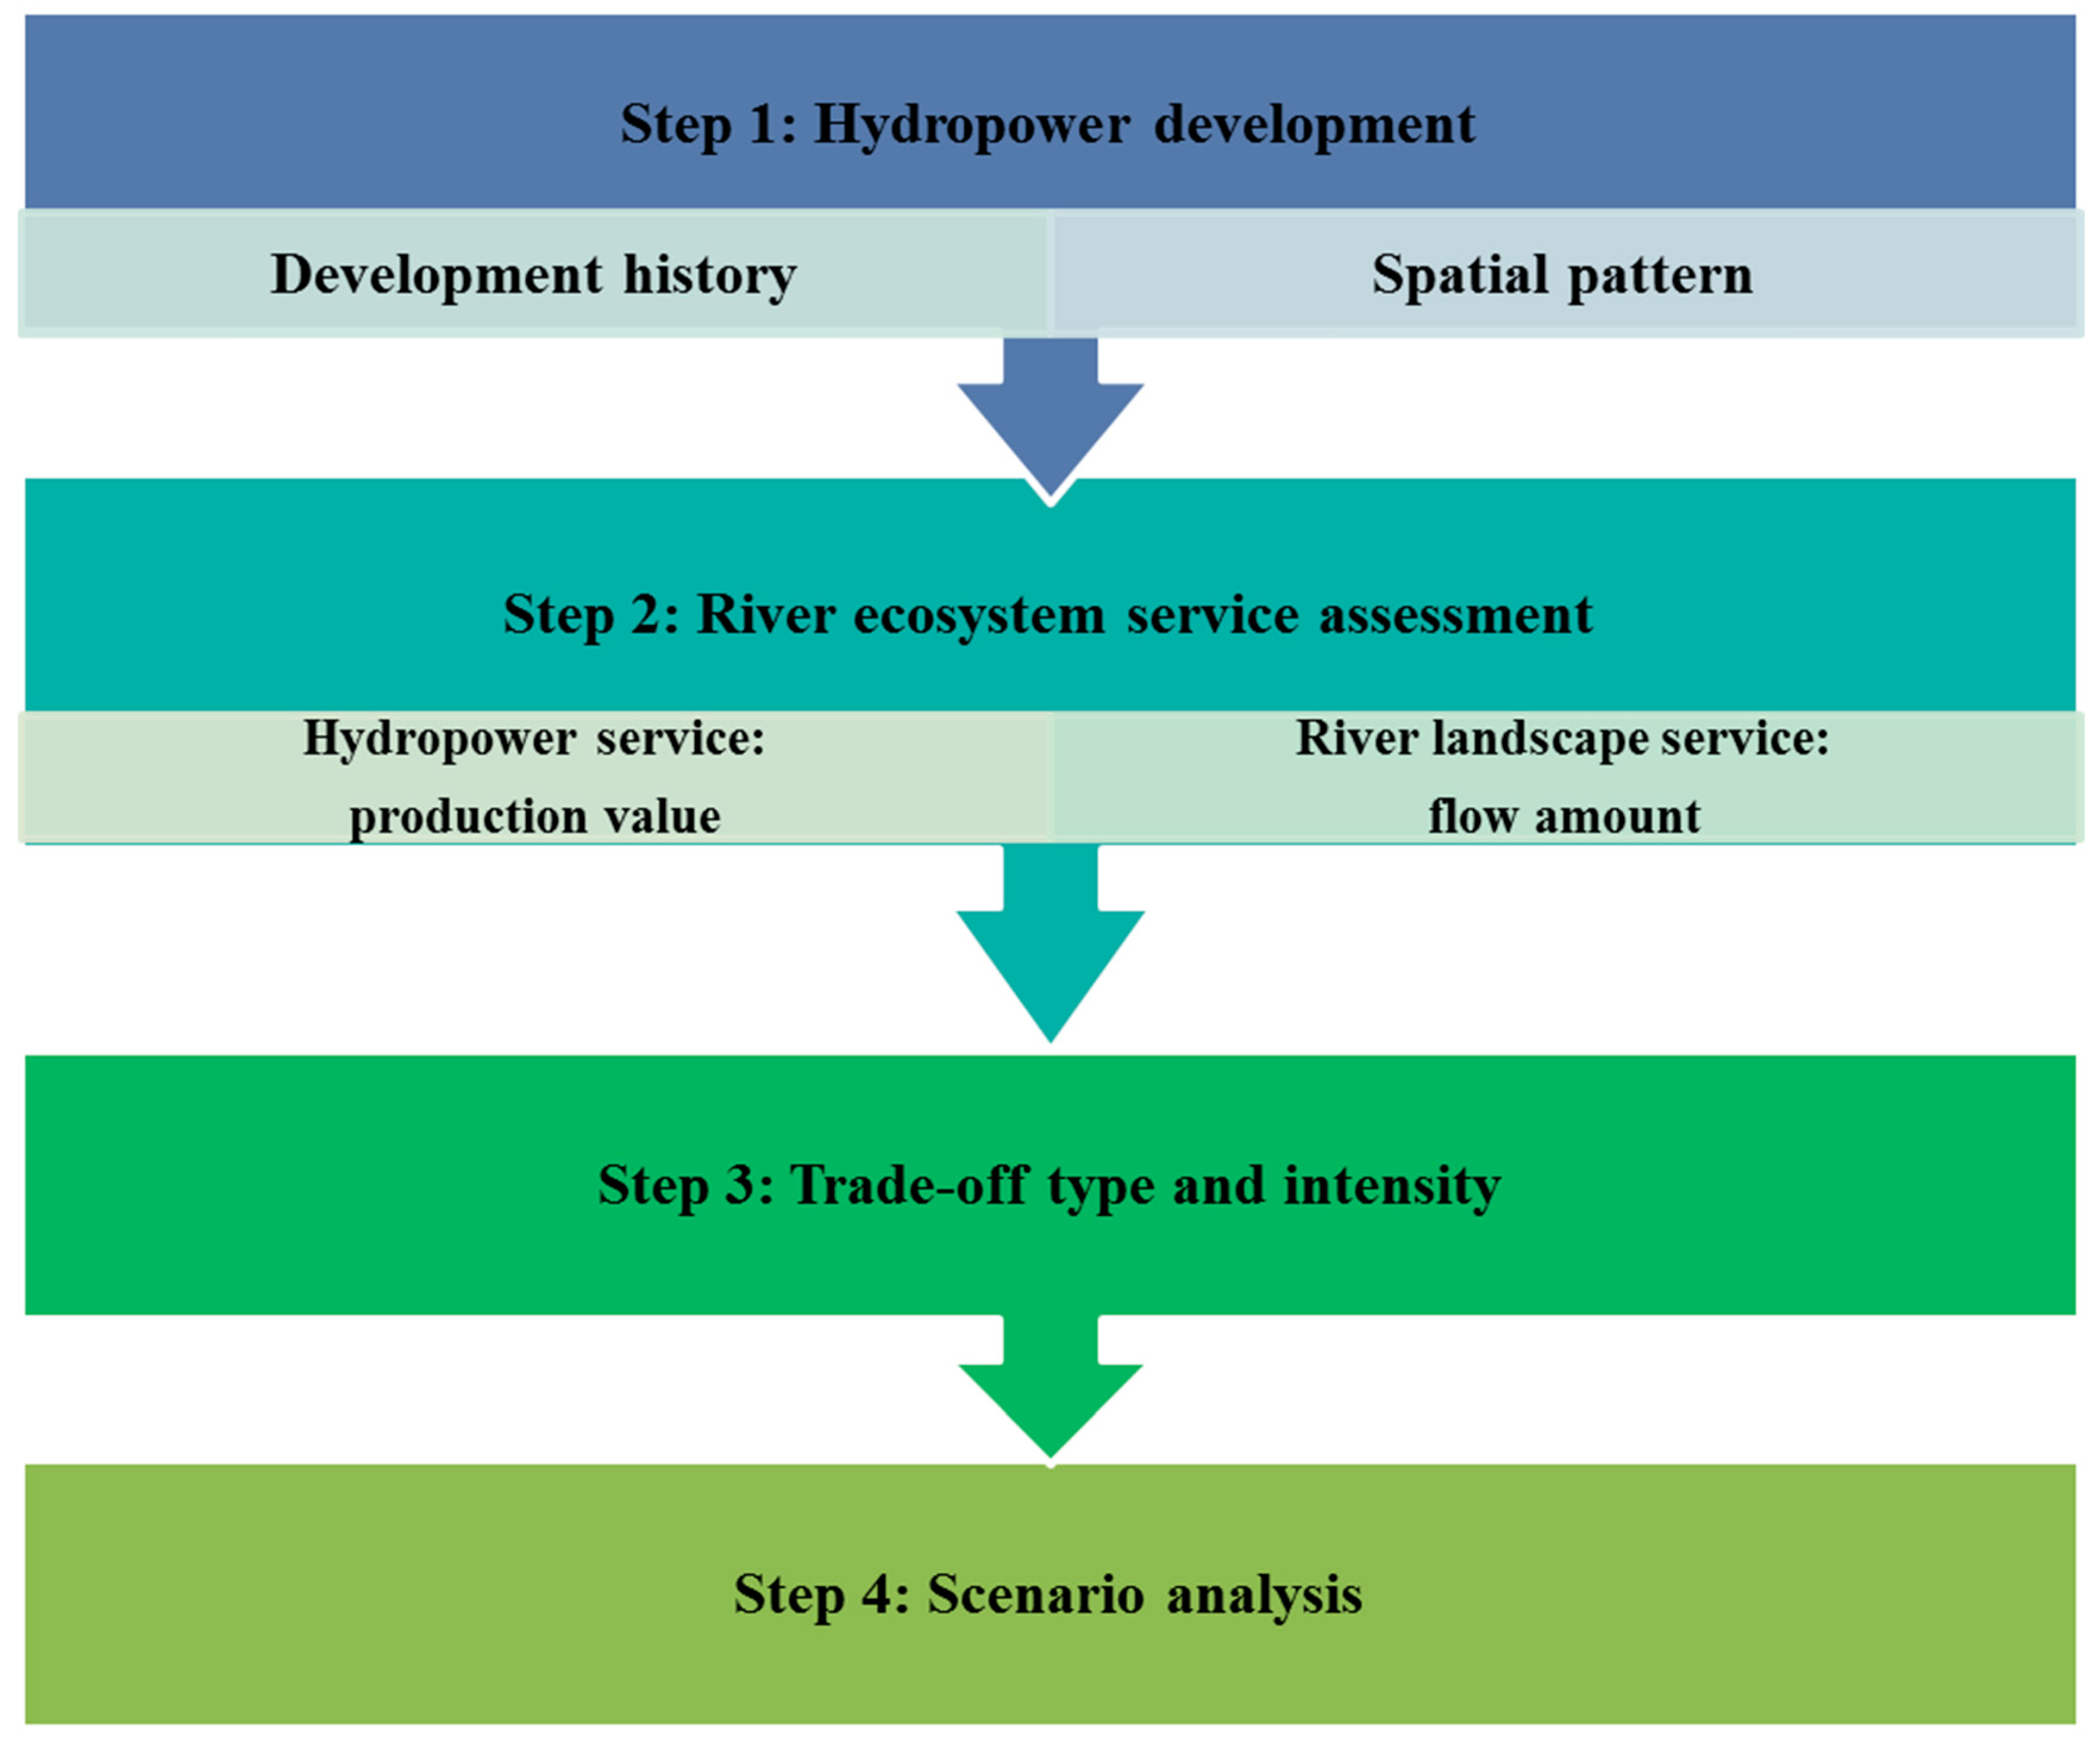
Figure 3.
Distribution of water retention services.
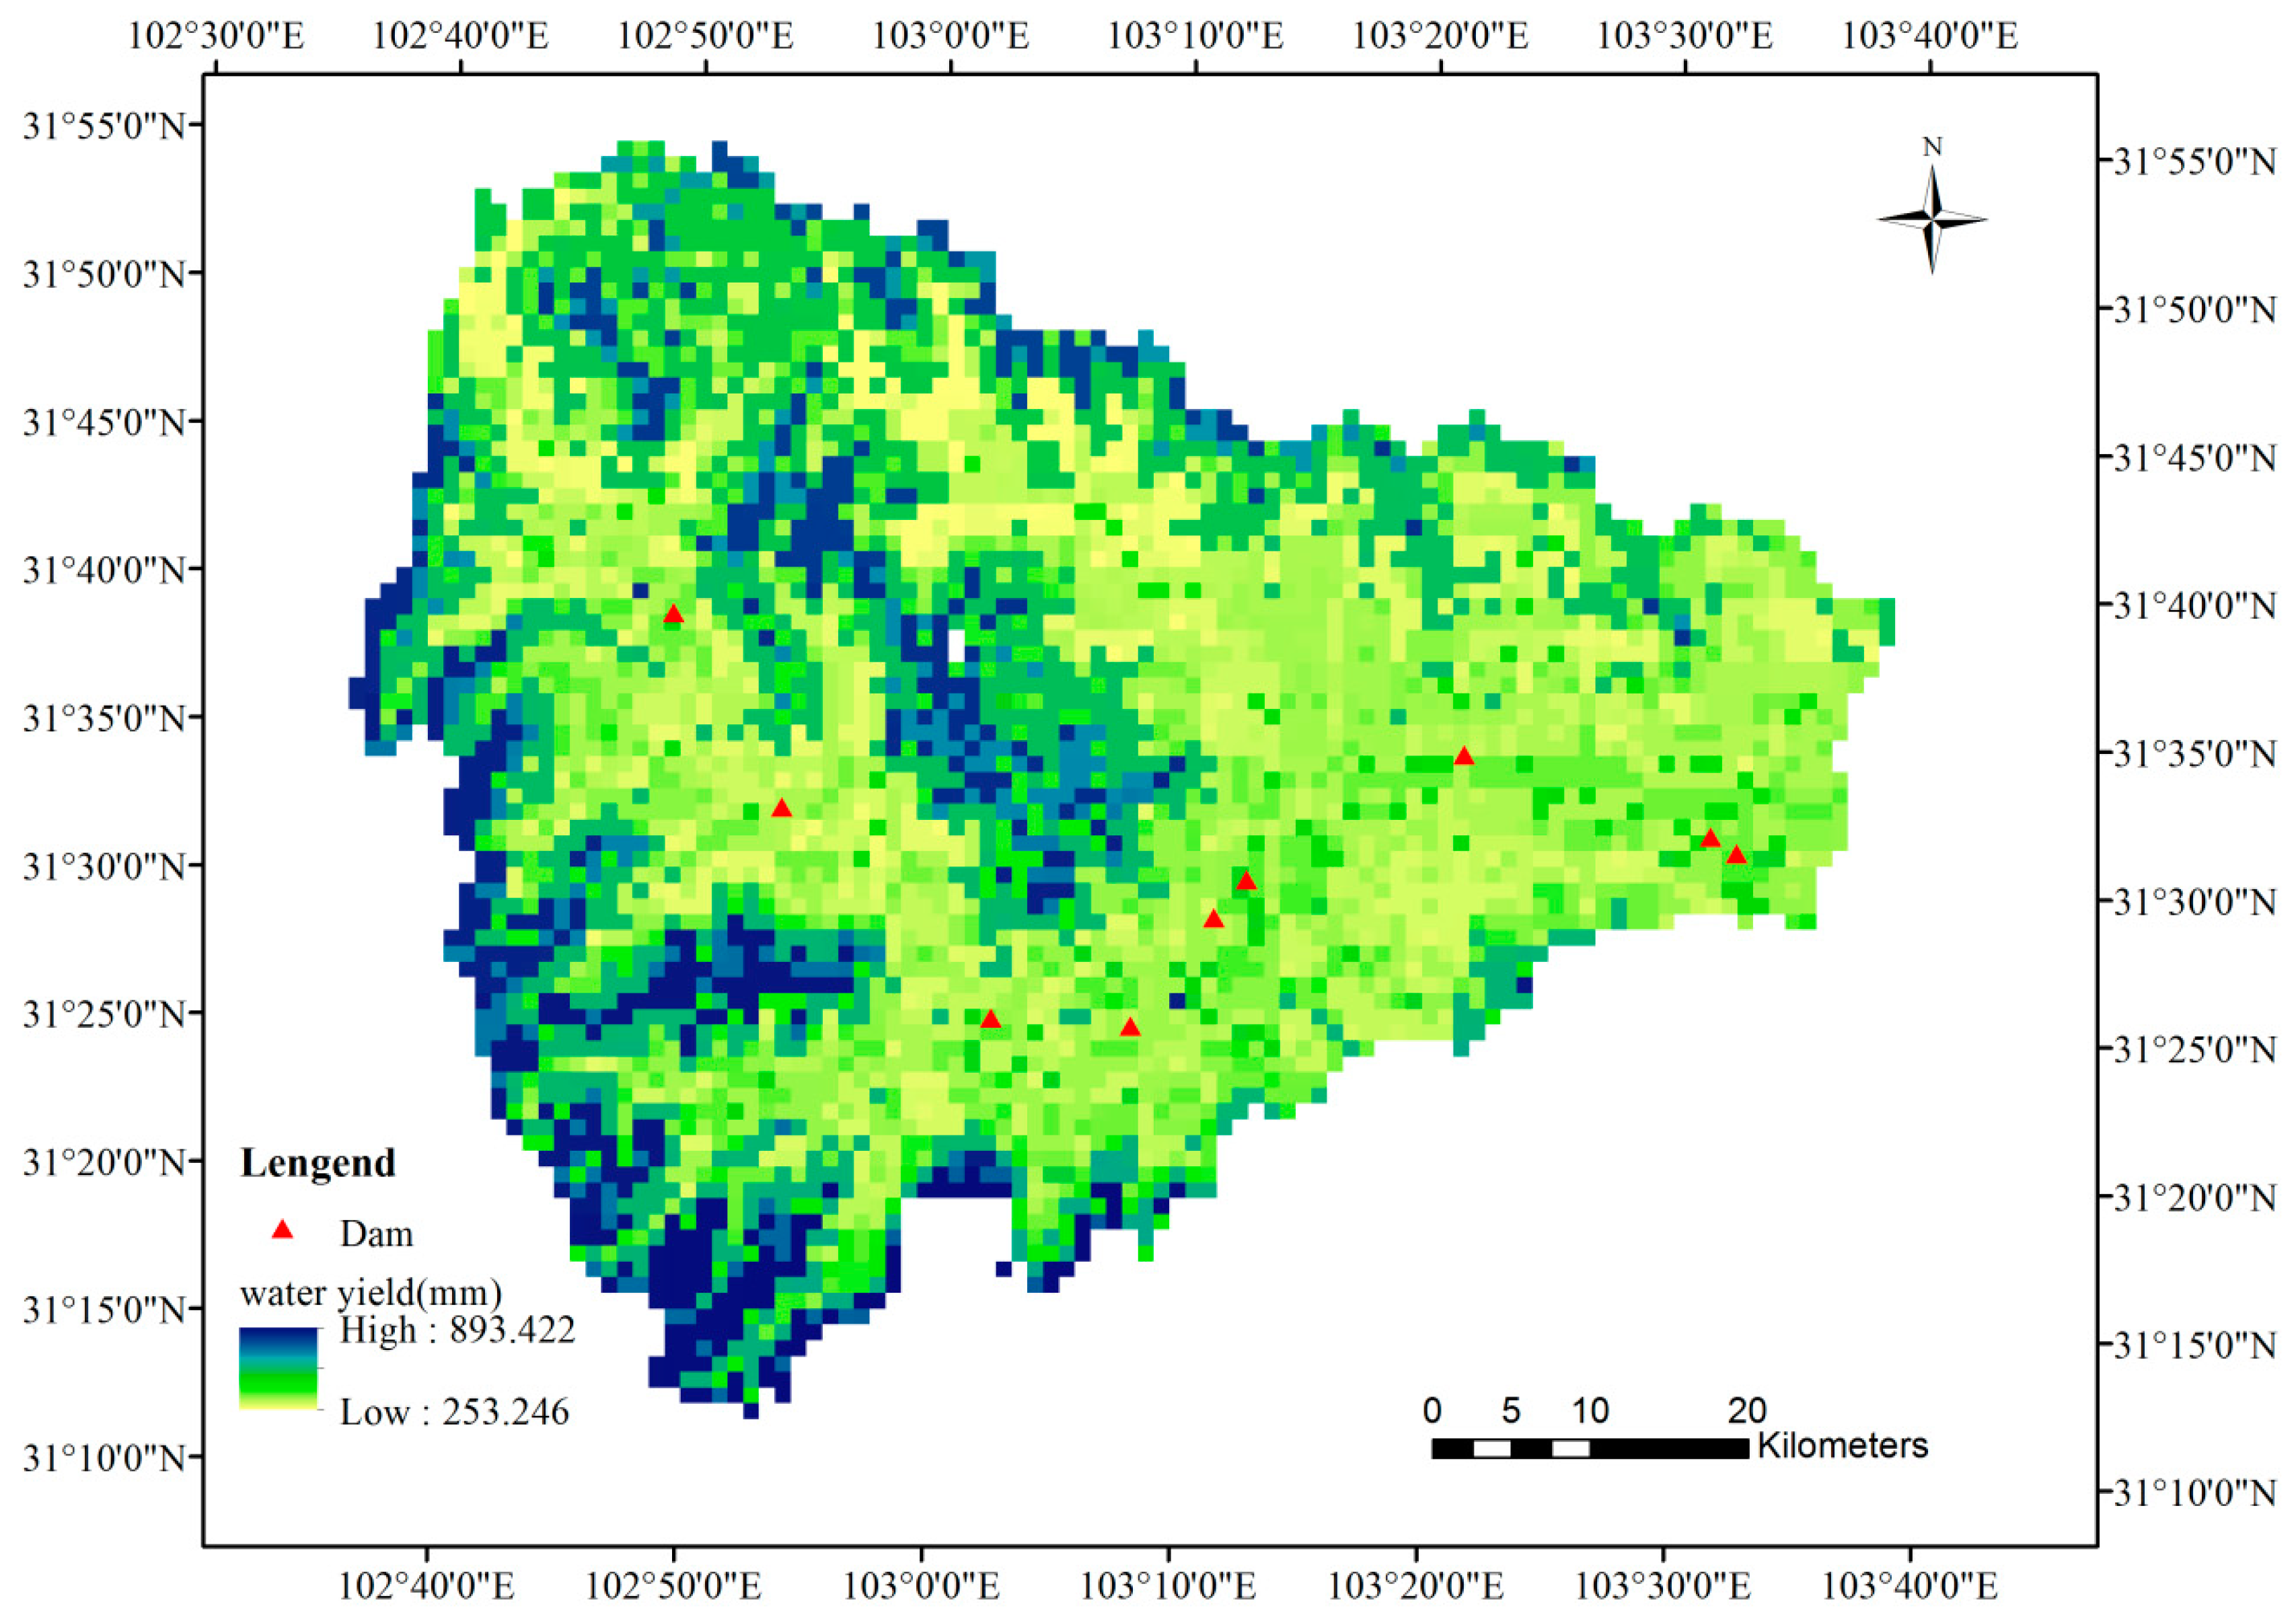
Figure 4.
Historical hydropower service.
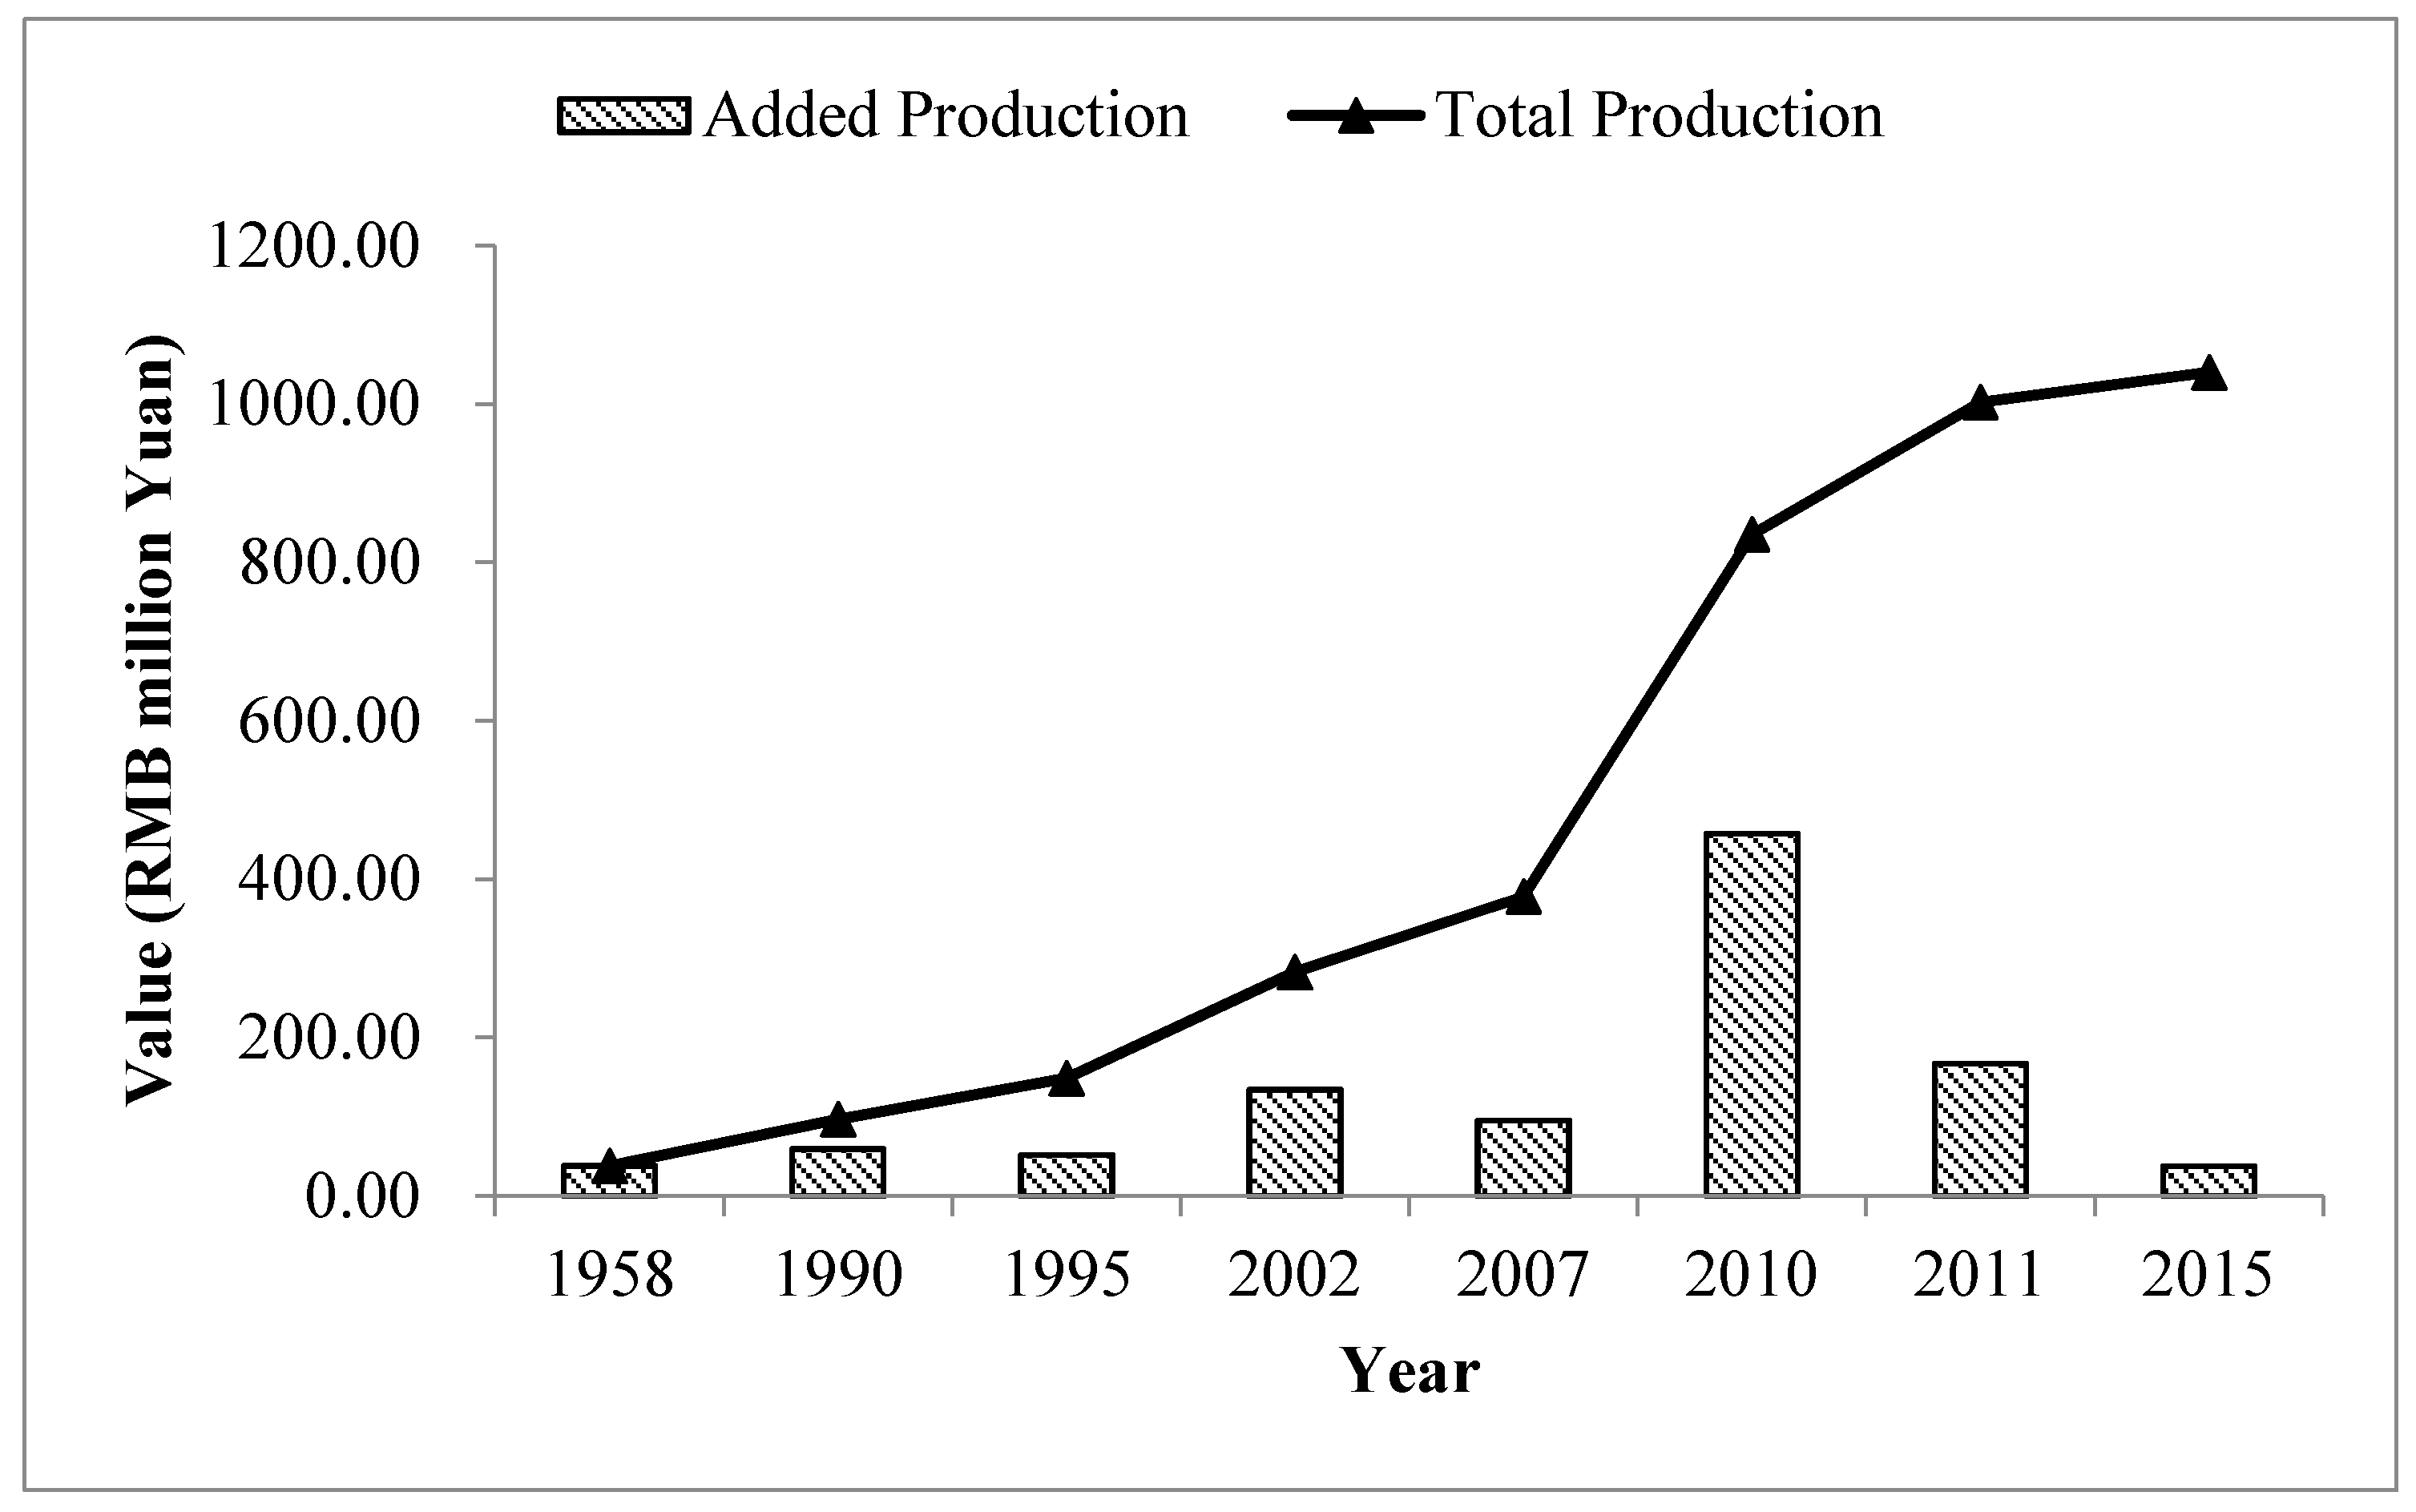
Figure 5.
Spatial distribution of hydropower values. (a) Hydropower services in the sub-watershed of various power stations. The power stations are downstream from left to right; (b) hydropower services along altitude.
Figure 5.
Spatial distribution of hydropower values. (a) Hydropower services in the sub-watershed of various power stations. The power stations are downstream from left to right; (b) hydropower services along altitude.
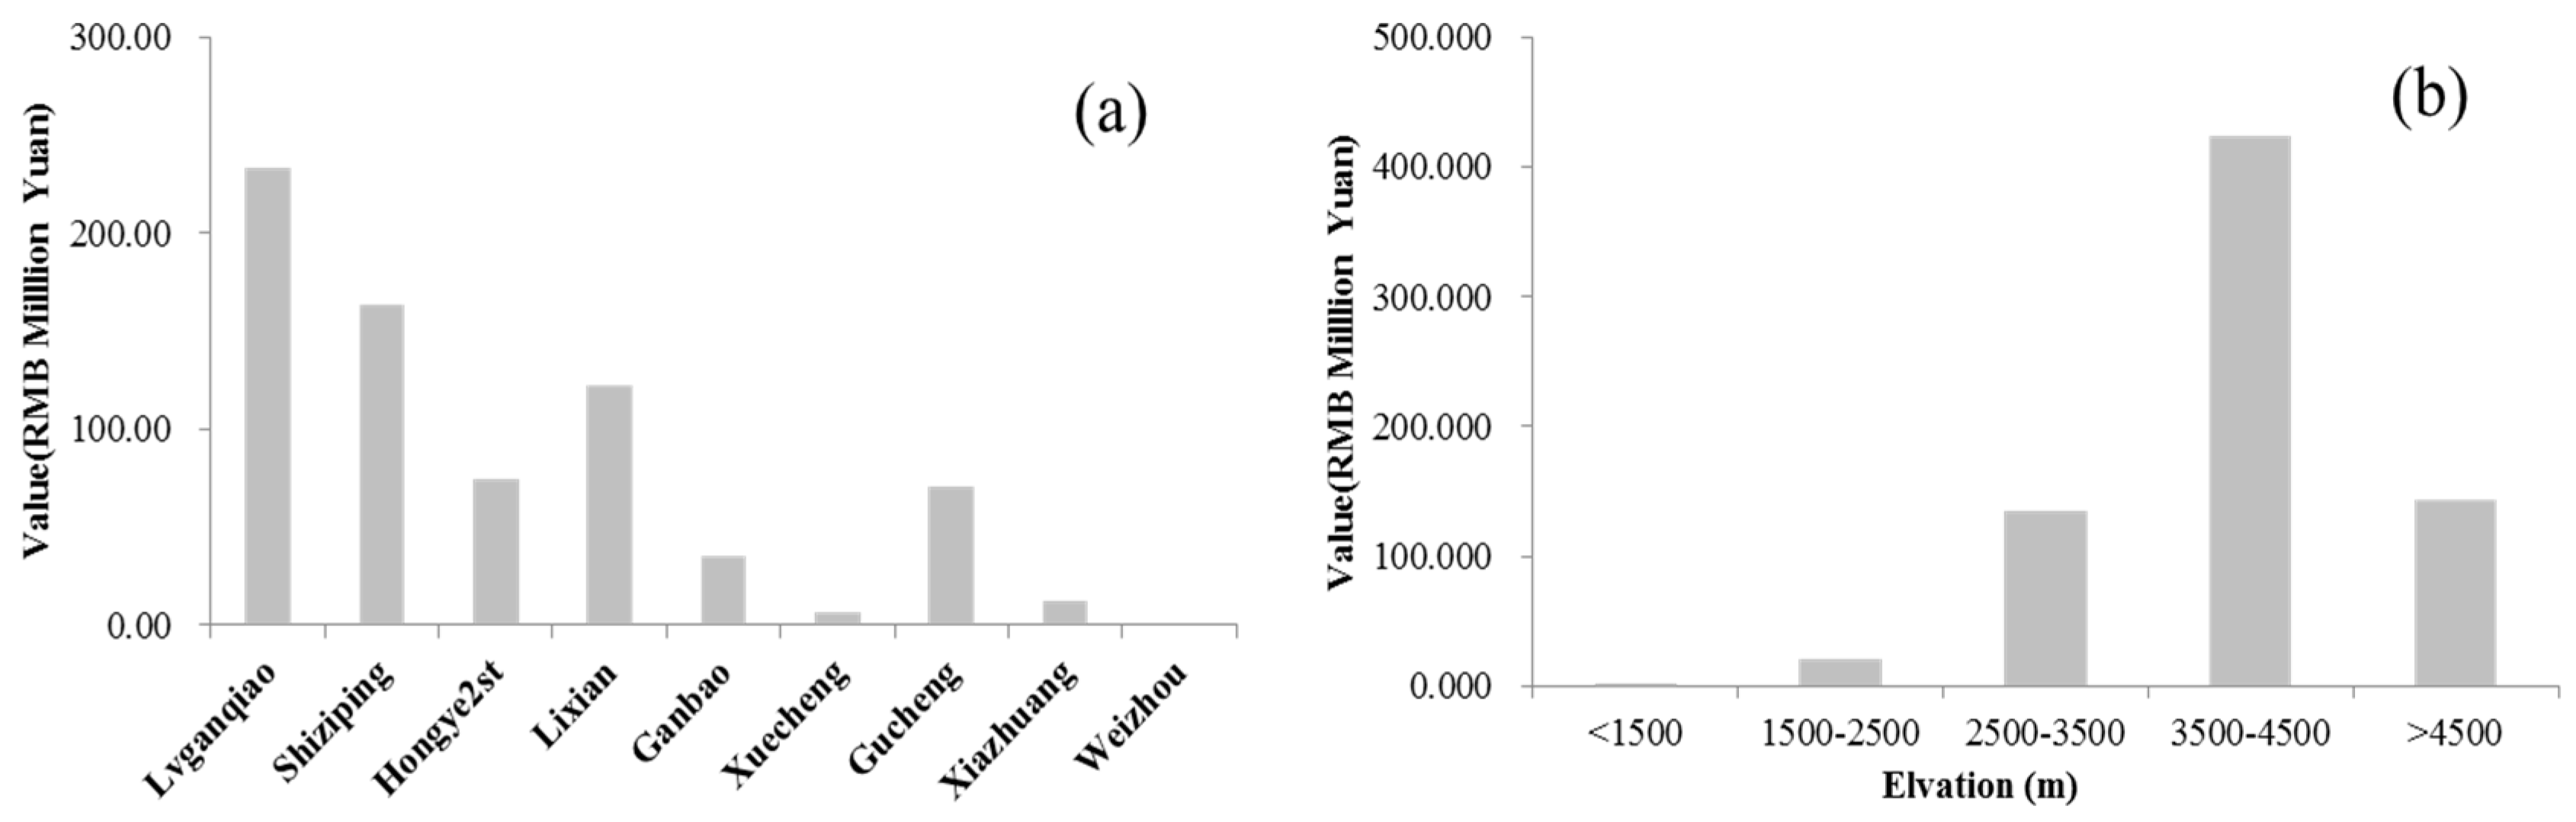
Figure 6.
(a) Riverbed appearance after runoff had been taken by the hydroplant; (b) restored river landscape after the runoff comeback from the power station.
Figure 6.
(a) Riverbed appearance after runoff had been taken by the hydroplant; (b) restored river landscape after the runoff comeback from the power station.
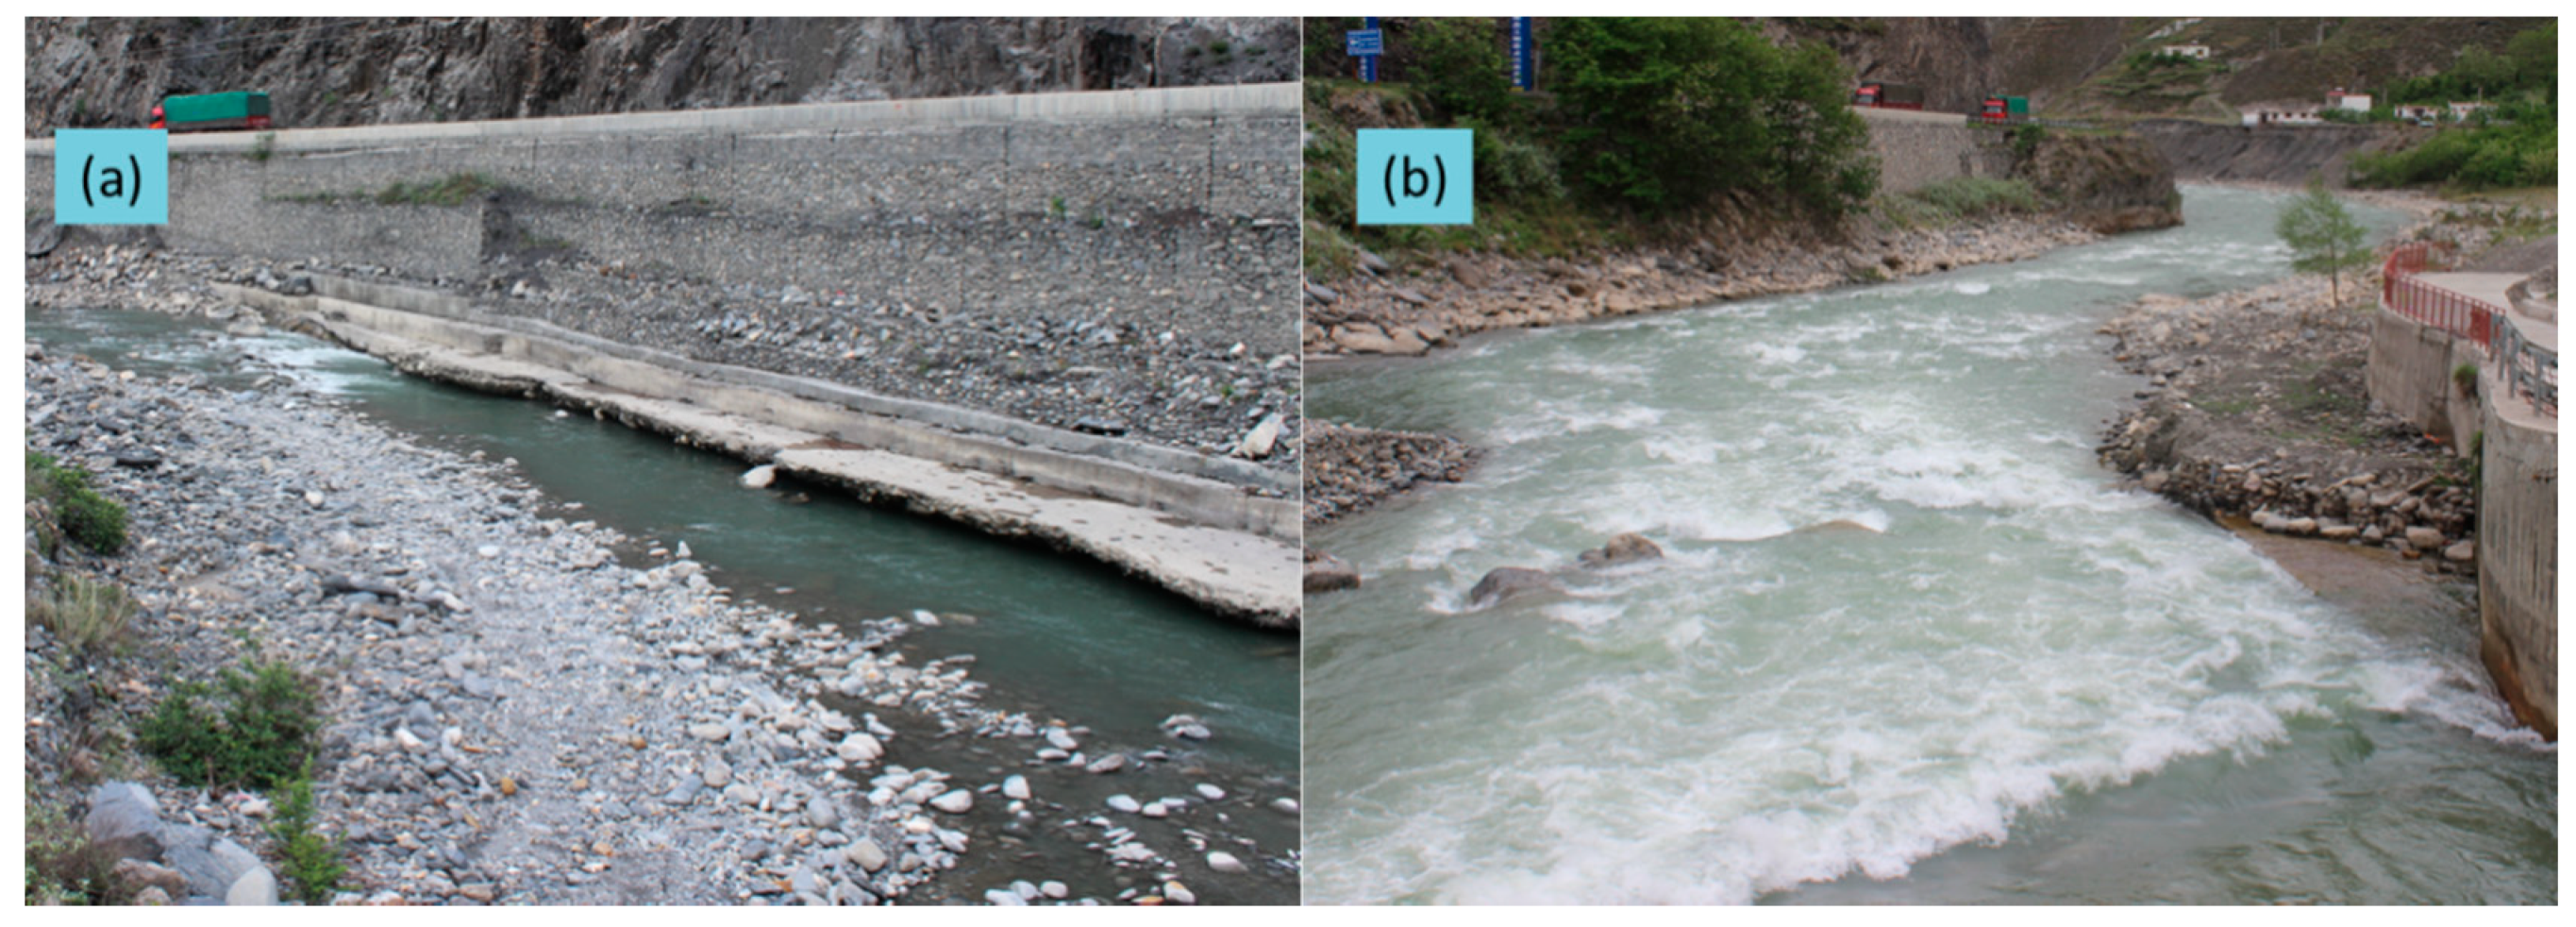
Figure 7.
Flows of different river sections before and after hydropower development.
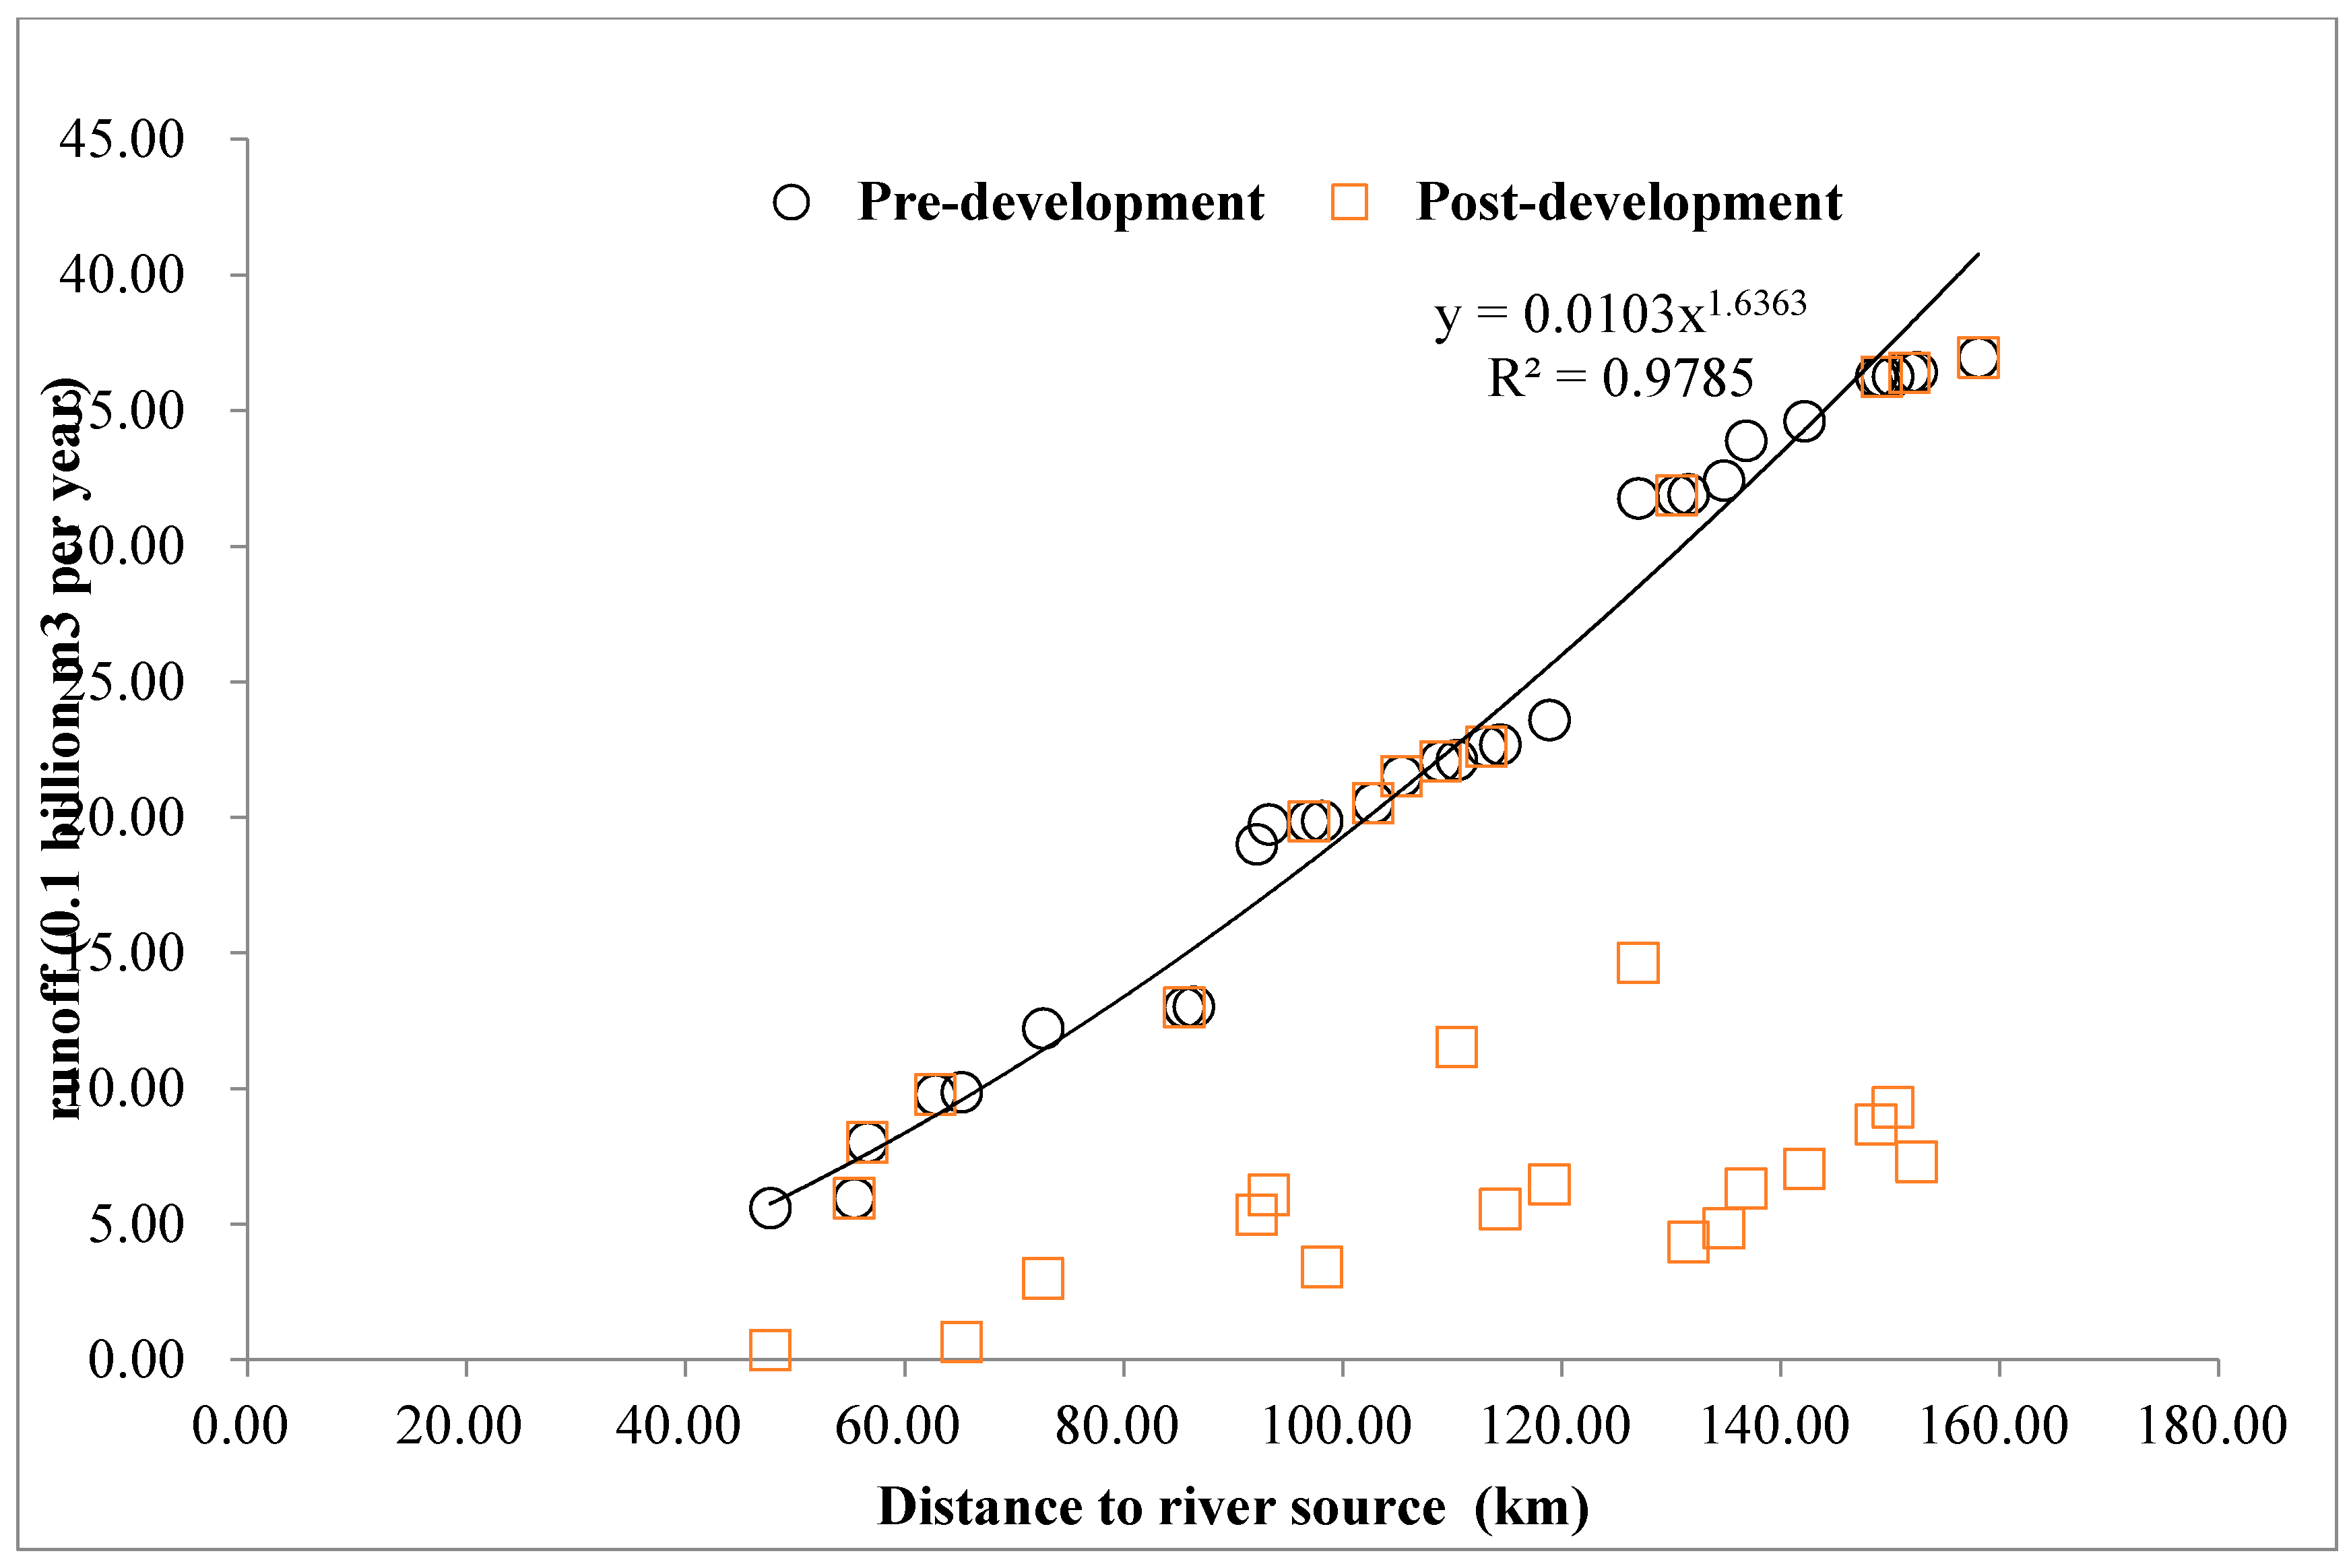
Figure 8.
Historical tradeoff analysis. ((a) Hydropower service and river visual landscape services (RVLS) changed in different development periods, (b) tradeoff intensity during different development periods).
Figure 8.
Historical tradeoff analysis. ((a) Hydropower service and river visual landscape services (RVLS) changed in different development periods, (b) tradeoff intensity during different development periods).
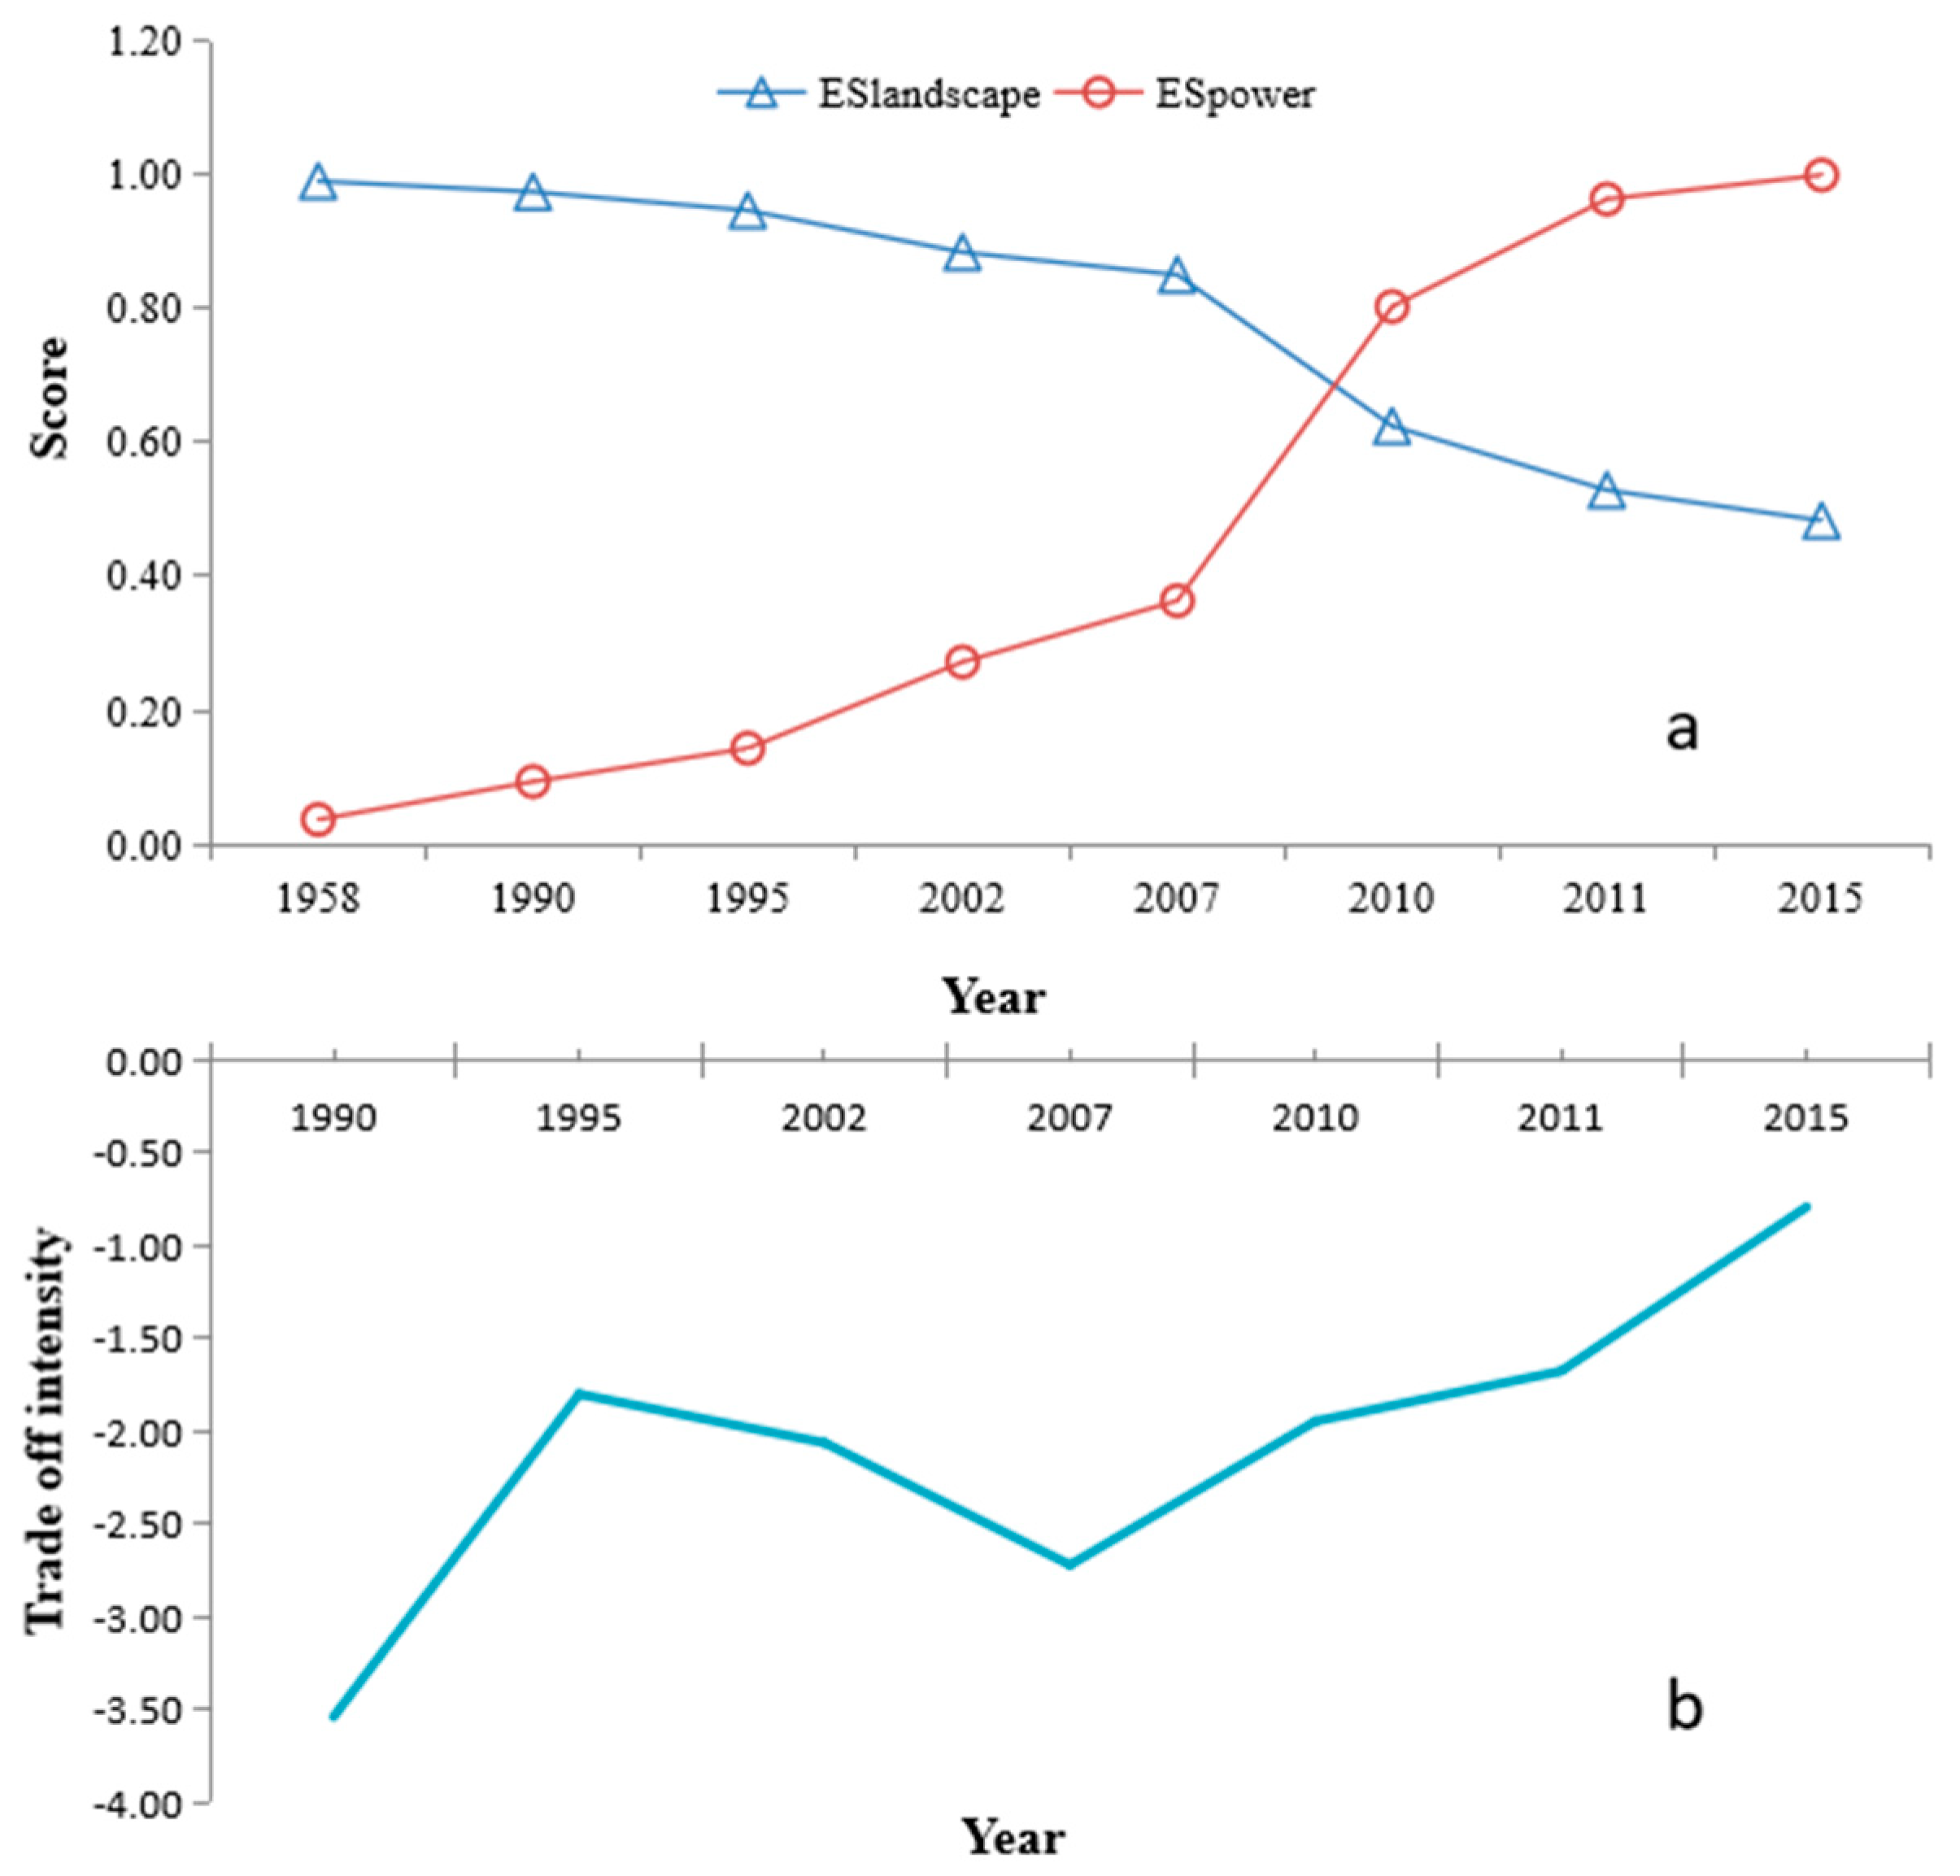
Figure 9.
Pareto relationship between hydropower and landscape services. The points in the figure represent the hydropower services and RVLS scores of the mainstreams in different years.
Figure 9.
Pareto relationship between hydropower and landscape services. The points in the figure represent the hydropower services and RVLS scores of the mainstreams in different years.
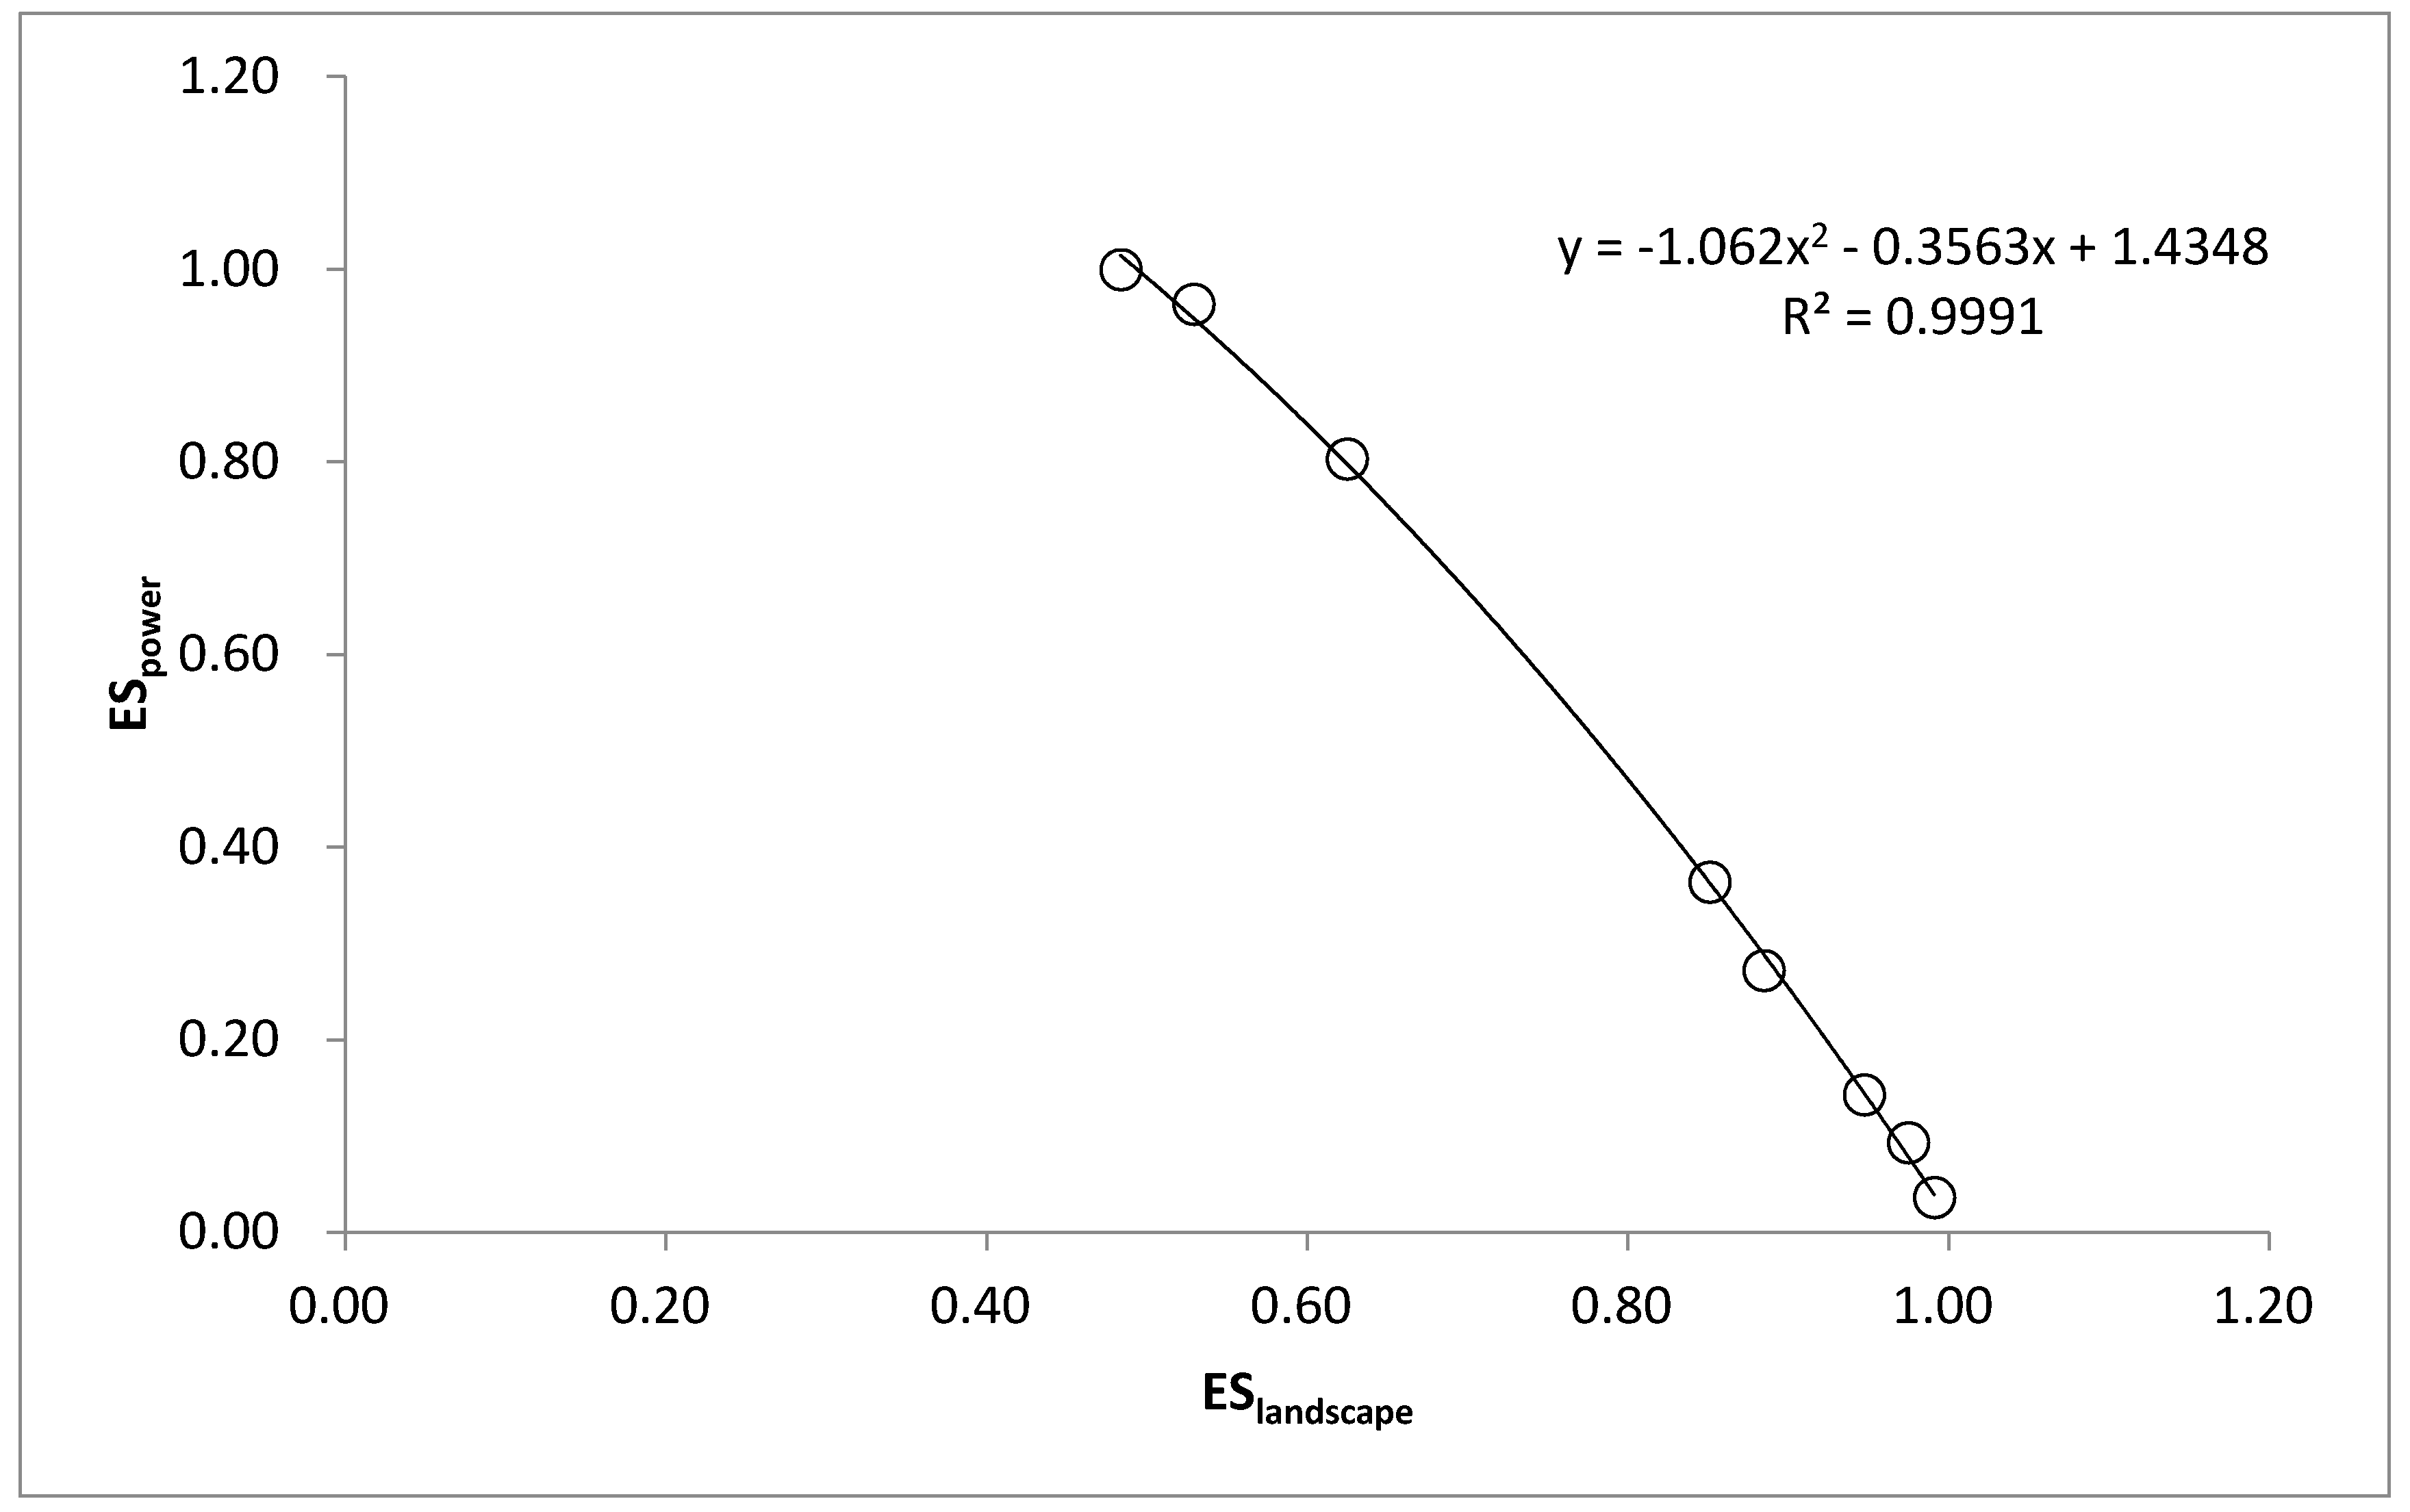
Figure 10.
Variation of tradeoff intensity along the distance to the outlet. (This figure reflects the spatial variation of the trade off in the direction downstream. Red indicates a negative tradeoff, and black indicates synergy in certain river sections.).
Figure 10.
Variation of tradeoff intensity along the distance to the outlet. (This figure reflects the spatial variation of the trade off in the direction downstream. Red indicates a negative tradeoff, and black indicates synergy in certain river sections.).
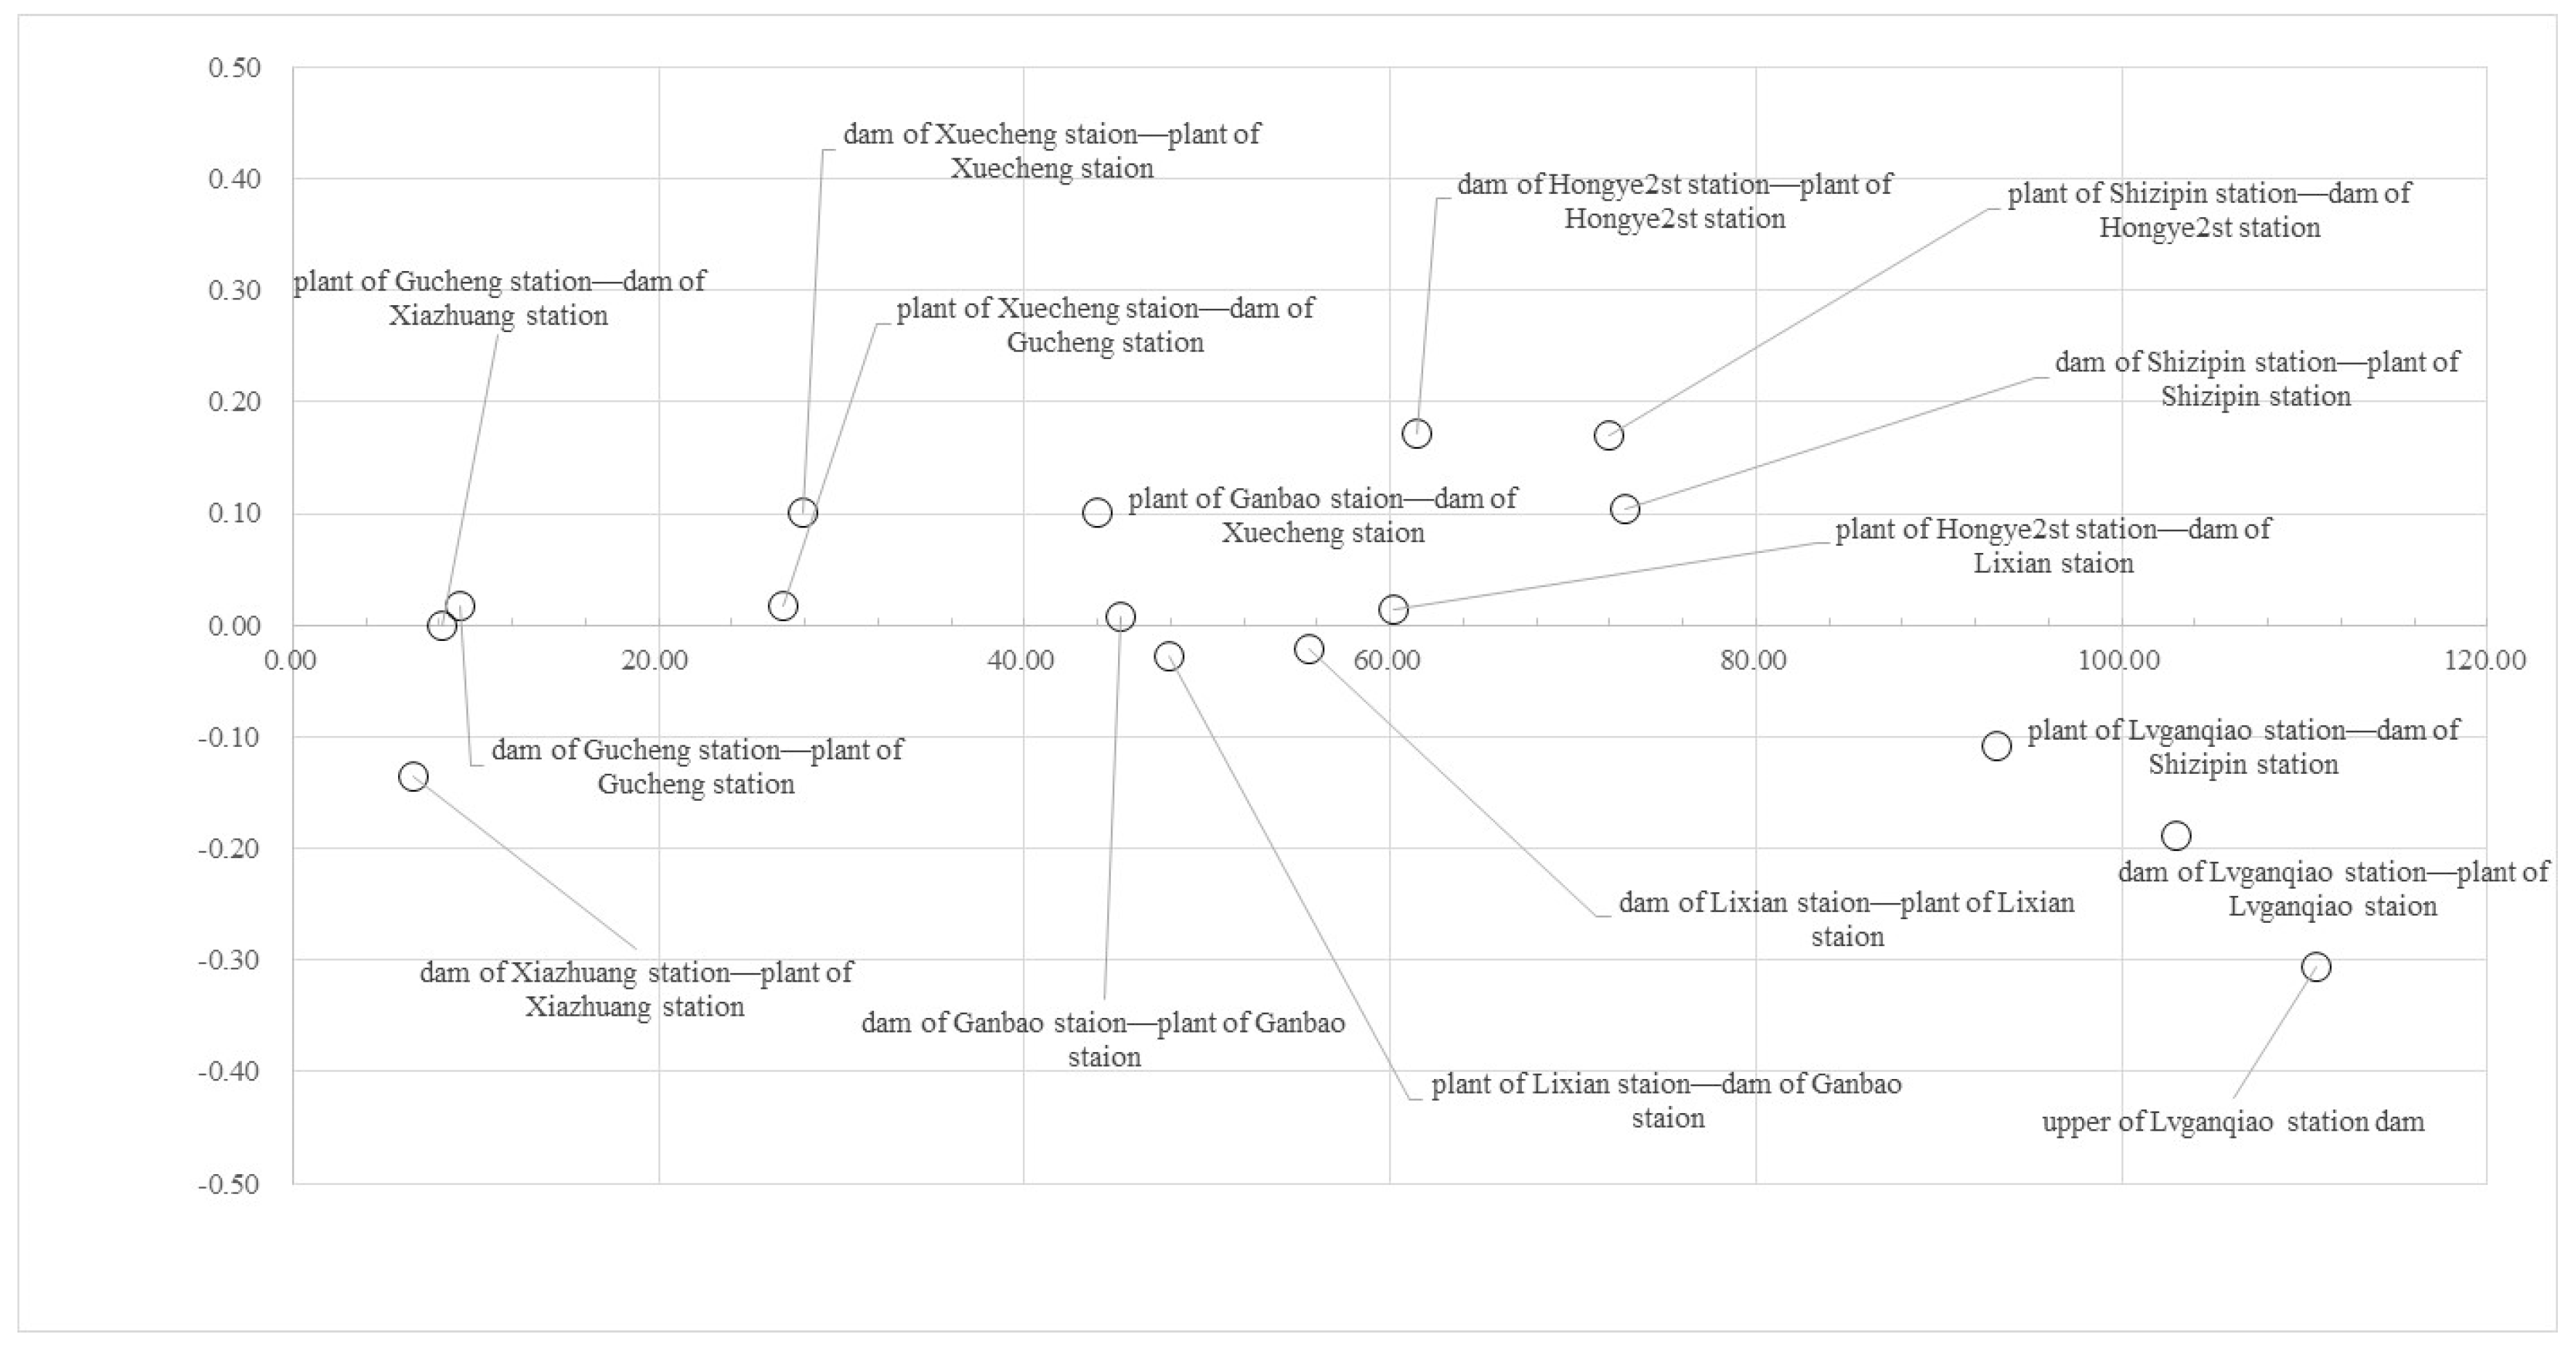
Figure 11.
Tradeoff analysis based on flow control. We set 2015 as a baseline. The cascade development of the river basin was completed that year. Hydropower services have reached their maximum. Hydropower service and RVLS under the six scenarios of M1–M6 are plotted with a radar chart. Since each power station of M1–M5 reduces the flow rate of the same ratio, the flow rate is a linear function of the power generation. Therefore, each power station shows a similar change. (a. Luganqiao, b. Shiziping, c. Hongye 2nd, d. Lixian, e. Ganbao, f. Xuecheng, g. Gucheng, h. Xiazhuang, i. Weizhou).

Table 1.
Reduction of inflow for each power plants in scenarios.
| Power Station | Scenario | |||||
|---|---|---|---|---|---|---|
| M1 | M2 | M3 | M4 | M5 | M6 | |
| Lvganqiao | 10 | 20 | 30 | 40 | 50 | 40 |
| Shiziping | 10 | 20 | 30 | 40 | 50 | 20 |
| Hongye 2nd | 10 | 20 | 30 | 40 | 50 | 40 |
| Lixian | 10 | 20 | 30 | 40 | 50 | 50 |
| Ganbao | 10 | 20 | 30 | 40 | 50 | 10 |
| Xuecheng | 10 | 20 | 30 | 40 | 50 | 30 |
| Gucheng | 10 | 20 | 30 | 40 | 50 | 30 |
| Xiazhuang | 10 | 20 | 30 | 40 | 50 | 20 |
| Weizhou | 10 | 20 | 30 | 40 | 50 | 30 |
Table 2.
Water use efficiency of power stations.
| No | Station | Annual Production (RMB Million Yuan) | Annual Flow Extracted (108 m3) | Efficiency (Yuan/m3) | Rank |
|---|---|---|---|---|---|
| 1 | Luganqiao | 37.47 | 5.25 | 0.07 | 5 |
| 2 | Shiziping | 238.46 | 9.22 | 0.26 | 1 |
| 3 | Hongye 2nd | 134.21 | 13.66 | 0.10 | 2 |
| 4 | Lixian | 51.84 | 16.46 | 0.03 | 8 |
| 5 | Ganbao | 59.04 | 10.59 | 0.06 | 6 |
| 6 | Xuecheng | 167.04 | 17.13 | 0.10 | 3 |
| 7 | Gucheng | 218.88 | 27.58 | 0.08 | 4 |
| 8 | Xiazhuang | 37.78 | 26.96 | 0.01 | 9 |
| 9 | Weizhou | 95.27 | 29.14 | 0.03 | 7 |
© 2019 by the authors. Licensee MDPI, Basel, Switzerland. This article is an open access article distributed under the terms and conditions of the Creative Commons Attribution (CC BY) license (http://creativecommons.org/licenses/by/4.0/).
Share and Cite
MDPI and ACS Style
Fu, B.; Li, N. Tradeoff between Hydropower and River Visual Landscape Services in Mountainous Areas. Sustainability 2019, 11, 5509. https://doi.org/10.3390/su11195509
AMA Style
Fu B, Li N. Tradeoff between Hydropower and River Visual Landscape Services in Mountainous Areas. Sustainability. 2019; 11(19):5509. https://doi.org/10.3390/su11195509
Chicago/Turabian StyleFu, Bin, and Naiwen Li. 2019. "Tradeoff between Hydropower and River Visual Landscape Services in Mountainous Areas" Sustainability 11, no. 19: 5509. https://doi.org/10.3390/su11195509
Note that from the first issue of 2016, this journal uses article numbers instead of page numbers. See further details here.