Collection of Solid Waste in Municipal Areas: Urban Logistics


1
Facultad de Ingenieria Mecanica y Electrica, Universidad Autonoma de Nuevo Leon, Ciudad Universitaria, San Nicolas de los Garza, Nuevo Leon 66455, Mexico
2
Universidad Panamericana. Facultad de Ingenieria. Alvaro del Portillo 49, Zapopan, Jalisco 45010, Mexico
*
Authors to whom correspondence should be addressed.
Sustainability 2019, 11(19), 5442; https://doi.org/10.3390/su11195442
Submission received: 29 August 2019
/
Revised: 18 September 2019
/
Accepted: 23 September 2019
/
Published: 1 October 2019
(This article belongs to the Special Issue Tools, Methodologies and Techniques Applied to Sustainable Supply Chains)
Abstract
:A sustainable process satisfies the current needs without compromising the ability of future generations to satisfy their own needs; that is, it must have a triple impact (sustainability): social, economic, and environmental. In México, there are several services that the government must provide to society for its proper development, for example, the collection of solid waste. Urban logistics include all the processes and operations that provide a service to the community, such as water, safety, health, waste collection, etc., providing the service with the lowest possible cost (economic, social, and environmental) that contributes to the sustainability of the city. Due to the accelerated growth of the world population, several environmental problems have arisen, among them, the generation of solid waste in important quantities; their proper management is relevant for adequate development of the population. The collection of solid waste in municipal areas aims to grant green spaces and recreation areas for the citizens. Although an outstanding effort has been made by the government to provide an adequate service, there are still gaps in the application of correct tools that guarantee efficiency in operations and continuity in services. This article presents a proposal to improve the planning of the design of territories for the cleaning, weeding, and collection of solid waste in municipal areas, using two MILP (Mixed Integer Linear Programming) models. The main contribution of the adaptation of this model is the application to the weeding and waste collection service municipality of the Monterrey Metropolitan Area, which considers important factors among which are the amount of waste, frequency, and service coverage.
1. Introduction
In Mexico, the government is responsible for urban solid waste management (USWM) and the cleanup of green and public spaces. This activity is very important for cities; however, it has become a difficult task to perform as this service has very limited funds.
In the last few years, the term Urban Logistics have come to play [1], referring to the activities that provide a service to the community, such as water, safety, health and waste collection, and green spaces weeding, at the lowest possible cost (having economical, social, and environment impact) in order to contribute to a sustainable city. Also Taniguchi et al. [2], Winkenbach et al. [3], Macário et al. [4], and Villamizar et al. [5] mention that it covers multiple objectives. These types of activities also have a positive impact on the city’s industrial supply chains.
The increasing traffic congestion and the need for preserving the environment (CO reduction), make USWM an area opportunity to achieve an economic, social, and environmental impact by reducing urban transport using adequate collection techniques [6,7,8]. The need to control the damage to the population and the environment transforms waste collection in a public and private matter. Therefore, this leads to the need for developing solutions, mainly focused on the administration, collection, and disposal of waste.
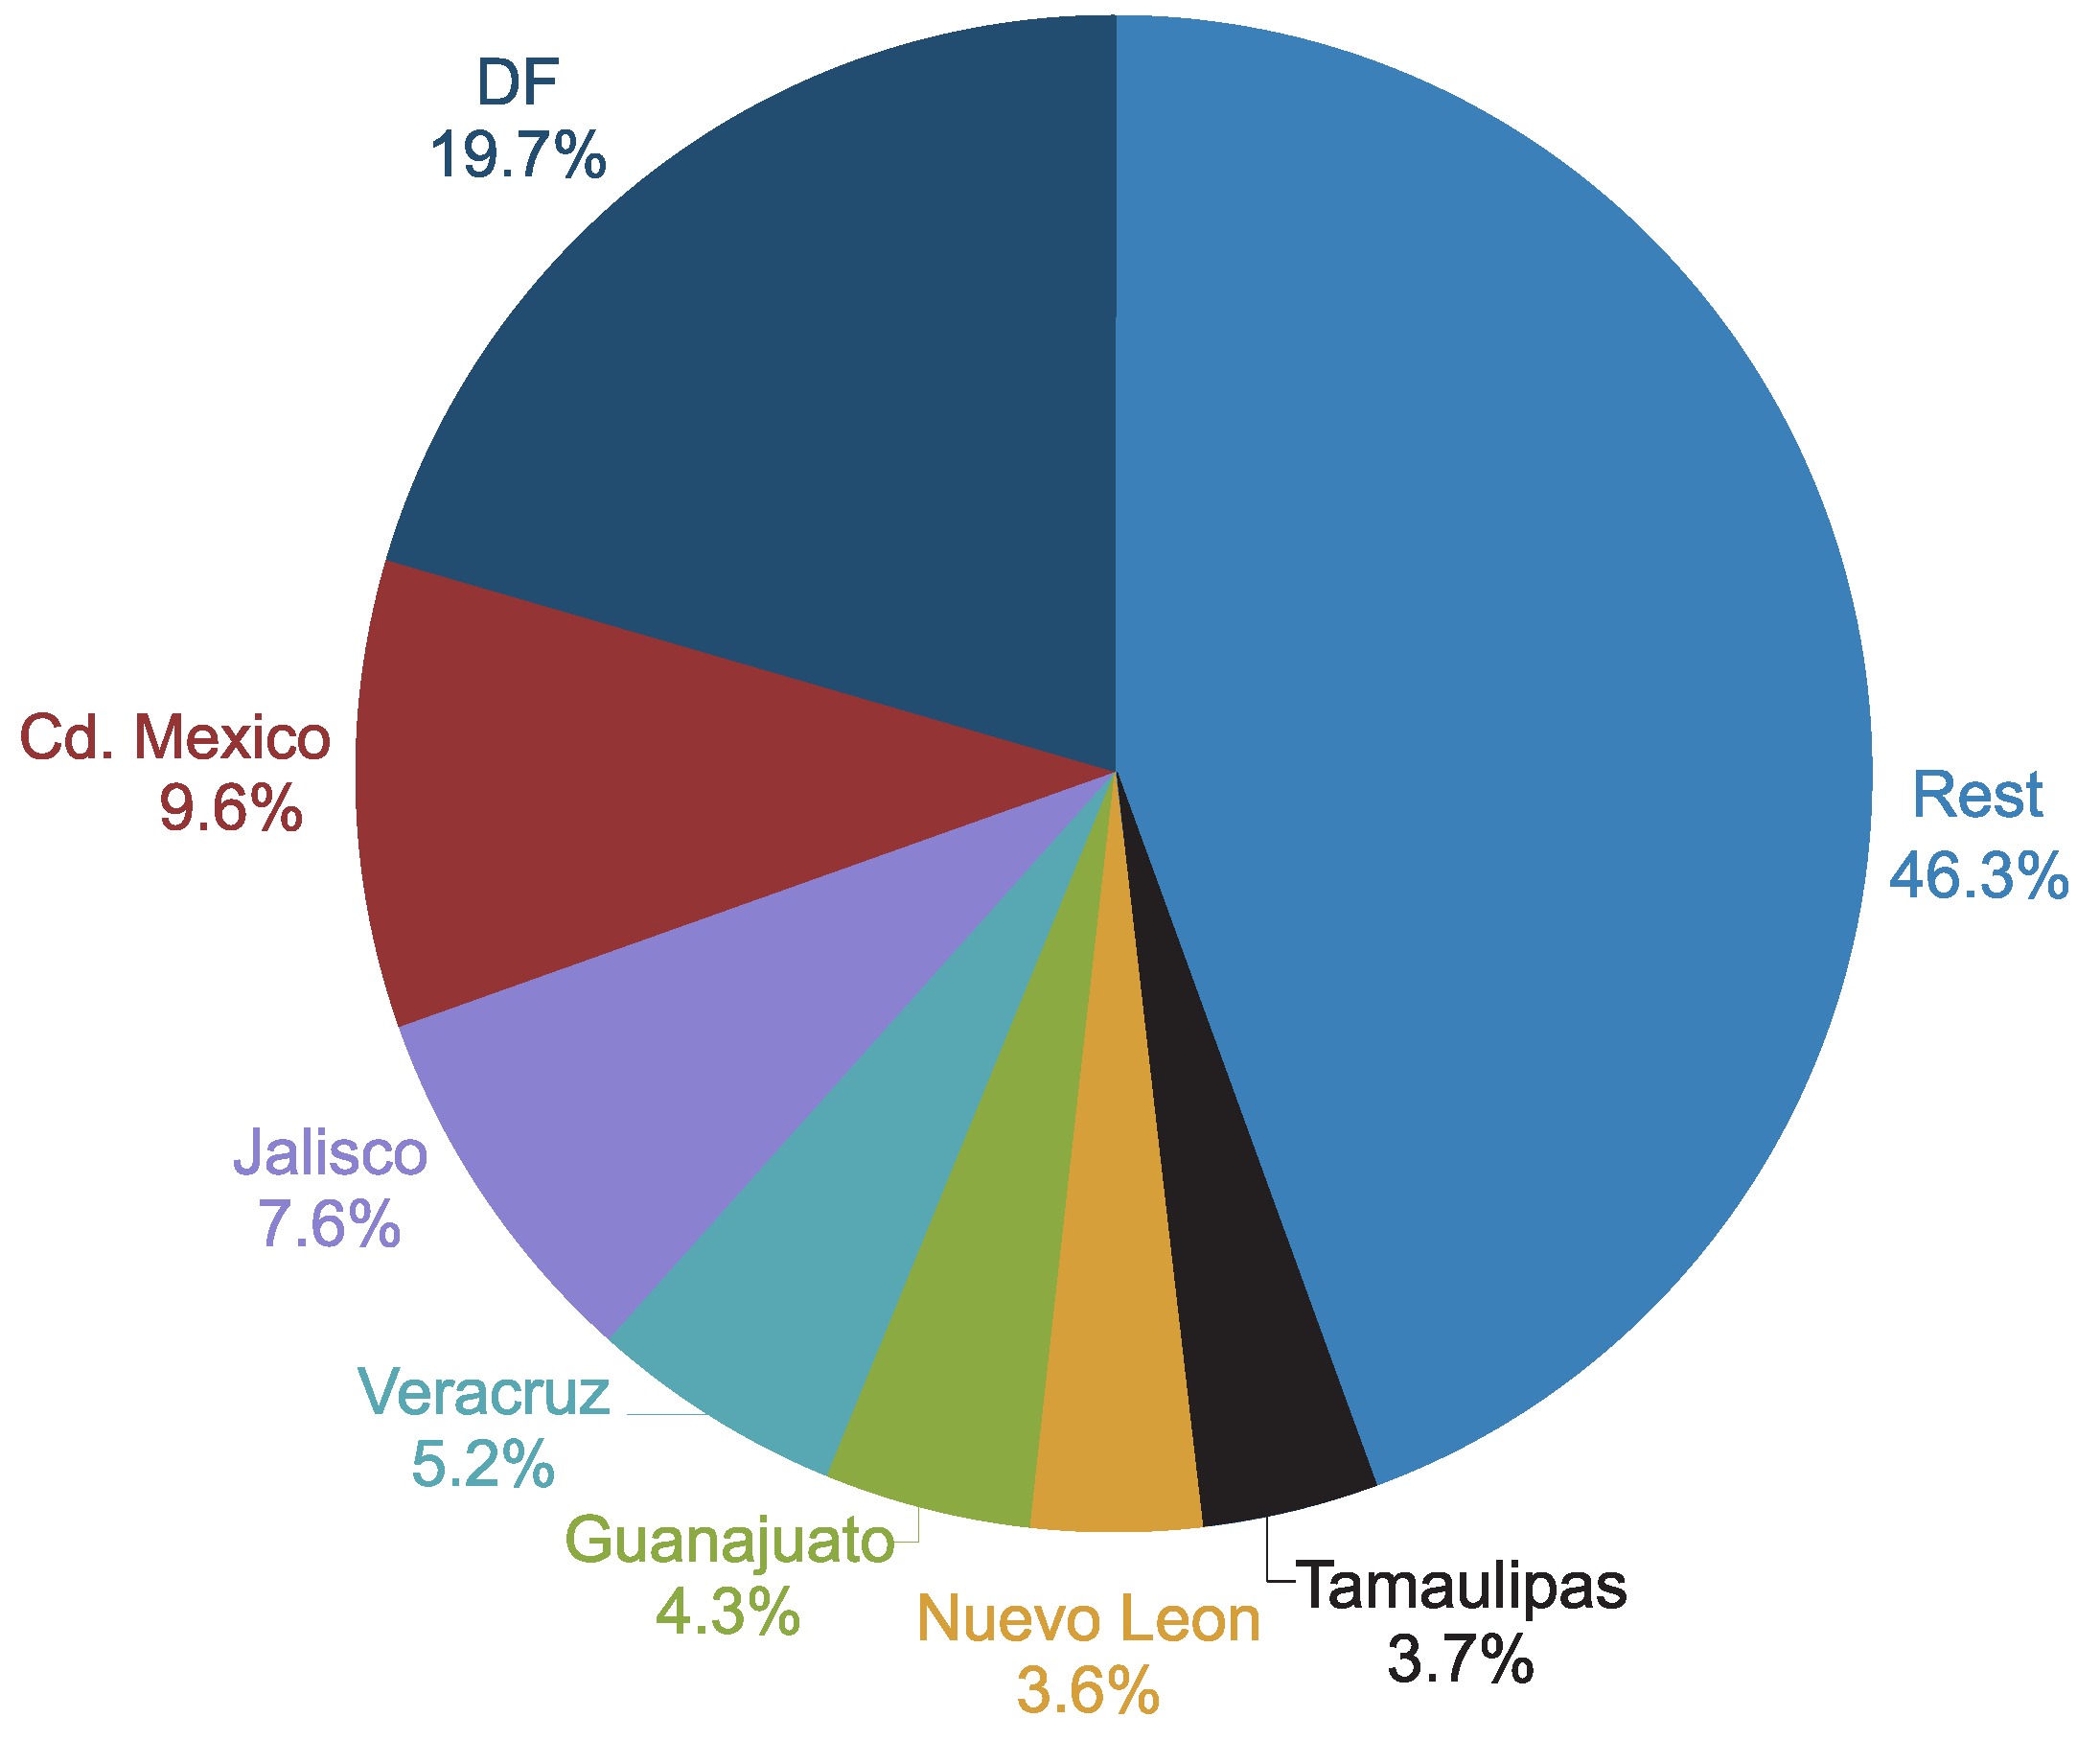
According to official data from 2014 INEGI [9], in Mexico, 102,887,315 kg of garbage is collected daily throughout the country, that is, 0.86 kg of waste per person per day; thus, everyday, a person generates approximately one kilogram of garbage. Figure 1 shows the total generation of solid waste per state in Mexico. Nuevo Leon represents the 3.6% that is equivalent to 4,037,198 kg.
The total generation of solid urban waste is a relevant variable that allows us to determine the public policies of an adequate tool to manage and dispose of that waste [10].
The purpose of this work is focused on solid-waste collection in green spaces of the Monterrey Metropolitan Area. Currently, this activity is the municipality government’s responsibility and they have done it through empirical knowledge [11], usually outsourcing these services; therefore, it is important to propose tools to support decision-making that helps to design and plan waste collection.
Two classifications of vehicle routing design exist: macro-routing and micro-routing [12]. Macro-routing is the allocation of collection vehicles to various areas of the city to perform the collection, and micro-routing is the specific route that must be met by daily collection vehicles in the areas of population where they have been assigned.
However, the basic objective is to create preferably balanced territories, that is, similar in size to one or more of these criteria. In the case of space constraints, there is a basic set of conditions present in most applications that force the creation of contiguous, connected, and compact areas.
The present work develops two macro-routing mathematical models based on the design of territories for the collection of solid waste in the Monterrey Metropolitan Area.
In the next section, a brief description of the concepts related to this activity can be found: reverse and urban logistics, and solid waste management. In Section 3, we present a case study and the main contribution of this work: two mathematical models. We finish with the results, analysis, and conclusions.
2. Literature Review
This section presents the literature analysis focusing on two concepts very much related to solid waste collection and management: solid waste management and reverse logistics.
2.1. Reverse Logistics
Reverse logistics is a recent concept that refers to the most effective and economic upstream material flow and merchandise return to the supply chain and to the retrieval of products that were already used for their main purpose [13]. This concept emerged at the end of the 20th century in developed countries by doing recycling processes [14] as a key activity for waste management. In countries with a higher income, one-third of the waste could be retrieved, whereas those with a lower income only retrieved 4% [15]. In most cases, it is expected to generate income or to manage waste.
Such is the case of Uriarte-Miranda et al. [16], where strategies for waste tire management become important due to its economic, social, and environmental impacts. This article shows a reverse logistics model for the waste tire management systems in México and Russia (two specific processes: remanufacturing and diversification) so that it is affordable and sustainable. Hage et al. [17] presented a study about waste recycling (plastic, glass, paper, and metal) that demonstrates that, if a container is located adequately, the probability for recycling increases by 28%. Something similar is proposed by Castillo et al. [18] and applied in Spain.
In the cases of Chang and Wei [19], Gautam and Kumar [20], and Alonso [21], they use optimization models focused on waste or container retrieval for their later recycling.
As could be observed in reverse logistics, it is a sustainable process, as it considers the triple helix: society, economy, and environment. In the presented application as the contribution of this work, whilst it does not consider an economical remuneration as such, it takes it into account due to the cost reduction that it implies, as well as the social impact, as it is a service that improves the quality of life for citizens and the environmental impact related to the solid waste management in green spaces.
Below, we present the works of which the main focus is on urban logistics, that is, those where the main application is on social good.
2.2. Municipal Solid Waste (MSW Collection)
Generally the macro-routing problem is solved by design territories, whilst micro-routing employs mathematical models like Vehicle Routing Problem (VRP) and Travel Salesman Problem (TSP) [22,23,24] or uses computational tools and Geographic Information Systems (GIS) [25,26] to minimize the route collection time.
Design territories is a mixed-integer linear programming that consists of grouping small geographical areas, called areas, in larger geographic groupings, called territories, so that the latter are acceptable according to certain criteria. There is a classification according to the context of the problem proposed by Moreno [27]; these criteria may have economic reasons related to the average potential sales [28,29], areas of use of services and equipment located in a fixed location [30], zones for the provision of services at home [31], energy resource receiving areas [32], and political-electoral districts [33,34,35].
Territorial partitioning in different regions or zones is a problem that is presented in various disciplines related to earth and space sciences and has been treated under various denominations such as partitioning, regionalization, zoning, delineation of zones and/or districts, allocation of spatial units, etc. [36].
While most applications are related to the design of territories, there are other applications like the literature review presented by Phuntsho et al. [37] to determine the solid waste collection plan and schedule in the Bhutan municipality or the work presented by Jayakody et al. [38] that presents the findings of a municipal solid waste characterization study with a sample size of 2850 persons, estimating that the average for daily waste-generation rate for a household was kg/cap/day. Also, this paper distinguishes that waste composition and waste management systems play a key role in establishing an integrated sustainable solid waste management system in countries like Sri Lanka. In addition to this, Kaosol [39] presented a study of the composition of waste collected in Thailand (86%), which is mostly organic waste (paper, plastic, glass, and metal). The integrated MSW system has the potential to maximize the useable waste materials as well as to produce energy as a by-product. While we can observe a qualitative approach in these articles, there are others with a quantitative approach such as ours.
For example, Ayantoyinbo and Adepoju [40] analyzed the relationship between waste management logistics and metrics for waste management performance. In this case, transport demand system analysis must come in the form of predictive and prescriptive models, while deterministic models make accurate predictions about a system of interest and probabilistic models entail some elements of uncertainty. Dotoli and Epicoco [7] presented a routing and scheduling vehicle model (i) to determine the optimal routes for HWC (Hazardous Waste Collection), which seeks to find the best trade-off between reduction of traveled distances, maximization of amount of collected waste, and maximization of commercial value of withdrawals and their transportation to the disposal site and (ii) to assign the obtained routes to the available fleet. Similar to this work, Buhrkal et al. [8] studied the Waste Collection Vehicle Routing Problem with Time Windows (WCVRPTW), where the problem consists of routing vehicles to collect customers waste within a given time window while minimizing travel costs. Laureri et al. [41] presented a mathematical model based on a Genoa Municipality case study and contemplates various kind of objectives and constraints, making the collection a complex task involving many actors (citizens, politicians, and technical personnel), technological expertise, and investments since it uses WSM concerning the protection of the environment and conservation of natural resources.
Finally, the case study of Son and Louati [42] developed an effective vehicle routing model that optimizes the total traveling distance of vehicles for MSW collection in Danang City (Vietnam) considering the environmental emissions; the investment cost; and the available node structures, vehicles, and parameters in a generalized context. Moreover, in Das and Bhattacharyya [43], MSW management systems suffer by the high collection and transportation cost, where typically, collection cost represents 80–90% and 50–80% of municipal solid waste management budget in low income and middle-income countries. Proposed heuristic solutions reduce more than 30% of the total waste collection path length (100 source points, 65 waste collection centers, and 50 transfer stations).
Considering the literature review and the lack of a defined algorithm or model for the design of macro-routing for cleaning and solid waste collection in municipal areas, the problem consists of the optimal grouping of green spaces in the Monterrey Metropolitan Area, so that territories are balanced regarding the workload of each provider and the coverage of the collection service. These two fundamental aspects are not currently in the planning service.
As a consequence of this fact, our proposal consists of improving the territorial design planning of the current collection service through the adaptation of a mathematical model of territory design for cleaning and solid waste collection in the municipal areas and considers the criteria of spatial integrity, homogeneity, contiguity, and compactness.
It is important to mention that the objects to be grouped are parks of the municipality of San Nicolas de los Garza, but due to a large number of parks, a first grouping has been done to reduce the scale of the problem and to simplify the solution. Thus, we then applied model 1 where we group the districts established by the municipality and model 2 to group the parks; both models are similar, and each one is described below.
3. Case Study: San Nicolas De Los Garza
The Monterrey Metropolitan Area is formed by nine municipalities of the state of Nuevo Leon (which work in a similar way in terms of the operation of primary services, so the proposal for this project is replicable to the others) and constitutes the third most populated conurbation of the Mexican Republic, according to the most recent count and official delimitation carried out in 2010; together with the Instituto Nacional de Estadistica y Geografia, the Consejo Nacional de Poblacion, and the Secretaria de Desarrollo Social del Gobierno Federal, there are a total of 4,080,329 people in an area of 6680 (km). In the area of economic development, it holds the second place at the national level, only after Mexico City, the capital of Mexico.
We focus on the solid waste collection municipal areas. Most of the waste composition is grass; trees; and in minimum proportion, nonorganic products. The amount of waste collected is proportional to the dimension of the green spaces (see Table 1). It is worth mentioning that this process will be performed every 2 weeks in autumn or every 3 weeks in summer, depending on weather conditions. Because of the rain, its growth is faster as is the proliferation of mosquitoes. Besides that, the municipality has already standardized the carry out time, so we do not need to contemplate it in the models.
In this complex metropolitan frame stands the municipality of San Nicolas de los Garza, located geographically in the North of Monterrey, with important industrial, commercial, and housing areas, in which there is a constant evolution and physical transformation. San Nicolas is the second largest, at the national level, in terms of economic development, only behind Mexico City, the capital of the country [44].
We chose to apply this mathematical model in the municipality of San Nicolas because it plays a fundamental role in the Monterrey Metropolitan Area. It is considered the sixth municipality at the national level in terms of the Human Development Index and the tenth in the National highest income index [45]. Therefore, it is extremely important to provide citizens with an excellent level of quality of life, which involves factors ranging from health, housing, transportation, education, and wealth to natural conditions; hence, it is important to have green spaces in a good state. On the other hand, considering the physical conditions of San Nicolas, geographically, it is a regular municipality which facilitates the design of the territories.
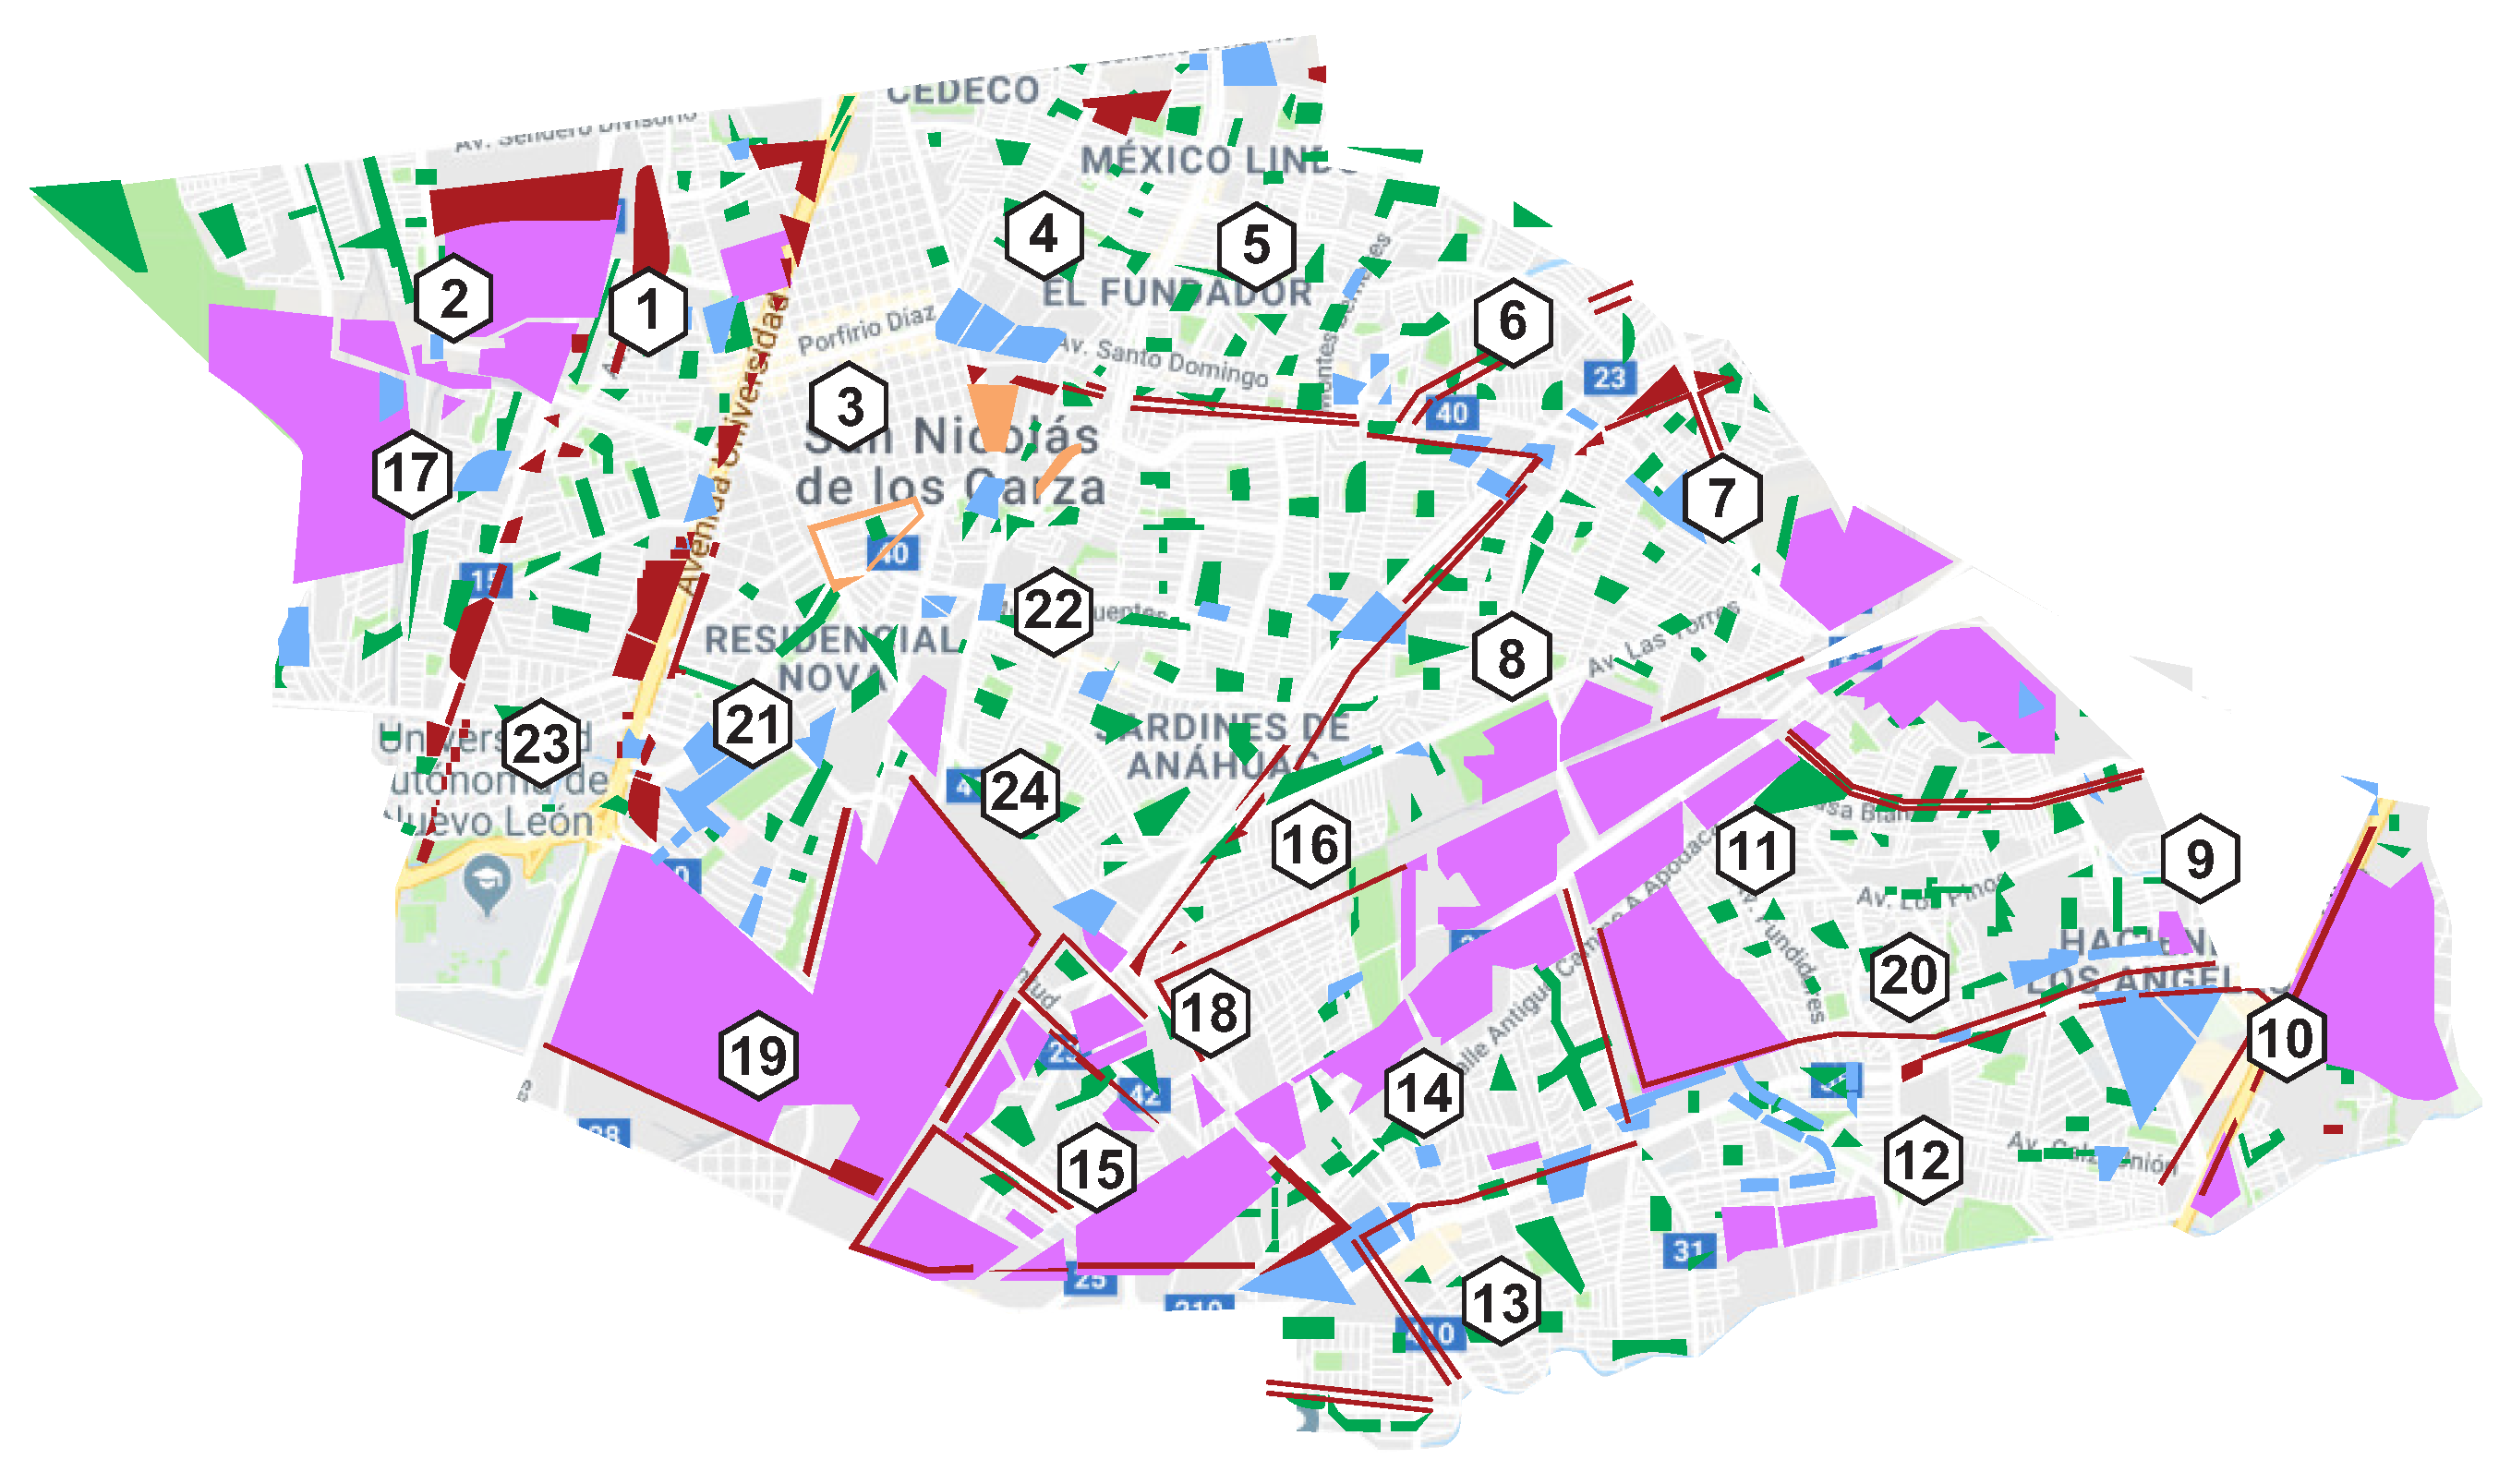
San Nicolas has 24 districts which consist of strategic territorial delimitations that enjoy homogeneity in their land uses and enjoy regional and primary equipment for the service of their neighborhoods and, in some cases, the municipality. Figure 2 shows the districts, and Table 1 presents the number of parks in each district and the measure of activity.
3.1. Model 1
Some municipalities in the Monterrey Metropolitan Area have zoning consisting of areas that integrate and delimit a population center; their predominant uses, reserves, and destinations; as well as the delimitation of areas of conservation, improvement, and growth.
The use of this model is to determine the optimal grouping of the zones established by a municipality of the Monterrey Metropolitan Area to reduce the scale of the problem due to the great number of parks that the municipality has.
The following assumptions are considered: each basic area (districts) must be assigned to a single territory, the quantity of territories is known, and it is determined based on the number of service providers (8) employed by the municipality. Only these providers are eligible and authorized, and the measure of activity is determined by the number of square meters that makes up each of the parks since it is directly related to the amount of waste generated.
Consider model 1 displayed in Equations (1)–(10), where I is the set of basic areas (districts); J the set of centers of territories; p the number of territories; and i and j are basic areas index (where i ∈ I y j ∈ J). The parameters of the model are as follows: is the measure of the activity; is the average of the size of territories; and is the adjacency matrix, where 1 if the districts are adjacent and 0 otherwise. The continuous variables are defined as follows: for the greatest measure of activity of the territories formed; for the least measure of activity of the territories formed, and for the measure of activity of the territory j. Binary decision variables are defined as = 1 if the basic area j is a center, otherwise, if the basic area i is assigned to the center j, and otherwise.
Model 1
The objective function in Equation (1) minimizes the difference between the territory with the greatest measure of activity and the territory with the least measure of activity with the idea of forming balanced territories, and in this way, the workload of each service provider is balanced. The restriction in Equation (2) determines the measure of activity of each territory. The inequality of Equation (3) establishes the territory with the greatest measure of activity, while Equation (4) has the least activity. In the restriction of Equation (5), it is sought that the number of fictitious centers installed equals the number of territories; on the other hand, Equation (6) forces all districts to be assigned to a single center. The inequality of Equation (7) ensures contiguity between districts. The restriction of Equation (8) states if a district is a center of territory within the territory. Finally, in Equations (9) and (10), the nature of the variables is defined.
3.2. Model 2
The use of this model is to determine the optimal grouping of the parks of a municipality of the Monterrey Metropolitan Area in considering the criteria of planning and the frequency of cleaning and collection of the service. The objective of model 2 is to minimize the total distance of each basic area (park) to its respective center. The idea of the objective function is to obtain figures as compact as possible in the distance direction.
The following assumptions are considered: each basic area (park) must be assigned to a single territory; the number of territories is known and is determined based on the frequency of the provision of cleaning and collection services, in this case, considered 4 weeks; the measure of activity is determined by the number of square meters that makes up each of the parks since it is directly related to the amount of waste generated; the relative tolerance for capacity was considered as a percentage between 5 % and 10 % (because it is the tolerance of a vehicle’s permitted surplus without risking damage to the vehicle and the allowable slack so that use is optimal); and the distances from park to park consider the meaning of the streets.
The sets considered in this model are the same as in model 1, with the difference that, in this case, the basic areas are parks. The parameters are also similar, but in model 2, we consider as the distance between the basic area i and the center of territory j and discard the adjacency matrix. Binary decision variables are defined as if the basic area j is a center, otherwise, if the basic area i is assigned to the center j, and otherwise.
Model 2
The objective function in Equation (11) minimizes the total distance of each basic area to its respective center. The idea of the objective function is to obtain figures as compact as possible in the distance direction. In the restriction of Equation (12), it is sought that the number of fictitious centers installed is equal to the number of territories; on the other hand, Equation (13) prohibits the assignment of a basic area to a non-installed center. Equation (14) forces all the basic areas to be assigned to a single center. The restriction in Equation (15) ensures that a load of each territory is within the lower and upper capacities established. Finally, Equation (16) defines the nature of the variables.
3.3. Other Considerations
In the literature, compliance with all planning criteria simultaneously by exact methods is difficult, so it has resorted to using heuristic and metaheuristic methods. This situation is mainly due to conflicting criteria of balance and contiguity, objectives that are in competition, since the improvement in one of them can cause the deterioration of the other.
In this case, for model 1, the territorial design planning criteria were fulfilled entirely due to the objective function that it has; however, in model 2, it did not meet the criterion of contiguity and compactness. Therefore, we used a methodology to establish this criterion; to apply it, we need the following data: the matrix of distances between the parks, the map with results obtained from GAMS (General Algebraic Modeling System) with CPLEX Optimizer. of model 2, an adjacency matrix of the parks of a territory, and the GAMS results. Table 2 describes the general steps of the proposed algorithm.
It is important to emphasize that, as a consequence of the newly formed territories, the criterion of contiguity and compactness is fulfilled; however, the criterion of balance is violated. It is important to emphasize that, in the literature, the property of contiguity is a priority spatial criterion, so that both solutions will be proposed to the service managers by letting them know that both proposals are in support of their decision-making; the zoning given by model 2 would show a balance of work whereas the proposal by the heuristic shows imbalance but contiguity.
4. Results And Analysis
4.1. Results of Model 1
For both model 1 and model 2, programming tests were performed in GAMS, which is the software used as the basis for solving these models characterized with real data obtained. GAMS was used with CPLEX version 12 and was run in a computer Intel Xeon E5-2697v2 2.7 GHz with 12 cores each, a RAM of 64 Gb, and a hard disk of 1 Tb.
For the proposed model 1, some tests were performed, considering as basic areas the 24 districts that make up the municipality of San Nicolas and considering the size of parks in square meters. Eight territories were established due to the number of service providers that count the municipality, and an adjacency matrix of the districts was constructed.
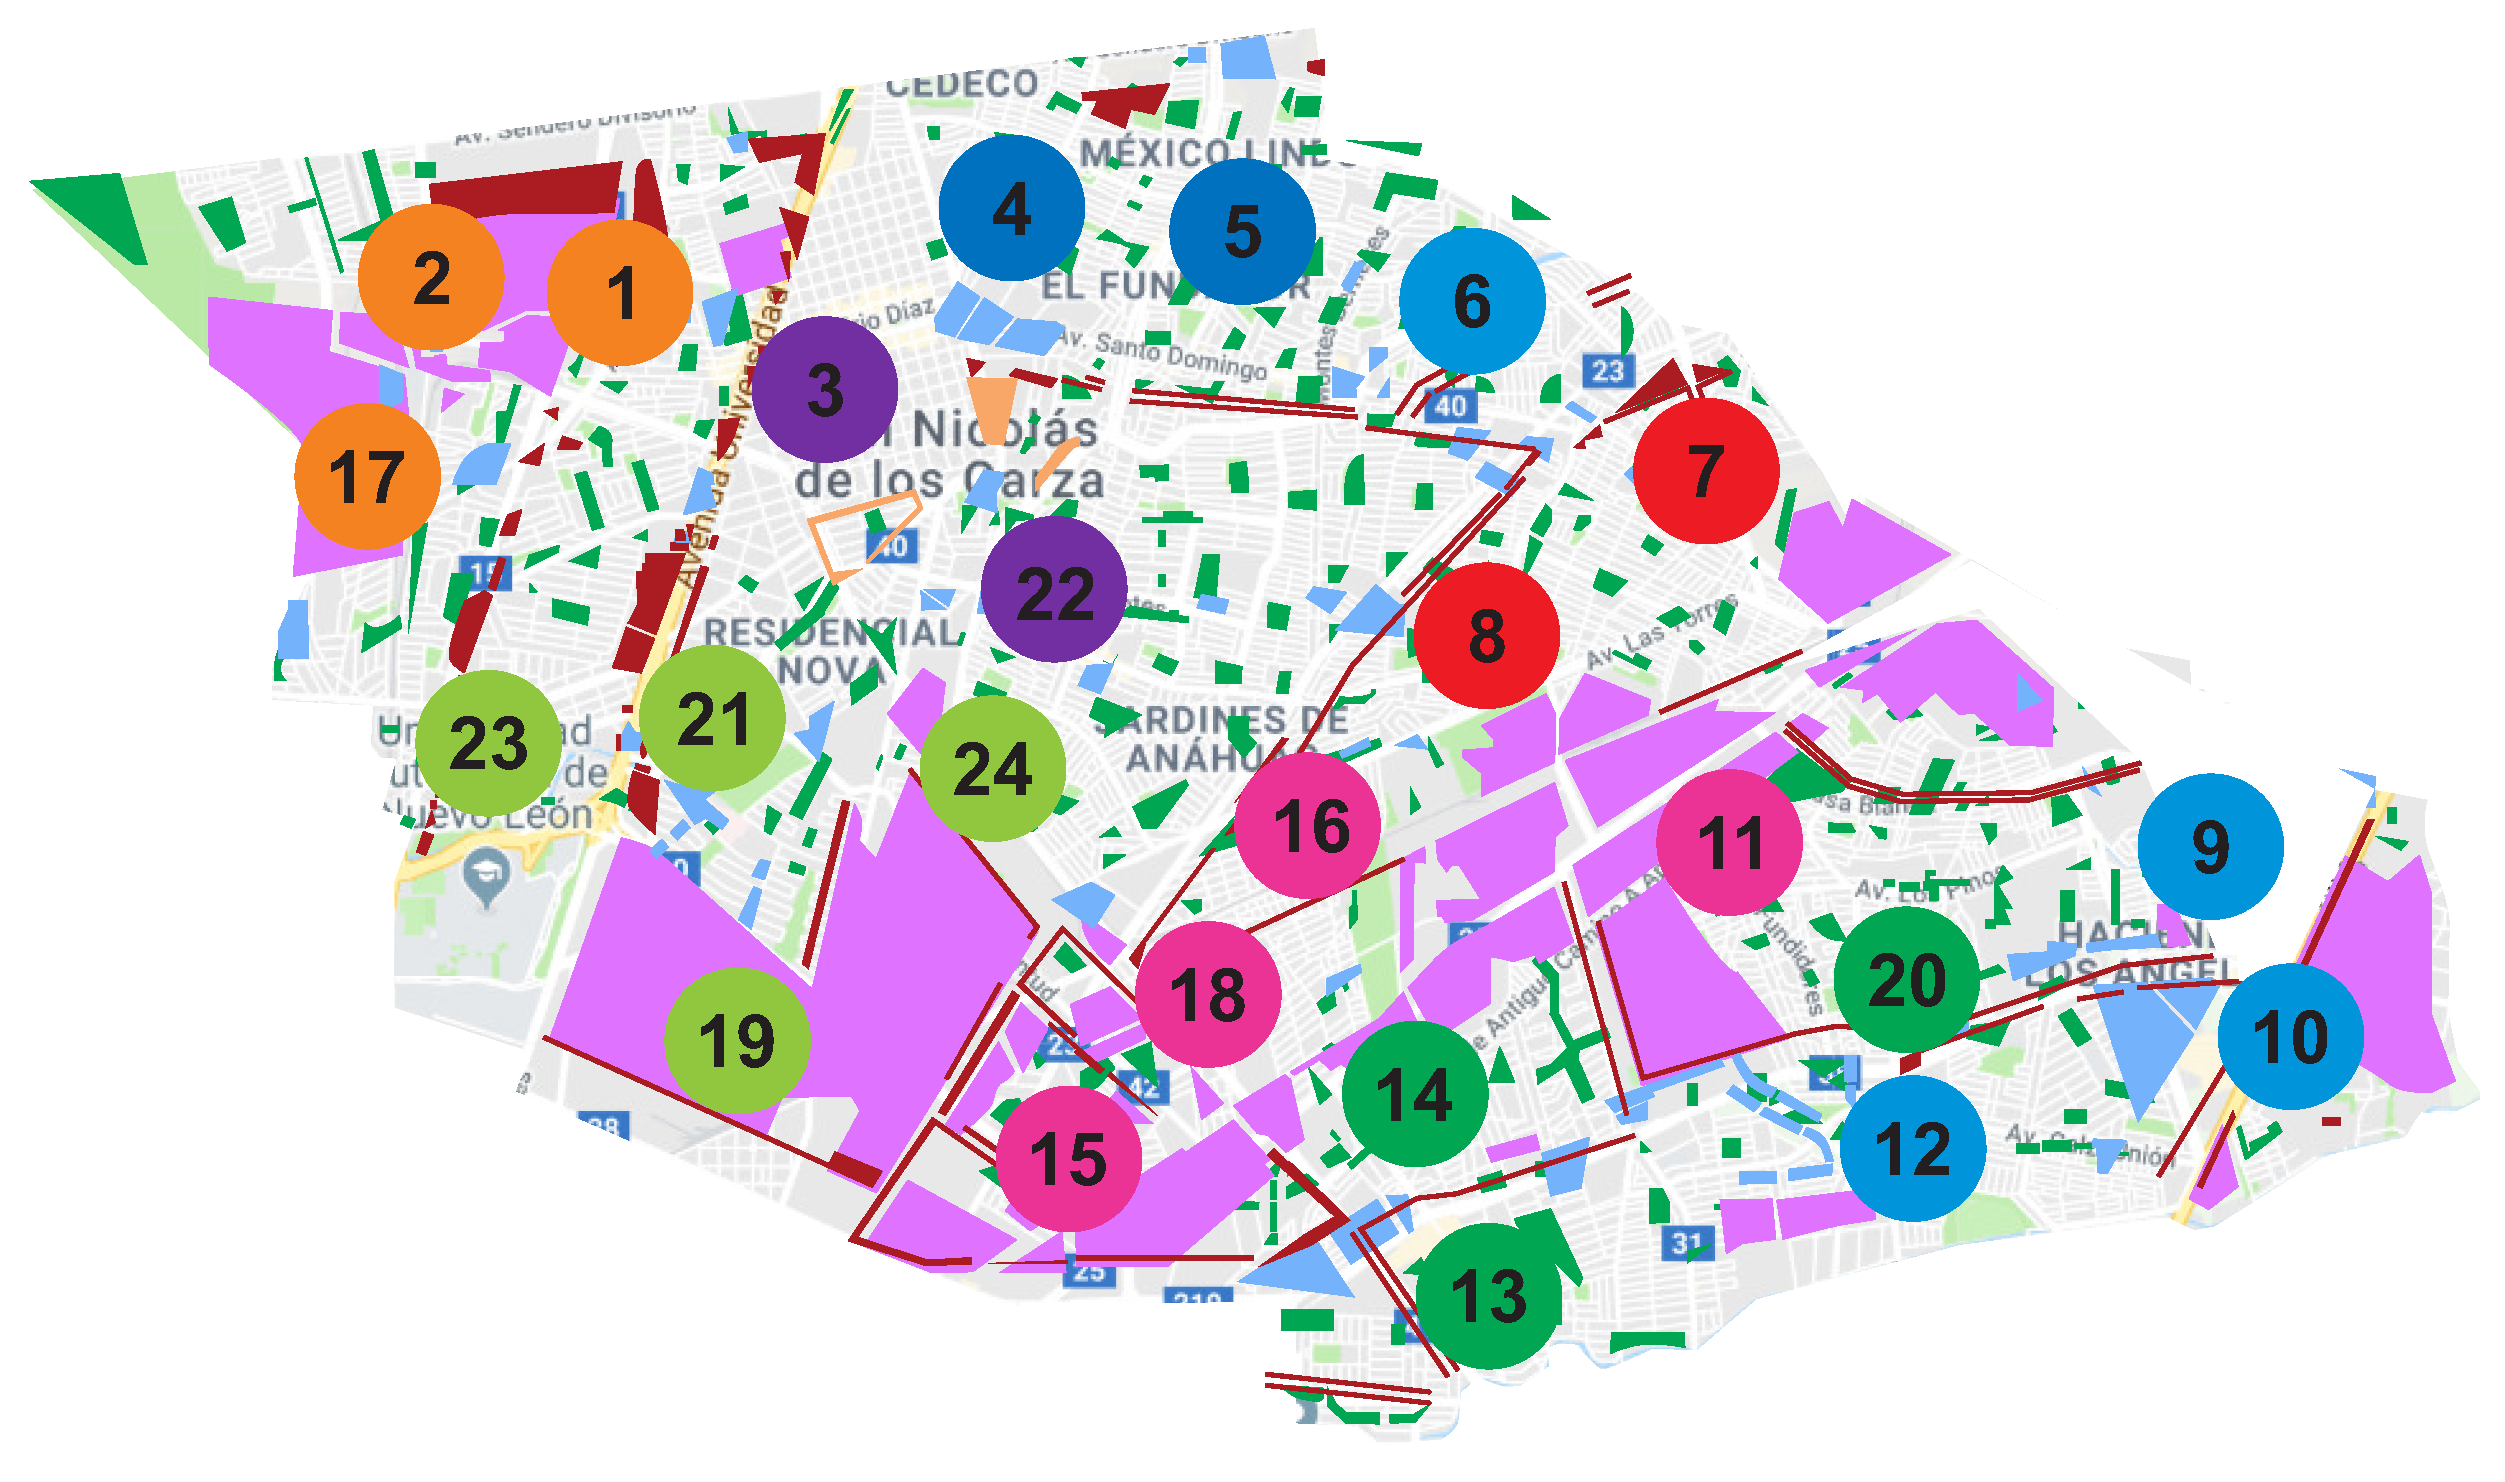
Figure 3 shows the corresponding groupings of model 1; each color indicates a territory, and each territory is assigned to a service provider, for example, the territory formed by the districts 1, 2, and 17 corresponds to provider A, the territory formed by districts 4–6 correspond to provider B, and so forth.
Table 3 shows the allocation of districts to each provider. A notable aspect is to assign the lowest capacity provider to the smallest activity measure and the highest capacity provider to the highest activity measure.
From the obtained results, the following aspects can be emphasized: in the clusters obtained, it is observed in Figure 3 that the districts are contiguous which facilitates the work to the provider in each district because their area of work would be delimited; if perfectly balanced territories were achieved, the average activity measure that would correspond to each service provider would be m. However, because perfectly balanced territories cannot normally be achieved, the idea of the objective function is to create territories that are almost perfectly balanced, minimizing the difference between the values of the territory with the highest activity (provider B) and the least activity (provider A); in this case, a minimum value of 59,426.18 m was obtained. The main purpose of creating balanced territories is to allocate a balanced workload to each supplier because the current imbalance in workloads causes some parks to be unprocessed by provider; it is shown that not necessarily the supplier with more parks has the greater measure of activity and also is not fulfilled in a contrary way. This is because it influences the size of the parks in each district. Finally, it is very important to highlight the coverage of the service, since with this design, all the parks will be assigned to a provider which guarantees the cleanup of all the parks that make up the municipality of San Nicolas de los Garza.
4.2. Results of Model 2
Once the previous design has been obtained for each supplier, it is now necessary to carry out a second grouping because one of the most important factors of cleaning and solid waste collection in parks is the frequency; in this case, it is considered that the cleaning of each of the parks must be held every month, i.e., every 4 weeks.
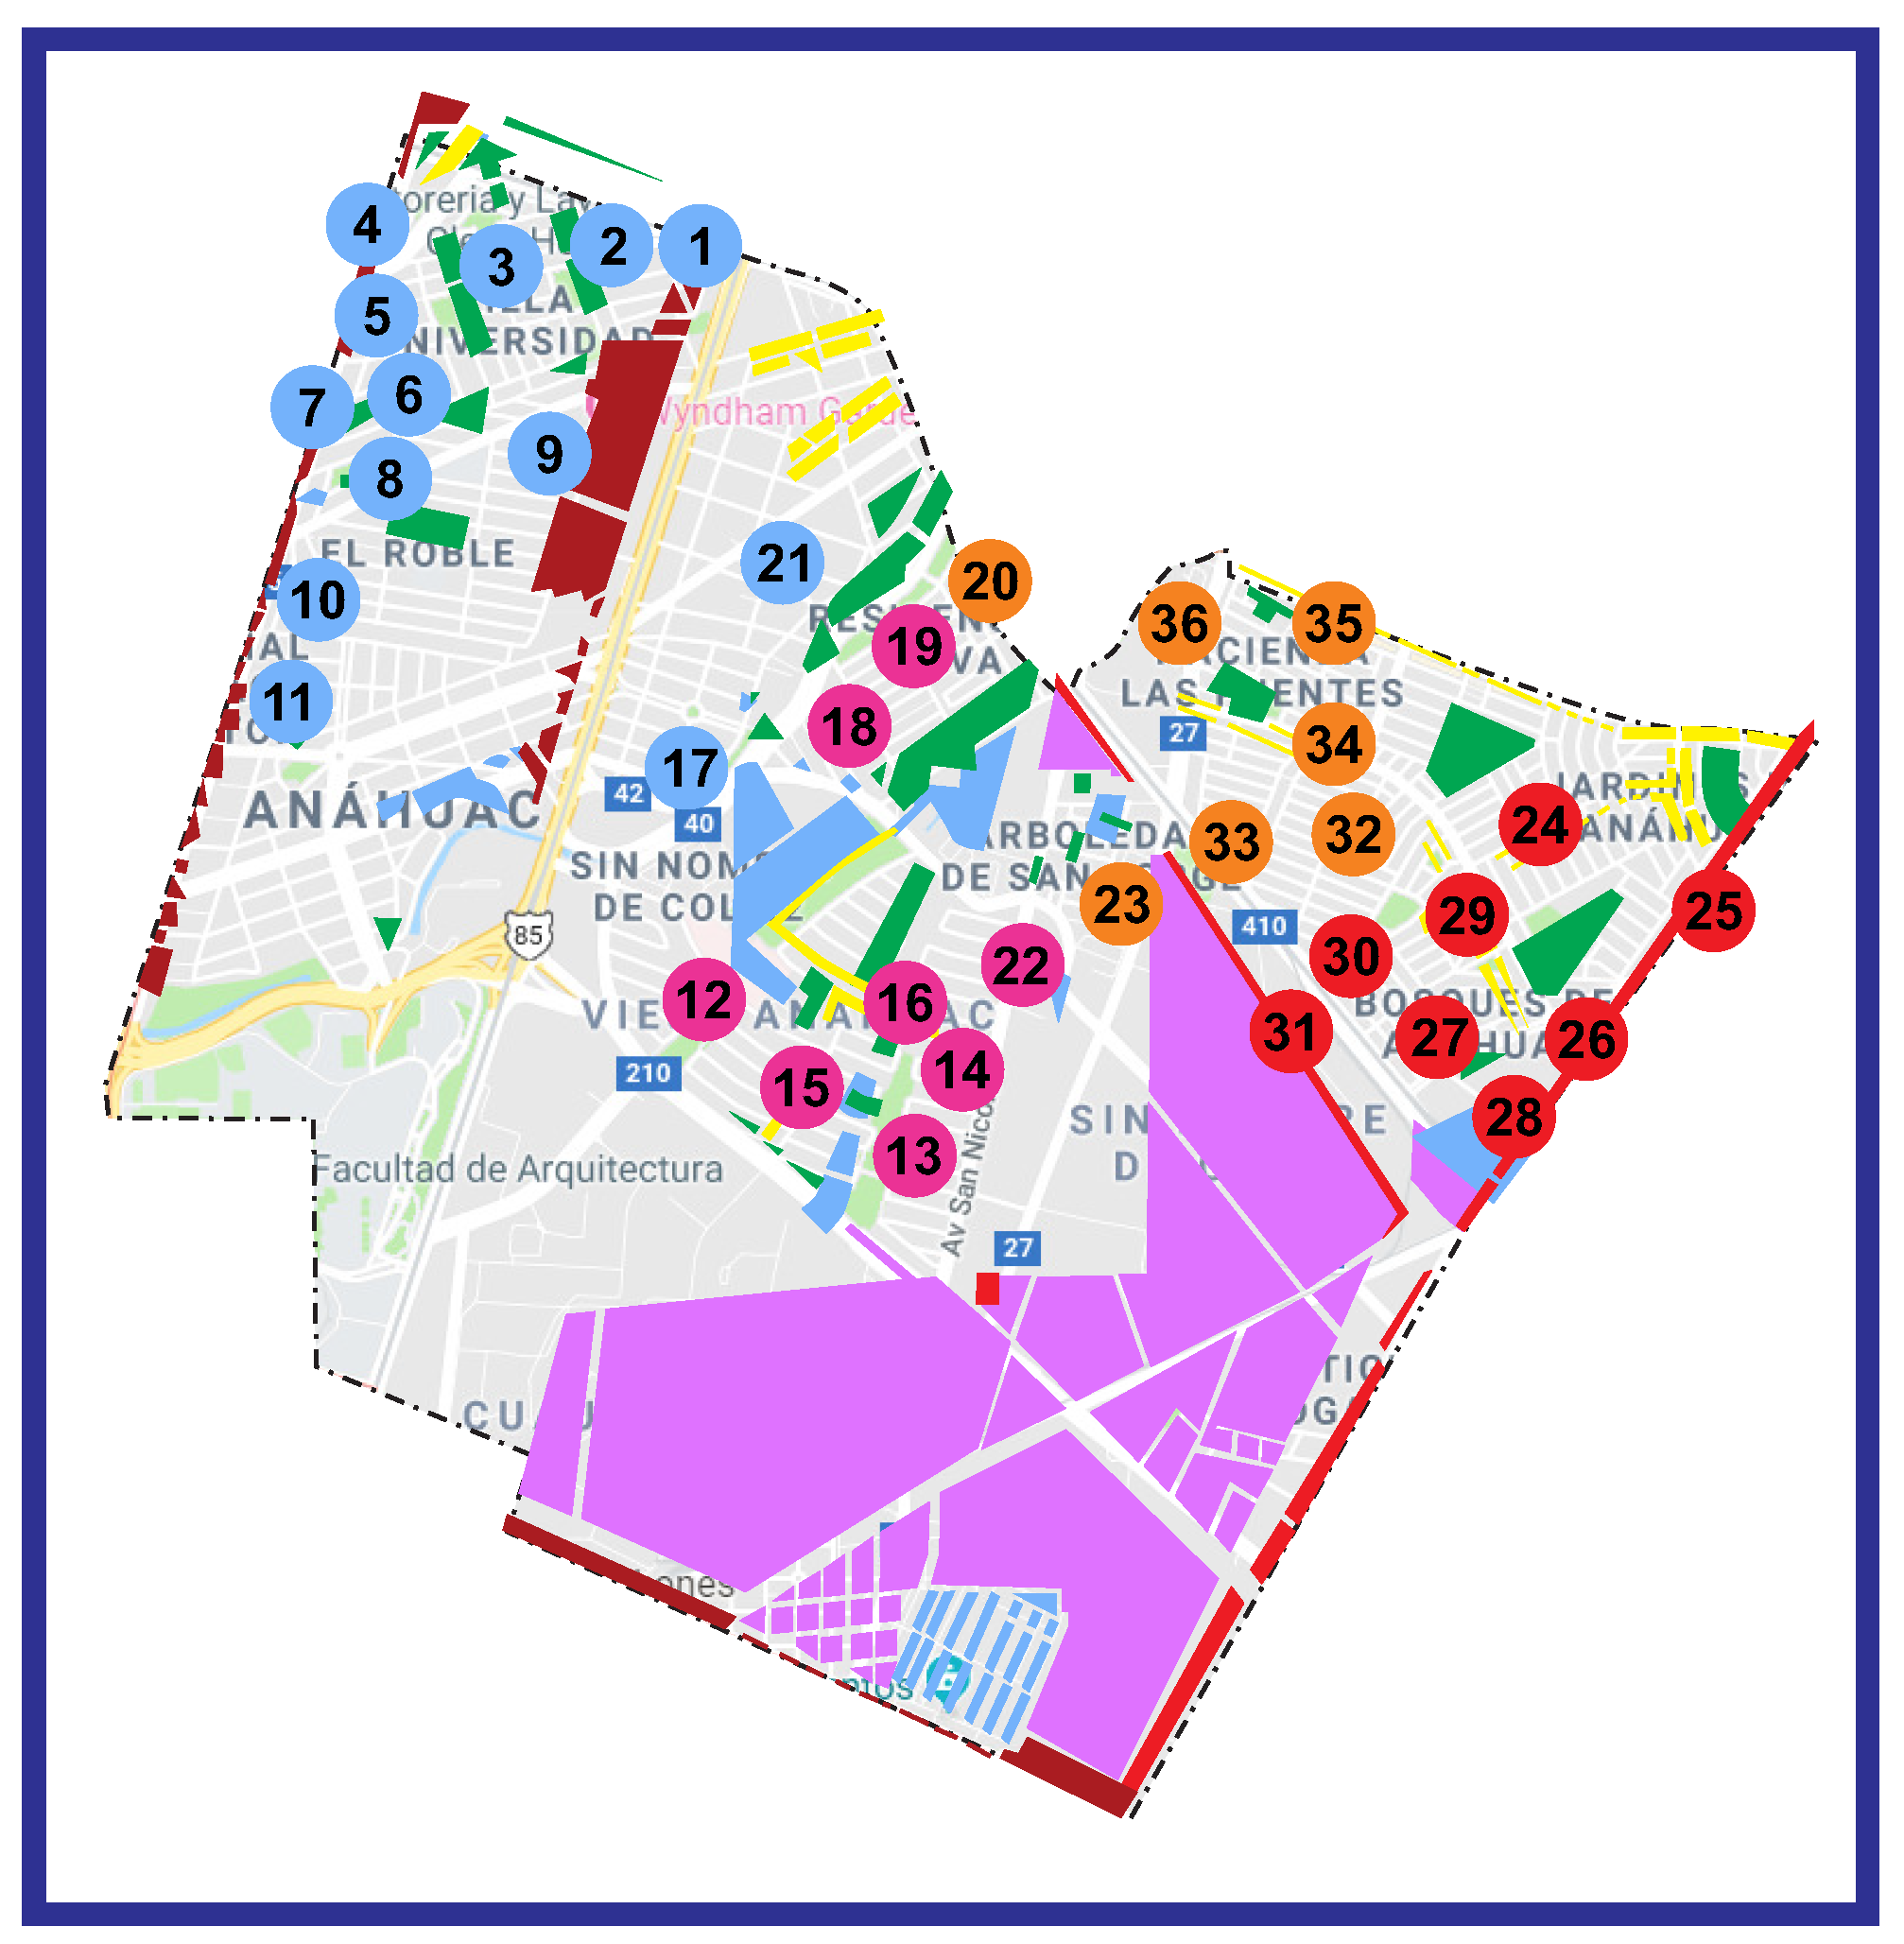
There were 8 runs of model 2, one for each provider, considering the size in m of each park and the distances between each one in meters with a 10% tolerance. The graphic solution for provider D is displayed in Figure 4, where each color represents a territory, so that the parks that make up the blue territory will be weeded on week 1; the parks that form the pink territory will be weeded on week 2; the red territory will be weeded on week 3; and finally, the yellow territory will be weeded on week 4. Table 4 shows the weeks and the number of parks to be weeded in each of them, and the weekly workload (activity measure) is shown.
As an analysis of the previous results, we have the clusters obtained; Figure 4 shows that the parks are contiguous or connected which facilitates the work for the maintenance team, because their work area would be delimited. The workload of each week is balanced; see Table 4. This aligns with the idea that the cleaning and collection takes place in all parks and that the work is equitable every week for the staff; the coverage of the service is fulfilled, since with this design, all the parks will be weeded once a month which guarantees the maintenance of all the parks that make up the municipality of San Nicolas de los Garza. The minimum distance traveled from the parks to the center of territory (central park of the territory) is 28,150 m.
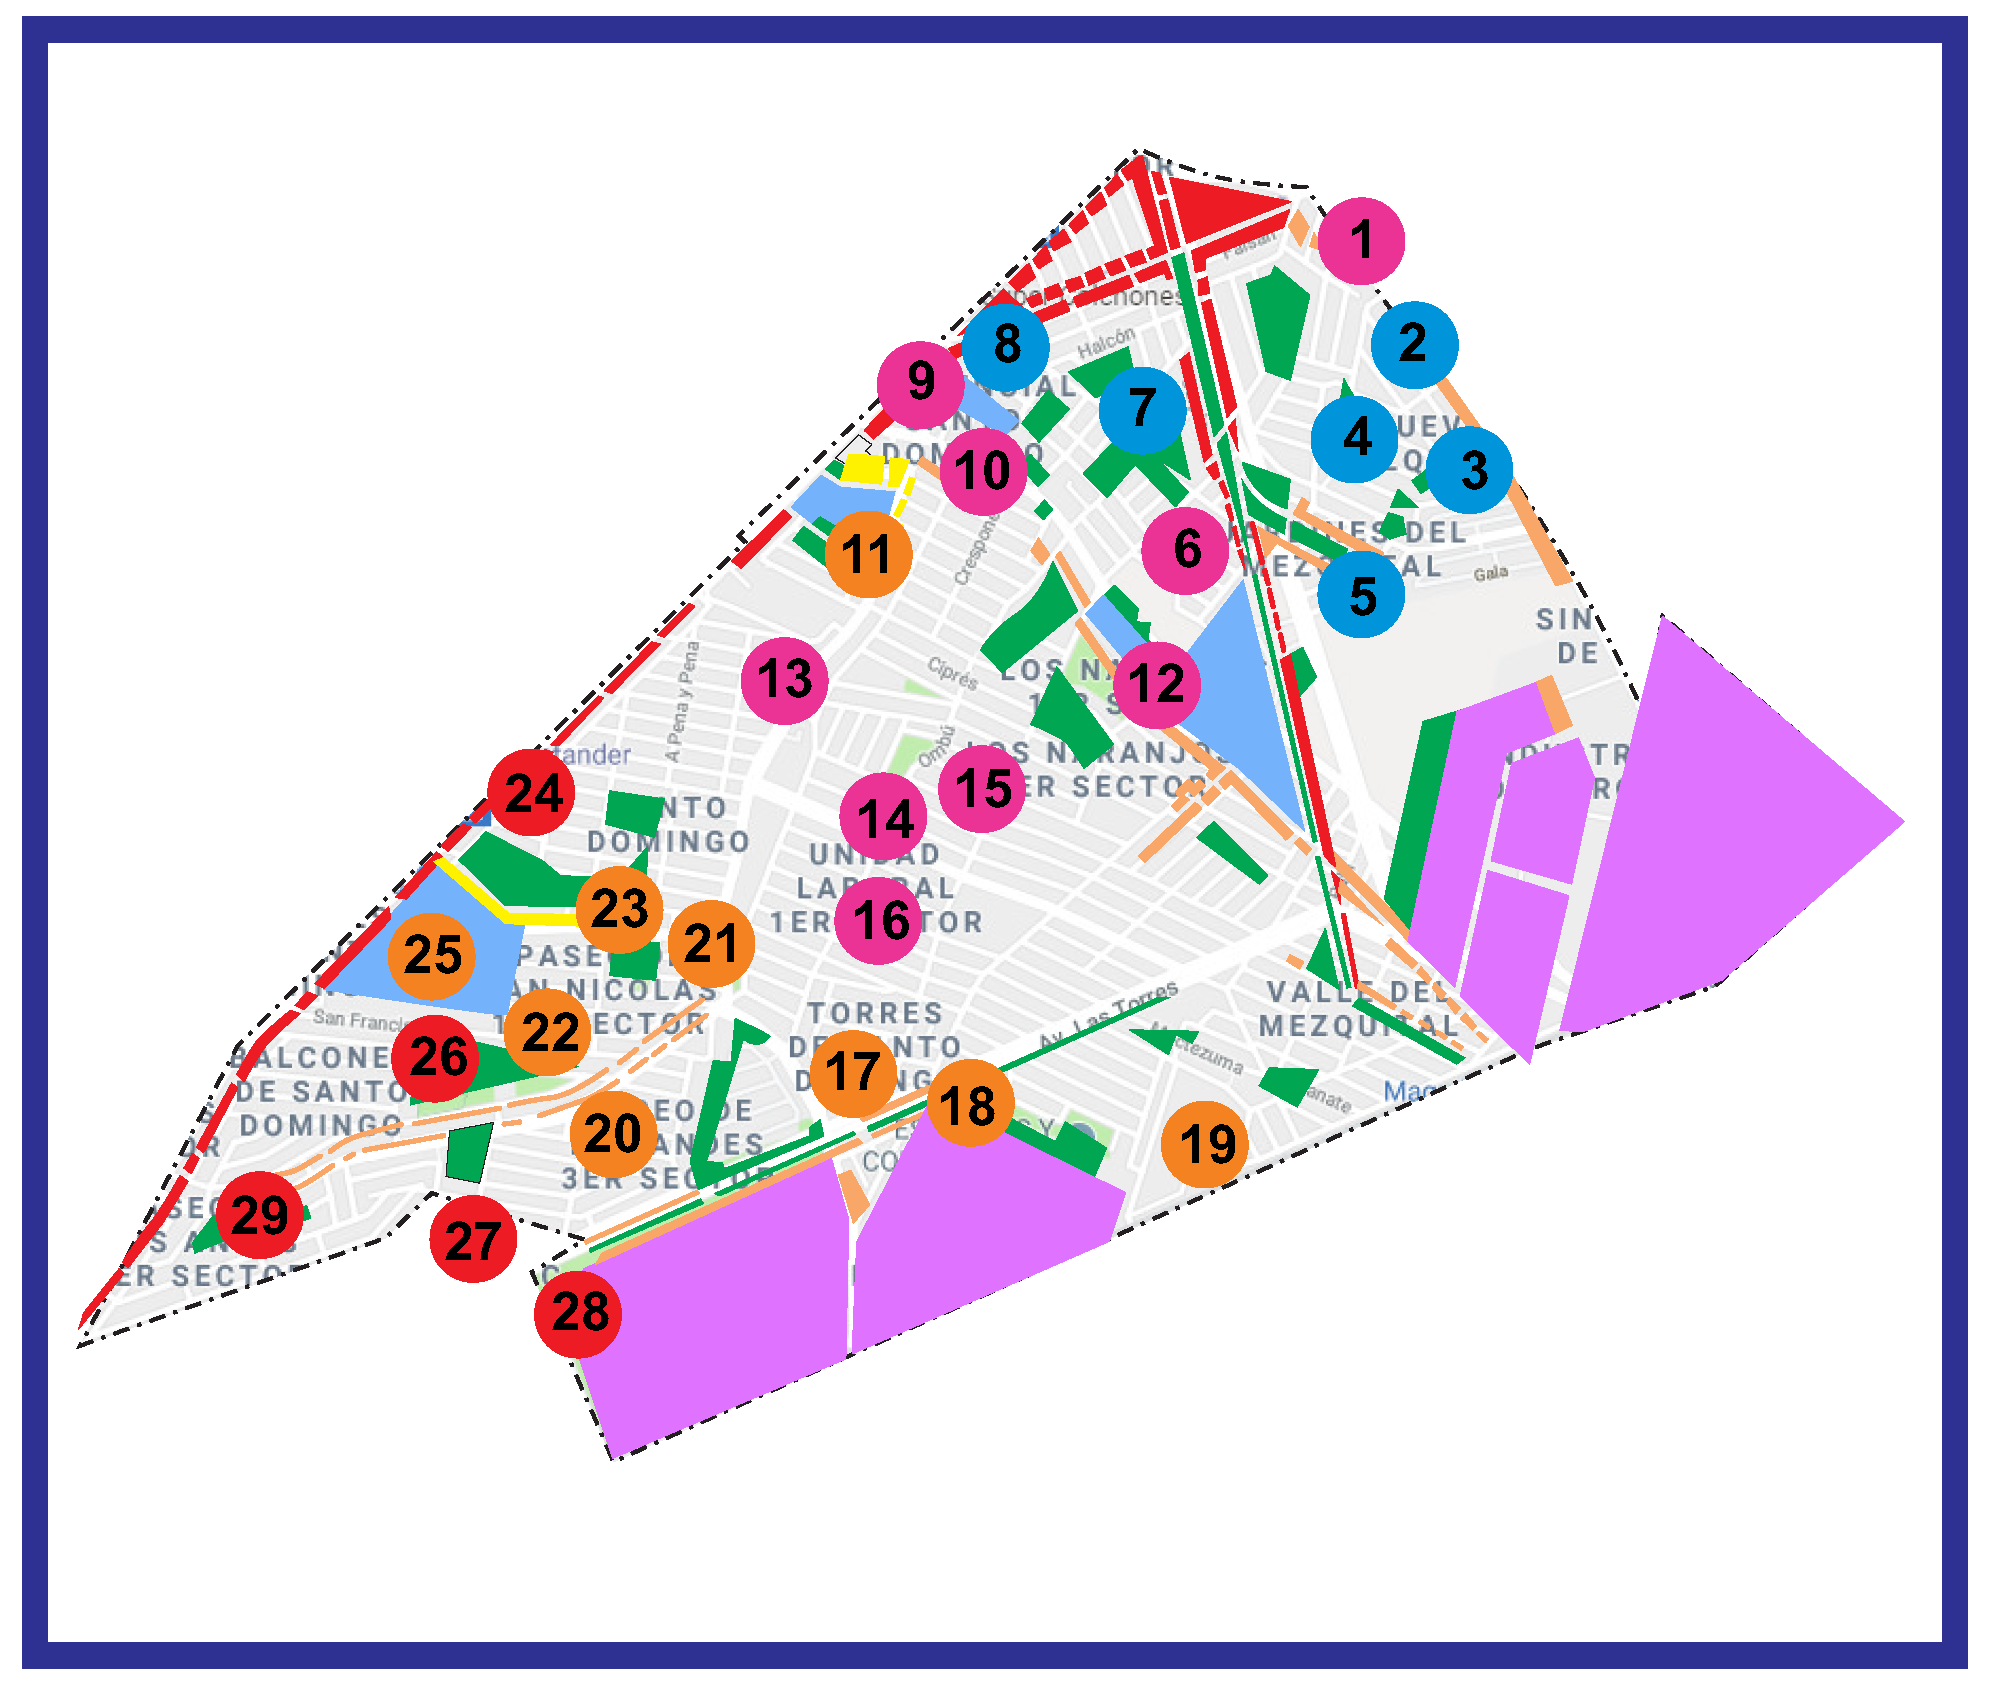
On the other hand, as mentioned previously, 8 runs were made for model 2 because the municipality has 8 providers. However, in the results that were obtained, there were cases where the criterion of contiguity is not met; for this purpose the methodology is proposed. Figure 5 shows the solution of model 2 for provider F. Also Table 5 shows the weeks and the number of parks to be weeded in each of them and the workload every week.
4.3. Results Algorithm: Allocation of Non-Contiguous Parks
The proposed algorithm consists of making exchanges to obtain territories where all the parks are contiguous and are next described graphically below.
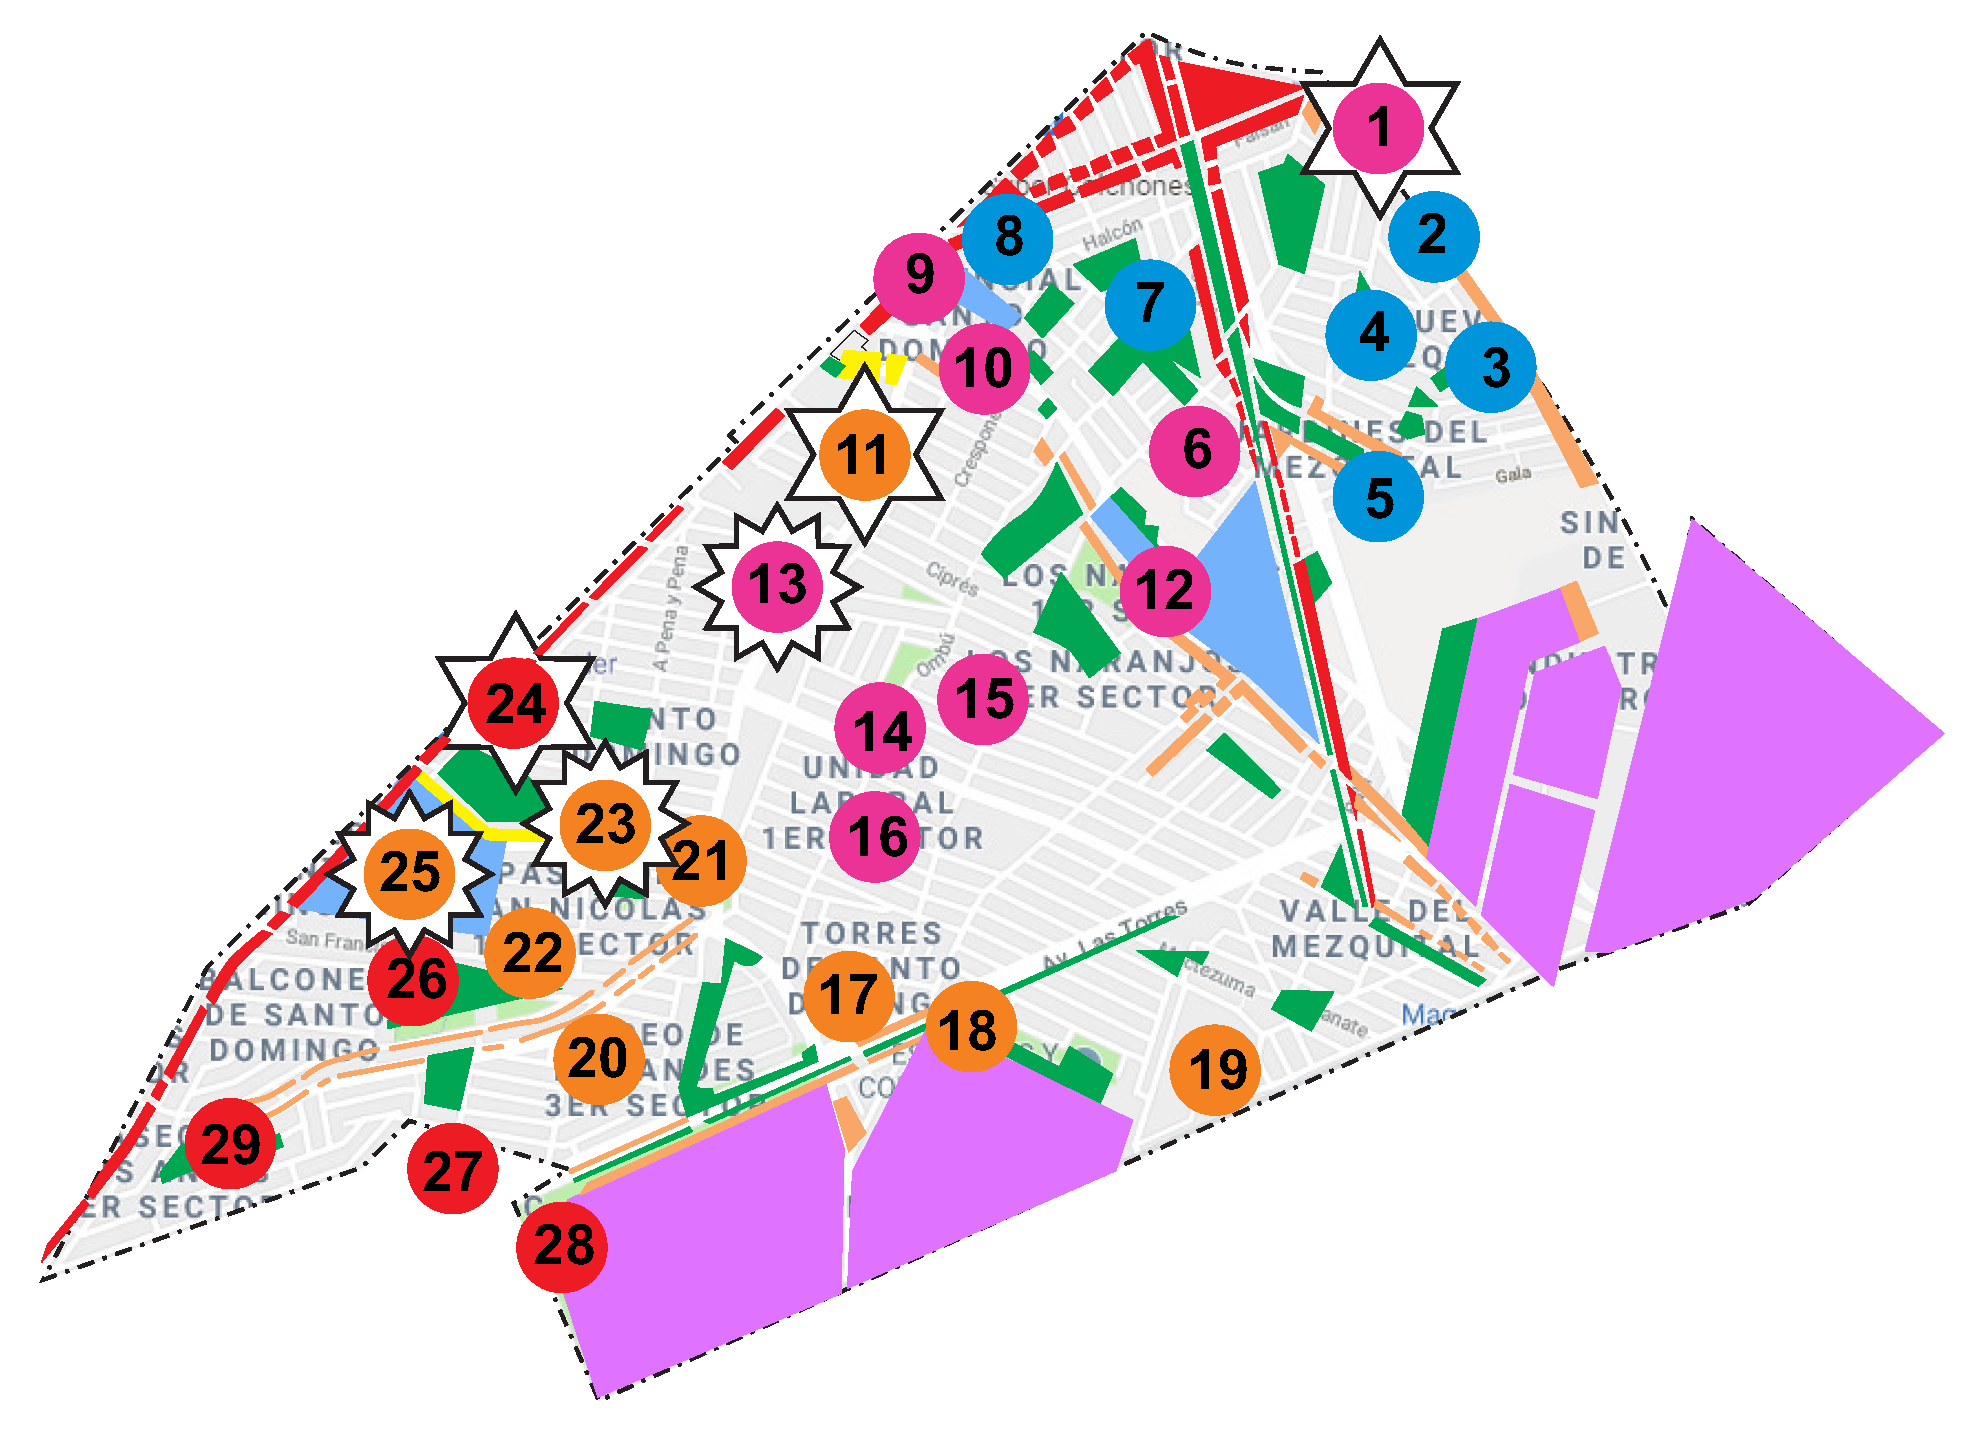
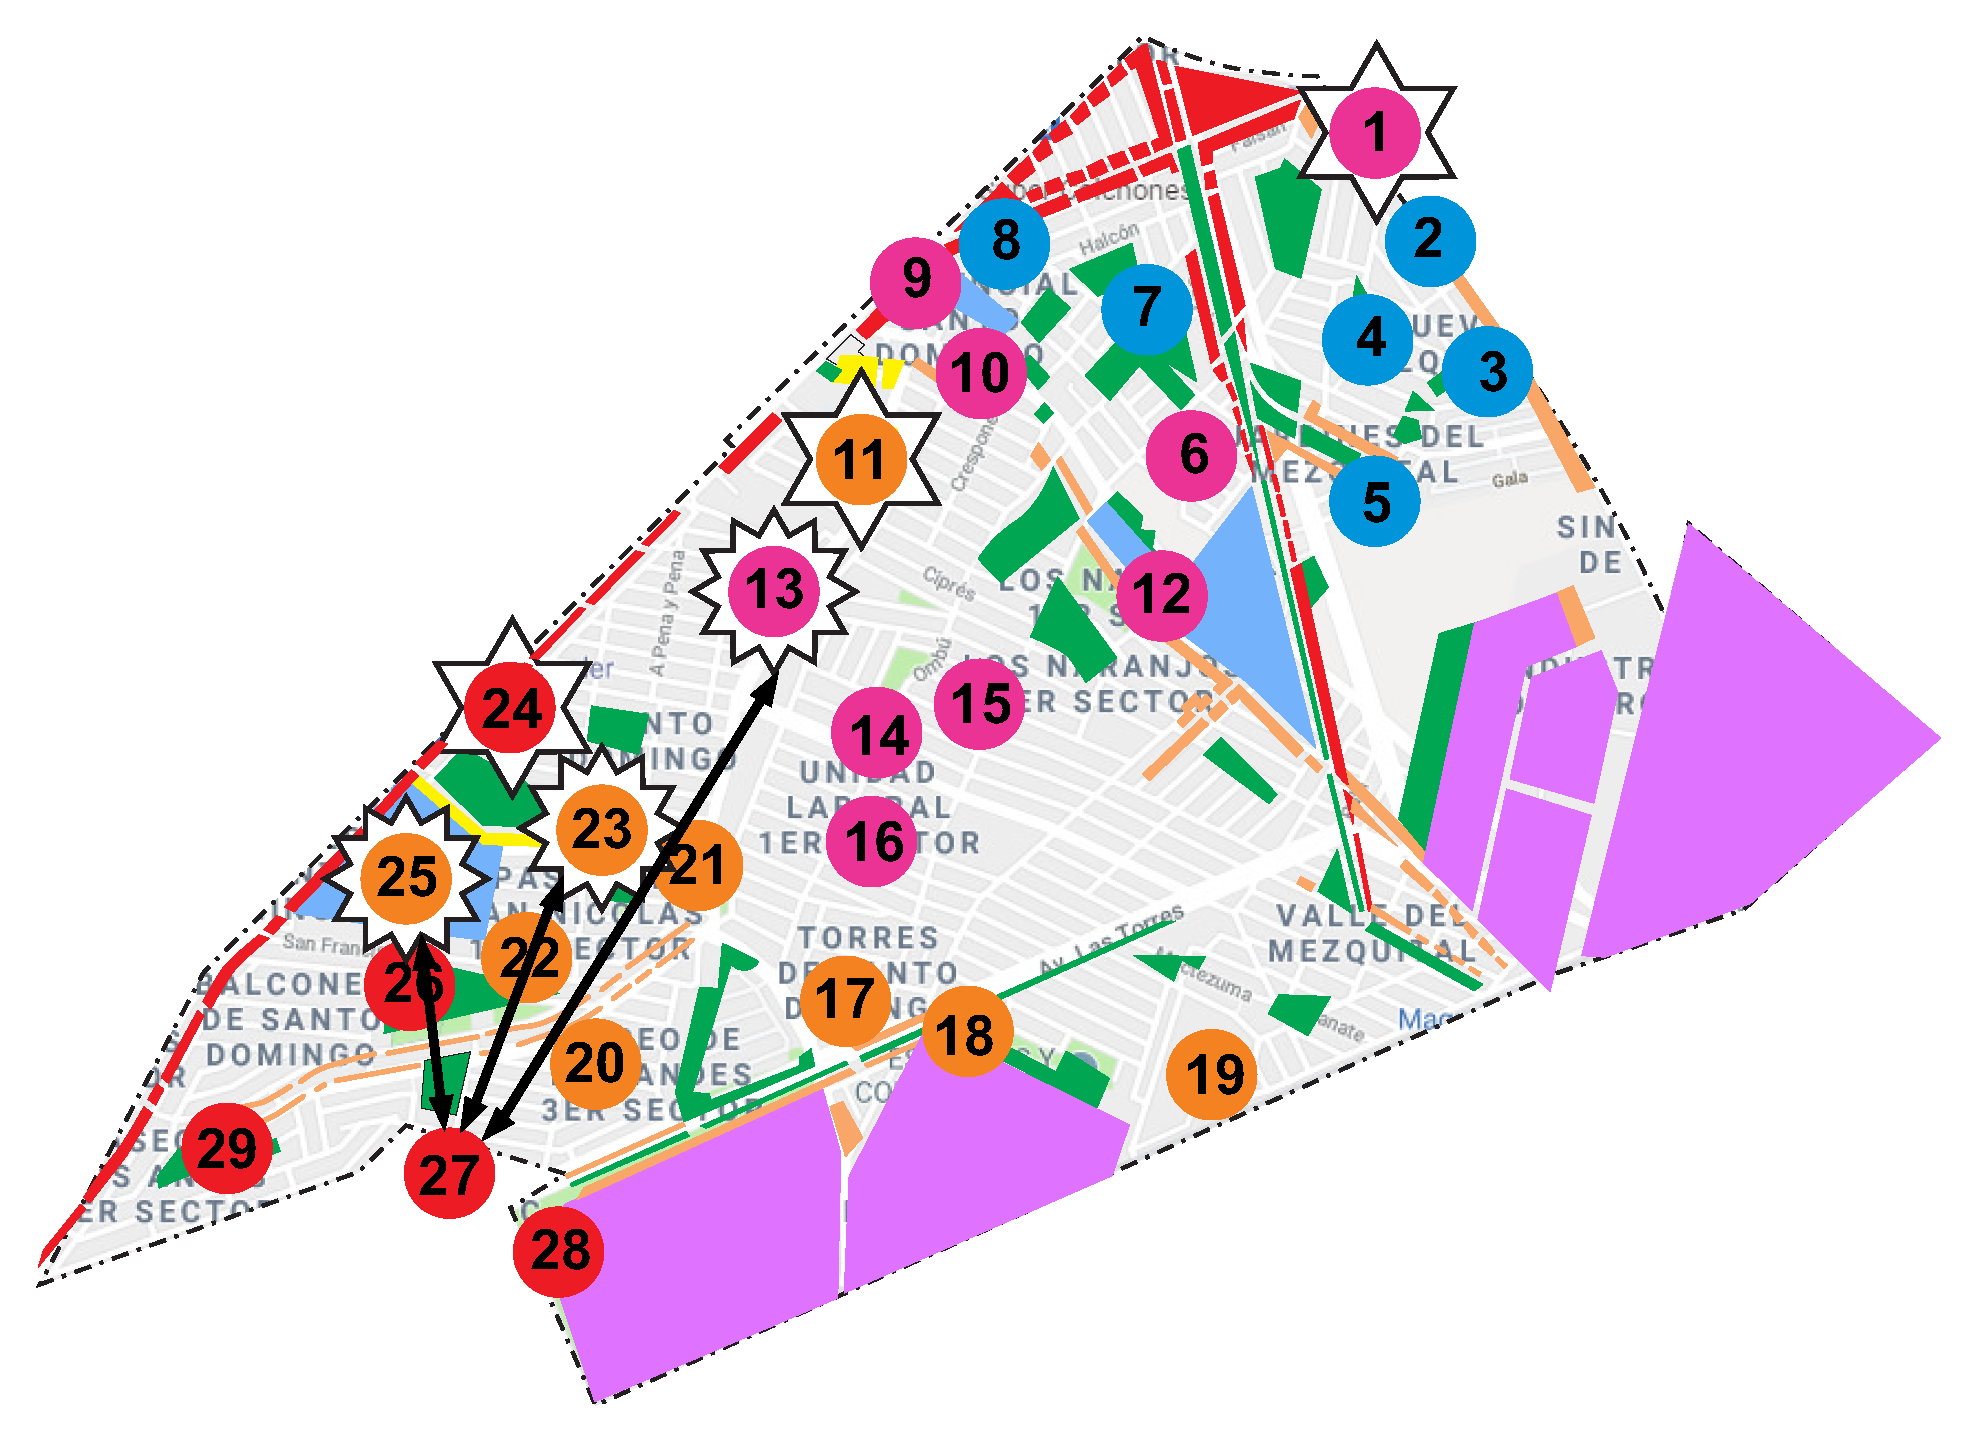
Application of step 3 from Table 2, identify the non-contiguous parks: 1, 11, and 24 (see Figure 6). After selecting one of the three, changes can be done; park 24 will be selected. The next step (4) is to identify the adjacent parks: 25, 23, and 13 (see Figure 7). In order to determine the parks to be switched, we select the one closest (park 25) to the center of territory (park 27) (see Figure 8).
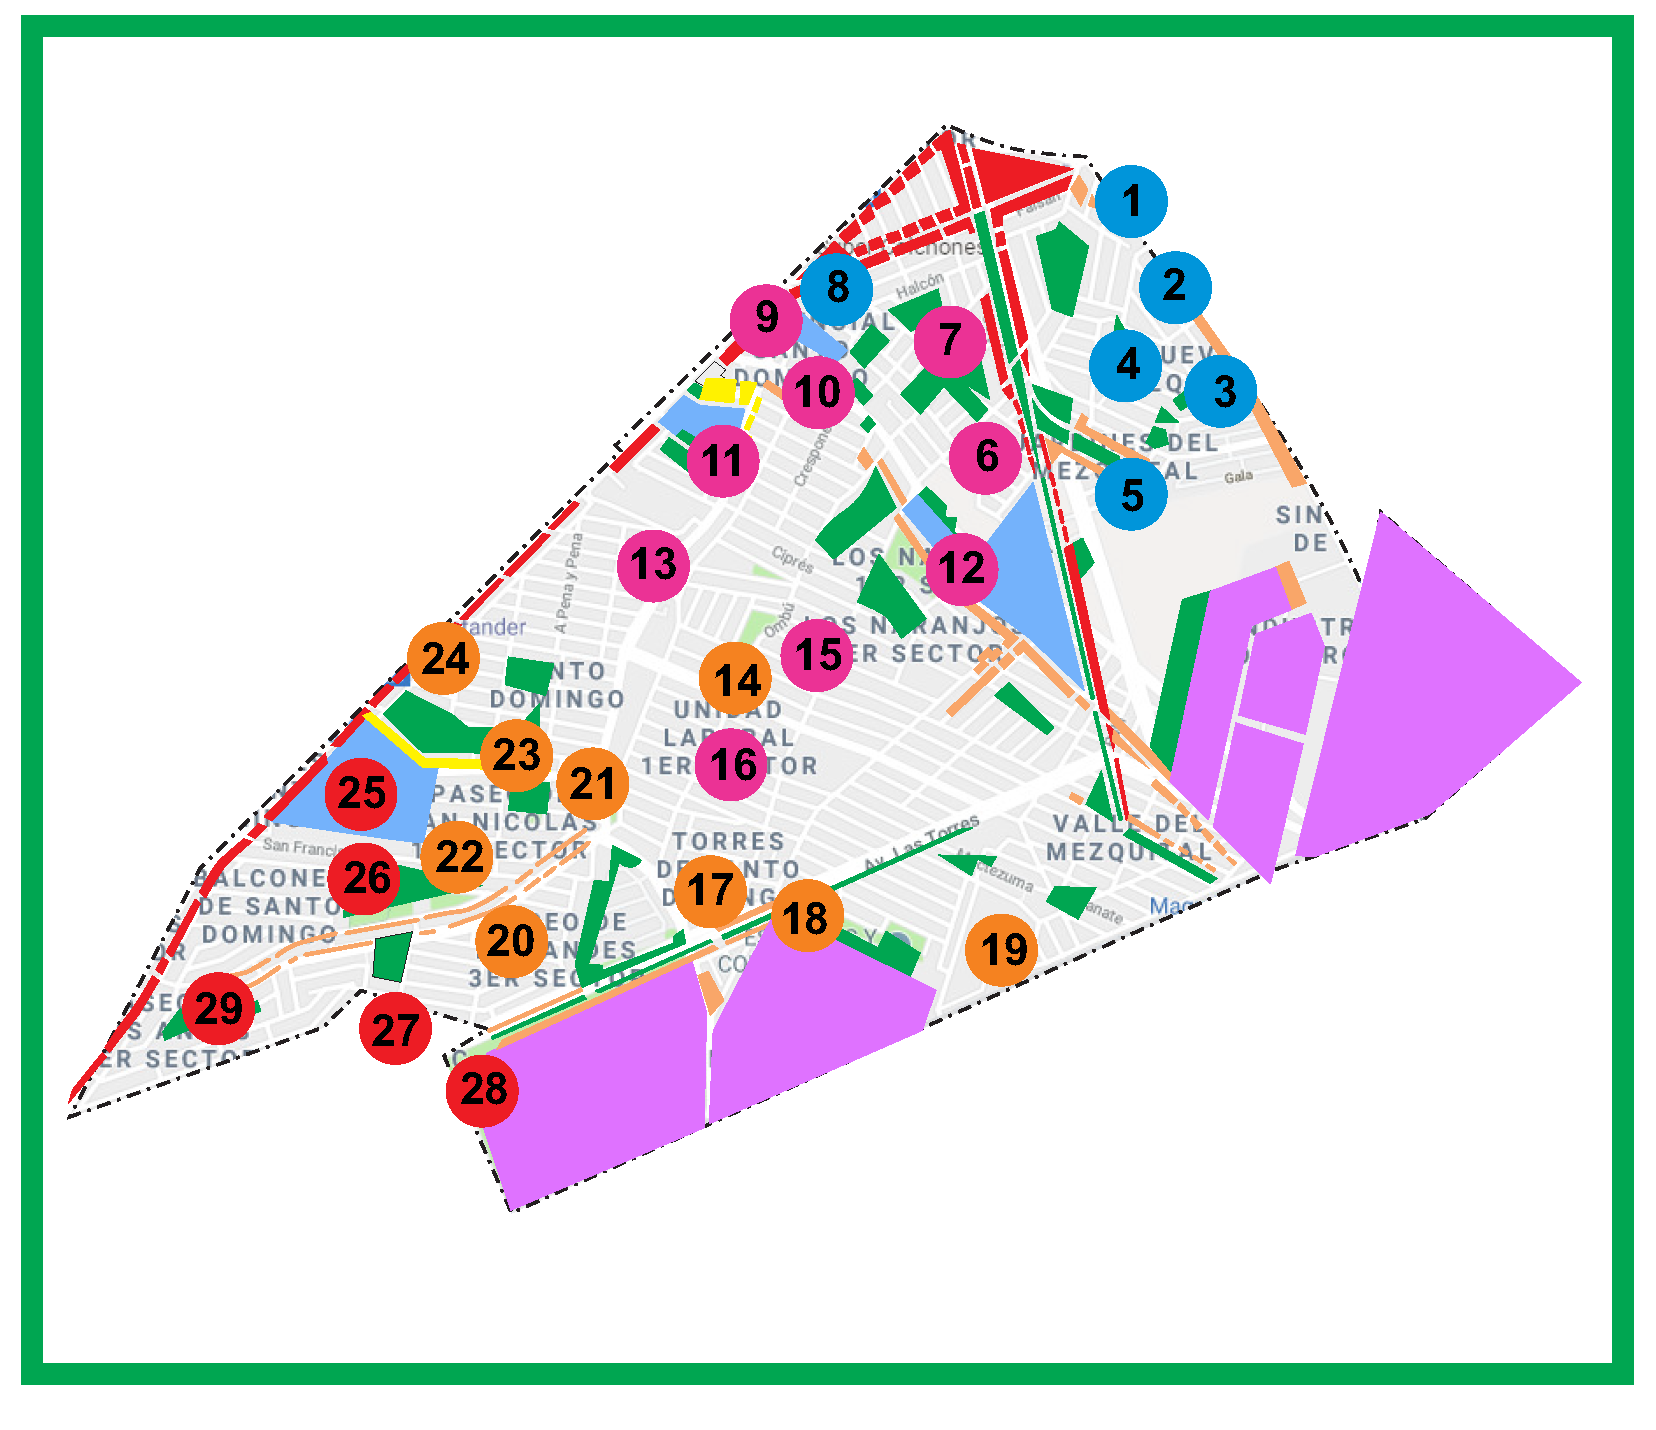
Similarly, exchanges are done for parks 11 and 1. Once all exchanges have been done, the activity measure is adjusted for each territory. Figure 9 shows the second solution obtained with the proposed methodology. It is important to mention that, in this new configuration, the criterion of contiguity is met but the balance criterion is unbalanced, since in each week, as shown in Figure 9, the workload is very variable, which leaves the final decision of the choice of solution to service providers (see Table 6).
5. Conclusions
In this research, we obtain the conceptualization based on a mathematical model of territory design for the cleaning and solid waste collection service in San Nicolas de los Garza public parks, this being the main contribution, where the factors were considered important for this service, such as the amount of waste collected and the frequency of service.
As an important conclusion, the results obtained using the mathematical model proposed are satisfactory in the computational part and also offer an adequate design of territories fulfilling the criteria of planning of contiguity, balance, compactness, and spatial integrity. On the other hand, a remarkable aspect of the results is the coverage of the service, which ensures an adequate level of service, where all the parks of the municipality of San Nicolas de los Garza will be weeded once a month to generate a greater control in the allocation of parks to providers considering the payload.
The direct application of the mathematical model for the operation of public services would be determined by the service managers; however, among the benefits that would be obtained, there is greater efficiency in the use of transport equipment and service coverage.
6. Future Work
In the municipality of San Nicolas, each provider has a certain number of crews and a time available for the weeding and collection of each park; in addition, the amount of playground equipment and benches in each park differs as well as the travel times. The different capacities of provider are elements that influence this service; therefore, it would be interesting to give service providers a new proposal with these elements.
Author Contributions
Conceptualization and mathematical formulation, J.A.S.M.; Experimentation and analysis, M.d.R.A.V.; Funding acquisition, language review, model validation, A.M.; Methodology and Writing—original draft J.A.S.M. and M.d.R.A.V.
Funding
This research was funded by Becas Nacionales CONACYT grant number 416894.
Acknowledgments
Universidad Autonoma de Nuevo Leon and Universidad Panamericana
Conflicts of Interest
The authors declare that there are no conflict of interest.
References
- Robusté, F.; Campos, J.M.; Galván, D. Nace la Logistica Urbana. In Proceedings of the Actas del IV Congreso de Ingeniería del Transporte, Valencia, Spain, 7–9 June 2000; Volume 2, pp. 683–691. [Google Scholar]
- Taniguchi, E.; Thompson, R.G.; Yamada, T. Recent Trends and Innovations in Modelling City Logistics. Procedia Soc. Behav. Sci. 2014, 125, 4–14. [Google Scholar] [CrossRef] [Green Version]
- Winkenbach, M.; Kleindorfer, P.R.; Spinler, S. Enabling Urban Logistics Services at La Poste through Multi-Echelon Location-Routing. Transp. Sci. 2015, 50, 1–21. [Google Scholar]
- Macário, R.; Galelo, A.; Martins, P.M. Business Models in Urban Logistics. Ing. Desarro. 2008, 24, 77–96. [Google Scholar]
- Villamizar, A.M.; Torres, J.M.; Padilla, N.H. Mathematical Programming Modeling and Resolution of the Location-Routing Problem in Urban Logistics1. Ing. Univ. 2014, 18, 271–289. [Google Scholar]
- Álvarez, J.; Eslava, A. La logística urbana, la ciudad logística y el ordenamiento territorial logístico. Reto 2016, 4, 21–40. [Google Scholar]
- Dotoli, M.; Epicoco, N. A Vehicle Routing Technique for Hazardous Waste Collection. IFAC Pap. Online 2017, 50, 9694–9699. [Google Scholar] [CrossRef]
- Buhrkal, K.; Larsen, A.; Ropke, S. The Waste Collection Vehicle Routing Problem with Time Windows in a City Logistics Context. Procedia Soc. Behav. Sci. 2012, 39, 241–254. [Google Scholar] [CrossRef] [Green Version]
- INEGI. Banco de Indicadores; Technical Report; Instituto Nacional de Estadistica y Geografia: Mexico City, Mexico, 2015; Available online: http://mapserver.inegi.org.mx/ambiental/map/indexV3FFM.html (accessed on 1 October 2019).
- Arriaga, E.P.; Morenoz, J.R.; Caro, G.V. Los sistemas de recolección de residuos sólidos (Los métodos y sus aplicaciones). CienciaUAT 2007, 1, 58–60. [Google Scholar]
- Galicia, F.G. Análisis del Sistema de Recolección de Residuos Sólidos Urbanos en el Centro Histórico de Morelia, aplicando Sistemas de Información Geográfica (SIG). Master’s Thesis, Universidad Nacional Autónoma de México, Mexico City, Mexico, 2008. [Google Scholar]
- SEDESOL. Manual Para el Diseño de Rutas de Recolección de Residuos Sólidos Municipales; Secretaría de Desarrollo Social. 1997. Available online: http://www.inapam.gob.mx/work/models/SEDESOL/Resource/1592/1/images/ManualTecnicosobreGeneracionRecoleccion.pdf (accessed on 1 October 2019).
- Mercado, L. Logística Inversa; Technical Report; Revista Industria al dia; Universidad de Cordoba: Cordoba, Colombia, 2005; Available online: http://www.unicordoba.edu.co/revistas/vieja_industrialaldia/documentos/ed.1/logistica_inversa.pdf (accessed on 1 October 2019).
- Purkayastha, D.; Majumder, M.; Chakrabarti, S. Collection and recycle bin location-allocation problem in solid waste management: A review. Pollution 2015, 1, 175–191. [Google Scholar]
- Group, W.B. What a Waste 2.0 A Global Snapshot of Solid Waste Management to 2050; Technical report; World Bank: Washington, DC, USA, 2018. [Google Scholar]
- Uriarte-Miranda, M.L.; Caballero-Morales, S.O.; Martinez-Flores, J.L.; Cano-Olivos, P.; Akulova, A.A. Reverse Logistic Strategy for the Management of Tire Waste in Mexico and Russia: Review and Conceptual Model. Sustainability 2018, 10, 3398. [Google Scholar] [CrossRef]
- Hage, O.; Soderholm, P.; Berglund, C. Norms and economic motivation in household recycling: Empirical evidence from Sweden. Resour. Conserv. Recycl. 2015, 53, 155–165. [Google Scholar] [CrossRef]
- Castillo, L.D.R.; Gallardo Izquierdo, A.; Pinero Guilamany, A. La distancia del domicilio al contenedor como un factor influyente en la frecuencia de separación de residuos urbanos. In Hacia la sustentabilidad: Los Residuos Solidos Como Fuente de Energía y Materia Prima; Red iberoamericana en gestion y aprovechamiento de residuos (REDISA), 2011; pp. 209–213. Available online: http://www.redisa.net/doc/artSim2011/GestionYPoliticaAmbiental/La%20distancia%20del%20domicilio%20al%20contenedor%20como%20un%20factor%20influyente%20en%20la%20frecuencia%20de%20separaci%C3%B3n%20de%20residuos%20urbanos.pdf (accessed on 1 October 2019).
- Chang, N.B.; Wei, Y.L. Strategic Planning of Recycling Drop-Off Stations and Collection Network by Multiobjective Programming. Environ. Manag. 1999, 24, 247–263. [Google Scholar] [CrossRef]
- Gautam, A.K.; Kumar, S. Strategic planning of recycling options by multi-objective programming in a GIS environment. Clean Technol. Environ. Policy 2005, 7, 306–316. [Google Scholar] [CrossRef]
- Alonso, A.B. Localizacion optima de contenedores de residuos solidos urbanos en Alcalá de Henares. M+A Rev. Electrón. Medioambiente 2016, 17, 1–23. [Google Scholar]
- Simon, S.; Demaldé, J.; Hernandez, J.; Carnero, M. Optimización de Recorridos para la Recolección de Residuos Infecciosos. Inf. Tecnol. 2012, 23, 125–132. [Google Scholar] [CrossRef]
- Bing, X.; de Keizer, M.; Bloemhof-Ruwaard, J.M.; van der Vorst, J.G. Vehicle routing for the eco-efficient collection of household plastic wastes. Waste Manag. 2014, 34, 719–729. [Google Scholar] [CrossRef] [PubMed]
- Rodríguez, A.A.; Butrón, E.G. Asignación de rutas de vehículos para un sistema de recolección de residuos sólidos en la acera. Rev. Ing. 2001, 13, 5–11. [Google Scholar] [CrossRef]
- Aguilar, J.A.A.; Zambrano, M.E.J. Mejora del servicio de recolección de residuos sólidos urbanos empleando herramientas SIG: Un caso de estudio. Ingeniería 2015, 19, 118–1128. [Google Scholar]
- Pastor, J.M. Optimizacion de la localizacion y recogida de residuos sólidos urbanos (RSU). Master’s Thesis, Universidad Complutense de Madrid, Madrid, Spain, 2013. [Google Scholar]
- Regidor, M.P.M.; de Lacalle, J.G.L. Estado del arte en procesos de zonificación. Rev. GeoFocus 2009, 11, 155–181. [Google Scholar]
- Zoltners, A.; Sinha, P. Sales territory alignment: A review and model. Manag. Sci. 1983, 29, 1237–1256. [Google Scholar] [CrossRef]
- Ríos-Mercado, R.Z.; Fernández, E. A reactive GRASP for a commercial territory design problem with multiple balancing requirements. Comput. Oper. Res. 2009, 36, 755–776. [Google Scholar] [CrossRef]
- Armstrong, M.; Honey, R. A spatial decision support system for school redistricting. URISA J. 1993, 5, 40–52. [Google Scholar]
- Muyldermans, L.; Cattrysse, D.; Oudheusden, D.V.; Lotan, T. Districting for salt spreading operations. Eur. J. Oper. Res. 2002, 139, 521–532. [Google Scholar] [CrossRef]
- Tiede, D.; Strobl, J. Polygon-based regionalisation in a GIS environment. In Proceedings of the Trends in Knowledge-Based Landscape Modeling, Dessau, Germany, 18–20 May 2006; pp. 54–59. [Google Scholar]
- Kalcsics, J.; Nickel, S.; Schröder, M. A Generic Geometric Approach to Territory Design and Districting; Berichte des Fraunhofer ITWM; Fraunhofer-Institut fur Techno: Kaiserslautern, Germany, 2009; pp. 1–32. [Google Scholar]
- Benabdallah, S.; Wright, J.R. Multiple subregion allocation models. Asce J. Urban Plan. Dev. 1992, 118, 24–40. [Google Scholar] [CrossRef]
- García, E.R.; Andrade, M.A.G. Compacidad en celdas aplicada al diseño de zonas electorales. Supplement 2008, 5, 73–95. [Google Scholar]
- Díaz, A.; Bernábe, B.; Luna, D. Relación lagrangeana para el problema de particionamiento de áreas geográficas. Rev. Mat. Teor. Apl. 2012, 19, 169–181. [Google Scholar]
- Phuntsho, S.; Dulal, I.; Yangden, D.; Tenzin, U.; Herat, S.; Shon, H.; Vigneswaran, S. Studying municipal solid waste generation and composition in the urban areas of Bhutan. Waste Manag. Res. 2010, 28, 545–551. [Google Scholar] [CrossRef] [PubMed]
- Jayakody, K.P.K.; Jayakody, L.L.; Karunarathna, A.K.; Basnayake, B.F. Municipal Solid Waste Management System and Solid Waste Characterization at Hikkaduwa Secretariat; Technical Report; Department of Agricultural Engineering, University of Peradeniya: Peradeniya, Sri Lanka, 2008. [Google Scholar]
- Kaosol, T. Sustainable Solutions for Municipal Solid Waste Management in Thailand. Int. J. Environ. Ecol. Eng. 2009, 3, 399–404. [Google Scholar]
- Ayantoyinbo, B.B.; Adepoju, O.O. Analysis of Solid Waste Management Logistics and Its Attendant Challenges in Lagos Metropolis. Logistics 2018, 2, 11. [Google Scholar] [CrossRef]
- Laureri, F.; Minciardi, R.; Robba, M. An algorithm for the optimal collection of wet waste. Waste Manag. 2010, 48, 56–63. [Google Scholar] [CrossRef]
- Son, L.H.; Louati, A. Modeling municipal solid waste collection: A generalized vehicle routing model with multiple transfer stations, gather sites and inhomogeneous vehicles in time windows. Waste Manag. 2016, 52, 34–49. [Google Scholar] [CrossRef] [PubMed]
- Das, S.; Bhattacharyya, B.K. Optimization of municipal solid waste collection and transportation routes. Waste Manag. 2015, 43, 9–18. [Google Scholar] [CrossRef] [PubMed]
- Gobierno-Municipal, S. Plan de Desarrollo Urbano Sustentable 2013–2033 San Nicolás de Los Garza. 2013. Available online: http://transparencia.sanicolas.gob.mx/LTAINL/dic13/plan%20de%20desarrollo%20sustentable.pdf (accessed on 15 December 2016).
- Calva, L.F.L.; de la Torre, R.; Reyes, A.G.; Chamussy, L.R.; Garcia, C.R.; Dominguez, F.V. El desarrollo humano de los municipios en México. Technical Report. 2015. Available online: http://www.mx.undp.org/content/mexico/es/home/library/poverty/informe-de-desarrollo-humano-municipal-2010-2015--transformando-.html (accessed on 1 October 2019).
Figure 1.
Total generation of solid waste. Source: INEGI [9].
Figure 1.
Total generation of solid waste. Source: INEGI [9].

Figure 2.
Districts of the municipality San Nicolas de los Garza.

Figure 3.
Proposed territory design for providers.

Figure 4.
Design for districts 19, 21, 23, and 24.

Figure 5.
Design for districts 7 and 8—Solution 1.

Figure 6.
Application of step 3.

Figure 7.
Application of step 4.

Figure 8.
Application of step 5.

Figure 9.
Design for districts 7 and 8—Solution 2.


Table 1.
Districts of the municipality San Nicolas de los Garza.
| Districts | Parks | Activity Measure m | % m |
|---|---|---|---|
| 1. Casa Bella | 11 | 71,344.02 | 5% |
| 2. Balcones | 3 | 25,901.85 | 1.8% |
| 3. Centro | 2 | 11,771.30 | 0.8% |
| 4. CEDECO | 18 | 82,428.73 | 5.7% |
| 5. El Refugio | 20 | 51,673.84 | 3.6% |
| 6. Vicente Guerrero | 10 | 74,529.20 | 5.2% |
| 7. Santo Domingo | 12 | 89,845.99 | 6.3% |
| 8. Del Paseo | 17 | 10,6051.64 | 7.4% |
| 9. San Cristobal | 7 | 27,787.56 | 1.9% |
| 10. La Fe | 4 | 27,285.80 | 1.9% |
| 11. Casa Blanca | 13 | 95,637.52 | 6.7% |
| 12. Talaverna | 14 | 130,072.60 | 9.1% |
| 13. Del Vidrio | 14 | 52,549.01 | 3.7% |
| 14. Constituyentes | 19 | 33,960.43 | 2.4% |
| 15. Nogalar | 8 | 45,471.45 | 3.2% |
| 16. Pedregal | 5 | 25,059.05 | 1.7% |
| 17. Residencial Anahuac | 7 | 51,956.72 | 3.6% |
| 18. La Grange | 6 | 8417.01 | 0.6% |
| 19. Industrial | 0 | 0 | 0% |
| 20. Andalucia | 19 | 97,414.25 | 6.8% |
| 21. Cuauhtemoc | 12 | 77,329.98 | 5.4% |
| 22. Las Puentes | 20 | 137,946.42 | 9.6% |
| 23. Anahuac | 11 | 42,991.38 | 3% |
| 24. Jardines de Anahuac | 13 | 67,664.64 | 4.7% |
Table 2.
Algorithm of the solution method for the criterion of contiguity.
| Algorithm: Allocation of Non-Contiguous Parks |
|---|
| Input: Matrix of adjacency of the parks in each formed territory, where an element takes the value of 1 if the parks are adjacent and 0 otherwise; Adjacency matrix of all district parks; Matrix of distances between each park; Table of results of model 2 containing the measure of activity of each territory. |
| Output: Contiguous parks. |
| 1. While Criterion of contiguity is not met do |
| 2. Identify a territory that contains at least one non-contiguous park. |
| 3. Select a non-contiguous territory. |
| 4. Search the adjacent parks of the park selected from the previous step. |
| 5. for Adjacent parks do |
| Comparison between distances from the parks to the center of territory. |
| end for |
| 6. Select the park with the shortest distance to the center of territory. |
| 7. To realize interchange between the park with smaller distance to the center of territory and the non-contiguous park. |
| 8. Calculate the activity measure of the two territory formed. |
| 9. Evaluate criterion of contiguity. |
| end while |
| 10. return Compliance with the criterion of contiguity of the parks and new territories formed. |
Table 3.
Allocation of districts for each provider.
| Districts | Provider | Parks | Activity Measure m |
|---|---|---|---|
| 1, 2, 17 | Provider A | 21 | 149,202.59 |
| 4, 5, 6 | Provider B | 48 | 208,631.77 |
| 3, 22 | Provider C | 22 | 149,717.72 |
| 19, 21, 23, 24 | Provider D | 36 | 187,986 |
| 11, 15, 16, 18 | Provider E | 32 | 174,585.03 |
| 7, 8 | Provider F | 29 | 195 897.63 |
| 13, 14, 20 | Provider G | 52 | 183,923.69 |
| 9, 10, 12 | Provider H | 25 | 185,145.96 |
Table 4.
Planning for park maintenance for provider D.
| Weeks | Parks | Activity Measure m |
|---|---|---|
| Week 1 | 1–11, 17, 21 | 53,658.57 |
| Week 2 | 12–16, 18, 19, 22 | 52,728.17 |
| Week 3 | 20, 23, 32–36 | 52,708.06 |
| Week 4 | 24–31 | 46,947.11 |
Table 5.
Planning for park maintenance for provider F.
| Week | Parks | Activity Measure m |
|---|---|---|
| Week 1 | 2–5, 7, 8 | 52,387 |
| Week 2 | 1, 6, 9, 10–16 | 48,546 |
| Week 3 | 11, 17–23, 25 | 50,697 |
| Week 4 | 24, 26–29 | 44,265 |
Table 6.
Planning for park maintenance for provider F, solution 2.
| Week | Parks | Activity Measure m |
|---|---|---|
| Week 1 | 1–5, 8 | 43,580 |
| Week 2 | 6, 7, 9, 10–13, 15, 16 | 56,877 |
| Week 3 | 14, 17–24 | 48,893 |
| Week 4 | 25–29 | 46,546 |
© 2019 by the authors. Licensee MDPI, Basel, Switzerland. This article is an open access article distributed under the terms and conditions of the Creative Commons Attribution (CC BY) license (http://creativecommons.org/licenses/by/4.0/).
Share and Cite
MDPI and ACS Style
Saucedo Martinez, J.A.; Mendoza, A.; Alvarado Vazquez, M.d.R. Collection of Solid Waste in Municipal Areas: Urban Logistics. Sustainability 2019, 11, 5442. https://doi.org/10.3390/su11195442
AMA Style
Saucedo Martinez JA, Mendoza A, Alvarado Vazquez MdR. Collection of Solid Waste in Municipal Areas: Urban Logistics. Sustainability. 2019; 11(19):5442. https://doi.org/10.3390/su11195442
Chicago/Turabian StyleSaucedo Martinez, Jania Astrid, Abraham Mendoza, and Maria del Rosario Alvarado Vazquez. 2019. "Collection of Solid Waste in Municipal Areas: Urban Logistics" Sustainability 11, no. 19: 5442. https://doi.org/10.3390/su11195442
Note that from the first issue of 2016, this journal uses article numbers instead of page numbers. See further details here.