The Structure and Dynamic of Scientific Collaboration Network among Countries along the Belt and Road


1
Institute for global Innovation and Development, East China Normal University, Shanghai 200062, China
2
School of Urban and Regional Science, East China Normal University, Shanghai 200241, China
3
Institute of Eco-Chongming, East China Normal University, Shanghai 200062, China
*
Authors to whom correspondence should be addressed.
Sustainability 2019, 11(19), 5187; https://doi.org/10.3390/su11195187
Submission received: 17 August 2019
/
Revised: 17 September 2019
/
Accepted: 18 September 2019
/
Published: 22 September 2019
(This article belongs to the Section Sustainability in Geographic Science)
Abstract
:Although a number of studies have discussed the economic, geopolitical and environmental impacts of the Belt and Road Initiative (BRI), there is a scarcity of analysis on the importance of science in the Belt and Road (B&R). Adopting bibliographical data from Clarivate Analytics’ Web of Science database for the period 2000–2018, this study investigates the network properties, topological structure, spatial pattern, position of countries, core-periphery sets, and the hierarchy of the network from a dynamic perspective. The results show that scientific collaboration is increasingly frequent. The “hub-and-spoke” and triangulated structures coexist, shaping the landscape of the network. With the decline of Central and Eastern Europe, and the rise of the Asia-Pacific region, the spatial pattern evolves from ‘‘strong Western and weak Eastern” to ‘‘weak Western and strong Eastern’’. The central position has been occupied by India, China, and Turkey, while Russia’s influence has lessened over time. Moreover, the collaboration network is a typical core–periphery structure with prominent hierarchical features. China, Poland, and Saudi Arabia are the top-tier coordination centers within sub-networks. Finally, this study provides policy recommendations and prospective research directions.
1. Introduction
In 2013, China launched the Silk Road Economic Belt and the 21st-Century Maritime Silk Road, which were collectively known as the Belt and Road (B&R), or the Belt and Road Initiative (BRI). It is the single largest infrastructure project, which is referred to as “China’s Marshall Plan” by mainstream media [1]. According to the official action plan, in 2015, the core geographic coverage of the BRI included 65 countries (China plus 64 countries), accounting for 62.3% of the world’s population and a 30.0% share of the global GDP [2,3]. It is noted that the BRI is an open platform, and 136 countries and 30 international organizations have signed the memorandum of understanding (MOU) with China as of July 2019. The basic goal of the BRI is to create an “economic cooperation area” and to strengthen economic and trade cooperation. As time goes by, the conception of the BRI constantly updates. In 2017, China came up with Belt and Road Science and Technology Innovation Action Plan, aiming to strengthen international science and technology (S&T) collaboration. In 2018, the Alliance of International Science Organizations in the Belt and Road Region (ANSO) was established in Beijing, which was a specific platform to initiate collaboration in S&T among countries in the region and to promote sustainable development. In 2019, the Second Belt and Road Forum for International Cooperation first set up a thematic forum on the innovation road, which focused on a new path of science and technology innovation cooperation. Science has become one of the central foci of the BRI. A growing number of countries are turning to China for support and collaboration in science, and the rise of science Silk Road is redrawing the map of world science [4]. In addition, building a sustainable Belt and Road has become a hot topic [5,6,7]. The BRI is most criticized for its substantial environmental risks, while international scientific collaboration plays a more central role in addressing the pressing environmental concerns or challenges [8,9].
Since the BRI was proposed in 2013, a large body of literature has focused on international relations [10,11,12], outward foreign direct investment [13,14], globalization [15,16,17], investment risk assessment [18,19], maritime transport [20,21], environmental risks [22,23,24], energy consumption [25,26], water resources [27], urbanization patterns [28], and agricultural trade [29,30]. However, the globalization of science and technology is the most important characteristic of modern globalization [31]. Current scientific research is entering the age of international collaboration [32], and South-South collaboration becomes a growing trend [33]. Knowledge, as a public good, is non-excludable [34], and international scientific collaboration is a win-win game. British science journal ‘Nature’ published five papers on China’s science Silk Road in 2019, and the titles were “How China is redrawing the map of world science”, “Scientists in Pakistan and Sri Lanka bet their futures on China”, “China charts a path into European science”, “South America is embracing Beijing’s science silk road”, and “Chinese investments fuel growth in African science”, respectively. A growing number of scholars have called for international scientific cooperation along the B&R [8,9,35]. Therefore, we shift our focus from economic and infrastructure cooperation to scientific collaboration, which could substantially further our understanding of the BRI.
The objective of this paper is to explore the structure and dynamics of scientific collaboration network among countries along the B&R. The paper will address the following two questions: (1) What is the structure of the scientific collaboration network?; and (2) How has the scientific collaboration network changed between 2000 and 2018? With the BRI as the research background and the country as the unit of analysis, this article uses bibliographical data from Clarivate Analytics’ Web of Science database, social network analysis, and visualization software to investigate the network properties, topological structure, spatial pattern, position of countries, core–periphery sets and the hierarchy of the network.
The main contribution of this study is fourfold. First, science is the core driving force for building a sustainable Belt and Road. Our focus is science collaboration rather than economic and infrastructure cooperation, which substantially further our understanding of the BRI. Second, there is a paucity of analysis of South-South cooperation. The B&R mainly involves developing countries or the global South, which provides a good chance to investigate South–South collaboration. This is the reason why this paper studies the B&R as a single geographic unit. Third, we use not only social network analysis, but also world system theory and dominant flow analysis to systematically analyze the inter-country collaboration in science in the B&R. Fourth, we take a dynamic view to investigate the evolution of collaboration network and demonstrate the ups and downs of counties in the network.
2. Literature Review
2.1. Science and Sustainable Belt and Road
As the BRI progresses, there are growing environmental concerns among scientists and non-governmental organizations. Tracy et al. [22] found that the Silk Road Economic Belt projects lacked strategic environmental impact assessment and transferred polluting industries from China to the Silk Road, which may create new environmental risks. According to World Wildlife Fund (WWF) reports [36], the geographical scope of the B&R was overlapped with 1739 biodiversity conservation areas, which had negative environmental impacts. Therefore, biodiversity protection should become a core value of the BRI [24]. The BRI could clash with environmental sustainability goals and face severe environmental challenges, such as habitat loss, pollution, the degradation of landscapes and greenhouse gas emissions [23]. However, those problems cannot be solved by any one nation alone. A growing body of studies calls for international scientific collaboration support for Belt and Road [8]. The Digital Silk Road, as a prime example, including 19 countries and seven international organizations, will improve environmental monitoring, share big data, extend applications, and promote international collaboration [35,37].
2.2. International Scientific Collaboration
In the era of the globalized knowledge economy, international scientific collaboration is an important way to gain exogenous knowledge and increase a country’s scientific capacity. The globalization of science increases the interconnectedness and interdependence between countries, resulting in the rise of collaboration network. There are a variety of reasons to account for international scientific collaboration, such as the international division of labor among researchers [38], the complex and nonlinear nature of technology [39], open innovation paradigm [40], global challenges [33], and information communication technology [41].
In recent years, a large body of studies has mainly focused on the growth of international collaboration in science, network analysis and visualization, and the topological structure of networks [42,43,44]. Social network analysis and the complex network, two promising tools, are extensively applied to reveal the structure of the collaboration network. On the basis of co-authorship data covering the six fields, Wagner and Leydesdorff [45] showed that international collaboration was a self-organized network and degrees of distribution followed a power law. Gui et al. [46] investigated the structure, dynamics, and determinants of international scientific collaboration in the period of 2000–2015 and indicated that traditional science powerhouses had occupied central positions in the network, including the USA, the UK, Germany, France, and Canada. International scientific collaboration had been dominated by a core group [43,47] and showed a clear core–periphery structure [48].
Some works have emphasized the impact of the network structure on node’s performance [49,50,51]. According to social network theory, a node’s output is dependent in part upon its position in the network structure [52]. Using United States Patent and Trademark Office (USPTO) patent collaboration data, Chen and Guan [53] found that the small world properties had an inverted-U-shaped relationship with national innovation output. Guan et al. [51] showed that collaboration network structure had a positive effect on country-level R&D efficiency. Gui et al. [54] demonstrated that occupying a central and advantageous network position, that is, higher degree centrality, structural holes and a small world quotient, would enhance national knowledge productivity.
Other studies concentrate on the determinants of international scientific collaboration [55,56,57]. Based on the gravity model, Montobbio and Sterzi [56] revealed that international technological collaboration depended positively upon technological proximity and common language, and negatively upon the strength of intellectual property rights (IPRs). Taking the global wine industry for example, Cassi et al. [58] confirmed that geographical and technological distance impeded international research collaboration and similar trade patterns boosted international scientific collaboration. Using the quadratic assignment procedure (QAP) analysis, Gui et al. [46] indicated that the number of international students was the most important determinant of international collaboration. To sum up, the determinants of scientific collaboration not only include multi-dimensional proximities (geographical distance, cognitive proximity, social proximity, organizational proximity and institutional proximity), but also comprise common language, former colonial relationships, economic size, innovative capacity, a country’s network position, and administrative barriers [44,56,57,58,59,60].
3. Data and Methods
3.1. Research Area
As more and more countries participate in the BRI, the geographic coverage of the BRI spans the globe. However, the core area is the strategic focus of the BRI. In addition, the core area is complete and continuous. Therefore, the regional consistency should be taken into consideration. According to the official Belt and Road Map (https://ydyl.tianditu.gov.cn/), we select 65 countries along the B&R as our research area, which is in line with the existing studies [28,29]. The countries are divided into six major regions based on World Bank’s classification by region: East Asia (two countries), South-East Asia (11 countries), South Asia (eight countries), Central Asia (five countries), West Asia and the Middle East (19 countries) and Central and Eastern Europe (20 countries), as shown in Figure 1.
3.2. Research Data
International scientific collaboration is widely measured by internationally co-authored papers in peer-reviewed journals [43,46], though this indicator has limitations [33,60]. The data is retrieved from Web of Science Core Citation Database (http://apps.webofknowledge.com/) because it includes high-quality scholarly journals published worldwide and is one of the best sources to study international collaborations in science. Our data cover all document types, such as articles, meeting abstracts, editorial material, and reviews, in the hope of providing a wide-ranging snapshot of scientific collaboration. Data is collected at two stages: (1) the first stage is data retrieval. We input the search expression “CU = Country/Region (name of country) AND PY = Year”, then click “Analyze Results”, and then choose the “Countries/Regions” field. The geocoding of publication data is aggregated by country between 2000 and 2018 and is saved as plain text. (2) The second stage is network construction. C++ program is used to construct country-by-country adjacency matrixes Xijt, where cell denotes the number of co-publications between country i and country j in year t. It is noted that the collaboration network is undirected and weighted.
3.3. Social Network Analysis
3.3.1. Centrality Measure
Degree centrality (CD) indicates the number of edges directly connected with node i [61]. In the network, degree centrality is the number of countries that country i collaborates with.
where aij represents an adjacency matrix, aij = 1 when a tie exists between country I, and country j, and aij = 0 otherwise.
Closeness centrality (CC) measures the average shortest distance between node i and all other nodes [61]. In the network, closeness centrality is the topological distance from a country to all other countries.
Between-ness centrality (CB) refers to the proportion of all geodesics between pairs of other nodes that pass through this node [62].
where Njk is the number of the shortest paths between Vj and Vk and Njk(i) is the number of the shortest paths that pass through Vi.
3.3.2. Core and Periphery Analysis
The world systems theory, developed by Wallerstein [63], highlights the unequal dependencies between countries. Developing countries depend heavily on established superpowers in science. In this sense, international science is similar to international trade. There are a lot of debates about the current Anglo-American academic hegemony [64,65,66]. According to Wallerstein’s stratified model [63], world systems constitute a tripartite division of countries into core, semi-periphery, and periphery. In order to provide a more fine-grained classification, we use four strata (core, strong semi-periphery, weak semi-periphery, and periphery) rather than three strata. It is noted that the four stratified model is widely used in empirical studies [46,67,68,69]. Specifically, structural equivalence and hierarchical clustering algorithms are applied to identify positions. To reflect line values, we select the Manhattan distance indices to calculate the dissimilarity. According to the dissimilarity coefficient, the whole network is divided into four subgroups [70]. PAJEK software is used to detect core-periphery structures in this study [71].
3.3.3. Dominant Flow Analysis
Nystuen and Dacey [72] developed dominant flow analysis, which is based on the core idea that the strongest ties between nodal pairs are more important than the remaining ties. It is widely applied to uncover the hierarchy of networks, such as the world maritime network [73], global airline network [74] and international collaboration network [46]. According to the size of node and the level of interaction between nodes, nodes can be classified into independent, subdominant, and affiliated nodes. More specifically, independent nodes are defined as those whose largest flow is to a smaller node; subdominant nodes have its largest flow to a larger node and also absorbs the maximum direct ties from a smaller node—affiliated nodes refers to those who fail to have the largest flow directed to. In this paper, the number of co-authored papers indicates the strength of interaction between nodes, and the total research output represents the size of the node.
4. Results
4.1. Network Statistics
The size of collaboration network has gradually expanded. In terms of the number of nodes (Table 1), there were 60 countries joining in scientific collaboration in 2000. By 2018, the number of nations increased to 65 countries, which means that the network included all countries and formed a connected graph. At the same time, links between the countries have significantly increased. The number of edges was 571 in 2000, whereas this value increased to 1707 in 2018. In contrast, the latter was almost three times as large as that of the former.
International scientific collaboration in the B&R is closer and closer over time. On the one hand, the network density had improved rapidly from 0.32 in 2000 to 0.82 in 2018, implying that the network was increasingly dense. On the other hand, the average degree rose dramatically from 19.03 to 52.52 in the period under study, suggesting a noticeable rise in the average number of partners.
The cohesion of network in the B&R has strengthened. The average clustering coefficient gradually increased from 0.6 in 2000 to 0.91 in 2018, much greater than a random network of the same size (0.32–0.81), showing that the network was highly clustered. The average path length had experienced a decline from 1.75 to 1.18 between 2000 and 2018, suggesting a narrowing network distance among countries.
Decentralization is significant in the network. Three indices—degree centralization, closeness centralization and between-ness centralization—are relatively low (less than 0.5) and show a downward trend. Between 2000 and 2018, degree centralization had fallen from 0.42 to 0.17, closeness centralization had dropped from 0.41 to 0.25, and between-ness centralization had decreased from 0.07 to 0.01. Similarly, the de-centralization trend is observed in global scientific collaboration [46], scientific activity [75], and scientific visibility [76].
4.2. Topology Structure
Figure 2 shows that the collaboration network was relatively sparse and weakly connected in 2000. The total number of lines was 571. However, there were 177 lines with value equal to 1, accounting for 31% of total lines, which meant that the majority of the number of co-authored papers between countries were low. The strongest partnership was between Russia and Poland, publishing 415 co-authored papers, headed the list. In the 10 largest collaborations between countries, Russia was a partner for five countries. In addition, Russia was the largest collaborator for 22 nations and cooperated with 42 countries. Therefore, Russia was an undisputed hub and center of international collaboration. Topologically, hierarchical “hub-and-spoke” or star-shaped structures, as well as triangulated structures were observed. Links diffused star-shaped from core countries (Russia, Poland and China) to other countries. Russia, Poland, Ukraine, Czech, and Slovakia formed a lot of triangle relationships, which were also called triadic closure.
The number of countries participating in international collaboration increased to 65 and country pairs dramatically rose to 1707 in 2018. Inter-country scientific collaboration was developing at a high speed. There were 160 lines with value equal to one, only about 9.3% share of total lines. To our surprise, China and Singapore collaborations were the strongest partnership and outnumbered all other international pairs, reaching 5084 papers. The pattern of scientific collaboration has undergone fundamental changes, most notably the rise of China. The dominance of Russia was substituted by China, which became the center of collaboration because it collaborated with 63 countries and was the most important partner for 15 nations. In addition, China was a partner in five of the top 10 partnerships. We also found that India, Saudi Arabia, Malaysia, and Poland became emerging centers of regional collaboration.
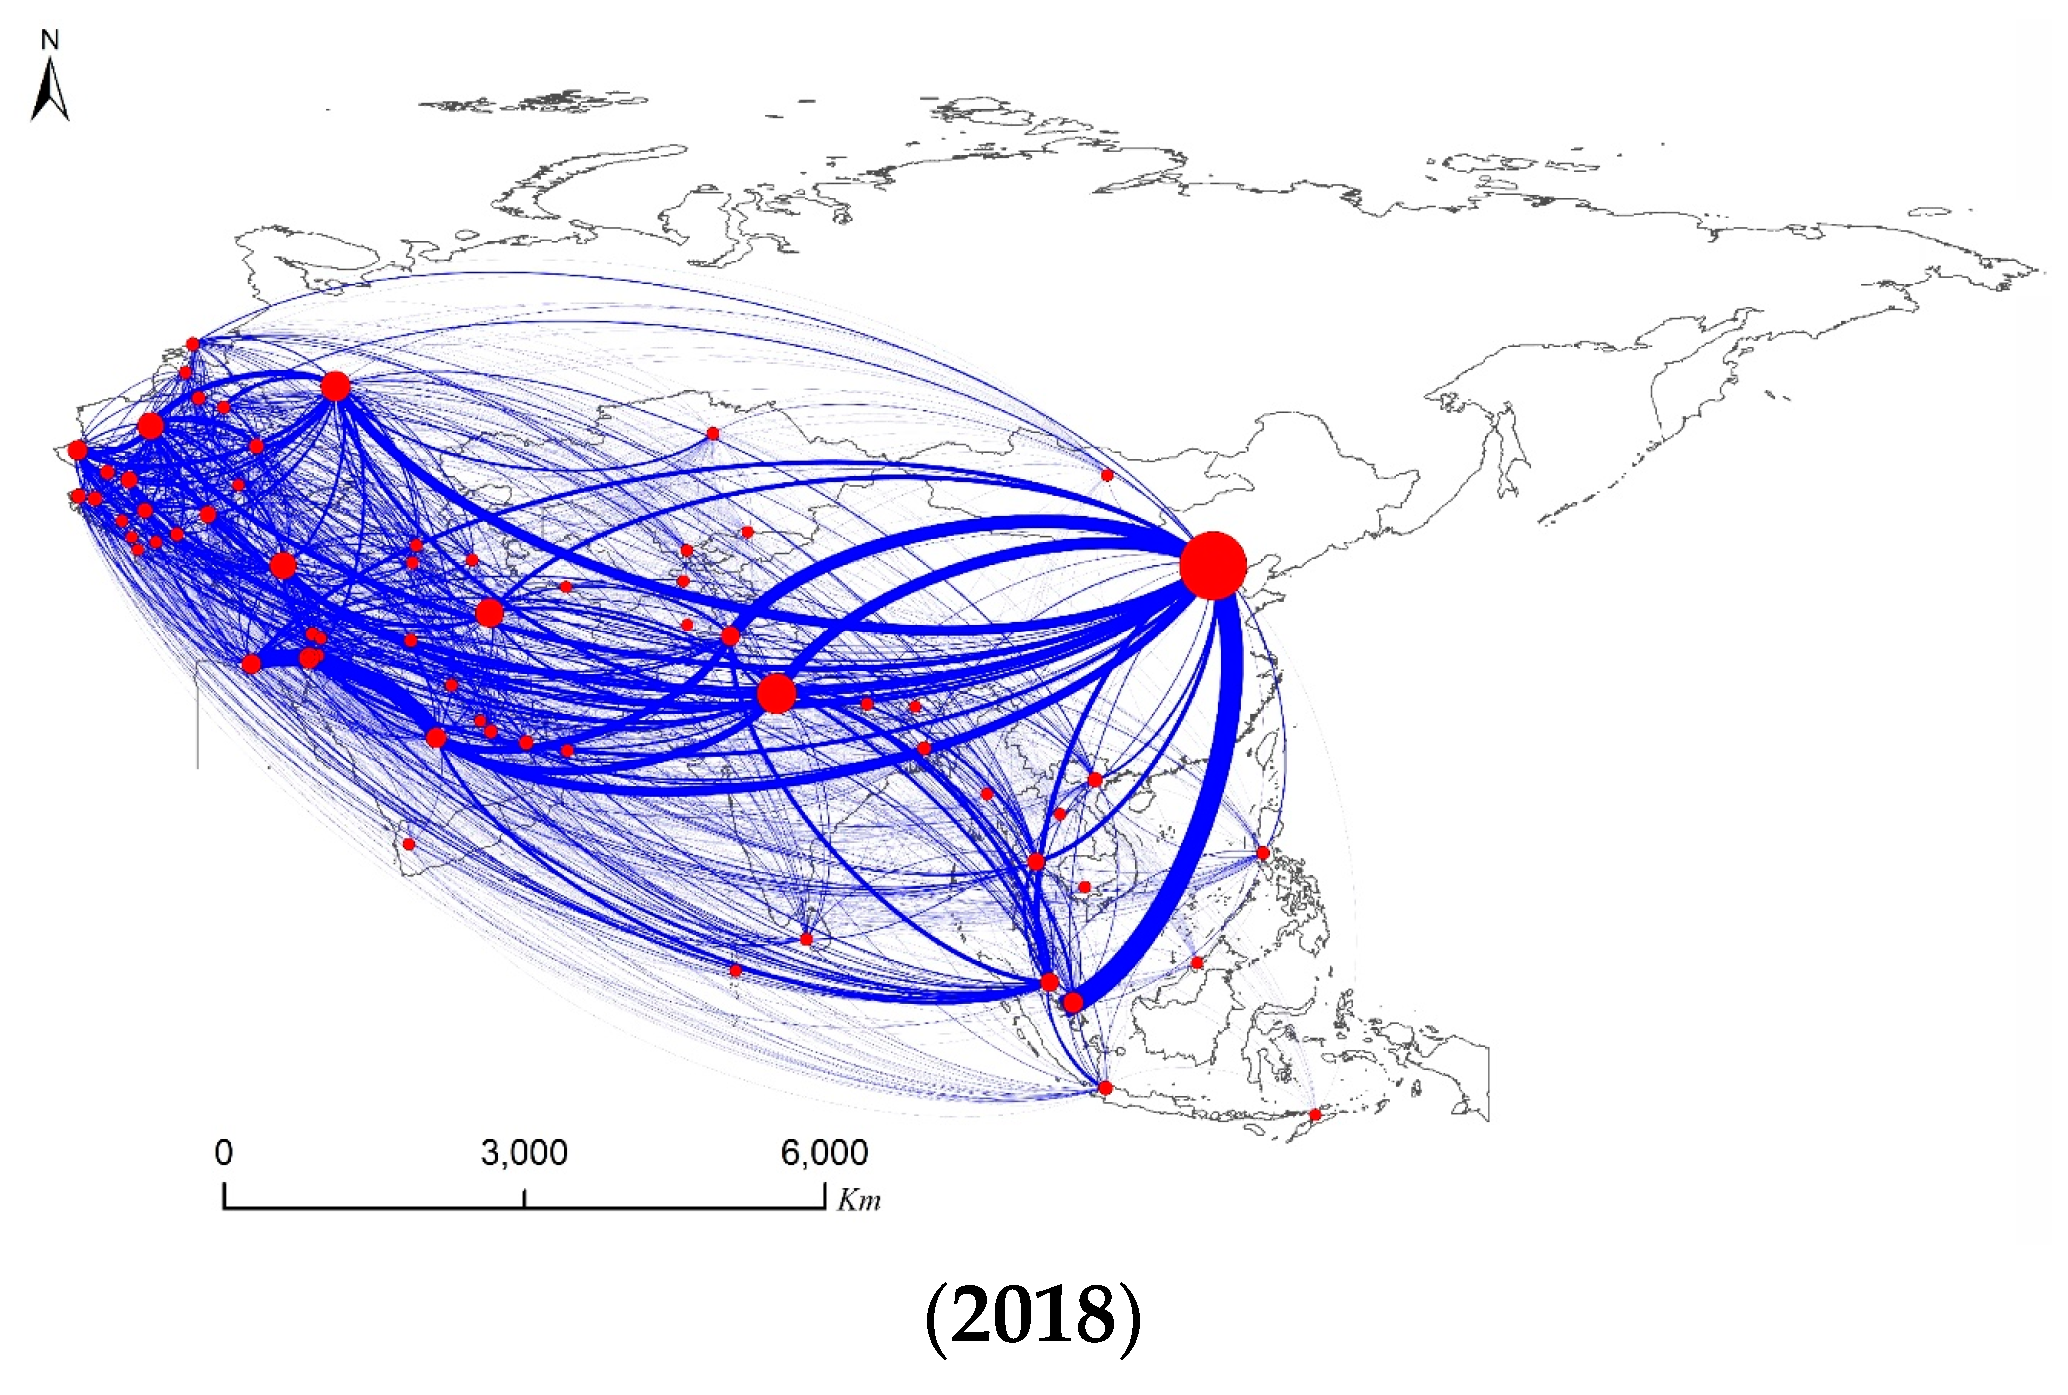
4.3. Spatial Pattern
The scientific collaboration among countries along the B&R is mapped using ArcGIS and Gephi (Figure 3). In terms of the geography, the spatial pattern of ‘strong Western and weak Eastern’ was clearly evident in 2000. Countries in Eastern Europe had a stronger internal tie than those in other regions. For instance, the collaboration between Russia and Poland (415) was the largest, followed by Russia and Ukraine (351), Poland and Ukraine (243), Russia and Czech (203), Slovakia and Czech (189), Poland and Czech (159). Israel and Russia (181) also had close links, ranked eighth. In the eastern region, the outstanding international collaborations only included China and Singapore (332) and China and India (127), ranking third and tenth respectively. In addition, the long-distance collaborations were very few and a large amount of bilateral partnerships occurred between neighboring countries.
The rise of the collaboration network is reshaping the scientific landscape in the B&R. The emerging scientific nations, such as China, India, Turkey, Iran, and Poland, are rapidly rising. “Strong Western and weak Eastern” was replaced by “strong Eastern and weak Western”, which was the principal characteristic of the spatial pattern in 2018. China and Singapore were the top collaborators, producing 5084 co-authored papers, and surpassed all other country pairs. They were followed by China and Pakistan (3052), China and India (2673), China and Saudi Arabia (2184), Pakistan and Saudi Arabia (1855), and India and Saudi Arabia (1839). In western region, there were only two links in the top 10 country pairs, which were Poland and Czech (1510), Poland-Russia (1390), ranking ninth and tenth respectively. To our surprise, Egypt and Saudi Arabia had the second largest international collaboration, reaching 3760 co-publications. Moreover, long-distance collaborations rapidly increased, which contributed to the diffusion of science.
4.4. Position of Countries
Table 2 shows the top 15 nations ranked by degree, closeness, and between-ness centrality. In 2000, the countries with the highest degree centrality were spatially clustered in western countries, including Turkey, Russia, Israel, Poland, Hungary, Czech, Egypt, Romania, Ukraine, Bulgaria, and Belarus. In contrast, there were significant changes in 2018. China became one of the most connected nodes, having 63 partners. The top countries were geographically concentrated in the eastern region, such as China, India Malaysia, Pakistan, Thailand, and Bangladesh. Iran, Kazakhstan, Saudi Arabia, and Jordan had increased their degree of centrality and influence in the network, and entered top positions. However, Hungary, Czech, Romania, Singapore, Ukraine, and Belarus disappeared from the list.
The closeness centrality has similar trend with degree centrality (Table 2). Unlike degree centrality, Pakistan surpassed Ukraine in the rank of closeness centrality in 2000. Thailand replaced Bulgaria in the list. It is interesting that Turkey had a high closeness centrality, which could be attributed to a favorable geographical position (between Europe and Asia) and religious beliefs (Islamic world).
By comparison, between-ness centrality presents noticeable differentiation. In 2000, India had the highest between-ness centrality, followed by Russia, Turkey, China, Poland, Egypt, and Israel. However, Turkey replaced India in 2018, becoming the most important node. Interestingly, Kazakhstan, Kyrgyzstan, and Uzbekistan had a high centrality. Further analysis showed that Turkmenistan only cooperated with Kazakhstan, Kyrgyzstan, and Uzbekistan, implying that those countries played a bridge or intermediary role in connecting Turkmenistan with other countries.
4.5. Core-Periphery Structure
The scientific collaboration network among countries along the B&R has obvious core-periphery structure (Figure 4), which is classified into four categories: core, strong semi-periphery, semi-periphery, and periphery. Russia, Poland, and Ukraine, which came from Central and Eastern Europe, made up the core group in 2000. There were many and strong ties within the core and between the core and other positions. The strong semi-periphery set contained nine nations, including China, Romania, Slovakia, India, Singapore, Israel, Hungary, Bulgaria, and Czech. They were regional leaders in science and played the role of an intermediary between core and periphery. This set had relatively intense and strong internal ties, such as China-Singapore, Czech-Slovakia, and China-India. The semi-periphery set comprised 14 nations, for instance, Georgia, Turkey, Latvia, Slovenia, Estonia, and Belarus, etc. A principal feature was that ties within the group were few and weak. The remaining countries were classified as the peripheral set, which included 34 countries, mainly from South-East Asia, Central Asia, and West Asia. Because of low economic development, these countries had a finite number of investments in science.
By way of contrast, the core–periphery structure of the network presented noticeable changes in 2018. China, Turkey, Czech and Hungary moved up to the core group. However, Ukraine dropped out of the core set. Overall, the core position remained dominated by Central and Eastern Europe. The rise of China and Turkey would result in a multi-centric core emerging. This finding confirmed the de-centralization trend in network statistics. The number of countries in strong semi-periphery set reduced by one. Malaysia, Pakistan, Thailand, Iran, Saudi Arabia and Egypt moved up from the periphery to the strong semi-periphery, suggesting that those countries had strengthened scientific productivity. The semi-periphery set showed an obvious expansion, and the number increased to 18. Some countries moved up from the periphery to semi-periphery, including Serbia, Slovakia, Qatar, Sri Lanka, United Arab Emirates, Azerbaijan, Bulgaria and Romania. However, Kazakhstan, Uzbekistan, Macedonia, and Moldova fell from semi-periphery to periphery. The peripheral positions consisted of 33 countries, such as Bangladesh, Philippines, Vietnam, Indonesia, Iraq, Oman, Palestine, and Yemen. Links within the periphery were minimal, which may be attributed to a poor economic situation, lack of scientific culture, or turbulent political environment.
In summary, the world systems theory is appropriate to understand the international scientific collaboration. Core nations are the source of knowledge spillover and the leaders of leading-edge research [46]. Consequently, they become the primary partners for peripheral countries. Because of a limited scientific research capacity, peripheral countries are the knowledge spillover recipients and cutting-edge science followers. According to the algorithmic technique, rather than a priori criteria, we identified the core group and found a number of countries with an upward trend in the network. It is noted that core and periphery are relative rather than absolute [68].
4.6. Hierarchy of Countries
This last analysis tries to uncover the hierarchy of network (Figure 5). In 2000, the whole collaboration network was split into three distinct sub-networks. The largest subnetwork was dominated by Russia and included 31 nations that heavily concentrated in Central and Eastern Europe and Central Asia. This may be seen in light of the historical heritage of the Soviet Union. Therefore, historical links did give rise to strong internal collaborations [33,46]. Slovenia, Israel, Tukey, Romania, Ukraine, Czech, and Yugoslavia were subdominant nodes. China was the center of the second largest sub-network. The nodal region highly clustered in South-East Asia and South Asia, which may be attributed to the similar culture, particularly the collaboration between China and Singapore. Thailand, Philippines, India, and Singapore appeared as the second-tier nodes. Egypt dominated the third subnetwork, and the geographic coverage concentrated in West Asia and the Middle East, which may be explained by the shared language. Arabic-speaking countries (Egypt, Saudi Arabia and the United Arab Emirates) had strong links to each other.
In 2018, major changes greatly modified the network. China, an emerging science superpower [77], became the core of the biggest subnetwork, and dominated a much bigger scope of scientific collaboration. The number of countries in the largest subset had risen from 31 in 2000 to 40 in 2018. A number of countries were under the direct influence of China and turning to China for support and collaboration. The spatial influence of China was spreading across the South-East Asia, South Asia, and Central Asia. The remaining countries were polarized by Russia, Thailand, Malaysia, India and Turkey, as they were subdominant nodes. The significance of historical links remained obvious because Russia was the largest collaborator for Commonwealth of Independent States (CIS) member states. Poland emerged as an independent hub in the second biggest set, which included 16 countries that mainly came from Central and Eastern Europe. Czech, Estonia, Romania and Serbia directly controlled the rest of the scope. Egypt gave way to oil-rich Saudi Arabia, a science leader in the Arabic world. Saudi Arabia paid attention to higher education. It made the most of financial might to prioritize expanding the frontiers of science [78], and supported and set up world first-class universities, such as King Abdulaziz University, King Saud University, and King Abdullah University of Science and Technology. The only subdominant node was Egypt, connecting with Lebanon.
5. Discussion
Although a considerable number of studies have discussed the BRI’s economic, geopolitical and environmental impacts, there is a scarcity of analysis on the influence of the BRI on the world of science. To build capacity and share knowledge, South-South collaboration develops quickly. The BRI provides a good chance to investigate South-South collaboration. Based on bibliographical data from the Web of Science database, this study uses social network analysis to explore the structure and dynamic of scientific collaboration network among countries along the B&R in the period 2000 to 2018.
Our analysis shows that the number of countries participating in the collaboration network gradually increases and inter-country cooperation happens frequent. The center of gravity of network moves from the West to the East, and Russia is gradually giving way to China. The spatial pattern of the network evolves from ‘‘strong Western and weak Eastern’’ to ‘‘weak Western and strong Eastern’’ due to the decline of Central and Eastern Europe and the rise of the Asia-Pacific region. As a result, India, China, and Turkey rank as the top three centralities, implying that those countries occupy central positions. Iran, Malaysia, Pakistan, and Thailand have increased their centrality and influence in the network. However, Russia has shown an obvious decline in terms of ranking. Using block modeling analysis and hierarchical clustering algorithms, we find that the collaboration network is a typical core–periphery structure. China, Poland, Russia, Turkey, Czech, and Hungary made up the core group in 2018. The last analysis shows that historical links, shared language, and culture will create a stronger collaboration and identifying China, Poland as well as Saudi Arabia as dominant nodes.
This study has several important policy recommendations. First, countries should realize the significance of science and heavily increase investment in science, higher education and R&D. A majority of countries lack science capacity and scientific culture, resulting in the low number of co-authored papers between countries. Since the mid-1990s, the Chinese government came up with the strategy of “rejuvenating the nation with science, technology, and education,” and has introduced measures to stimulate the development of science and technology. China has become the second largest producer of science publications, second only to the USA. The rise of China in S&T can be attributed to a stable political environment, the coherence of S&T policy, increasing R&D investment, the reform of its S&T system, and open innovation [33,79]. The China model provides an alternative path to develop S&T for other developing countries. Second, it is necessary to set up and broaden the cooperation platforms. Building a sustainable Belt and Road and addressing the common challenges call for coordinated efforts. The Alliance of International Science Organizations in the Belt and Road Region (ANSO) is a good example, which has attracted 37 members spanning the globe and makes a great contribution to strengthen international scientific collaboration [4]. Third, international science needs not only the top-down strength, but also bottom-up collaboration. Currently, scientific collaboration among countries along the B&R is largely conducted through top-down strength, that is, inter-governmental partnerships. However, the primary forces of cooperation are scientists themselves [33]. Governments are to help and support scientists to create and sustain flourishing partnerships [32].
International scientific collaboration in the B&R is an interesting and important topic and can be further developed. First, international scientific collaboration is an open system, which not only occurs in the local or internal scale (between countries within the B&R region), but also takes place at a global or external scale (between those countries and the other countries, such as the USA, the UK, Germany and Canada). Neglecting the external links will produce a partial and incomplete result. The United States remains the largest collaborator for many nations, rather than China. Second, this paper does not explore the factors of scientific collaboration. Future work can focus on the impacts of spatial distance, culture, language, religious beliefs, international students, administrative barriers, and economic development on international collaboration. Third, this study does not identify key actors, which makes science policies difficult to implement. The primary actors with respect to cooperation are universities, enterprises and research institutions, all of which play a significant role in building bridges with other countries. Fourth, the difference-in-difference model can be employed to assess whether the BRI facilitates international scientific collaboration, and provides some policy-making opportunities for the B&R countries.
Author Contributions
This study was conceptualized by D.D. and C.L.; Q.G. collected and analyzed the data; Q.G. and D.D. wrote the manuscript; C.L. edited and revised the article. All authors read and approved the final manuscript.
Funding
This work was funded by National Natural Science Foundation of China, grant number 41571123, 41901152 and 41901139, ECNU (East China Normal University) Academic Innovation Promotion Program for Future Scientists, grant number WLKXJ2019-002, Strategic Priority Research Program of Chinese Academy of Sciences, grant number XDA20100311, and Philosophical and Social Science Foundation of Shanghai, grant number 2018EJL003.
Acknowledgments
The authors would like to thank the two anonymous reviewers for their comments and suggestions.
Conflicts of Interest
The authors declare no conflict of interest.
References
- Shen, S.; Chan, W. A comparative study of the Belt and Road Initiative and the Marshall plan. Palgrave Commun. 2018, 4, 32. [Google Scholar] [CrossRef]
- National Development and Reform Commission, Vision and Actions on Jointly Building Silk Road Economic Belt and 21st-Century Maritime Silk Road. 2015. Available online: http://en.ndrc.gov.cn/newsrelease/201503/t20150330669367.html (accessed on 15 June 2019).
- Chin, H.; He, W. The Belt and Road Initiative: 65 Countries and Beyond. 2016. Available online: https://www.fbicgroup.com/sites/default/files/B&R_Initiative_65_Countries_and_Beyond.pdf (accessed on 20 June 2017).
- Masood, E. All roads lead to China. Nature 2019, 569, 20–23. [Google Scholar] [CrossRef]
- Li, P.Y.; Qian, H.; Howard, K.W.F.; Wu, J.H. Building a new and sustainable “Silk Road economic belt”. Environ. Earth Sci. 2015, 74, 7267–7270. [Google Scholar] [CrossRef]
- Chen, Q.; Cheng, J.Q.; Wu, Z.Q. Evolution of the cultural trade network in “the Belt and Road” region: Implication for global cultural sustainability. Available online: https://www.mdpi.com/2071-1050/11/10/2744 (accessed on 22 September 2019).
- Rauf, A.; Liu, X.X.; Amin, W.; Ozturk, I.; Rehman, O.U.; Hafeez, M. Testing EKC hypothesis with energy and sustainable development challenges: A fresh evidence from belt and road initiative economies. Environ. Sci. Pollut. Res. 2018, 25, 32066–32080. [Google Scholar] [CrossRef]
- Horvat, M.; Gong, P. Science support for Belt and Road. Science 2019, 364, 513. [Google Scholar] [CrossRef]
- Jia, H.P.; Guo, H.D. Scientific collaborations shine on Belt and Road. Natl. Sci. Rev. 2017, 4, 652–657. [Google Scholar] [CrossRef] [Green Version]
- Ferdinand, P. Westward ho-the China dream and “one belt, one road”: Chinese foreign policy under Xi Jinping. Int. Aff. 2016, 92, 941–957. [Google Scholar] [CrossRef]
- Wang, Y. Offensive for defensive: The belt and road initiative and China’s new grand strategy. Pac. Rev. 2016, 29, 455–463. [Google Scholar] [CrossRef]
- Zhou, W.F.; Esteban, M. Beyond balancing: China’s approach towards the Belt and Road Initiative. J. Contemp. China 2018, 27, 487–501. [Google Scholar] [CrossRef]
- Du, J.L.; Zhang, Y.F. Does One Belt One Road initiative promote Chinese overseas direct investment? China Econ. Rev. 2018, 47, 189–205. [Google Scholar] [CrossRef]
- Liu, H.Y.; Tang, Y.K.; Chen, X.L.; Poznanska, J. The determinants of Chinese outward FDI in countries along “One Belt One Road”. Emerg. Mark. Financ. Trade 2017, 53, 1374–1387. [Google Scholar] [CrossRef]
- Liu, W.D.; Dunford, M. Inclusive globalization: Unpacking China’s Belt and Road Initiative. Area Dev. Policy 2016, 1, 323–340. [Google Scholar] [CrossRef]
- Dunford, M.; Liu, W.D. Chinese perspectives on the Belt and Road Initiative. Camb. J. Reg. Econ. Soc. 2019, 12, 145–165. [Google Scholar] [CrossRef]
- Huang, Y.P. Understanding China’s Belt & Road Initiative: Motivation, framework and assessment. China Econ. Rev. 2016, 40, 314–321. [Google Scholar]
- Duan, F.; Ji, Q.; Liu, B.Y.; Fan, Y. Energy investment risk assessment for nations along China’s Belt & Road Initiative. J. Clean. Prod. 2018, 170, 535–547. [Google Scholar]
- Wang, L.H.; Zheng, Y.B.; Ducruet, C.; Zhang, F. Investment strategy of Chinese terminal operators along the “21st-Century Maritime Silk Road”. Available online: https://www.mdpi.com/2071-1050/11/7/2066 (accessed on 22 September 2019).
- Lee, P.T.W.; Hu, Z.H.; Lee, S.J.; Choi, K.S.; Shin, S.H. Research trends and agenda on the Belt and Road (B&R) initiative with a focus on maritime transport. Marit. Policy Manag. 2018, 45, 282–300. [Google Scholar]
- Wang, L.H.; Zhu, Y.; Ducruet, C.; Bunel, M.; Lau, Y.Y. From hierarchy to networking: The evolution of the “twenty-first-century Maritime Silk Road” container shipping system. Transp. Rev. 2018, 38, 416–435. [Google Scholar] [CrossRef]
- Tracy, E.F.; Shvarts, E.; Simonov, E.; Babenko, M. China’s new Eurasian ambitions: The environmental risks of the Silk Road Economic Belt. Eurasian Geogr. Econ. 2017, 58, 56–88. [Google Scholar] [CrossRef]
- Ascensao, F.; Fahrig, L.; Clevenger, A.P.; Corlett, R.T.; Jaeger, J.A.G.; Laurance, W.F.; Pereira, H.M. Environmental challenges for the Belt and Road Initiative. Nat. Sustain. 2018, 1, 206–209. [Google Scholar] [CrossRef]
- Lechner, A.M.; Chan, F.K.S.; Campos-Arceiz, A. Biodiversity conservation should be a core value of China’s Belt and Road Initiative. Nat. Ecol. Evol. 2018, 2, 408–409. [Google Scholar] [CrossRef]
- Shi, K.F.; Yu, B.L.; Huang, C.; Wu, J.P.; Sun, X.F. Exploring spatiotemporal patterns of electric power consumption in countries along the Belt and Road. Energy 2018, 150, 847–859. [Google Scholar] [CrossRef]
- Liu, Y.Y.; Hao, Y. The dynamic links between CO2 emissions, energy consumption and economic development in the countries along “the Belt and Road”. Sci. Total Environ. 2018, 645, 674–683. [Google Scholar] [CrossRef] [PubMed]
- Howard, K.W.F.; Howard, K.K. The new “Silk Road Economic Belt” as a threat to the sustainable management of Central Asia’s transboundary water resources. Environ. Earth Sci. 2016, 75, 976. [Google Scholar] [CrossRef]
- Chen, M.X.; Sui, Y.W.; Liu, W.D.; Liu, H.; Huang, Y.H. Urbanization patterns and poverty reduction: A new perspective to explore the countries along the Belt and Road. Habitat Int. 2019, 84, 1–14. [Google Scholar] [CrossRef]
- Liu, C.L.; Xu, J.Q.; Zhang, H. Competitiveness or complementarity? A dynamic network analysis of international agri-trade along the Belt and Road. Appl. Spatial Anal. 2019, 1–26. [Google Scholar] [CrossRef]
- Zhang, Y.; Zhang, J.H.; Tian, Q.; Liu, Z.H.; Zhang, H.L. Virtual water trade of agricultural products: A new perspective to explore the Belt and Road. Sci. Total Environ. 2018, 622, 988–996. [Google Scholar] [CrossRef]
- Freeman, R.B. Globalization of scientific and engineering talent: International mobility of students, workers, and ideas and the world economy. Econ. Innov. New Technol. 2010, 19, 393–406. [Google Scholar] [CrossRef]
- Adams, J. The fourth age of research. Nature 2013, 497, 557–560. [Google Scholar] [CrossRef]
- Royal Society. Knowledge, Networks and Nations: Global Scientific Collaboration in the 21st Century; The Royal Society: London, UK, 2011. [Google Scholar]
- Marshall, A. Principles of Economics, 8th ed.; Macmillan: London, UK, 1890. [Google Scholar]
- Guo, H.D.; Liu, J.; Qiu, Y.B.; Menenti, M.; Chen, F.; Uhlir, P.F.; Zhang, L.; van Genderen, J.; Liang, D.; Natarajan, I.; et al. The Digital Belt and Road program in support of regional sustainability. Int. J. Digit. Earth 2018, 11, 657–669. [Google Scholar] [CrossRef]
- World Wildlife Fund. Available online: https://go.nature.com/2v3SwoG (accessed on 23 May 2018).
- Guo, H.D. Steps to the digital Silk Road. Nature 2018, 554, 25–27. [Google Scholar]
- Niosi, J.; Bellon, B. The global interdependence of national innovation systems-Evidence, limits, and implications. Technol. Soc. 1994, 16, 173–197. [Google Scholar] [CrossRef]
- Rosenberg, N. Inside the Black Box: Technology and Economics; Cambridge University Press: Cambridge, UK, 1982. [Google Scholar]
- Chesbrough, H.W. Open Innovation: The New Imperative for Creating and Profiting from Technology; Harvard Business School Press: Cambridge, MA, USA, 2003. [Google Scholar]
- Adams, J.; Loach, T. A well-connected world. Nature 2015, 527, S58–S59. [Google Scholar] [CrossRef]
- Nam, Y.; Barnett, G.A. Globalization of technology: Network analysis of global patents and trademarks. Technol. Soc. Chang. 2011, 78, 1471–1485. [Google Scholar] [CrossRef]
- Leydesdorff, L.; Wagner, C.S.; Park, H.W.; Adams, J. International collaboration in science: The global map and the network. arXiv 2013, 22, 87–94. [Google Scholar] [CrossRef]
- De Prato, G.; Nepelski, D. Global technological collaboration network: Network analysis of international co-inventions. J. Technol. Transf. 2014, 39, 358–375. [Google Scholar] [CrossRef]
- Wagner, C.S.; Leydesdorff, L. Network structure, self-organization, and the growth of international collaboration in science. Res. Policy 2005, 34, 1608–1618. [Google Scholar] [CrossRef] [Green Version]
- Gui, Q.C.; Liu, C.L.; Du, D.B. Globalization of science and international scientific collaboration: A network perspective. Geoforum 2019, 105, 1–12. [Google Scholar] [CrossRef]
- Leydesdorff, L.; Wagner, C.S. International collaboration in science and the formation of a core group. J. Informetr. 2008, 2, 317–325. [Google Scholar] [CrossRef] [Green Version]
- Chen, Z.F.; Guan, J.C. The core-peripheral structure of international knowledge flows: Evidence from patent citation data. RD Manag. 2016, 46, 62–79. [Google Scholar] [CrossRef]
- Fleming, L.; King, C.; Juda, A. Small worlds and regional innovation. Organ. Sci. 2007, 18, 938–954. [Google Scholar] [CrossRef]
- Zhang, G.P.; Guan, J.C.; Liu, X.L. The impact of small world on patent productivity in China. Scientometrics 2014, 98, 945–960. [Google Scholar] [CrossRef]
- Guan, J.C.; Zuo, K.R.; Chen, K.H.; Yam, R.C.M. Does country-level R&D efficiency benefit from the collaboration network structure? Res. Policy 2016, 45, 770–784. [Google Scholar]
- Borgatti, S.P.; Mehra, A.; Brass, D.J.; Labianca, G. Network Analysis in the Social Sciences. Science 2009, 323, 892–895. [Google Scholar] [CrossRef] [Green Version]
- Chen, Z.F.; Guan, J.C. The impact of small world on innovation: An empirical study of 16 countries. J. Informetr. 2010, 4, 97–106. [Google Scholar] [CrossRef]
- Gui, Q.C.; Liu, C.L.; Du, D.B. Does network position foster knowledge production? Evidence from international scientific collaboration network. Growth Chang. 2018, 49, 594–611. [Google Scholar] [CrossRef]
- Plotnikova, T.; Rake, B. Collaboration in pharmaceutical research: Exploration of country-level determinants. Scientometrics 2014, 98, 1173–1202. [Google Scholar] [CrossRef]
- Montobbio, F.; Sterzi, V. The globalization of technology in emerging markets: A gravity model on the determinants of international patent collaborations. World Dev. 2013, 44, 281–299. [Google Scholar] [CrossRef]
- Gui, Q.; Liu, C.; Du, D. International Knowledge Flows and the Role of Proximity. Growth Chang. 2018, 49, 532–547. [Google Scholar] [CrossRef]
- Cassi, L.; Morrison, A.; Rabellotti, R. Proximity and scientific collaboration: Evidence from the global wine industry. Tijdschr. Voor Econ. Soc. Geogr. 2015, 106, 205–219. [Google Scholar] [CrossRef]
- Orazbayev, S. International knowledge flows and the administrative barriers to mobility. Res. Policy 2017, 46, 1655–1665. [Google Scholar] [CrossRef] [Green Version]
- Cantner, U.; Rake, B. International research networks in pharmaceuticals: Structure and dynamics. Res. Policy 2014, 43, 333–348. [Google Scholar] [CrossRef] [Green Version]
- Freeman, L.C. Centrality in social networks conceptual clarification. Soc. Netw. 1978, 1, 215–239. [Google Scholar] [CrossRef]
- Freeman, L.C. A set of measures of centrality based on betweenness. Sociometry 1977, 40, 35–41. [Google Scholar] [CrossRef]
- Wallerstein, I. The Modern World System; Academic Press: New York, NY, USA, 1974. [Google Scholar]
- Berg, L.D. Scaling knowledge: Towards a critical geography of critical geographies. Geoforum 2004, 35, 553–558. [Google Scholar] [CrossRef]
- Steinberg, P.E. Internationalism, hegemony, community, and the mega-conference: A response to Lawrence Berg. ACME 2009, 8, 552–558. [Google Scholar]
- Jons, H.; Hoyler, M. Global geographies of higher education: The perspective of world university rankings. Geoforum 2013, 46, 45–59. [Google Scholar] [CrossRef] [Green Version]
- Nemeth, R.J.; Smith, D.A. International trade and world-system structure: A multiple network analysis. Review 1985, 8, 517–560. [Google Scholar]
- Smith, D.A.; White, D.R. Structure and dynamics of the global economy: Network analysis of international-trade 1965–1980. Soc. Forces 1992, 70, 857–893. [Google Scholar] [CrossRef]
- Cassi, L.; Morrison, A.; Ter Wal, A.L.J. The evolution of trade and scientific collaboration networks in the global wine sector: A longitudinal study using network analysis. Econ. Geogr. 2012, 88, 311–334. [Google Scholar] [CrossRef]
- De Nooy, W.; Mrvar, A.; Batagelj, V. Exploratory Social Network Analysis with Pajek; Cambridge University Press: New York, NY, USA, 2011. [Google Scholar]
- Batagelj, V.; Mrvar, A. Pajek-program for large network analysis. Connections 1998, 21, 47–57. [Google Scholar]
- Nystuen, J.D.; Dacey, M.F. A graph theory interpretation of nodal regions. Papers Regional Sci. Assoc. 1961, 7, 29–42. [Google Scholar] [CrossRef] [Green Version]
- Ducruet, C.; Cuyala, S.; El Hosni, A. Maritime networks as systems of cities: The long-term interdependencies between global shipping flows and urban development (1890–2010). J. Transp. Geogr. 2018, 66, 340–355. [Google Scholar] [CrossRef]
- Grubesic, T.H.; Matisziw, T.C.; Zook, M.A. Global airline networks and nodal regions. GeoJournal 2008, 71, 53–66. [Google Scholar] [CrossRef]
- Grossetti, M.; Eckert, D.; Gingras, Y.; Jegou, L.; Lariviere, V.; Milard, B. Cities and the geographical deconcentration of scientific activity: A multilevel analysis of publications (1987–2007). Urban Stud. 2014, 51, 2219–2234. [Google Scholar] [CrossRef]
- Maisonobe, M.; Grossetti, M.; Milard, B.; Jegou, L.; Eckert, D. The global geography of scientific visibility: A deconcentration process (1999–2011). Scientometrics 2017, 113, 479–493. [Google Scholar] [CrossRef]
- Plume, A. Tipping the balance: The rise of China as a science superpower. Res. Trends 2011, 22, 11–12. [Google Scholar]
- Amer, P. Making the most of financial might. Nature 2016, 532, S10–S12. [Google Scholar] [CrossRef] [Green Version]
- Cao, C.; Suttmeier, R.P. Challenges of S & T system reform in China. Science 2017, 355, 1019–1021. [Google Scholar]
Figure 1.
Spatial distribution of 65 countries along the B&R.

Figure 2.
Topological structure of scientific collaboration network along the B&R (2000 and 2018).

Figure 3.
Spatial patterns of scientific collaboration network along the B&R (2000 and 2018).


Figure 4.
Core-periphery structure of scientific collaboration network along the B&R (2000 and 2018).
Figure 4.
Core-periphery structure of scientific collaboration network along the B&R (2000 and 2018).

Figure 5.
Hierarchy of scientific collaboration network along the B&R (2000 and 2018).


Table 1.
Topological characteristics of scientific collaboration network.
| Indicators | 2000 | 2013 | 2018 |
|---|---|---|---|
| Nodes | 60 | 63 | 65 |
| Edges | 571 | 1213 | 1707 |
| Density | 0.32 | 0.62 | 0.82 |
| Average degree | 19.03 | 38.51 | 52.52 |
| Diameter | 3 | 3 | 3 |
| Average clustering coefficient | 0.6 | 0.78 | 0.91 |
| Average distance | 1.75 | 1.38 | 1.18 |
| Degree centralization | 0.42 | 0.34 | 0.17 |
| Between-ness centralization | 0.07 | 0.03 | 0.01 |
| Closeness centralization | 0.41 | 0.43 | 0.25 |
Table 2.
Position change by country in the scientific collaboration network.
| 2000 | 2018 | |||||||||||
|---|---|---|---|---|---|---|---|---|---|---|---|---|
| Rank | Country | Degree | Country | Closeness | Country | Between-ness | Country | Degree | Country | Closeness | Country | Between-ness |
| 1 | Turkey | 43 | Turkey | 0.787 | India | 146.526 | India | 63 | India | 0.985 | Turkey | 30.379 |
| 2 | India | 43 | India | 0.787 | Russia | 126.401 | China | 63 | China | 0.985 | Kazakhstan | 21.923 |
| 3 | Russia | 42 | Russia | 0.776 | Turkey | 100.586 | Turkey | 63 | Turkey | 0.985 | Kyrgyzstan | 17.144 |
| 4 | China | 41 | China | 0.766 | China | 85.262 | Iran | 62 | Iran | 0.97 | India | 14.473 |
| 5 | Israel | 38 | Israel | 0.738 | Poland | 84.123 | Malaysia | 62 | Malaysia | 0.97 | China | 14.473 |
| 6 | Poland | 38 | Poland | 0.738 | Egypt | 77.869 | Pakistan | 62 | Pakistan | 0.97 | Uzbekistan | 14.462 |
| 7 | Hungary | 36 | Hungary | 0.72 | Israel | 76.518 | Thailand | 62 | Thailand | 0.97 | Thailand | 13.350 |
| 8 | Czech | 35 | Czech | 0.711 | Thailand | 55.777 | Bangladesh | 61 | Bangladesh | 0.955 | Bangladesh | 12.672 |
| 9 | Egypt | 33 | Egypt | 0.694 | Malaysia | 54.017 | Kazakhstan | 61 | Kazakhstan | 0.955 | Nepal | 11.340 |
| 10 | Romania | 31 | Romania | 0.678 | Philippines | 50.562 | Poland | 61 | Poland | 0.955 | Indonesia | 9.912 |
| 11 | Singapore | 31 | Singapore | 0.678 | Hungary | 48.332 | Russia | 61 | Russia | 0.955 | Sri Lanka | 9.574 |
| 12 | Ukraine | 30 | Pakistan | 0.663 | Czech | 34.774 | Saudi Arabia | 61 | Saudi Arabia | 0.955 | Iran | 9.291 |
| 13 | Pakistan | 29 | Ukraine | 0.656 | Singapore | 32.068 | Egypt | 60 | Egypt | 0.941 | Malaysia | 9.291 |
| 14 | Bulgaria | 27 | Thailand | 0.648 | Pakistan | 30.070 | Jordan | 60 | Jordan | 0.941 | Pakistan | 9.291 |
| 15 | Belarus | 27 | Belarus | 0.641 | Ukraine | 27.412 | Israel | 60 | Israel | 0.941 | Oman | 8.745 |
© 2019 by the authors. Licensee MDPI, Basel, Switzerland. This article is an open access article distributed under the terms and conditions of the Creative Commons Attribution (CC BY) license (http://creativecommons.org/licenses/by/4.0/).
Share and Cite
MDPI and ACS Style
Gui, Q.; Liu, C.; Du, D. The Structure and Dynamic of Scientific Collaboration Network among Countries along the Belt and Road. Sustainability 2019, 11, 5187. https://doi.org/10.3390/su11195187
AMA Style
Gui Q, Liu C, Du D. The Structure and Dynamic of Scientific Collaboration Network among Countries along the Belt and Road. Sustainability. 2019; 11(19):5187. https://doi.org/10.3390/su11195187
Chicago/Turabian StyleGui, Qinchang, Chengliang Liu, and DeBin Du. 2019. "The Structure and Dynamic of Scientific Collaboration Network among Countries along the Belt and Road" Sustainability 11, no. 19: 5187. https://doi.org/10.3390/su11195187
Note that from the first issue of 2016, this journal uses article numbers instead of page numbers. See further details here.