Expansion of Rural Settlements on High-Quality Arable Land in Tongzhou District in Beijing, China


1
Key Laboratory of Land Surface Pattern and Simulation, Institute of Geographic Sciences and Natural Resources Research, Chinese Academy of Sciences, Beijing 100101, China
2
School of Earth Science and Resource, Chang’an University, Xi’an 710054, China
*
Author to whom correspondence should be addressed.
Sustainability 2019, 11(19), 5153; https://doi.org/10.3390/su11195153
Submission received: 29 May 2019
/
Revised: 4 August 2019
/
Accepted: 6 September 2019
/
Published: 20 September 2019
Abstract
:Settlement expansion caused by urbanization is an important factor leading to the loss of arable land across the world. Due to various factors in China, such as institutional problems, the total number of rural settlements is decreasing, while the total area continues to increase. Rural settlements expand mainly into arable land, resulting in a significant loss of high-quality farmland, thus threatening long-term food security. However, research on this subject is relatively scarce. In this study, using KeyHole and RESURS F1 satellite remote sensing images, we examined the spatial expansion of rural settlements in Tongzhou District, Beijing, in 1972 and 1991. Then, the consumption of high-quality arable land by rural settlements expansion was assessed. It was found that the overall accuracy of the produced maps for 1972 and 1991 were 93% and 90%, respectively. The accuracy of mapped changes from 1972 to 1991 was as high as 90%. From 1972 to 1991 and from 1991 to 2015, the rural settlements in Tongzhou District expanded by 51.54% and 79.91% respectively, with 53.72% and 60.64% of the expanded rural settlements being on arable land. Rural settlements expanded mainly into high-quality arable land at the beginning of the study period, whereas later on, medium- and low-quality farmland was also occupied, albeit to a lesser degree.
1. Introduction
The rapid urbanization throughout the world reflects not only the industrialization of the global economy, but also a very significant rural exodus [1,2,3,4,5,6,7,8,9]. This is especially the case in China, given its high urbanization rates [8]. From 2007 to 2015, the rural population in China decreased by 15.60% due to urbanization [10]. However, the total areas of rural settlements in China increased by 257.27 million hectares due to various factors such as institutional problems [7,11,12,13,14,15,16,17,18,19]. For the large rural population baseline, the continuous expansion of rural settlements inevitably leads to the arable land loss [20,21,22,23]. Furthermore, a large amount of high-quality arable land is usually distributed in rural areas. The expansion of rural settlements in China and the occupation of high-quality arable land are likely to pose a threat to food security. On this basis, clarification of the situation regarding the expansion of rural settlements and the take-up of arable land, especially high-quality land, is of great significance for ensuring regional food security.
At present, in developed countries, the development of rural settlements is relatively stable; however, in developing countries, rural settlements are still subject to dramatic changes [24,25,26]. For China, the dynamic changes in rural settlements throughout the country are clearly evident, and most of the rural settlements are in a state of continuous expansion [13,27,28,29]. For example, Ma et al. [30] investigated the evolution of rural settlements in Shandan County of China and found that the area of rural settlements in Shandan increased by 3.54 km2 from 1998 to 2015. Similarly, Xu et al. [31] observed that the total area of rural settlements in Jiangsu Province of China increased by nearly 2000 km2 from 1980 to 2010. Wang et al. [14] found that the total area of rural settlements of Henan Province of China increased by 170 km2 from the 1980s to 2010. The reasons for rural settlements expansion in China in the background of a rapid urbanization are diverse [6,21]. The causes of this phenomenon can be summarized as the institutional problems and the personal reasons such as the farmers’ willingness to improve housing conditions.
For China, given its large population and limited land resource per capita, arable land is a valuable resource [32,33,34,35,36,37]. However, in the last 30 years, this resource has been drastically reducing as a consequence of the rapid economic development [38,39,40,41,42]. According to statistical data, from 1987 to 2000, the area of arable land in China showed a net reduction of about 4.5 million hectares [43]. Clearly, this development represents a serious threat to regional food security and sustainable development. It has been reported that urban expansion usually leads to the loss of high-quality arable land because the distribution of urban areas and high-quality arable land usually shares similar land conditions such as the flat terrain and having resources close to the water [2,4,11,12,23,38,39,42,44,45]. However, whether rural settlement expansion prefers to consume high-quality arable land is still not clear now.
In consideration of the inevitability of rural settlements expansion in China, discerning the high-quality arable land loss due to this expansion is of great importance for assessing regional food security. To accomplish this, we adopted an indicator to link rural settlement expansion with its occupation of high-quality arable land. By virtue of this indicator, we assessed the occupation of high-quality arable land by rural settlements expansion. Our specific aims were to: (1) reveal the evolution of the expansion of rural settlements in Tongzhou District in China from 1972 to 2015, and to summarize the evolution characteristics of rural settlements in the different periods; (2) analyze the occupation situation regarding the expansion of rural settlements on arable land; and (3) evaluate the quality grades of the arable land occupied by the rural settlements, hence revealing the mechanism of rural settlement expansion.
2. Study Area
Tongzhou District is located in the southeast of Beijing (Figure 1) and is the core hub area of China’s Circum-Bohai Sea economic circle. It has a total area of 906 km2. The area has a continental monsoon climate with an annual average temperature of 11.3 °C and an annual rainfall of 620 mm. The terrain is flat with an elevation difference from north to south of less than 10 m. Tongzhou District is responsible for the administration of four subdistricts, 10 towns, and one township. In 2015, the gross domestic product (GDP) of Tongzhou District was 8.62 billion dollars and the disposable income of the rural residents per capita was 3134 dollars. At the end of 2015, the resident population of Tongzhou District was 1.378 million, of which, 882,000 lived in urban centers. In 2016, Tongzhou District was listed in the first batch of China’s new comprehensive urbanization pilot areas (http://zhengfu.bjtzh.gov.cn/) [46].
3. Data Sources and Research Methods
3.1. Data Sources
The land use maps adopted in this research spanned three periods, namely, 1972, 1991, and 2015. In addition, the arable land quality map of Tongzhou for 1986 was also adopted. The land use map for 1972 was obtained from the interpretation of KeyHole (KH) satellite images, while those for 1991 were derived from interpretation of the RESURS F1 images. The land use map for 2015 was directly acquired from the Remote Sensing Monitoring Database of the Land Use Status in China [47]. The arable land quality map of Tongzhou in 1986 was from Song et al. [48] (Table 1).
3.2. Research Methods
3.2.1. Land Use Classification
To ensure consistency in the area coverage, the land use map of 2015 was used to determine the boundary of the study area. The black-and-white images for 1972 were enhanced by using the contrast stretching method, and the color images for 1991 were enhanced by using the color image enhancement method in HSV (Hue, Saturation, Value) space. Then, through the establishment of interpretation indicators, the image characteristics of different land types were identified.
The land use classification for this study was developed based on the reclassification of the land use categories (Table 1) in 2015 [47]. To reflect changes in rural settlements, the classification scheme adopted the primary land use category for 2015 [47] but with slight changes. First, due to the small area of forest land and grassland in Tongzhou, these two types of land use were grouped into a single forest and grassland type. Second, given that there was no unused land in Tongzhou District in 2015, this land use category was not used. Next, we divided the residential land into rural settlements, urban land, and other construction land according to the secondary land use category for the data of 2015. Finally, the land use in Tongzhou was divided into six types: arable land, forest and grass land, water areas, urban land, rural settlements, and other construction land (Table 2).
The interpretation of the images for 1972 and 1991 was performed by the first author. Prior to this work, the first author has undertaken image interpretation for several projects and has specific professional skills and image processing experience. All of the work, including image pre-processing, classification, and identification of different land-use types and the acquisition of the spatial data for each land-use type, took about 8 months.
3.2.2. Validation
Accuracy was assessed by the agree degree of the produced map with the reference classification [50]. Accuracy assessment usually requires a sample-based validation [51]. In summary, the accuracy assessment witnessed a change from qualitative assessment to quantitative assessment [52,53]. In the first stage, the accuracy assessment was conducted by visual judgement, which has many uncertainties. The second stage was divided into three sub-stages. In the first sub-stage, the area ratio of the produced map was compared with that of reference data to assess the accuracy [54]. The limitation of this method was the lack of the validation of the location [55]. In the second sub-stage, the accuracy assessment focused on the comparison of site specifics of the land use type and accuracy metrics. In the third sub-stage, an error matrix was proposed to assess the accuracy. The confusion matrix had several statistics and thus could assess the accuracy in relation to several aspects [56]. In general, by using the error matrix, we could calculate the overall accuracy, Kappa coefficient, producer accuracy, and user accuracy. The overall accuracy and Kappa coefficient describe the overall accuracy of the classification of all types, while the producer accuracy and user accuracy describe the accuracy of the classification of a single type [57,58]. Nowadays, the error matrix has been widely adopted to assess the accuracy of land use classification.
Aside from the error matrix, several other approaches have been proposed for accuracy assessment [59], such as the approach of fuzzy sets [60], an error model developed by Michael et al. [61], and a weighted analysis of variance adjustment approach [62]. It can be seen that there is no standard method for accuracy assessment [59]. Considering the wide adoption of an error matrix, we assessed the accuracy of our maps based on an error matrix [56,63,64]. The calculation of the error matrix needs reference data (ground truth data). Traditionally, the reference data can be acquired from a field survey. When the field survey data is lacking, the satellite images with a very high resolution can be utilized to provide reference data [65,66]. In this research, we mapped the land use of Tongzhou in 1972 and 1991 using satellite images with a spatial resolution of 2m and 3m, respectively. For the lack of available field survey data, we checked the Google Earth images of Tongzhou. Unfortunately, the Google Earth images in 1972 of Tongzhou are not available and the resolution of the Google Earth images in 1991 was as low as 14.65 m. This resolution was much lower than that of the satellite images we adopted to map land use. Thus, the Google Earth images in 1991 could not be utilized to generate the ground truth data.
In response to the lack of available field survey data and high-resolution image data, we developed an alternative approach to generate the reference data. The land use of Tongzhou in 1972 and 1991 were classified by the first author herself using a visual interpretation approach. In general, the visual interpretation of a high-resolution satellite image can accurately identify the true land use, to a large degree. To further increase the accuracy of visual interpretation, we invited another two experts to help with creating reference data. The two experts both had rich experience in mapping the land use of Beijing. Specifically, when the random points utilized to verify accuracy were created, three experts including the first author started identifying the real land use of these points by visually interpreting the KeyHole and RESURS F1 satellite images. Only when the opinions of the three experts were consistent was the land use of the sample point was determined and can be utilized as reference data. Using this approach, we created the reference data of Tongzhou in 1972 and 1991. For the validation of the land use map in 2015, we utilized the historical Google Earth images for 2015 with a spatial resolution of up to 0.23 m.
To create reference data, we established 100 random points in Tongzhou using the Create Random Points tool of ArcGis version 10.2 by Environmental Systems Research Institute (ESRI) in America. Then, the satellite images for 1972 and 1991 and Google Earth images for 2015 were overlaid with random points. After the visual interpretations by the three experts, the land use of the random points was determined. If the land use classification of a certain point was not unanimous among the three experts, the point was dropped from the reference data. Then, another random point was created as the alternative point for reference data. Finally, 100 random reference data from 1972, 1991, and 2015 were created due to the efforts of the three experts. Parts of the reference data are shown in Table 3.
Since we aimed to analyze the changes among different land use maps, we did not focus only on the accuracy assessment of one single map, but also on the accuracy assessment of the changes of the maps. Therefore, we developed an approach to measure the accuracy of the changes. First, we extracted the changes from 1972 to 1991 and from 1991 to 2015. Then, we created 50 random points to verify their accuracy within these changes. The generation of the reference data was the same with the approach utilized to verify the maps of 1972, 1991, and 2015. Finally, the accuracy of the changes was assessed utilizing the followed equation:
where CHA is the accuracy of the changes, CRC is the number of corrected changes, and TOC is the number of the total changes.
3.2.3. Analysis of the Consumption of High-Quality Arable Land as a Result of the Expansion of Rural Settlements
The expansion of rural settlements and the occupation of arable land during different periods (from 1972 to 1991 and 1991 to 2015) can be assessed based on the land use conversion matrix. The conversion matrix is able to demonstrate the amount and direction of regional land use conversion and has been widely used for the analysis of dynamic land use change [45,48,67].
The consumption preference for the expansion of rural settlements can be analyzed using an indicator of high-quality farmland consumption (IHC). This coefficient was first introduced by Song et al. [48]. An IHC greater than 1 indicates a trend toward the occupation of high-quality arable land; the higher the IHC, the stronger this tendency. The equations for calculation are as follows:
where IHC is the occupation coefficient of rural settlement expansion for high-quality arable land, PHue is the proportion of high-quality arable land to total arable land occupied by rural settlement expansion, UEhigh is the area of high-quality arable land occupied by rural settlement expansion, UEwhole is the total area of arable land occupied by rural settlement expansion, PHwl is the proportion of high-quality arable land to total arable land of Tongzhou, TFhigh is the area of high-quality arable land in Tongzhou, and TFwhole is the total area of arable land for Tongzhou.
According to the equations for calculating IHC, five steps of spatial analysis were performed to acquire the IHC. First, the maps of land use in 1992 and 2015 were resampled at a spatial resolution of 2 m. Second, rural settlements expansion were mapped by overlapping land use maps of any two periods. Third, the arable land losses resulting from rural settlements expansion were mapped by overlapping the expanded rural settlement with the arable land of the initial map of the research period. Fourth, the high-quality arable land of Tongzhou was identified using the following equation [48]:
where, AQR is the arable land quality rank, AQp is the land quality score of parcel p; and AQa is the average quality score of the total arable land. The low, medium, and high quality arable land of Tongzhou were determined according to AQRs with the value ranges 0–0.8, 0.8–1.2, and 1.2+ [48], respectively. Thus, the high-quality land map of Tongzhou was generated according to AQR.
Lastly, the map of the lost arable land due to rural settlement expansion was overlapped with the high-quality land map of Tongzhou. Thus, the high-quality arable land loss map could be generated. According to Equations (2)–(4), the IHC could then be calculated.
4. Results
4.1. Verification of Accuracy of Image Classification
Using the error matrices, the accuracy of land use classification for 1972, 1991, and 2015 was assessed. The overall accuracy of land use classification in 1972, 1991, and 2015 were 93%, 90%, and 89%, respectively (Table 4, Table 5 and Table 6). It can be seen that the accuracy of the land use map in 1972 was the highest, followed by the maps for 1991 and 2015.
For the land use map of 1972, the classification accuracy of arable land, forest and grass land, and water areas were very high, while the classification accuracy of rural settlement, urban land, and other construction land was low (Table 4) due to the misclassifications among rural settlement, urban land, and other construction. For the land use map of 1991, the classification accuracy of water bodies was as high as 100%, followed by arable land (94.9%), forest and grass land (90%), rural settlement (80%), urban land (77.8%), and other construction land (71.4%) (Table 5). For the land use map of 2015, the classification accuracy of water bodies was as high as 100%, followed by arable land (95.7%), forest and grass land (81.8%), rural settlement (81.8%), urban land (80%), and other construction land (71.4%). As a whole, the classification accuracy for land use maps for 1972, 1991, and 2015 was high according to the accuracy requirements for image classification [54,55].
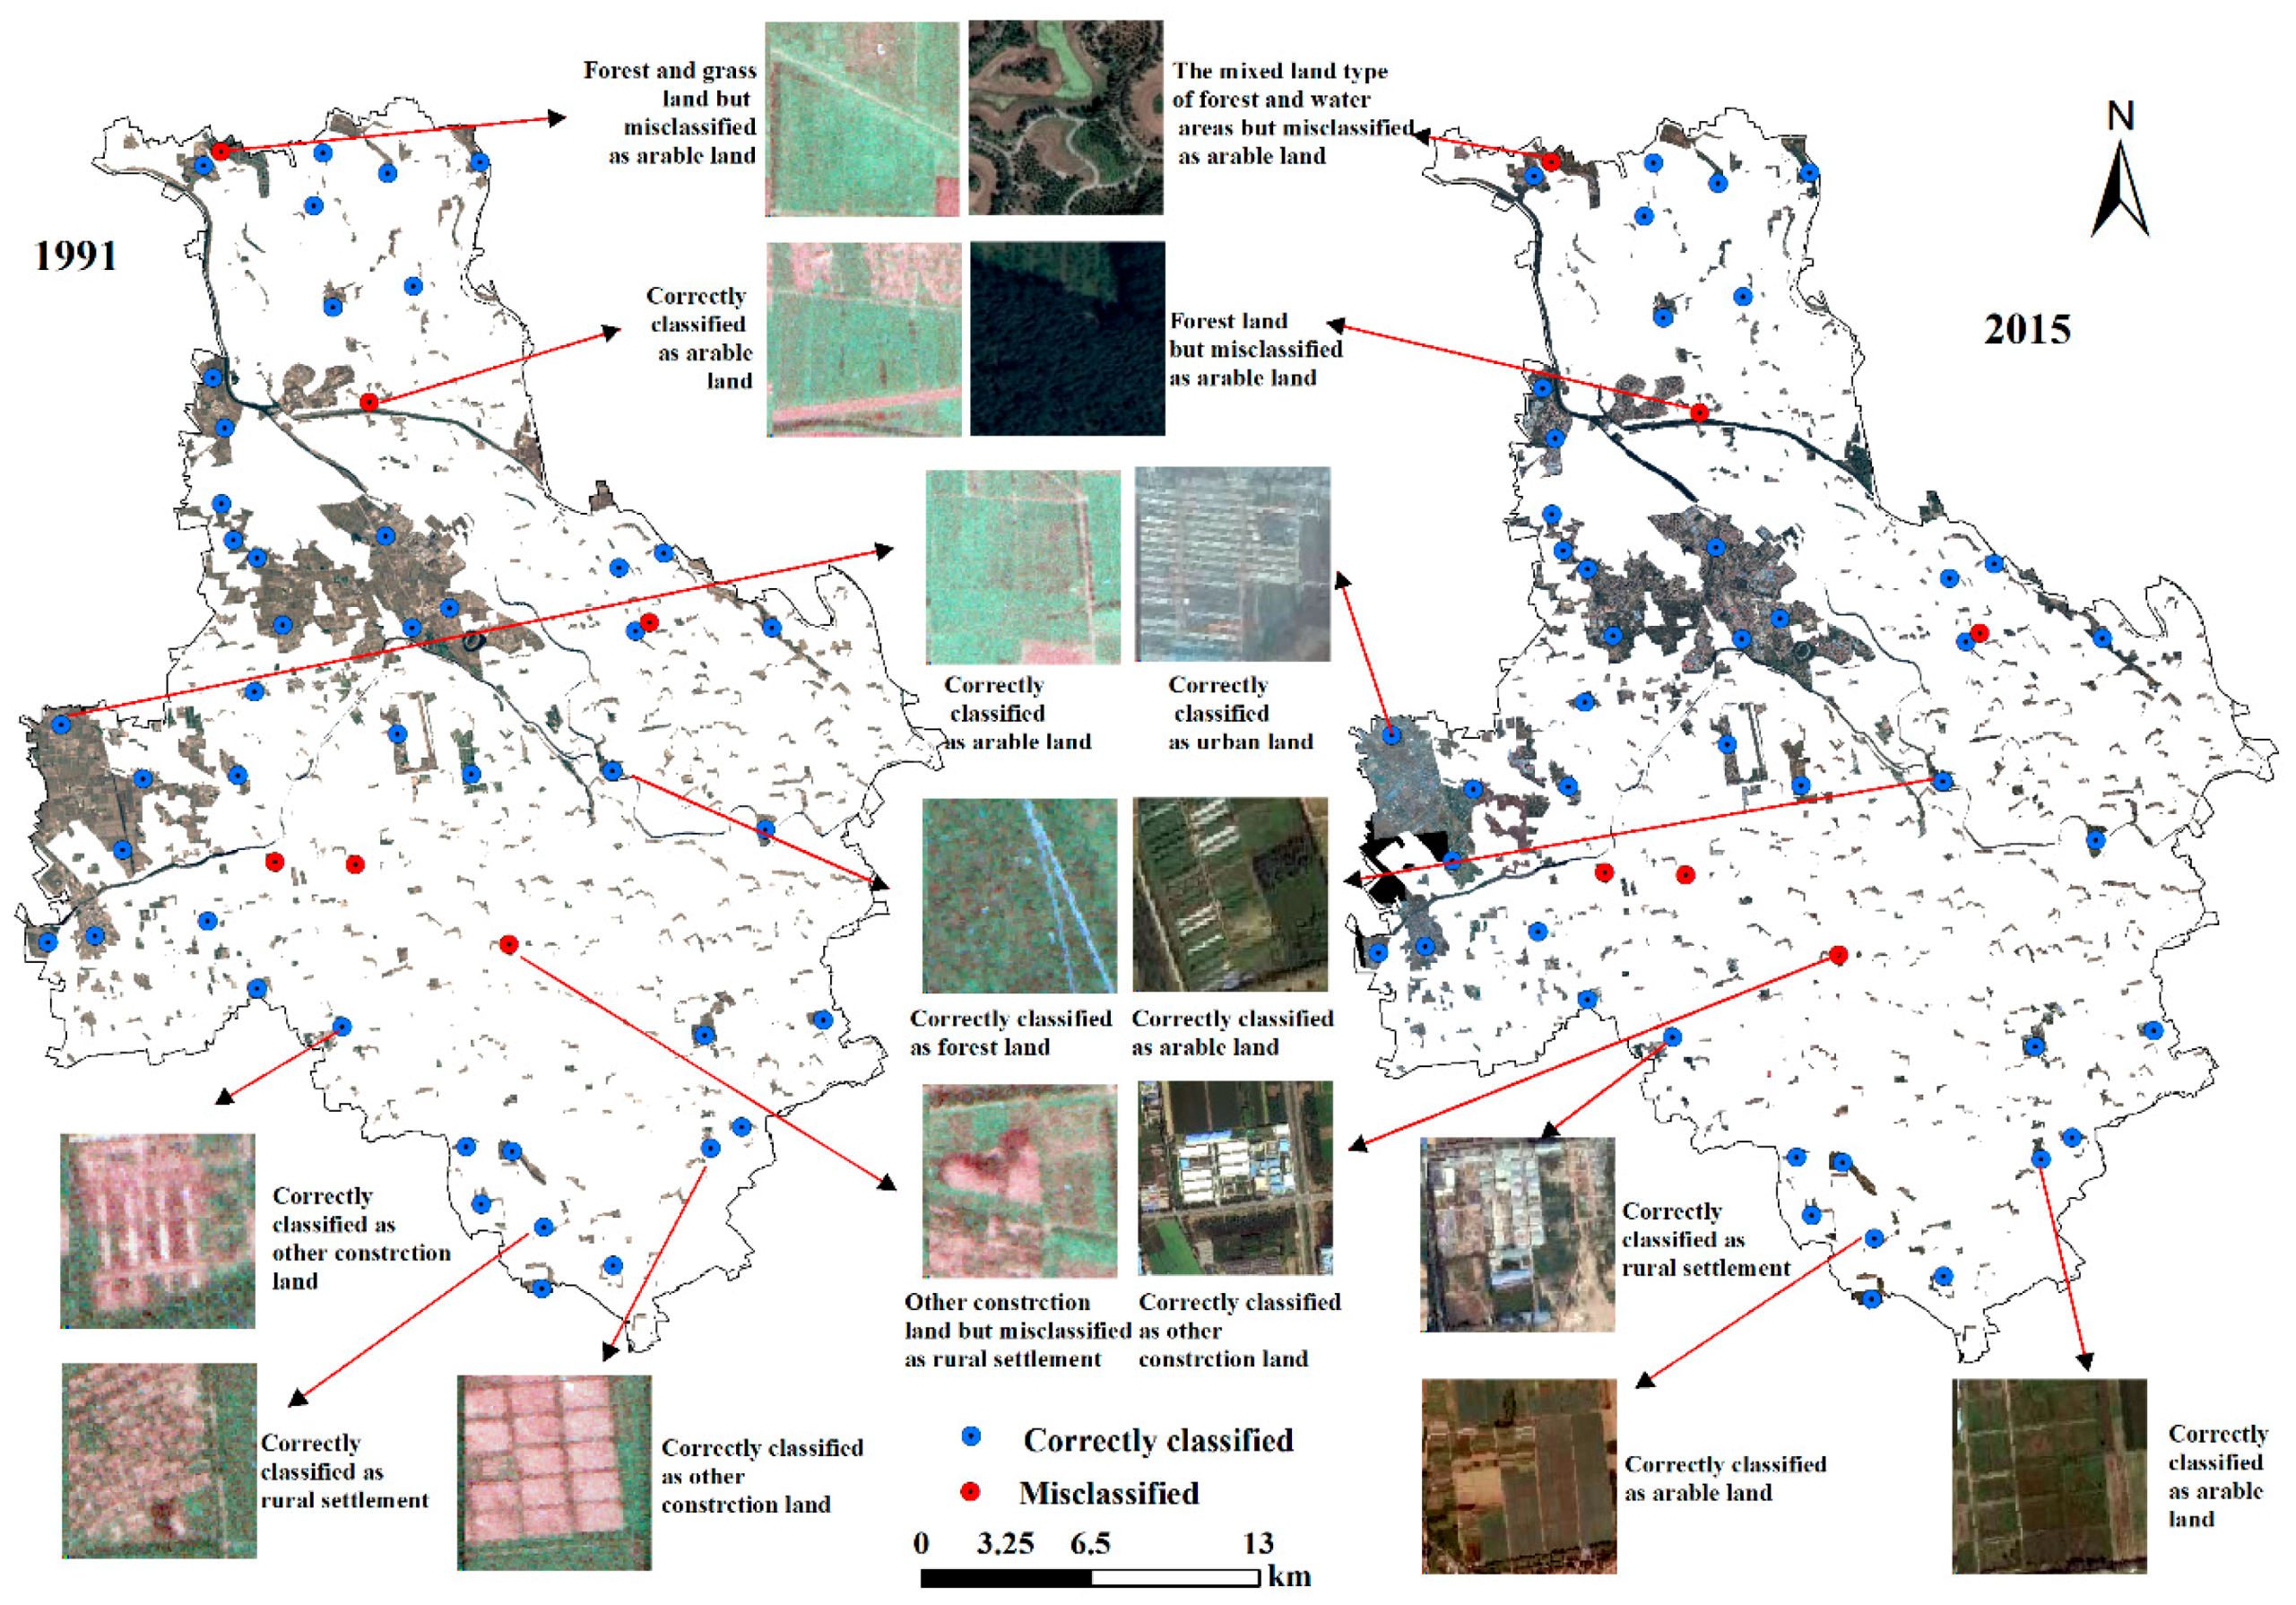
According to Equation (1), the accuracy of land use change from 1972 to 1991 and from 1991 to 2015 was assessed to be 90% and 88%, respectively. Among the 50 conversion samples from 1972 to 1991, 45 of them were correctly identified, while 5 of them were misclassified (Figure 2). Among the five conversion samples, two conversion samples were misclassified due to the misclassification of land use in 1972, while there were three that were misclassified in the 1991 dataset. Among the 50 conversion samples from 1991 to 2015 (Figure 3), 44 of them were correctly identified, while 6 of them were misclassified. Among the six conversion samples, one conversion sample was misclassified due to misclassification in both the 1991 and 2015 datasets, two due to misclassification in the 1991 dataset, and three were misclassified in the 2015 dataset.
4.2. Evolution of Rural Settlement Expansion
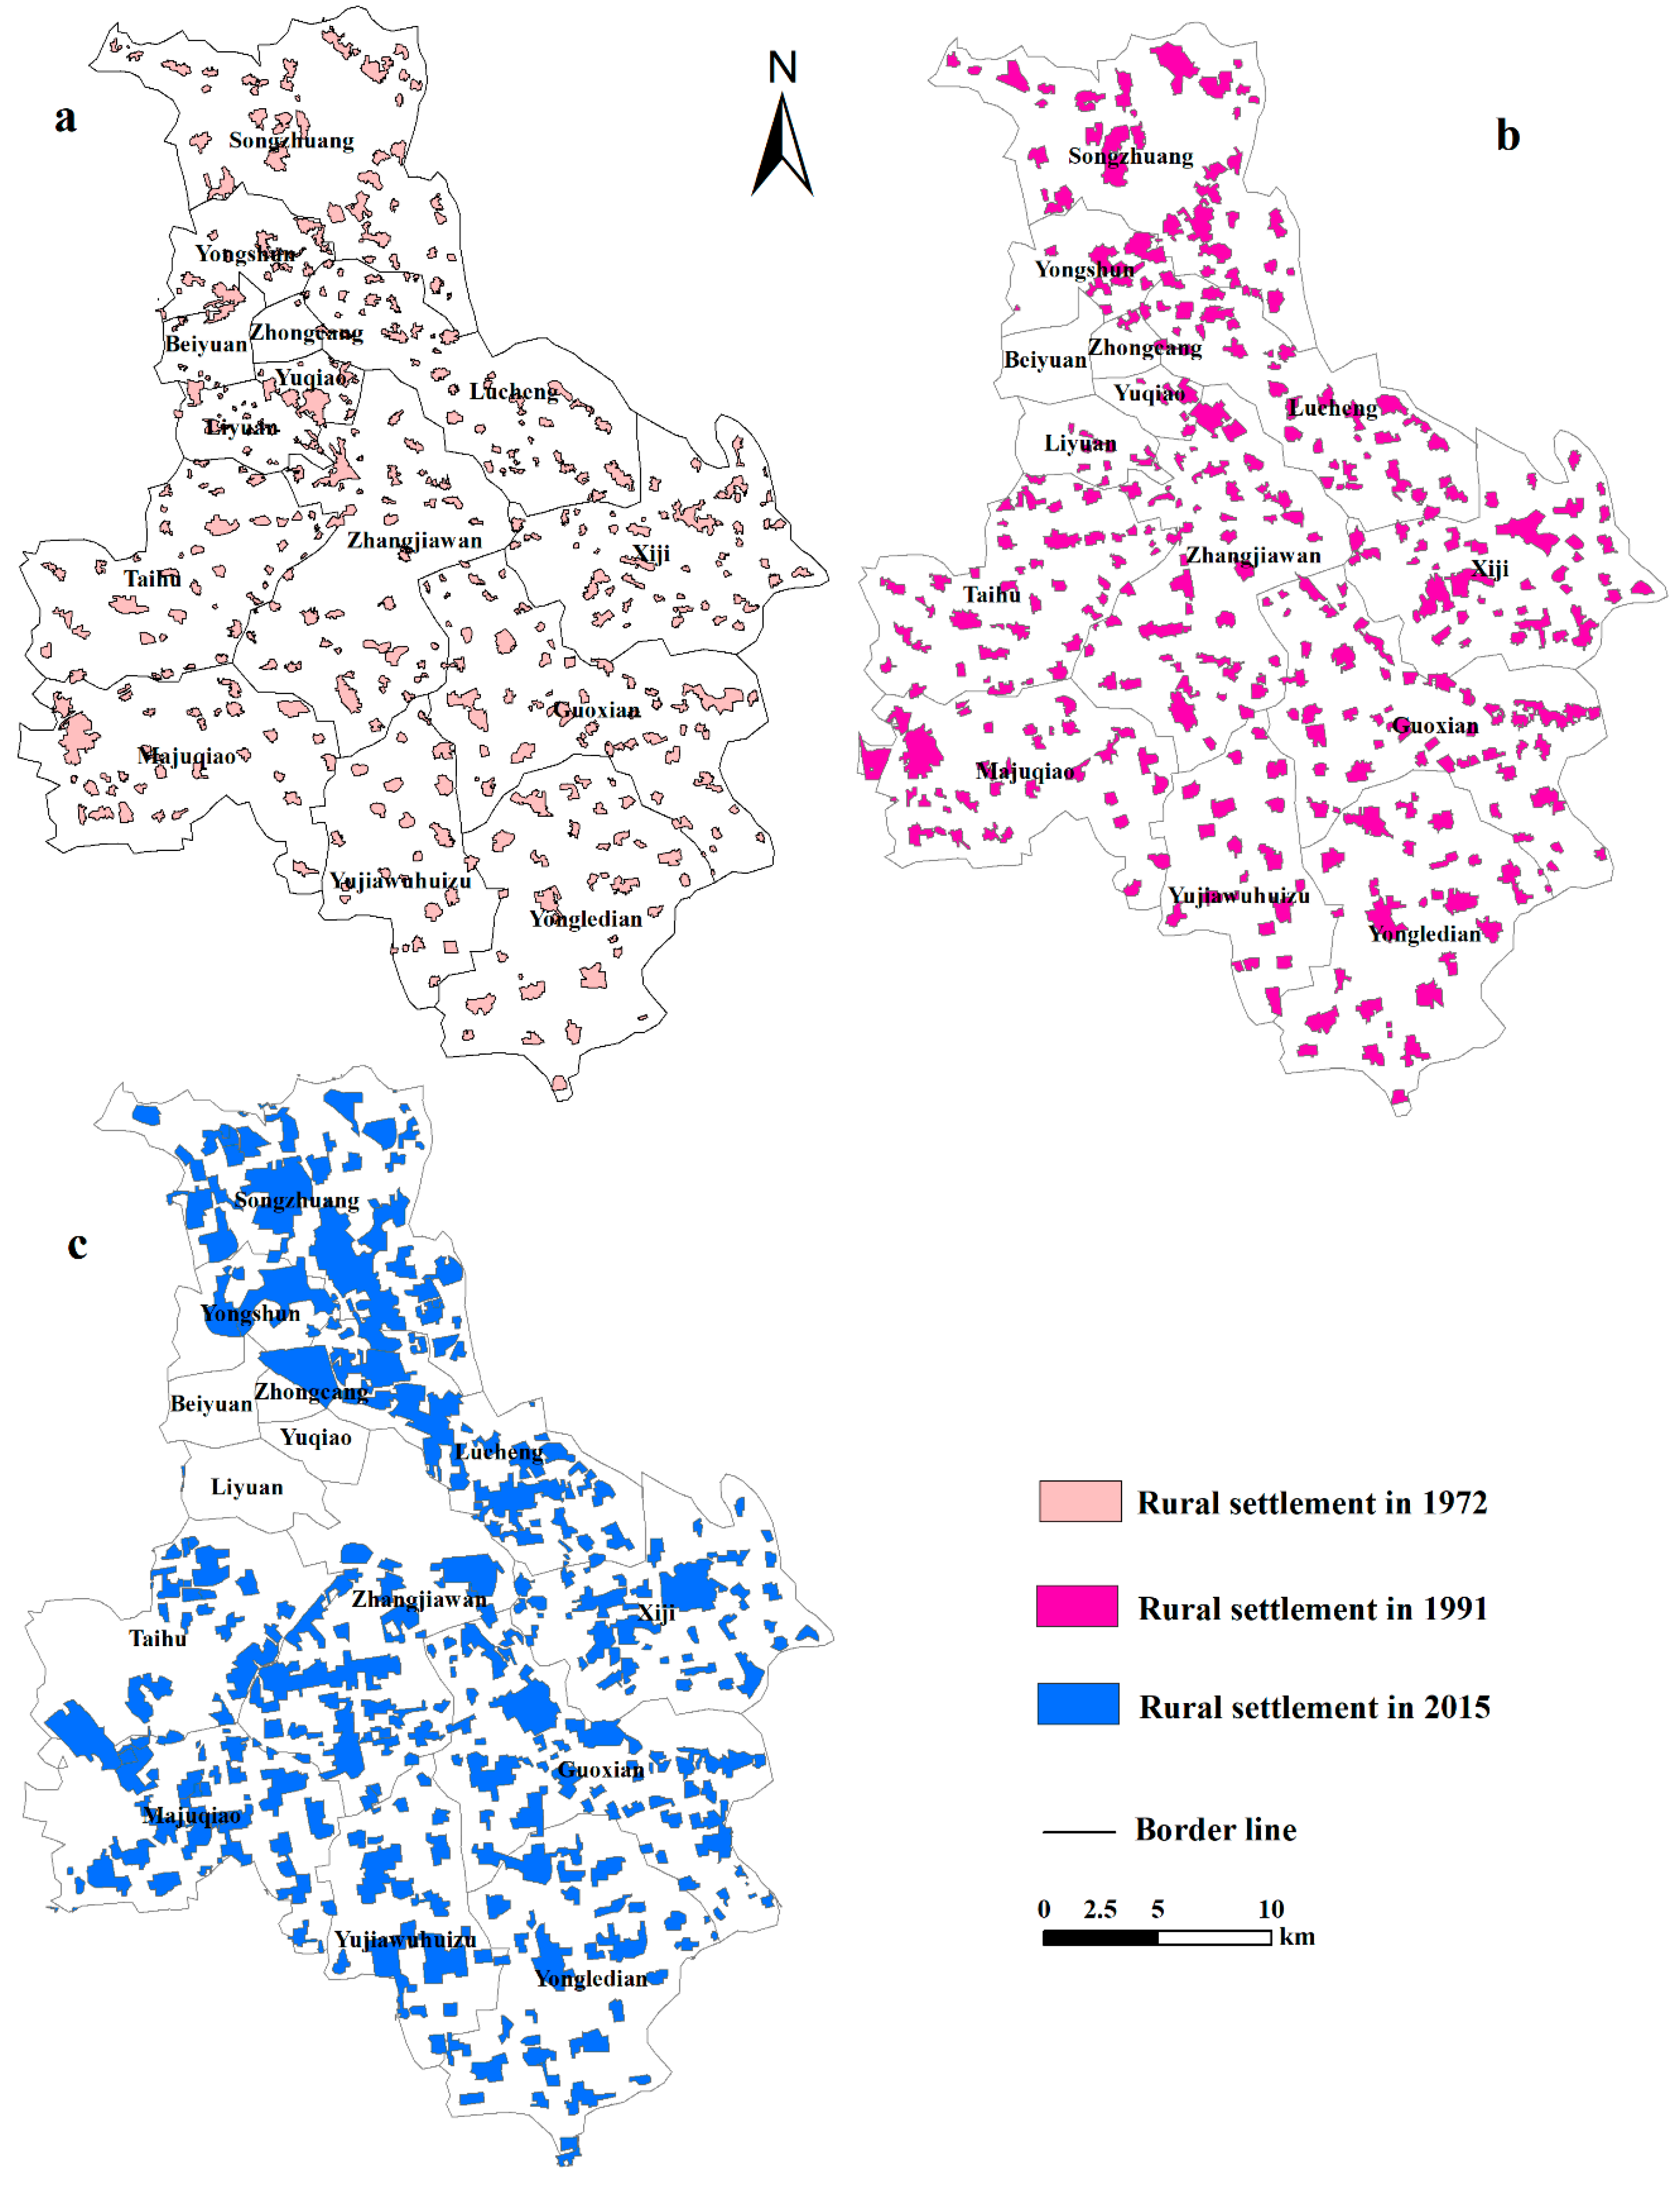
From 1972 to 2015, rural settlements in Tongzhou District experienced large-scale expansion, with different rates of expansion during different periods. The total areas of rural settlements increased by 51.54% from 1972 to 1991 and by 79.51% from 1991 to 2015, and the average annual rates of increase were 2.58 and 3.20%, respectively. From 1972 to 1991 (Table 7), although 27.72 km2 of the rural settlements were converted into other land use types, 73.22 km2 of other land use types were converted into rural settlements; among these other land use types, arable land accounted for the highest proportion with 53.72%. In terms of the available space, from 1972 to 1991 (Figure 4), the rural settlements expanded mainly in the form of a diffused outward development around the original rural settlements. Throughout the study area, almost all locations, where rural settlements occurred, showed a certain degree of outward expansion.
From 1991 to 2015 (Table 8), 47.56 km2 of rural settlements were converted into other land use types, but 154.70 km2 of other land use types were converted into rural settlements, of which 60.40% was arable land. During this period, the expansion modes of rural settlements were relatively diverse. Due to the diffuse outward development, some rural settlements also merged to form larger rural settlement, such as those in Lucheng Town, Zhangjiawan Town, and Songzhuang Town. Some rural settlements in Songzhuang Town, Taihu Town, and Yongledian Town were newly built, which could be considered as a new form of rural settlement expansion (Figure 4).
During the entire study period (1972–2015), the total areas of rural settlements in Tongzhou District increased by 173.05%, and the proportion of arable land being converted into rural settlements accounted for 78.47% of the total land available. In 1972, the distribution of rural settlements in the study area was relatively scattered, and the scale of individual settlements was generally small; by 2015, the degree of clustering of rural settlements had increased dramatically, approaching the same scale as that of single rural settlements. In other words, the peripheral boundaries of rural settlement in 2015 expanded outward to a very large degree compared to those in 1972. Moreover, because of the merged expansion of rural settlements, the peripheral boundary of certain rural settlement in 2015 contained two or even more rural settlements that had existed in 1972.
4.3. Variation in Arable Land Distribution
Arable land was the main land use type of Tongzhou, and its distribution area accounted for 85.77% (1972), 76.83% (1991), and 56.11% (2015) of the total area of the district. From 1972 to 2015, the total area of arable land in Tongzhou decreased by 34.57%, and arable land was mainly converted into rural settlements, which accounted for 61.83% of the total converted arable land. From 1972 to 1991 (Table 7), the area of arable land decreased by 10.46%, and the arable land that was converted into rural settlements accounted for 64.74% of the total converted arable land. From 1991 to 2015 (Table 8), the area of arable land decreased sharply by 26.94%. Arable land was mostly converted into rural settlements and, albeit to a lesser extent, into urban land. Nevertheless, the occupation of rural settlements was still the main reason for the decrease of arable land.
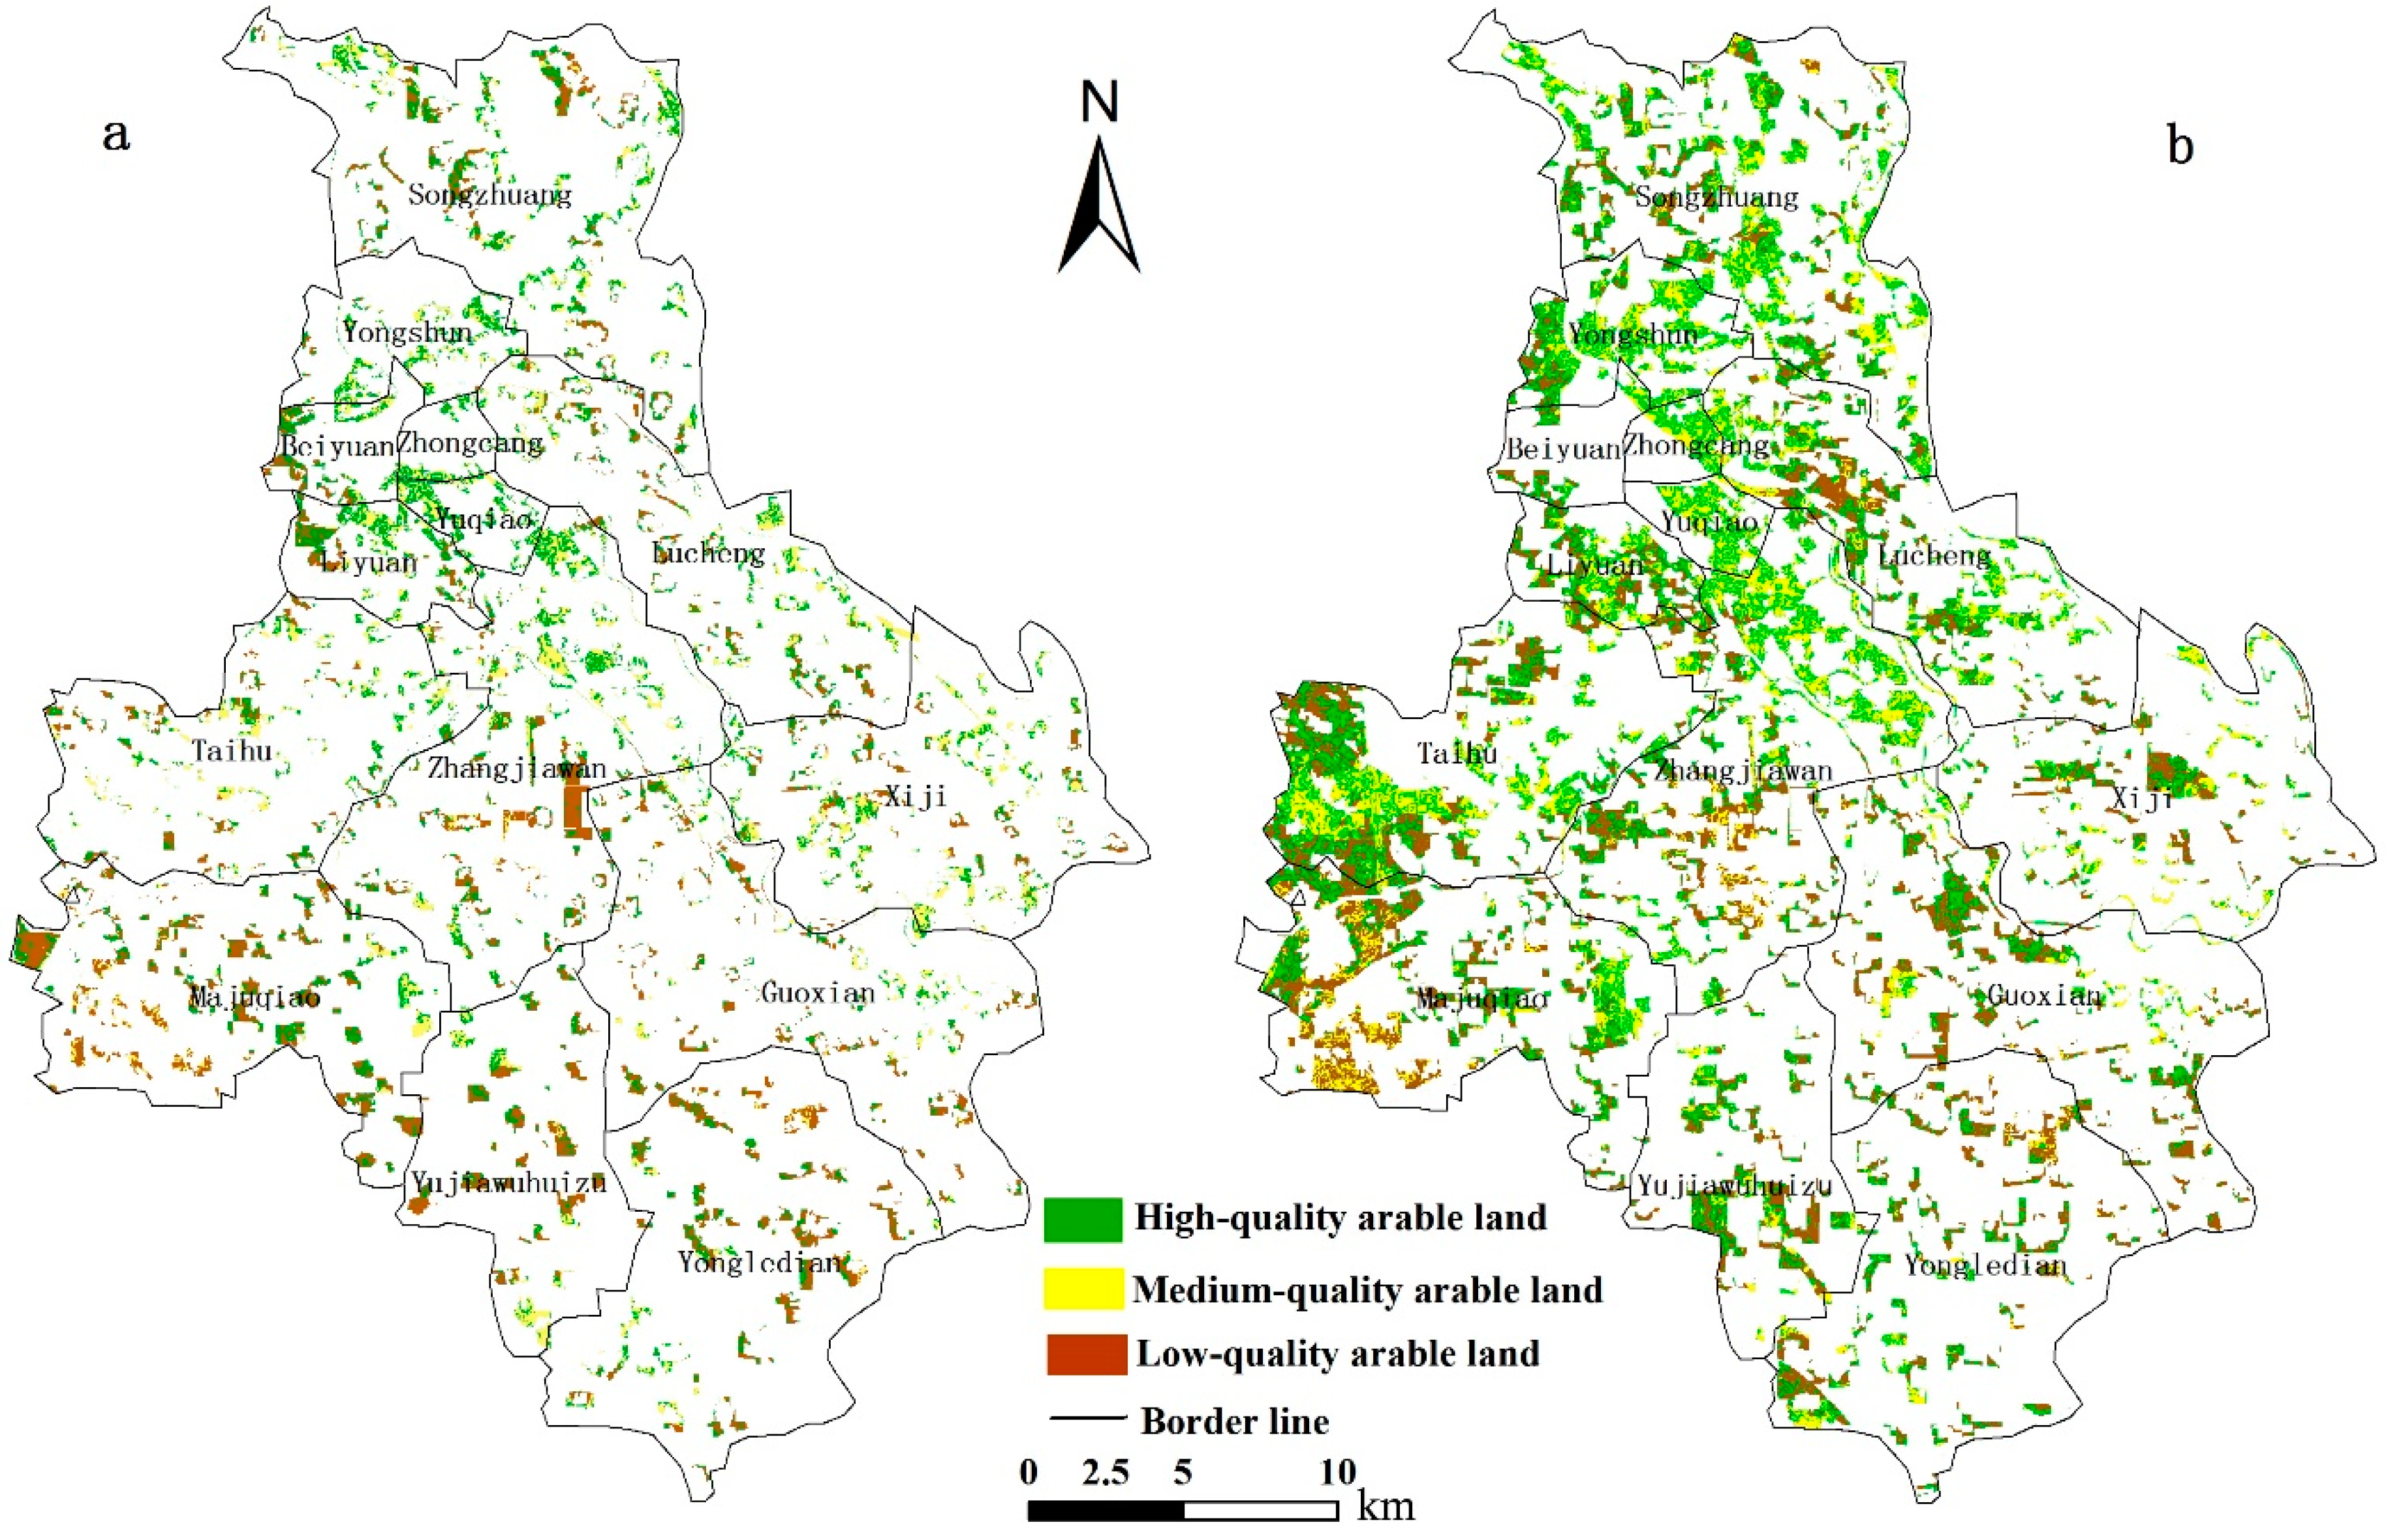
From 1972 to 2015, the reduction of arable land of indifferent quality followed a different path (Figure 5). The IHC values for rural settlements in Tongzhou District were 1.14 for 1972 to 1991 and 0.91 for 1991 to 2015 (Table 9). As indicated, the expansion of rural settlements in Tongzhou District between 1972 and 1991 occurred mainly at the expense of high-quality arable land (Figure 5). From 1991 to 2015, rural settlements accordingly occupied less high-quality arable land, but more medium-quality and low-quality arable land (Figure 5); the proportion of occupied medium-quality arable land increased from 28.64% to 31.18%, while that of low-quality arable land increased from 37.58% to 41.04% (Table 9).
Spatially, the expansion of rural settlements on high-quality arable land is presented as a clear encroachment. The original intact distribution of high-quality arable land gradually became occupied by rural settlements, which effectively swallowed more and more high-quality arable land. From 1972 to 1991, the expansion of rural settlements was represented as mainly an outward-diffused development with the original rural settlements at its center. Under this diffusion model, the rural settlements gradually invaded and encroached on the arable land. During this period, the expansion of rural settlements occurred around a zone where there was a clustering of high-quality arable land, such as with Songzhuang Town, Zhangjiawan Town, Majuqiao Town, and Guoxian Town. From 1991 to 2015, the expansion of rural settlements was not simply an outward diffusion, and many villages exhibited a trend toward merging. For instance, the expansion and merging of rural settlements occurred to a very great extent among the northern villages of Taihu Town, Lucheng Town, and Zhangjiawan.
5. Discussion
The rapid urbanization of Tongzhou District is still underway. According to “Overall Planning of Tongzhou District, Beijing (2016–2035)” [68], by 2030, 64.2% of the population in this district will live in urban areas. However, along with such a large shift in the population distribution, the total area of rural settlements continues to expand. This abnormal phenomenon has also been reported in other studies such as Chen et al. [69], Wang et al. [45], and Tan and Li [13]. Despite the institutional reasons, improvements in economic conditions encouraging rural residents to strive for more comfortable living environments also resulted in an increased demand for houses in rural areas and the further expansion of rural settlements [70].
Previous studies on the evolution of rural settlements have also explored the problem of arable land occupation as a result of rural settlements. For example, Su et al. [28] demonstrated that rural settlements were more inclined to encroach on open paddy fields in the process of expansion, while Tian et al. [71] concluded that 60% of the expanding area of rural settlements throughout China involved arable land. However, these studies did not give a clear picture of the high-quality arable land loss due to rural settlements expansion. In our research, we found that rural settlements in Tongzhou occupied mainly high-quality arable land from 1972 to 1991. The following reasons can explain this phenomenon. First, according to the high-quality arable land map of Tongzhou, the high-quality arable land was mainly distributed around rural settlements. Farmers of Tongzhou have relied on agricultural production for a long time. Hence, the farmers initially built their houses near arable land. After a long period of cultivation, the soil quality increased due to the presence of high amounts of organic matter. Second, high-quality arable land of Tongzhou is generally in relatively flat areas, thereby facilitating the development of new settlements.
From 1991 to 2015, the proportion of high-quality arable land occupied by the rural settlements expansion of Tongzhou decreased because of the implementation of some land use policies. During this period, the Chinese government formulated a series of arable land protection programs and strengthened public awareness for the need to protect arable land. In particular, the Land Administration Law [72] was issued during this period, containing specific regulations for the inspection and approval of construction land, as well as the prosecution of people destroying arable land. In 1998, the China State Council issued Regulations on the Protection of Basic Farmland [72] to emphasize the need for the protection of traditional farmland. In 2005, China began to focus on the protection of arable land, and in 2006, the government promulgated the Farmland Occupation Balance Policy. Tongzhou is located in eastern Beijing, the capital of China. For the close location to the capital, the execution of these arable land protection policies was easily done. Therefore, these land use policies were executed strictly in Tongzhou, resulting in a decrease in the construction on high-quality arable land [73].
In addition, Beijing also strengthened the management for rural buildings, which contributed to reducing the consumption of high-quality arable land by rural settlement expansion. In 1990, the People’s Government of Beijing Municipality promulgated the Provisions on Strengthening Rural Construction Land Use Management [74], requiring the villagers to carefully implement the basic national policy of protecting arable land when building new houses; in addition, the newly built houses must comply with the overall land use planning conditions at the town level and make full use of neglected land and old house sites, thus reducing the area required for the building of new housing sites on high-quality arable land. In addition to the influence of the above policies, before 1991, high-quality arable land around rural settlements in Tongzhou was occupied predominantly by rural houses, which led to a decrease in the area of high-quality arable land (which accounted for only 29.58% of the total area of arable land). As a result, the expansion of rural settlements into high-quality arable land was impeded [16,75].
During the expansion process, rural settlements sometimes occupied surrounding high-quality arable land in Tongzhou. Therefore, it is necessary to examine housing sites in rural areas and to prohibit the further occupation of high-quality arable land. This requires that reasonable control measures are in place to ensure the adequate expansion of rural settlements. For example, farmers should be encouraged to build their houses on the original, low-quality land and make full use of idle land, sloping wildland, and abandoned land in villages, but strictly prohibit the establishment of new houses beyond the control lines of rural settlements. At the same time, strict measures to protect the quality of arable land should be made. The high-quality and medium-quality arable land should be incorporated into the arable land protection regions, and the corresponding measures of rewards and punishments should be formulated to strictly restrict construction on the surrounding high-quality arable land. In addition, according to the experiences of arable land protection from Quebec of Canada, it is important to provide a broad framework for arable land protection taking account of the essentials of arable protection. Furthermore, it is essential to take into account the general considerations needed to main and develop a viable agricultural sector [76].
In this paper, the decrypted military remote sensing images were used to obtain the spatial data of rural settlements in 1972 and 1991. The images provided a reference for obtaining long-term land use change data at a relatively high resolution. However, the validation of these maps was very difficult due to the lack of defendable reference data. To solve this problem, we proposed a new approach to create the reference data. Using these data, the overall accuracy of the land use classification for 1972, 1991, and 2015 were assessed as 93%, 90%, and 89%, respectively. We also proposed an approach to assess the accuracy of mapped land use changes. It was found that the accuracy of changes from 1972 to 1991 and from 1991 to 2015 was 90% and 88%, respectively. The accuracy of these maps and the mapped changes was high. However, there were many uncertainties for the accuracy assessment. Here, the reference data was created by the visual interpretation consistency test among three experts. However, even if the judgments of the three experts were unanimous, the classification of reference data could still be wrong. Considering this problem, the actual accuracy of the land use map for 1972 and 1991 could be lower than that of our assessment. In addition, when assessing the change accuracy from 1971 to 1992 and from 1992 to 2015, we resampled the land use map of 1992 and 2015 from 3 m to 2 m and from 30 m to 3 m, respectively. These resamples could also generate uncertainties for change accuracy assessment.
6. Conclusions
In this paper, we employed KeyHole and RESURS F1 satellite images to analyze the expansion of rural settlements in Tongzhou District in Beijing from 1972 to 2015, as well as the corresponding occupation of rural settlements on arable land, especially those of high quality. By calculating the IHC, we found that from 1972 to 1991, rural settlements expanded mainly into high-quality arable land, while from 1991 to 2015, lower amounts of high-quality arable land were occupied. However, medium- and low-quality arable land was increasingly occupied during the latter period. The rate of rural settlement expansion in Tongzhou District was maintained at a very high rate of expansion over the 43 years studied, and the subsequent loss of arable land is serious.
The occupation of high-quality arable land was associated with lower building costs and more convenient transportation, which has resulted in a considerable occupation of such areas in the course of rural settlement expansion. Adequate protection measures and stringent land management procedures can, however, reduce such occupation to a certain extent. However, this requires appropriate policies. On the one hand, the government should put in place control measures for rural settlement expansion and guide the development of new rural settlements, while on the other hand, the government should incorporate the arable land quality assessment results into the township land use planning system, examine and approve development plans for all new housing sites in rural areas, and prohibit the construction of new houses on high-quality arable land, thus ensuring long-term regional food security.
Author Contributions
Conceptualization, W.S.; methodology, W.S. and H.L.; formal analysis, H.L.; investigation, W.S. and H.L.; resources, W.S.; writing—original draft preparation, H.L.; writing—review and editing, W.S.; supervision, W.S.
Funding
This research was funded by National Natural Science Foundation of China (grant numbers 41671177 and 41501192), the Second Tibetan Plateau Scientific Expedition and Research (grant no. 2019QZKK0603), and the Key Laboratory of Earth Observation and Geospatial Information Science of NASG (grant no. 201807).
Acknowledgments
We thanks for Dazhi Yang and Ze Han for their help on creating reference data.
Conflicts of Interest
The authors declare no conflict of interest. The funders had no role in the design of the study; in the collection, analyses, or interpretation of data; in the writing of the manuscript, nor in the decision to publish the results.
References
- Conrad, C.; Rudloff, M.; Abdullaev, I.; Thiel, M.; Loew, F.; Lamers, J.P.A. Measuring rural settlement expansion in Uzbekistan using remote sensing to support spatial planning. Appl. Geogr. 2015, 62, 29–43. [Google Scholar] [CrossRef]
- Liu, Y.; Li, Y. Revitalize the world’s countryside. Nature 2017, 548, 275–277. [Google Scholar] [CrossRef] [PubMed]
- Zhang, K.H.; Song, S.F. Rural-urban migration and urbanization in China: Evidence from time-series and cross-section analyses. China Econ. Rev. 2003, 14, 386–400. [Google Scholar] [CrossRef]
- Liu, Y.; Lu, S.; Chen, Y. Spatio-temporal change of urban-rural equalized development patterns in China and its driving factors. J. Rural Stud. 2013, 32, 320–330. [Google Scholar] [CrossRef]
- Jin, G.; Chen, K.; Wang, P. Trade-offs in Land-Use Competition and Sustainable Land Development in the North China Plain. Technol. Forecast. Soc. Chang. 2019, 141, 36–46. [Google Scholar] [CrossRef]
- Li, Y.; Jia, L.; Wu, W.; Yan, J.; Liu, Y. Urbanization for rural sustainability—Rethinking China’s urbanization strategy. J. Clean. Prod. 2018, 178, 580–586. [Google Scholar] [CrossRef]
- Liu, Y. Introduction to land use and rural sustainability in China. Land Use Policy 2018, 74, 1–4. [Google Scholar] [CrossRef]
- Ma, W.; Jiang, G.; Wang, D.; Li, W.; Guo, H.; Zheng, Q. Rural settlements transition (RST) in a suburban area of metropolis: Internal structure perspectives. Sci. Total Environ. 2018, 615, 672–680. [Google Scholar] [CrossRef] [PubMed]
- Song, W.; Liu, M. Assessment of decoupling between rural settlement area and rural population in China. Land Use Policy 2014, 39, 331–341. [Google Scholar] [CrossRef]
- Ministry of Housing and Urban-Rural Development of the People’s Republic of China (MHURD). Available online: http://www.mohurd.gov.cn/ (accessed on 21 December 2017).
- Yang, Y.; Liu, Y.; Li, Y.; Du, G. Quantifying spatio-temporal patterns of urban expansion in Beijing during 1985-2013 with rural-urban development transformation. Land Use Policy 2018, 74, 220–230. [Google Scholar] [CrossRef]
- Sun, P.-L.; Xu, Y.-Q.; Liu, Q.-G.; Liu, C.; Wang, H.-L. Spatiotemporal evolution and driving forces of changes in rural settlements in the poverty belt around Beijing and Tianjin: A case study of Zhangjiakou city, Hebei Province. J. Mount. Sci. 2017, 14, 980–997. [Google Scholar] [CrossRef]
- Tan, M.; Li, X. The changing settlements in rural areas under urban pressure in China: Patterns, driving forces and policy implications. Landsc. Urb. Plan. 2013, 120, 170–177. [Google Scholar] [CrossRef]
- Wang, J.; Zhang, W.; Zhang, Z. Quantifying the Spatio-Temporal Dynamics of Rural Settlements and the Associated Impacts on Land Use in an Undeveloped Area of China. Sustainability 2018, 10, 1490. [Google Scholar] [CrossRef]
- Guo, L.; Di, L.; Tian, Q. Detecting spatio-temporal changes of arable land and construction land in the Beijing-Tianjin corridor during 2000–2015. J. Geogr. Sci. 2019, 29, 702–718. [Google Scholar] [CrossRef]
- Francis, C.A.; Hansen, T.E.; Fox, A.A.; Hesje, P.J.; Nelson, H.E.; Lawseth, A.E.; English, A. Farmland conversion to non-agricultural uses in the US and Canada: Current impacts and concerns for the future. Int. J. Agric. Sustain. 2012, 10, 8–24. [Google Scholar] [CrossRef]
- Gomes, E.; Abrantes, P.; Banos, A.; Rocha, J.; Buxton, M. Farming under urban pressure: Farmers’ land use and land cover change intentions. Appl. Geogr. 2019, 102, 58–70. [Google Scholar] [CrossRef]
- Bacior, S. Impact of a motorway construction on arable land-based on the example of the A-4 motorway section between the cities of Brzesko and Tarnow in Poland. Berichte Uber Landwirtschaft 2017, 95, 1. [Google Scholar]
- Guri, F.; Jouve, A.M.; Dashi, E. Impact of rural migration on farm land use in northeastern Albania. New Medit. 2014, 13, 22–30. [Google Scholar]
- Long, H.; Tu, S.; Ge, D.; Li, T.; Liu, Y. The allocation and management of critical resources in rural China under restructuring: Problems and prospects. J. Rural Stud. 2016, 47, 392–412. [Google Scholar] [CrossRef] [Green Version]
- Tu, S.; Long, H.; Zhang, Y.; Ge, D.; Qu, Y. Rural restructuring at village level under rapid urbanization in metropolitan suburbs of China and its implications for innovations in land use policy. Habitat Int. 2018, 77, 143–152. [Google Scholar] [CrossRef]
- Long, H.; Liu, Y. Rural restructuring in China. J. Rural Stud. 2016, 47, 387–391. [Google Scholar] [CrossRef]
- Yang, R.; Liu, Y.; Long, H.; Qiao, L. Spatio-temporal characteristics of rural settlements and land use in the Bohai Rim of China. J. Geogr. Sci. 2015, 25, 559–572. [Google Scholar] [CrossRef] [Green Version]
- Chen, M.; Ye, C. Differences in Pattern and Driving Forces between Urban and Rural Settlements in the Coastal Region of Ningbo, China. Sustainability 2014, 6, 1848–1867. [Google Scholar] [CrossRef] [Green Version]
- Qu, Y.; Jiang, G.; Zhao, Q.; Ma, W.; Zhang, R.; Yang, Y. Geographic identification, spatial differentiation, and formation mechanism of multifunction of rural settlements: A case study of 804 typical villages in Shandong Province, China. J. Clean. Prod. 2017, 166, 1202–1215. [Google Scholar] [CrossRef]
- Xie, H.; Zhu, Z.; Wang, B.; Liu, G.; Zhai, Q. Does the expansion of urban construction land promote regional economic growth in China? Evidence from 108 cities in the Yangtze River Economic Belt. Sustainability 2018, 10, 4073. [Google Scholar] [CrossRef]
- Long, H.; Liu, Y.; Wu, X.; Dong, G. Spatio-temporal dynamic patterns of farmland and rural settlements in Su-Xi-Chang region: Implications for building a new countryside in coastal China. Land Use Policy 2009, 26, 322–333. [Google Scholar] [CrossRef]
- Su, S.; Zhang, Q.; Zhang, Z.; Zhi, J.; Wu, J. Rural settlement expansion and paddy soil loss across an ex-urbanizing watershed in eastern coastal China during market transition. Reg. Environ. Change 2011, 11, 651–662. [Google Scholar] [CrossRef]
- Yao, S.; Zhang, P.; Yu, C.; Li, G.; Wang, C. The Theory and Practice of New Urbanization in China. Scientia Geogr. Sinica 2014, 34, 641–647. [Google Scholar]
- Ma, L.; Guo, X.; Tian, Y.; Wang, Y.; Chen, M. Micro-Study of the Evolution of Rural Settlement Patterns and Their Spatial Association with Water and Land Resources: A Case Study of Shandan County, China. Sustainability 2017, 9, 2277. [Google Scholar] [CrossRef]
- Xu, Y.; Pu, L.; Zhang, L. Spatial Pattern and the Process of Settlement Expansion in Jiangsu Province from 1980 to 2010, Eastern China. Sustainability 2014, 6, 8180–8194. [Google Scholar] [CrossRef] [Green Version]
- D’Amour, C.B.R.; Reitsma, F.; Baiocchi, G.; Barthel, S.; Guneralp, B.; Erb, K.-H.; Haberl, H.; Creutzig, F.; Seto, K.C. Future urban land expansion and implications for global croplands. Proc. Natl. Acad. Sci. USA 2017, 114, 8939–8944. [Google Scholar] [CrossRef]
- Thebo, A.L.; Drechsel, P.; Lambin, E.F. Global assessment of urban and peri-urban agriculture: Irrigated and rainfed croplands. Environ. Res. Lett. 2014, 9, 114002. [Google Scholar] [CrossRef]
- Seto, K.C.; Ramankutty, N. Hidden linkages between urbanization and food systems. Science 2016, 352, 943–945. [Google Scholar] [CrossRef]
- Chen, L.; Song, G.; Meadows, M.E.; Zou, C. Spatio-temporal evolution of the early-warning status of cultivated land and its driving factors: A case study of Heilongjiang Province, China. Land Use Policy 2018, 72, 280–292. [Google Scholar] [CrossRef]
- Li, Y.; Li, X.; Tan, M.; Wang, X.; Xin, L. The impact of cultivated land spatial shift on food crop production in China, 1990-2010. Land Degrad. Dev. 2018, 29, 1652–1659. [Google Scholar] [CrossRef]
- Song, W. Decoupling cultivated land loss by construction occupation from economic growth in Beijing. Habitat Int. 2014, 43, 198–205. [Google Scholar] [CrossRef]
- Abass, K.; Adanu, S.K.; Agyemang, S. Peri-urbanisation and loss of arable land in Kumasi Metropolis in three decades: Evidence from remote sensing image analysis. Land Use Policy 2018, 72, 470–479. [Google Scholar] [CrossRef]
- Song, W.; Deng, X. Effects of Urbanization-Induced Cultivated Land Loss on Ecosystem Services in the North China Plain. Energies 2015, 8, 5678–5693. [Google Scholar] [CrossRef]
- Tan, M.H.; Li, X.B.; Lu, C.H. Urban land expansion and arable land loss of the major cities in China in the 1990s. Sci. China Ser. D Earth Sci. 2005, 48, 1492–1500. [Google Scholar] [CrossRef]
- Liu, Y.S.; Wang, J.Y.; Long, H.L. Analysis of arable land loss and its impact on rural sustainability in Southern Jiangsu Province of China. J. Environ. Manag. 2010, 91, 646–653. [Google Scholar] [CrossRef]
- Tan, M.H.; Li, X.B.; Xie, H.; Lu, C.H. Urban land expansion and arable land loss in China—A case study of Beijing-Tianjin-Hebei region. Land Use Policy 2005, 22, 187–196. [Google Scholar] [CrossRef]
- Liu, Y.; Yang, Y.; Li, Y.; Li, J. Conversion from rural settlements and arable land under rapid urbanization in Beijing during 1985–2010. J. Rural Stud. 2017, 51, 141–150. [Google Scholar] [CrossRef]
- Alam, A.A.; Asad, R.; Kabir, M.E. Rural settlements dynamics and the prospects of densification strategy in rural Bangladesh. SpringerPlus 2016, 5, 254. [Google Scholar] [CrossRef]
- Wang, Q.; Xu, Y.; Xu, Y.; Wu, L.; Wang, Y.; Han, L. Spatial hydrological responses to land use and land cover changes in a typical catchment of the Yangtze River Delta region. Catena 2018, 170, 305–315. [Google Scholar] [CrossRef]
- Tongzhou District People’s Government of Beijing Municipality. Available online: http://zhengfu.bjtzh.gov.cn/. (accessed on 20 December 2018).
- Resource Environmental Science Data Center of Chinese Academy of Sciences. The Remote Sensing Monitoring Database of the Land Use Status in China in 2015. Available online: http://www.resdc.cn/data.aspx?DATAID=184. (accessed on 25 December 2018).
- Song, W.; Pijanowski, B.C.; Tayyebi, A. Urban expansion and its consumption of high-quality farmland in Beijing, China. Ecol. Indic. 2015, 54, 60–70. [Google Scholar] [CrossRef]
- Beijing Top View Technology CO., LTD. Available online: http://www.topview.cc/. (accessed on 25 December 2018).
- Olofsson, P.; Foody, G.M.; Stehman, S.V.; Woodcock, C.E. Making better use of accuracy data in land change studies: Estimating accuracy and area and quantifying uncertainty using stratified estimation. Remote Sens. Environ. 2013, 129, 122–131. [Google Scholar] [CrossRef]
- Bos, A.B.; De Sy, V.; Duchelle, A.E.; Herold, M.; Martius, C.; Tsendbazar, N.-E. Global data and tools for local forest cover loss and REDD+ performance assessment: Accuracy, uncertainty, complementarity and impact. Int. J. Appl. Earth Obs. Geoinf. 2019, 80, 295–311. [Google Scholar] [CrossRef]
- Clinton, N.; Holt, A.; Scarborough, J.; Yan, L.I.; Gong, P. Accuracy assessment measures for object-based image segmentation goodness. Photogramm. Eng. Remote Sens 2010, 76, 289–299. [Google Scholar] [CrossRef]
- Räsänen, A.; Rusanen, A.; Kuitunen, M.; Lensu, A. What makes segmentation good? A case study in boreal forest habitat mapping. Int. J. Remote Sens. 2013, 34, 8603–8627. [Google Scholar] [CrossRef]
- Liu, Z.; Yao, Z.; Wang, R. Automatic identification of the lake area at Qinghai-Tibetan Plateau using remote sensing images. Quat. Int. 2019, 503, 136–145. [Google Scholar] [CrossRef]
- Arvor, D.; Belgiu, M.; Falomir, Z.; Mougenot, I.; Durieux, L. Ontologies to interpret remote sensing images: Why do we need them? GISci. Remote Sens. 2019, 56, 911–939. [Google Scholar] [CrossRef]
- Adhikary, P.P.; Barman, D.; Madhu, M.; Dash, C.J.; Jakhar, P.; Hombegowda, H.C.; Naik, B.S.; Sahoo, D.C.; Beer, K. Land use and land cover dynamics with special emphasis on shifting cultivation in Eastern Ghats Highlands of India using remote sensing data and GIS. Environ. Monitor. Assess. 2019, 191, 315. [Google Scholar] [CrossRef]
- Sica, Y.V.; Quintana, R.D.; Radeloff, V.C.; Gavier-Pizarro, G.I. Wetland loss due to land use change in the Lower Parana River Delta, Argentina. Sci. Total Environ. 2016, 568, 967–978. [Google Scholar] [CrossRef]
- Chakraborty, A.; Sachdeva, K.; Joshi, P.K. Mapping long-term land use and land cover change in the central Himalayan region using a tree-based ensemble classification approach. Appl. Geogr. 2016, 74, 136–150. [Google Scholar] [CrossRef]
- Costa, H.; Foody, G.M.; Boyd, D.S. Supervised methods of image segmentation accuracy assessment in land cover mapping. Remote Sens. Environ. 2018, 205, 338–351. [Google Scholar] [CrossRef] [Green Version]
- Gopal, S.; Woodcock, C. Theory and methods for accuracy assessment of thematic maps using fuzzy sets. Photogramm. Eng. Remote Sens. 1994, 60, 181–188. [Google Scholar]
- Goodchild, M.F.; Guoqing, S.; Shiren, Y. Development and test of an error model for categorical data. Int. J. Geogr. Inf. Syst. 1992, 6, 87–103. [Google Scholar] [CrossRef]
- Rosenfield, G.H. Analysis of variance of thematic mapping experiment data. Photogramm. Eng. Remote Sens. 1981, 47, 1685–1692. [Google Scholar]
- Pastick, N.J.; Jorgenson, M.T.; Goetz, S.J.; Jones, B.M.; Wylie, B.K.; Minsley, B.J.; Genet, H.; Knight, J.F.; Swanson, D.K.; Jorgenson, J.C. Spatiotemporal remote sensing of ecosystem change and causation across Alaska. Global Chang. Biol. 2019, 25, 1171–1189. [Google Scholar] [CrossRef]
- Smith, V.; Portillo-Quintero, C.; Sanchez-Azofeifa, A.; Hernandez-Stefanoni, J.L. Assessing the accuracy of detected breaks in Landsat time series as predictors of small scale deforestation in tropical dry forests of Mexico and Costa Rica. Remote Sens. Environ. 2019, 221, 707–721. [Google Scholar] [CrossRef]
- Fonte, C.C.; Martinho, N. Assessing the applicability of OpenStreetMap data to assist the validation of land use/land cover maps. Int. J. Geogr. Inf. Syst. 2017, 31, 2382–2400. [Google Scholar] [CrossRef]
- Lu, H.; Xie, H.; Lv, T.; Yao, G. Determinants of cultivated land recuperation in ecologically damaged areas in China. Land Use Policy 2019, 81, 160–166. [Google Scholar] [CrossRef]
- Wang, R.; Derdouri, A.; Murayama, Y. Spatiotemporal Simulation of Future Land Use/Cover Change Scenarios in the Tokyo Metropolitan Area. Sustainability 2018, 10, 2056. [Google Scholar] [CrossRef]
- Tongzhou District People’s Government(TDPG). Planning of Tongzhou District in Beijing(2016–2035), Beijing, China. Available online: http://www.bjtzh.gov.cn/ (accessed on 10 December 2017).
- Chen, C.; Gao, J.; Chen, J. Institutional changes, land use dynamics, and the transition of rural settlements in suburban China: A case study of Huishan District in Wuxi city. Habitat Int. 2017, 70, 24–33. [Google Scholar] [CrossRef]
- Li, D.; Wang, D.; Li, H.; Zhang, S.; Zhang, X.; Tao, Y. The Effects of Urban Sprawl on the Spatial Evolution of Rural Settlements: A Case Study in Changchun, China. Sustainability 2016, 8, 736. [Google Scholar] [CrossRef]
- Tian, G.; Yang, Z.; Zhang, Y. The spatio-temporal dynamic pattern of rural residential land in China in the 1990s using landsat TM images and GIS. Environ. Manag. 2007, 40, 803–813. [Google Scholar] [CrossRef]
- The Second Meeting of the Standing Committee of the Eighth National People’s Congress of the People’s Republic of China. Land Administration Law of the People’s Republic of China; The Second Meeting of the Standing Committee of the Eighth National People’s Congress of the People’s Republic of China: Beijing, China, 1998.
- Ministry of Land and Resources of the People’s Republic of China (MLR). Available online: http://ghgtw.beijing.gov.cn (accessed on 16 June 2006).
- Beijing Municipal People’s Government. Several Provisions of the Beijing Municipal People’s Government on Strengthening the Management of Rural Villages’ Building Land; Beijing Municipal People’s Government: Beijing, China, 1990.
- Siebielec, G.; Lopatka, A.; Stuczynski, T.; Kozak, M.; Gluszynska, M.; Koza, J.; Zurek, A.; Korzeniowska-Puculek, R. Assessment of Soil Protection Efficiency and Land Use Change; Institute of Soil Science and Plant Cultivation—State Research Institute: Pulawy, Poland, 2010; pp. 1–42. [Google Scholar]
- Bryant, C.R.; Granjon, D. Agricultural land protection in Quebec: From provincial framework to local initiatives. In Farmland Preservation: Land for Future Generations; Cladwell, W., Hilts, S., Wilton, B., Eds.; Centre for Land and Water Stewardship: Guelph, ON, Canada, 2007; pp. 61–86. [Google Scholar]
Figure 1.
Geographical location of Tongzhou District, Beijing, China.

Figure 2.
Verification of land use change from 1972 to 1991.

Figure 3.
Verification of land use change from 1991 to 2015.

Figure 4.
Rural settlement in 1972 (a), 1991 (b), and 2015 (c).

Figure 5.
The quality of lost arable land due to rural settlements expansion from 1972–1991 (a), and 1991–2015 (b).
Figure 5.
The quality of lost arable land due to rural settlements expansion from 1972–1991 (a), and 1991–2015 (b).


Table 1.
Data sources and brief descriptions.
| Data | Data Sources | Brief Descriptions |
|---|---|---|
| Remote sensing images of 1972 | From Beijing Top View Technology Co., LTD. (http://www.topview.cc/) [49] | The KeyHole (KH) satellite is an American reconnaissance satellite that was mainly used for military purposes. Up to now, there are about 930,000 scenes of historical remote sensing images taken from 1959 to 1986. The image data for 1972 used in this study were part of the Asian images from 1963 to 1980, taken by the KH-7 reconnaissance satellite and the KH-9 mapping satellite. These data were decrypted by the United States in 2002 and have a spatial resolution of 2 m. |
| Remote sensing images of 1991 | From Beijing Top View Technology Co., LTD. (http://www.topview.cc/) [49] | RESURS F1 was launched in 1977 and was one of the three Earth resource satellites developed under the authorization of the Russian government, equipped with two reconnaissance cameras, KFA-1000 and KATE-200 (Both the KFA-1000 and KATE-200 are models of reconnaissance cameras mounted on the RESURS F1 satellite.), for the observation of the Earth’s resources. The satellite images became commercially available in 2008. The image data for 1991 used in this study had a spatial resolution of 3 m. |
| Land use map of 2015 | From Remote Sensing Monitoring Database of Land Use Status in China [47,50] | The land use data from the Remote Sensing Monitoring Database of Land Use in China in 2015 were acquired using artificial visual interpretation based on the Landsat 8. The land use classification included six primary types of land, i.e., arable land, forest land, grassland, water areas, residential land, and unused land, and 25 secondary types. |
| The arable land quality map in 1986 | From References [48,51] | The distribution data of arable land quality in Beijing, China, for 1986 were obtained from Song et al. [51]. Six indicators, including soil texture, effective soil thickness, soil organic matter, soil profile, slope, and irrigation guarantee rate were adopted to evaluate the quality of arable land in Beijing. |
Table 2.
Division of land use and image interpretation indicators.
| KH Images in 1972 | RESURS F1 Images in 1991 | |||
|---|---|---|---|---|
| Land Use Type | Interpretation Indicators | Graphical Representation | Interpretation Indicators | Graphical Representation |
| Arable land | Flake-like distribution with clear evidence of farming. The hue for the black-and-white images is relatively homogeneous, being predominantly black or bright gray. |  | Flaky distribution in the flat regions, and clear evidence of farming fields represented as light green in the color image. |  |
| Forest and grass land | Clustered distributions and represented as dark black in the black-and-white image. |  | Striped distribution in a small range and represented as deep green in the image. |  |
| Water area | Striped distribution and represented as dark gray with a relatively homogeneous hue. |  | Striped distribution and represented as dark red in the image. |  |
| Rural settlement land | Clustered distribution, consisting of bright white buildings and some roads. |  | Clustered distribution. The bright white small rectangles are closely connected with interspersed vegetation in green. |  |
| Urban land | Densely packed distribution with white buildings and readily distinguishable roads. |  | Densely packed distribution of buildings over a wide area; bright white color and red in color and featuring readily distinguishable roads. |  |
| Other construction land | Refers to construction land except for urban land and rural settlements; consisting mainly of irregular buildings and represented as bright white in color. |  | The plots are regularly aligned and are rectangular in shape; present as red or bright white in color. |  |
Table 3.
Parts of the reference data determined by the three experts.
| Reference Data | 1972 | 1991 | 2015 | |
|---|---|---|---|---|
| Consistent identification | Arable land |  |  |  |
| Forest and grass land |  |  |  | |
| Water areas |  |  |  | |
| Rural settlement land |  |  |  | |
| Urban land |  |  |  | |
| Other construction land |  |  |  | |
| Inconsistent identification | Inconsistent classification between urban land and rural settlements | Inconsistent classification between rural settlement and other construction land | Inconsistent classification between forest land and arable land | |
 |  |  | ||
Table 4.
Overall error matrices of different land uses in the year 1972 for the classified images.
| Land Use | 1 | 2 | 3 | 4 | 5 | 6 | Total | CE | UA |
|---|---|---|---|---|---|---|---|---|---|
| 1 | 75 | 0 | 0 | 0 | 0 | 0 | 75 | 0.0 | 100.0 |
| 2 | 0 | 2 | 0 | 0 | 0 | 0 | 2 | 0.0 | 100.0 |
| 3 | 0 | 0 | 4 | 0 | 0 | 0 | 4 | 0.0 | 100.0 |
| 4 | 5 | 0 | 0 | 8 | 0 | 0 | 13 | 38.5 | 61.5 |
| 5 | 1 | 0 | 0 | 0 | 2 | 0 | 3 | 33.3 | 66.7 |
| 6 | 0 | 0 | 0 | 0 | 1 | 2 | 3 | 33.3 | 66.7 |
| Total | 81 | 2 | 4 | 8 | 3 | 2 | 100 | ||
| OE | 7.4 | 0.0 | 0.0 | 0.0 | 33.3 | 0.0 | |||
| PA | 92.6 | 100.0 | 100.0 | 100.0 | 66.7 | 100.0 | 0.93 |
Notes: The numbers 1, 2, 3, 4, 5, and 6 refer to arable land, forest and grass land, water areas, rural settlement, urban land, and other construction land, respectively; CE is committed error; OE is omitted error; UA is user accuracy; and PA is producer accuracy.
Table 5.
Overall error matrices of different land uses in the year 1991 for the classified images.
| Land Use | 1 | 2 | 3 | 4 | 5 | 6 | Total | CE | UA |
|---|---|---|---|---|---|---|---|---|---|
| 1 | 56 | 1 | 0 | 2 | 0 | 0 | 59 | 5.1 | 94.9 |
| 2 | 1 | 9 | 0 | 0 | 0 | 0 | 10 | 10.0 | 90.0 |
| 3 | 0 | 0 | 5 | 0 | 0 | 0 | 5 | 0.0 | 100.0 |
| 4 | 1 | 0 | 0 | 8 | 1 | 0 | 10 | 20.0 | 80.0 |
| 5 | 1 | 0 | 0 | 0 | 7 | 1 | 9 | 22.2 | 77.8 |
| 6 | 1 | 0 | 0 | 0 | 1 | 5 | 7 | 28.6 | 71.4 |
| Total | 60 | 10 | 5 | 10 | 9 | 6 | 100 | ||
| OE | 6.7 | 10.0 | 0.0 | 20.0 | 22.2 | 16.7 | |||
| PA | 93.3 | 90.0 | 100.0 | 80.0 | 77.8 | 83.3 | 90.0 |
Notes: The numbers 1, 2, 3, 4, 5, and 6 refer to arable land, forest and grass land, water areas, rural settlement, urban land, and other construction land, respectively; CE is committed error; OE is omitted error; UA is user accuracy; and PA is producer accuracy.
Table 6.
Overall error matrices of different land uses in the year 2015 for the classified images.
| Land Use | 1 | 2 | 3 | 4 | 5 | 6 | Total | CE | UA |
|---|---|---|---|---|---|---|---|---|---|
| 1 | 45 | 1 | 0 | 1 | 0 | 0 | 47 | 4.3 | 95.7 |
| 2 | 2 | 9 | 0 | 0 | 0 | 0 | 11 | 18.2 | 81.8 |
| 3 | 0 | 0 | 10 | 0 | 0 | 0 | 10 | 0.0 | 100.0 |
| 4 | 1 | 0 | 0 | 9 | 1 | 0 | 11 | 18.2 | 81.8 |
| 5 | 1 | 0 | 0 | 0 | 8 | 1 | 10 | 20.0 | 80.0 |
| 6 | 1 | 0 | 0 | 1 | 1 | 8 | 11 | 27.3 | 72.7 |
| Total | 50 | 10 | 10 | 11 | 10 | 9 | 100 | ||
| OE | 10.0 | 10.0 | 0.0 | 18.2 | 20.0 | 11.1 | |||
| PA | 90.0 | 90.0 | 100.0 | 81.8 | 80.0 | 88.9 | 89.0 |
Notes: The numbers 1, 2, 3, 4, 5, and 6 refer to arable land, forest and grass land, water areas, rural settlement, urban land, and other construction land, respectively; CE is committed error; OE is omitted error; UA is user accuracy; and PA is producer accuracy.
Table 7.
Conversion area matrix of land use types in Tongzhou District from 1972 to 1991 (km2).
| Arable Land | Forest and Grass Land | Water Areas | Rural Settlements | Urban Land | Other Construction Land | Total in 1972 | |
|---|---|---|---|---|---|---|---|
| Arable land | 666.19 (95.73%) | 7.12 (75.61%) | 2.60 (15.02%) | 71.87 (53.72%) | 10.66 (39.78%) | 18.75 (81.79%) | 777.19 (85.77%) |
| Forest and grass land | 3.66 (0.53%) | 1.81 (19.22%) | 0.27 (1.57%) | 0.10 (0.07%) | 0.10 (0.38%) | 0.99 (4.34%) | 6.94 (0.77%) |
| Water areas | 2.48 (0.36%) | 0.47 (5.01%) | 14.29 (82.37%) | 0.37 (0.28%) | 0.03 (0.09%) | 0.80 (3.50%) | 18.45 (2.04%) |
| Rural settlements | 22.07 (3.17%) | 0.01 (0.13%) | 0.17 (0.97%) | 60.56 (45.27%) | 4.98 (18.58%) | 0.49 (2.13%) | 88.28 (9.74%) |
| Urban land | 0.14 (0.02%) | 0.00 (0.00%) | 0.00 (0.00%) | 0.00 (0.00%) | 10.96 (40.91%) | 0.00 (0.00%) | 11.10 (1.23%) |
| Other construction land | 1.36 (0.20%) | 0.00 (0.00%) | 0.01 (0.07%) | 0.88 (0.66%) | 0.07 (0.25%) | 1.89 (8.25%) | 4.21 (0.46%) |
| Total in 1991 | 695.91 (100%) | 9.42 (100%) | 17.35 (100%) | 133.78 (100%) | 26.79 (100%) | 22.93 (100%) | 906.16 (100%) |
Table 8.
Conversion area matrix of land use types in Tongzhou District from 1991 to 2015 (km2).
| Arable Land | Forest and Grass Land | Water Areas | Rural Settlements | Urban Land | Other Construction Land | Total in 1991 | |
|---|---|---|---|---|---|---|---|
| Arable land | 459.45 (90.37%) | 3.20 (76.98%) | 12.87 (55.88%) | 145.37 (60.40%) | 67.78 (57.54%) | 7.23 (65.34%) | 695.90 (76.80%) |
| Forest and grass land | 6.23 (1.23%) | 0.50 (12.14%) | 0.81 (3.50%) | 1.18 (0.49%) | 0.30 (0.25%) | 0.39 (3.53%) | 9.41 (1.04%) |
| Water area | 6.58 (1.29%) | 0.20 (4.93%) | 6.96 (30.24%) | 1.54 (0.64%) | 1.86 (1.58%) | 0.19 (1.75%) | 17.34 (1.91%) |
| Rural settlements | 27.80 (5.47%) | 0.20 (4.93%) | 0.81 (3.50%) | 86.23 (35.83%) | 17.96 (15.25%) | 0.79 (7.13%) | 133.79 (14.76%) |
| Urban land | 0.26 (0.05%) | 0.00 (0.00%) | 0.07 (0.29%) | 0.00 (0.00%) | 26.46 (22.47%) | 0.00 (0.00%) | 26.79 (2.96%) |
| Other construction land | 8.58 (1.69%) | 0.01 (0.23%) | 1.75 (7.58%) | 6.61 (2.75%) | 3.44 (2.92%) | 2.53 (22.89%) | 22.92 (2.53%) |
| Total in 2015 | 508.42 (100%) | 4.15 (100%) | 23.03 (100%) | 240.70 (100%) | 117.79 (100%) | 11.07 (100%) | 906.16 (100%) |
Table 9.
Area proportions and the decreased amounts of arable land of different grade quality (%) from 1972 to 2015.
Table 9.
Area proportions and the decreased amounts of arable land of different grade quality (%) from 1972 to 2015.
| Decrease of Arable Land | |||||
|---|---|---|---|---|---|
| 1972 | 1991 | 2015 | 1972–1991 | 1991–2015 | |
| Low-quality | 39.75 | 40.03 | 39.09 | 37.58 | 41.04 |
| Medium quality | 30.14 | 30.40 | 30.40 | 28.64 | 31.18 |
| High-quality | 30.12 | 29.58 | 30.51 | 33.79 | 27.78 |
| IHC | - | - | - | 1.14 | 0.91 |
Note: IHC denotes the consumption preference for the expansion of rural settlements. An IHC greater than 1 indicates a trend toward the occupation of high-quality arable land; the higher the IHC, the stronger the tendency.
© 2019 by the authors. Licensee MDPI, Basel, Switzerland. This article is an open access article distributed under the terms and conditions of the Creative Commons Attribution (CC BY) license (http://creativecommons.org/licenses/by/4.0/).
Share and Cite
MDPI and ACS Style
Li, H.; Song, W. Expansion of Rural Settlements on High-Quality Arable Land in Tongzhou District in Beijing, China. Sustainability 2019, 11, 5153. https://doi.org/10.3390/su11195153
AMA Style
Li H, Song W. Expansion of Rural Settlements on High-Quality Arable Land in Tongzhou District in Beijing, China. Sustainability. 2019; 11(19):5153. https://doi.org/10.3390/su11195153
Chicago/Turabian StyleLi, Huanhuan, and Wei Song. 2019. "Expansion of Rural Settlements on High-Quality Arable Land in Tongzhou District in Beijing, China" Sustainability 11, no. 19: 5153. https://doi.org/10.3390/su11195153
Note that from the first issue of 2016, this journal uses article numbers instead of page numbers. See further details here.