An Investigation of the Effectiveness of Prefabrication Incentive Policies in China
by
 and
and
Weiping Jiang
1, 
Lirong Luo
1,
Zezhou Wu
1,2,
Jianbo Fei
3,
Maxwell Fordjour Antwi-Afari
4 and
Tao Yu
5,6,7,* 1
Department of Construction Management and Real Estate, College of Civil and Transportation Engineering, Shenzhen University, Shenzhen 518000, China
2
Sino-Australia Joint Research Center in BIM and Smart Construction, Shenzhen University, Shenzhen 518000, China
3
Underground Polis Academy, Shenzhen University, Shenzhen 518000, China
4
Department of Building and Real Estate, Hong Kong Polytechnic University, Hong Kong, China
5
School of Civil Engineering, Harbin Institute of Technology, Harbin 150090, China
6
Key Lab of Structures Dynamic Behavior and Control of the Ministry of Education, Harbin Institute of Technology, Harbin 150090, China
7
Key Lab of Smart Prevention and Mitigation of Civil Engineering Disasters of the Ministry of Industry and Information Technology, Harbin Institute of Technology, Harbin 150090, China
*
Author to whom correspondence should be addressed.
Sustainability 2019, 11(19), 5149; https://doi.org/10.3390/su11195149
Submission received: 12 August 2019
/
Revised: 6 September 2019
/
Accepted: 16 September 2019
/
Published: 20 September 2019
(This article belongs to the Special Issue Rethinking Sustainable Construction: Renewing Old Perspectives and Emergent New Frames of Thinking)
Abstract
:Prefabrication is a technology that can reduce the material consumption during the construction process. Thus, it is regarded as a technology that be of assistance in the pursuit of sustainable development in the construction industry. In China, a series of policies has been formulated to promote the implementation of prefabrication; however, the effectiveness of these policies has not been investigated. The aim of this paper is to evaluate the effectiveness of the current prefabrication incentive policies in China. To achieve this research aim, a policy framework was first developed in order to understand the existing policies. Then, four indicators—namely, the number of prefabricated component production enterprises, the prefabricated floor area, the prefabricated building market size, and the expected prefabricated building area ratio—were selected to evaluate each policy’s effectiveness. It was found that the growth rates of these four indicators had increased slowly, and had even shown declining trends before 2015; however, with the incentive policies promulgated after 2015, the growth rates have increased. This study is of value not only in helping readers to understand the existing framework of incentive policies in China, but also in revealing the effectiveness of the identified prefabrication incentive policies. These research findings can also provide insights useful for policy formulation in other jurisdictions for the promotion of prefabrication.
1. Introduction
Prefabrication refers to a manufacturing process taking place in a specific and controlled environment, in which various materials are formed into a component and subsequently installed [1,2,3]. Prefabrication contributes to the natural environment (e.g., through saving of resources and reduction of waste) [4] and also to the economic environment (e.g., by reducing the demand for labor) [5]. Thus, prefabrication is considered an important solution for environmental construction and industrial construction in many countries and regions. However, there exist challenges in the process of transformation; one of the major challenges is with respect to stakeholders’ willingness to adopt prefabrication [6]. To motivate stakeholders to adopt the construction technology of prefabrication, governments in different countries have promulgated a series of policies.
Some developed countries, such as the United States, the United Kingdom, Japan, etc., began to strengthen the development of prefabrication after the Second World War, due to severe shortages of residential buildings and in the labor force, and they have since developed a complete policy system [7]. In the United States, industrial housing was developed out of recreational vehicles, which gave the locals the impression of them being shabby, and of low quality. To overcome the bad impressions people had of industrial housing, Congress passed the “National Manufactured Housing Construction and Safety Act” in 1976, and the defining characteristic of industrial housing construction was changed from quantity to quality. In Singapore, buildability was determined to be a mandatory score criterion for evaluating prefabricated buildings in 2001 [8]. Because prefabrication was introduced in Japan very early, by the 1980s, the policy requirements for prefabrication development had moved from quantity to performance. Although the Chinese government has put forward a series of policies for developing prefabrication over the course of decades, the implementation of prefabrication in China is still lagging [9].
The first introduction of prefabrication in China can be traced back to the 1960s; however, its widespread implementation did not take place until the 21st century. Despite the rapid development of prefabrication in China in recent years, according to the data from “Forecast 2019: Panorama map of China’s prefabricated building industry”, in 2018, the proportion of prefabricated building area in newly built building areas in China was far less than that in other developed countries, such as the United States, Japan, France, and Sweden. The government plays a leading role in the promotion of new things [8]. Therefore, the policies promulgated by government will have a huge impact on the promotion of prefabrication, and this should be seriously explored. In order to provide useful information for future prefabrication policy formulation, it is of great importance to study current prefabrication policy [10].
Despite the Chinese government having formulated a series of incentive policies for the promotion of prefabrication, many of which were related to general development goals (e.g., assembly rate, prefabricated rate), it was not until September 2016 that specific actions for developing prefabrication were put forward. According to the policy “Guiding Opinions on Vigorously Developing Prefabricated Buildings”, issued by the General Office of the State Council, PRC, the development of prefabrication should be adapted to local conditions, that is, all cities in China should be divided into three promotion areas for the development of prefabrication: (1) the primary promotion area—this area includes three major urban agglomerations, namely, the “Beijing–Tianjin–Hebei Urban Agglomeration”, the “Pearl River Delta Urban Agglomeration” and the “Yangtze River Delta Urban Agglomeration”, with a total of 38 cities; (2) the positive promotion area—according to the “China urban construction statistical yearbook 2016”, conducted by the National Bureau of statics (NBS) [11], this area includes 27 cities, with more than 3 million permanent residents; and (3) the encouraging promotion area—the remaining cities are encouraged to develop prefabrication. Although the Chinese government has formulated incentive policies based on the above three promotion areas, the differences in the effectiveness of these policies among these three promotion areas remains unknown. Therefore, the analysis of incentive policies in this paper could solve this research issue.
Based on an overview of the previous studies related to prefabrication incentive policies in China, it could be found that recent studies have mainly focused on policy identification and categorization [12]. However, the effectiveness of the current incentive policies has been questioned in previous research [13]. Thus, the major aim of this paper is to evaluate the effectiveness of incentive polices of prefabrication in different promotion areas in China. The rest of this paper is arranged as follows: Section 2 introduces the research methodology used in this study. Section 3 categorizes the current incentive policies and conducts a comparative evaluation. Section 4 summarizes the research findings and presents the contributions of this study in terms of both practical and academic aspects.
2. Research Methodology
2.1. Developing a Policy Framework for Prefabrication
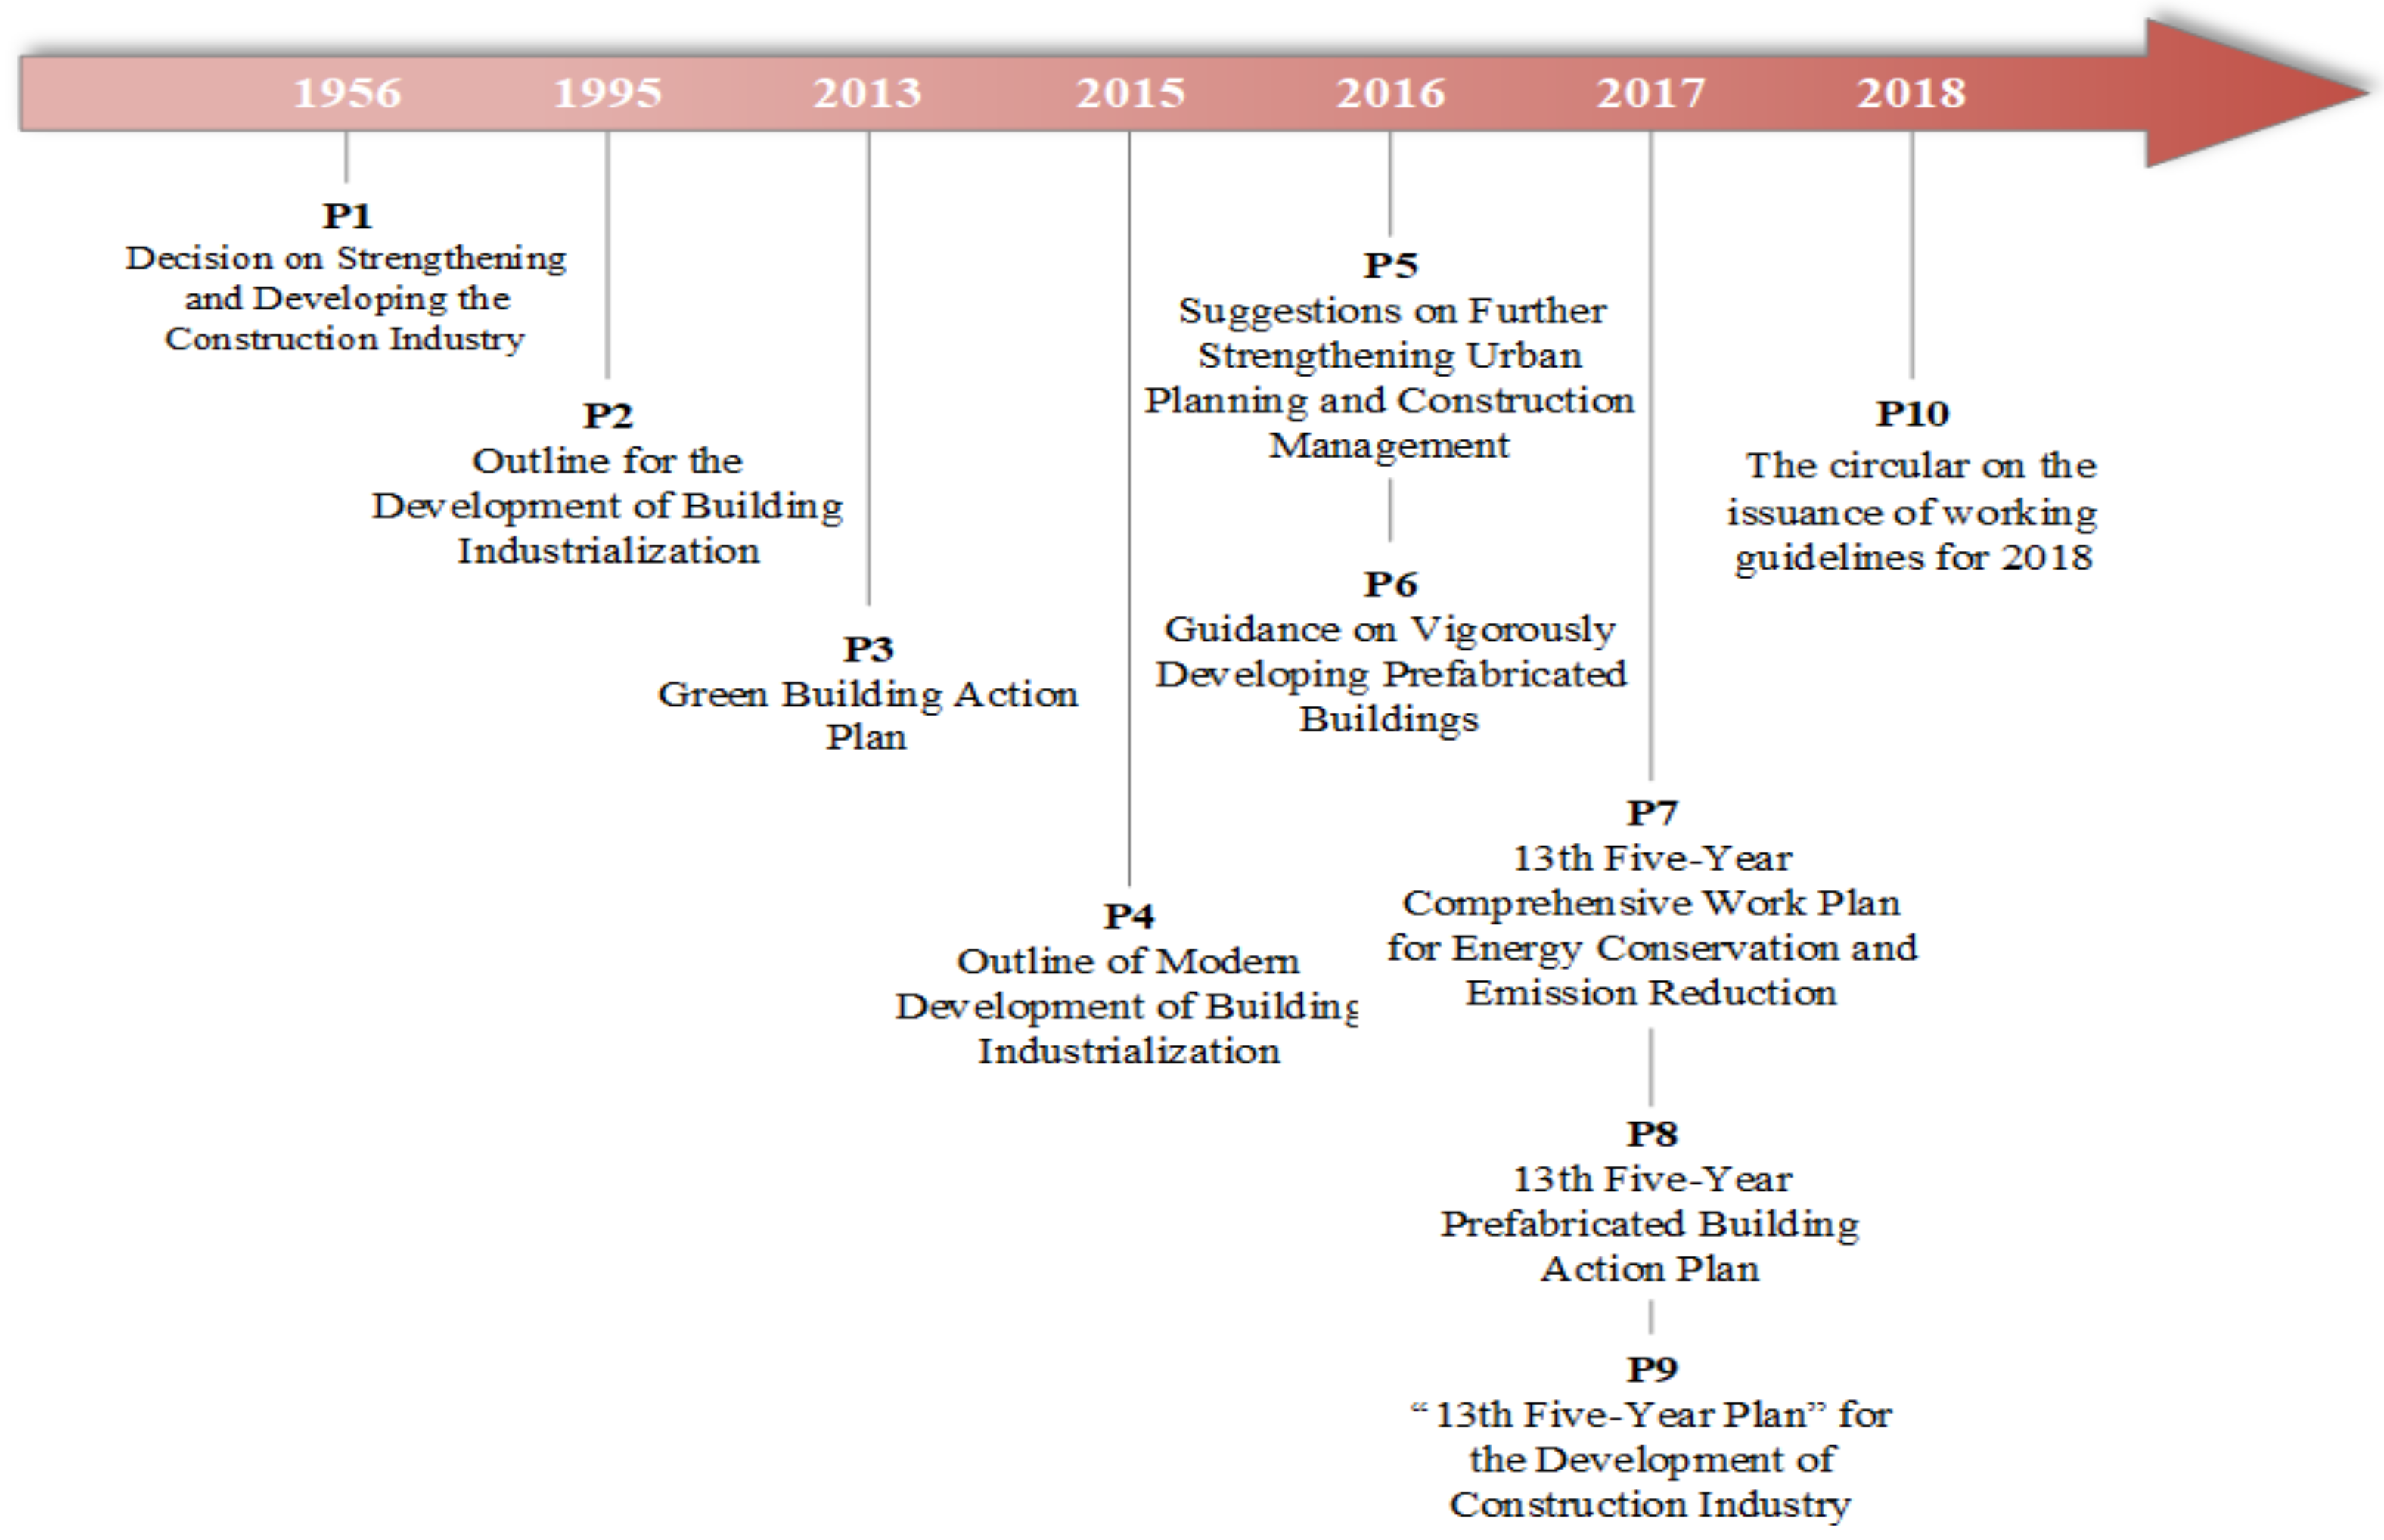
In recent decades, there have been a series of policies enacted by the Chinese government, involving both central and local government departments. In this section, the major policy documents related to prefabrication development selected are issued by the central government with normative validity, all of which are formed into a policy framework (see Figure 1).
P1: Decision on Strengthening and Developing the Construction Industry [14]
In May 1956, the General Office of the State Council, PRC, made decision on the transition from conventional construction to building industrialization. Prefabrication, as one aspect promoting building industrialization, began to be developed in China.
P2: Outline for the Development of Building Industrialization [15]
In 1995, the government issued the “Outline for the Development of Building Industrialization”, which proposed the basic contents of building industrialization, including reducing manual work, adopting advanced technics, developing uniform building modules and standards, etc., prefabrication obtained further development.
P3: Green Building Action Plan [16]
In January 2013, the policy was enacted to popularize prefabricated concrete, steel structures and other building systems suitable for industrial production, accelerate the development of assembled technologies for construction projects, and improve the integration level of building industrialization technologies.
P4: Outline of Modern Development of Building Industrialization [17]
In November 2015, the first development planning was put forward by the Ministry of Housing and Urban-Rural Development, namely, that prefabricated building area will account for more than 20% of new building areas by 2020, and more than 50% by 2025.
P5: Suggestions on Further Strengthening Urban Planning and Construction Management [18]
In February 2016, the government proposed the development of a new construction mode, namely, prefabrication, so as to reduce construction waste and dust pollution, shorten the construction time, and improve the quality of buildings. In addition, it is also important to strengthen policy support, so as to achieve the target that prefabricated building areas will account for 30% of new building areas within 10 years.
P6: Guidance on Vigorously Developing Prefabricated Buildings [19]
In September 2016, the government proposed the development of prefabrication according to local conditions. Specifically, the promotion cities were divided into three promotion areas, namely primary promotion area, positive promotion area and encouraging promotion area (see Section 2).
P7: 13th Five-Year Comprehensive Work Plan for Energy Conservation and Emission Reduction [20]
This policy was issued in January 2017, the main content regarding prefabrication is to promote the combination of green construction methods and prefabricated construction methods, so as to achieve the goal that urban green building floor areas will account for 50% of new building floor areas by 2020.
P8: 13th Five-Year Prefabricated Building Action Plan [21]
In March 2017, the government set the definite targets for three promotion areas: by 2020, prefabricated building area will account for more than 15% of new building area nationwide, including more than 20% in the primary promotion area, more than 15% in the positive promotion area, and more than 10% in the encouraging promotion area. Meanwhile, China will cultivate more than 50 prefabricated building demonstration cities, more than 200 prefabricated building industrial bases, more than 500 prefabricated building demonstration projects, and more than 30 prefabricated building science and technology innovation bases. There are requirements for the construction industry from ten aspects, such as development plan, technical system, standard system, design capacity, industry support, full decoration, green development, projects safety and quality, and industrial team.
P9: “13th Five-Year Plan” for the Development of Construction Industry [22]
This policy was issued in April 2017, the main contents were to develop steel and timber structures, including guiding new public buildings to give priority to steel structures, encouraging the use of modern timber structures in scenic spots and rural buildings.
P10: The circular on the issuance of working guidelines for 2018 [23]
This policy was issued in March 2018. The main contents with respect to prefabrication involve actively exploring and promoting the application of building information modeling (BIM) technology throughout the whole process of prefabricating buildings, and the innovation of the building engineering management system.
In an overview of the aforementioned policies, the first policy on developing building industrialization was enacted in 1956 by the Chinese government, but specific targets were still lacking. It was not until 2015 that developing prefabrication was considered to be a priority in the development of building industrialization, and the government proposed its detailed development targets. Since then, all work has been carried out around these targets, such as the division of promotion areas (P6) and the formulation of phased action plans (P8). Although there have been policies promulgated by the central government, this plays a macro-control role. To develop prefabrication, specific plans should be made by local governments.
2.2. Coding Policies for Prefabrication
There are massive cities involved in the above three promotion areas, including municipal cities, autonomous regions and country-level cities. To reduce the workload of data processing, the cities chosen in this paper for policy analysis are representative of municipal level and autonomous regions. Due to the fact that policies are formulated according to local conditions, the cities selected for consideration in this paper cannot be from only one province. The total number of provinces (including autonomous regions) in China is 33; theoretically, all cities in these provinces should be taken into consideration. However, the workload for data processing will be enormous if all cities are incorporated into this research. Therefore, this research randomly selected a number of cities in different promotion areas. The specific number of cities is as follows: 15 cities in the primary promotion area; 20 cities in the positive promotion area; and 30 cities in the encouraging promotion area.
Given the large amount of analytical data, it is complex and difficult to conduct manual analysis. Therefore, using computerized tools to aid this research is an appropriate choice. NVvio software has been used as a content analysis tool in various studies, including for waste management [24], building energy performance [25], worksite safety [26], and prefabricated construction management [27]. In particular, its “Code” function enables users to deal with thousands of pieces of information. Therefore, this paper adopted NVivo software to conduct further analysis. For comprehensive analysis, the incentive policies were categorized into two detailed levels according to the nodes in NVivo: the first-level incentive policies involve 7 categories, namely, categories A~G (see Table 1), while the second-level incentive policies consist of the subcategories of the above 7 categories of policies. The specific operating steps in NVivo are as follows:
First, the “Sources” (namely specific policy terms in this paper) were imported into NVivo, then analyzed with the help of the “Code” function. Furthermore, each term should be analyzed and then categorized into the corresponding node according to the same content; this process is called “coding” [25]. For example, according to a term stating that projects with over 70% assembly rate in Beijing could be given a fund reward, a three-level node structure was generated. The third-level node was “Fund reward”, the second-level node was “Fund support”, and the first-level was “Primary promotion area”, because the city of Beijing belongs within the primary promotion area. In accordance with the aforesaid classification rules, the contents of each term can be categorized into the corresponding nodes.
3. Results and Discussion
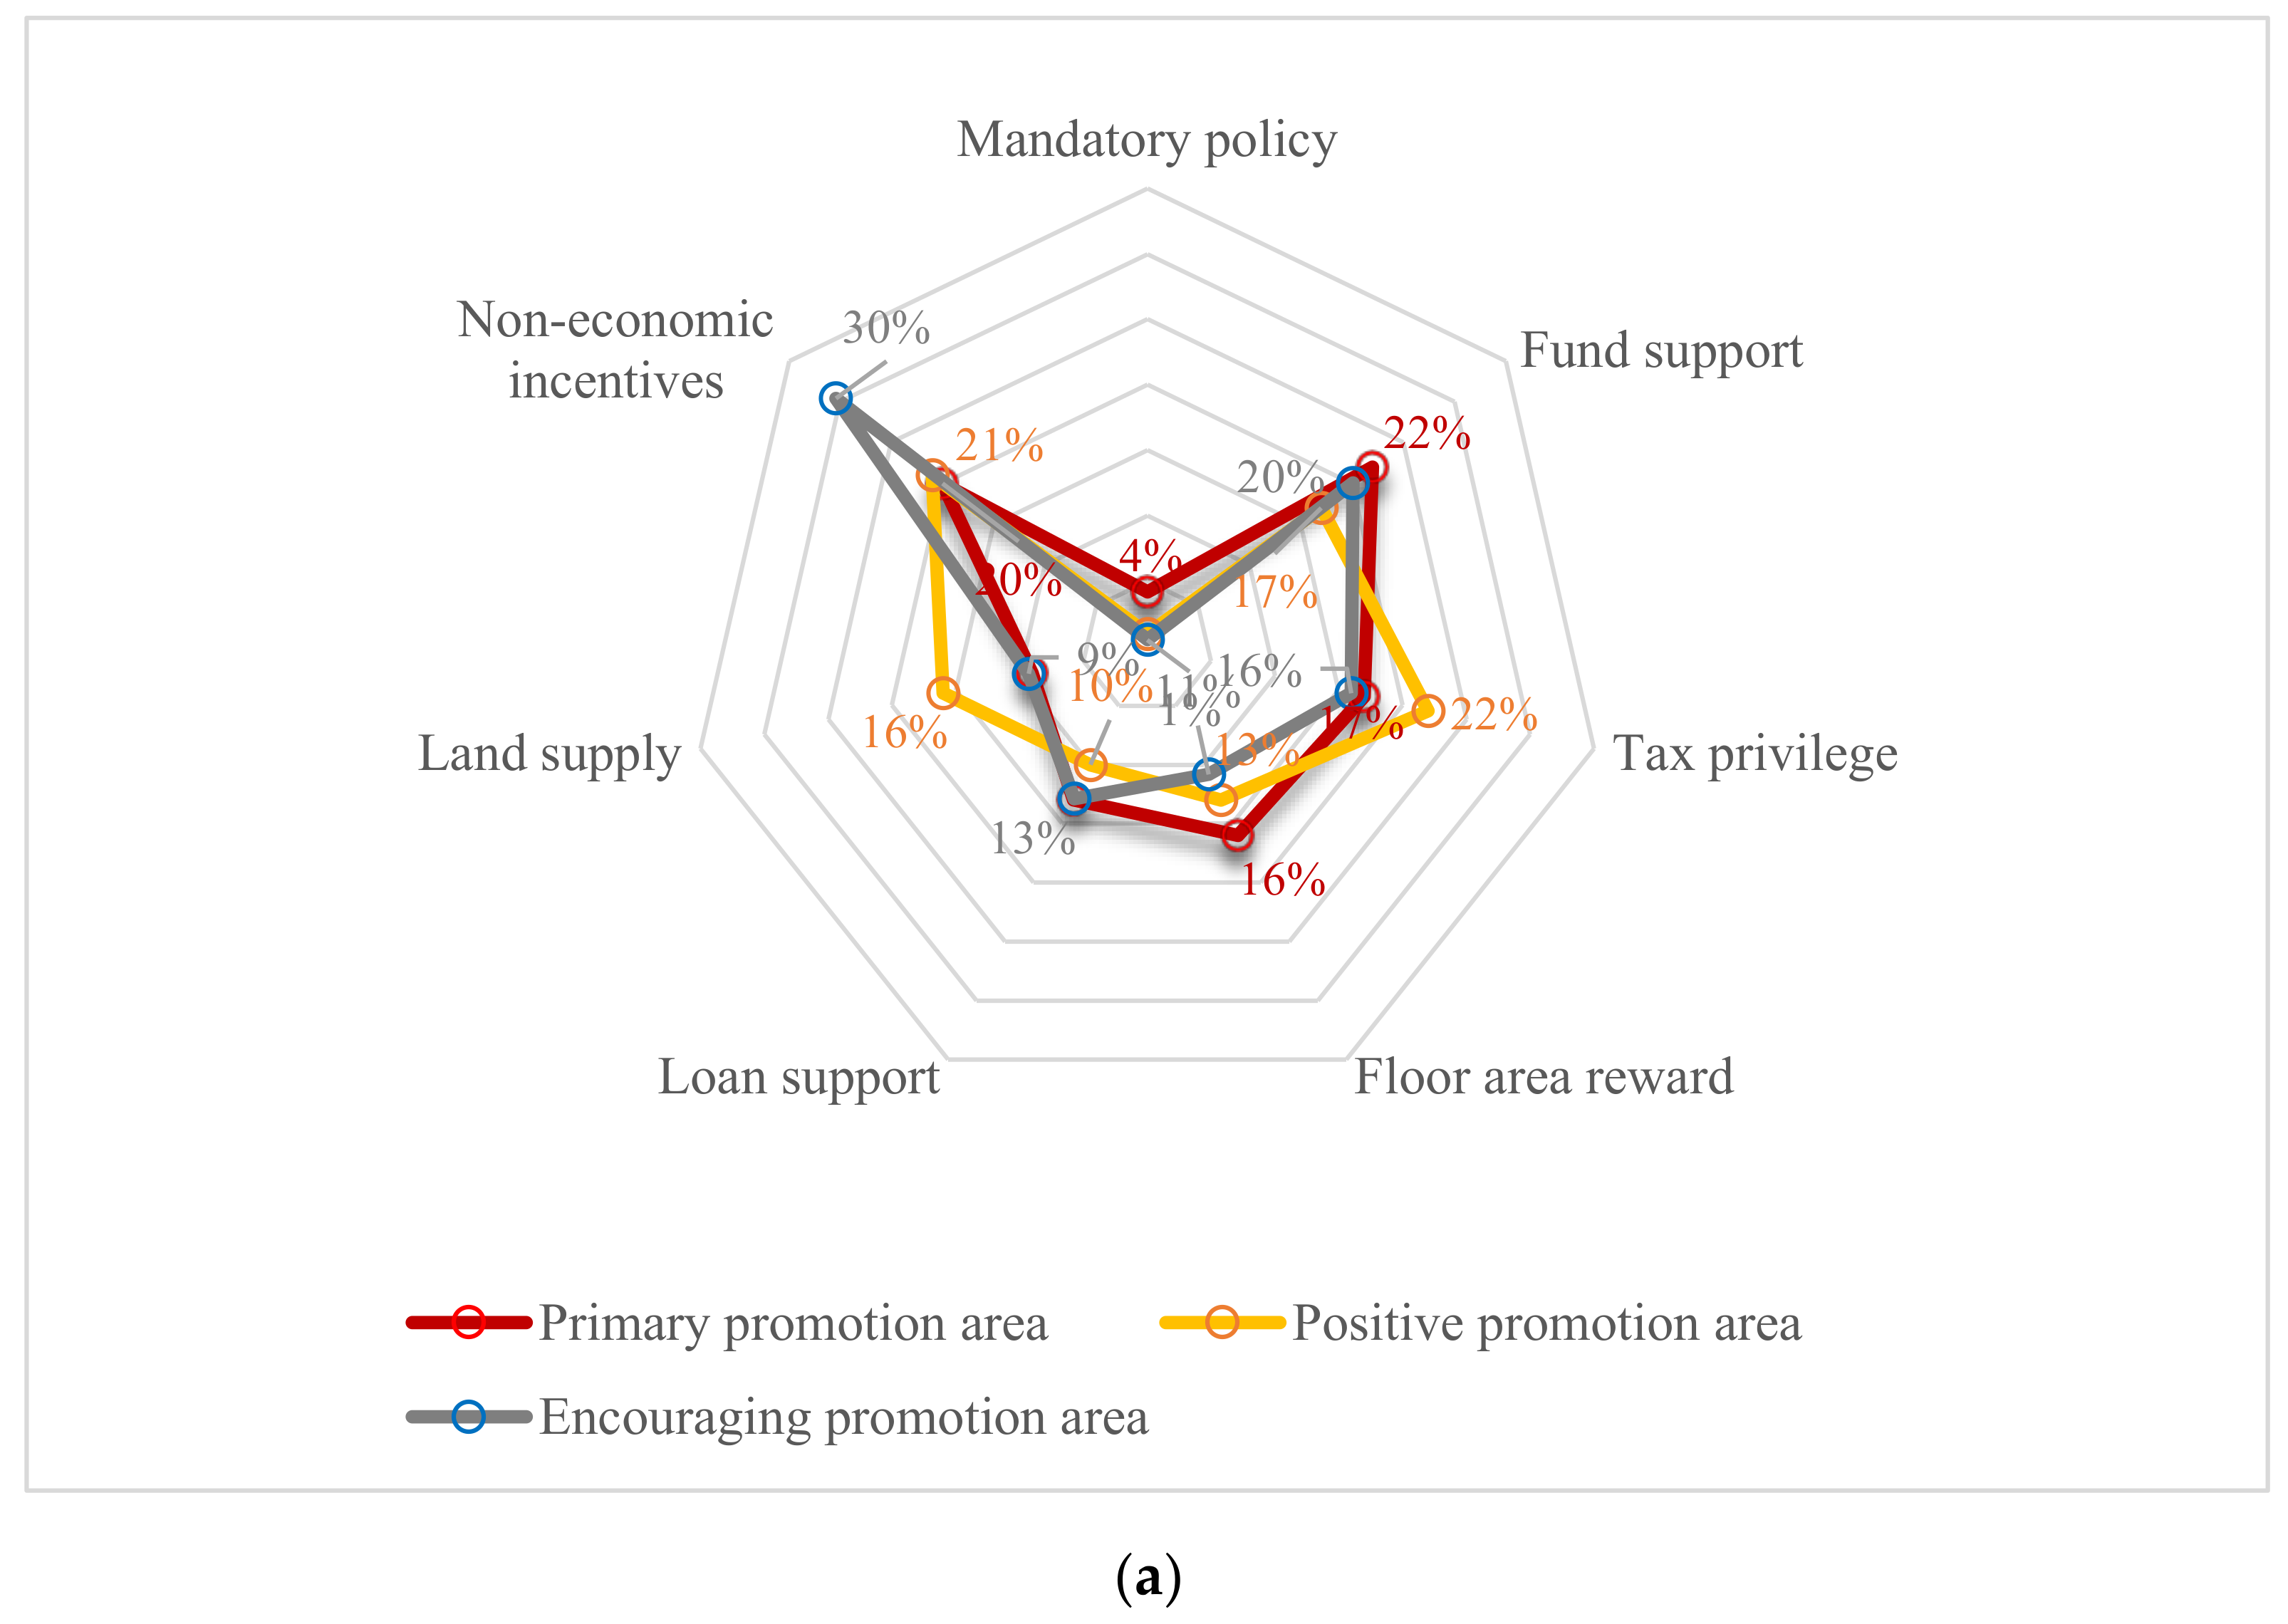
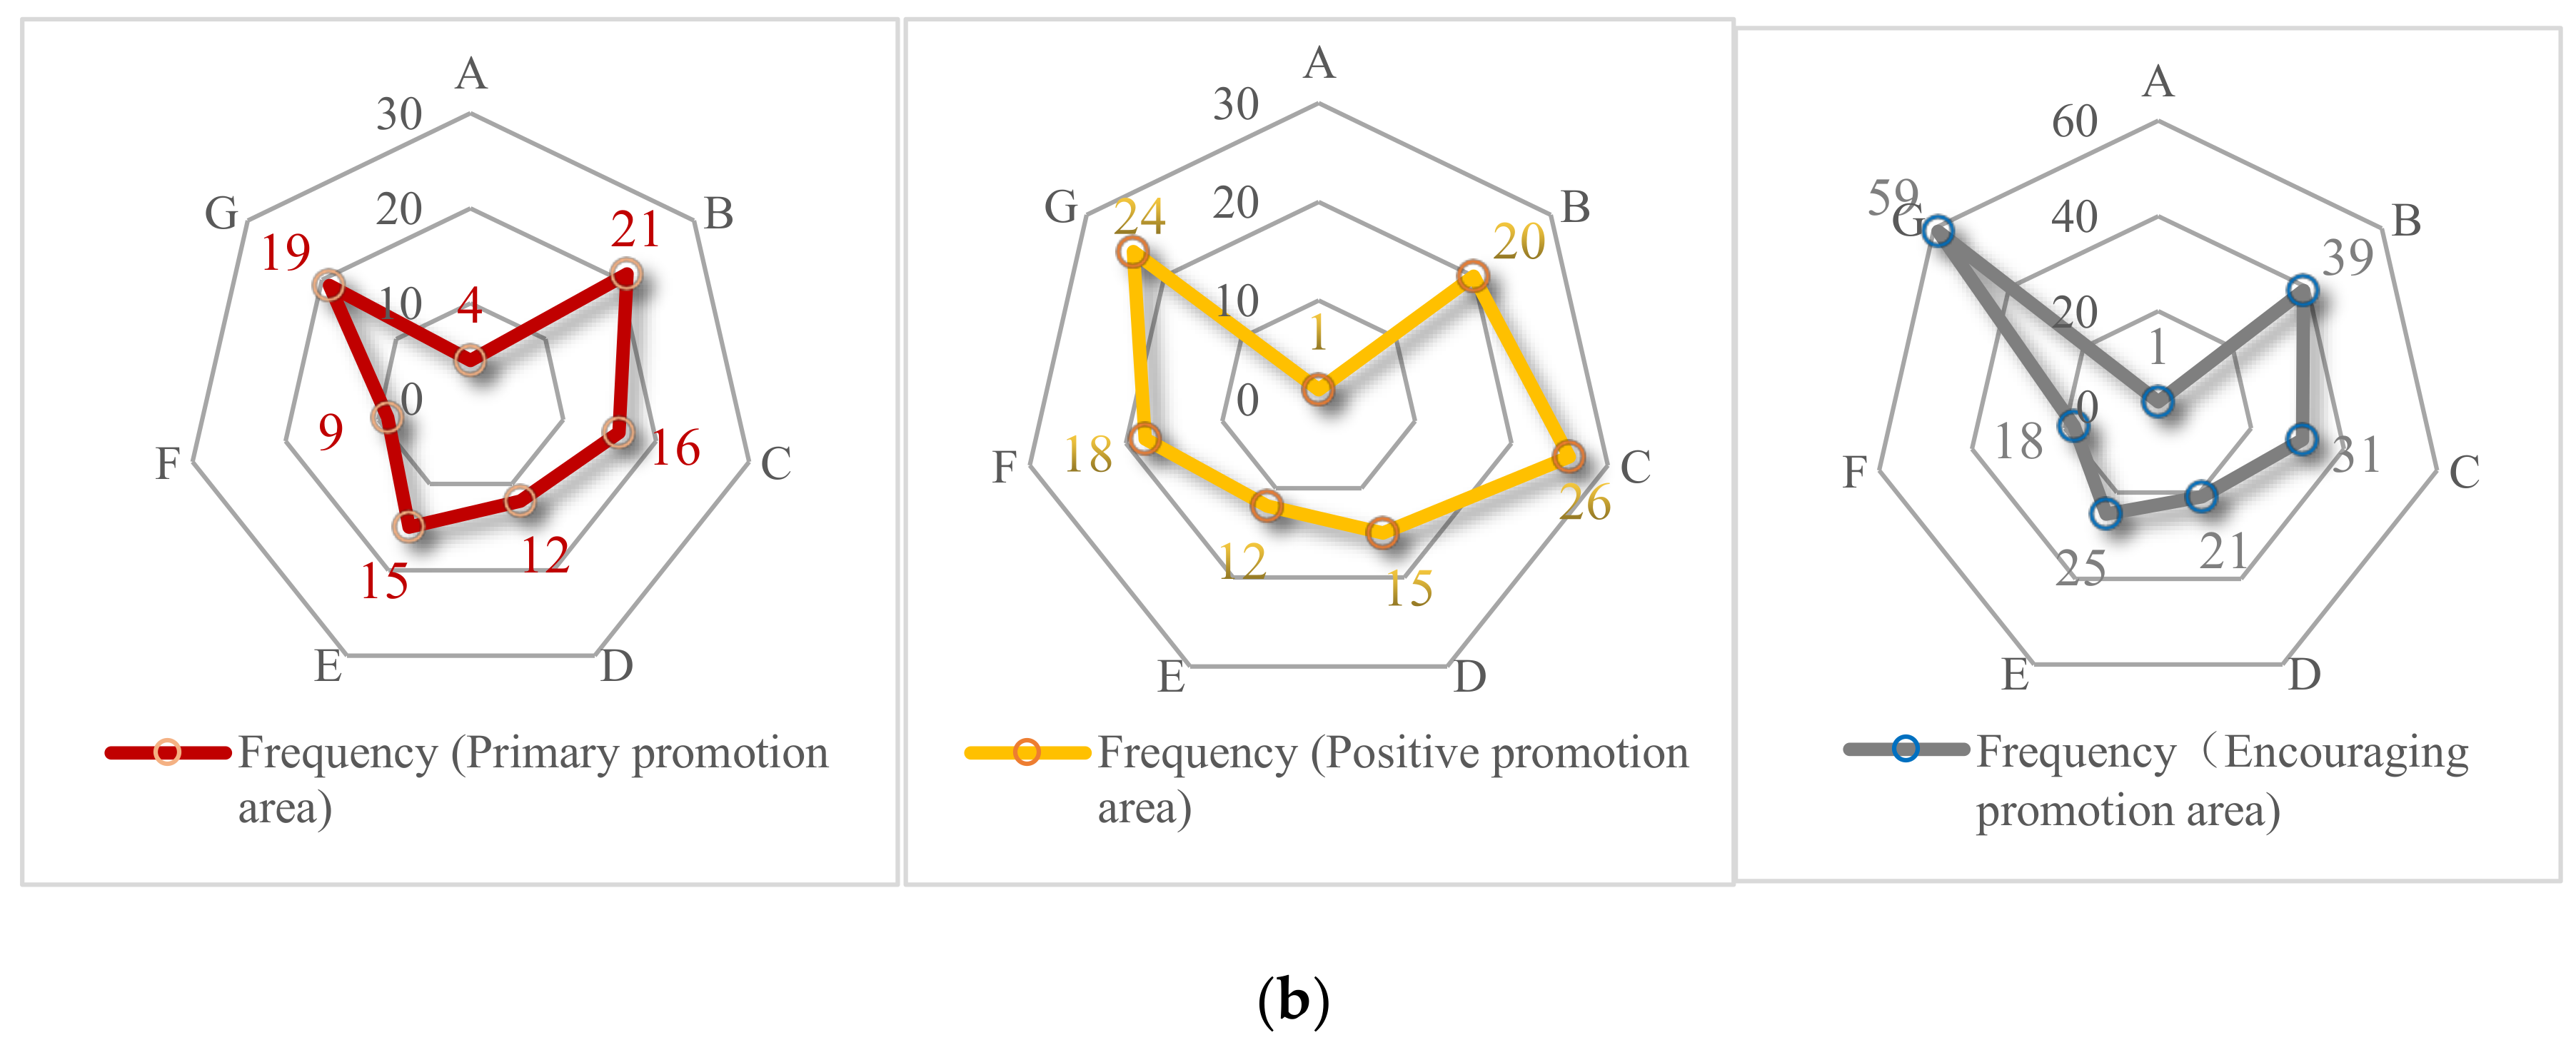
The categories of incentive policies, including mandatory policy, fund support, tax privilege, floor area reward, loan support, land supply, and non-economic incentives, are presented in Table 1 and Figure 2. The results can be explained from two perspectives. Comparing the proportion of the same policy used in different areas, the primary promotion area accounts for the largest proportion in fund support (22%), followed by floor area reward (16%), loan support (13%), and mandatory policy (4%); the positive promotion area accounts for the largest proportion in tax privilege (22%), followed by land supply (16%); and the encouraging promotion area accounts for the largest proportion in non-economic incentives (30%), loan support (13%), and mandatory policy (4%). In terms of policy frequency, in the primary promotion area, the most frequently occurring policy is fund support (21), the least frequent is mandatory policy (4); in the positive promotion area, the most frequently occurring policy is tax privilege (26), and the least frequent is mandatory policy (1); in the encouraging promotion area, the most frequently occurring policy is reputation incentives (59), the least frequent is mandatory policy (1).
The data reflects a phenomenon similar to other jurisdictions, such as Hong Kong and Singapore, wherein the application of prefabricated techniques has been limited in private sector in recent decades [8]. Influenced by the factors of cost, technology, professionals, and so on, the market scale of prefabricated buildings is still small; despite prefabrication being able to directly generate benefits for the environment, some private developers remain unwilling to adopt prefabrication [28]. To promote the adoption of prefabrication in private sector, the government has promulgated massive incentives based on mandatory policy. Whether in the primary promotion area, the positive promotion area, or the encouraging promotion area, it can be found that the top three policies, accounting for a significant proportion of the total, were non-economic incentives, fund support, and tax privilege. In previous studies, many researchers have proposed policies with economic incentives, because that high capital cost is the key factor influencing the choice of construction methods [29]. In addition to the economic incentives, non-economic incentives should also be considered in order to motivate stakeholders to adopt prefabrication [30]. The fact that non-economic incentives account for the largest proportion of the above three promotion areas demonstrates its importance. Although there have been studies related to non-economic incentives, such as the establishment of reputation incentive mechanisms [31], the number of studies is still few, and more attention should be paid to this in future studies.
3.1. Mandatory Policy
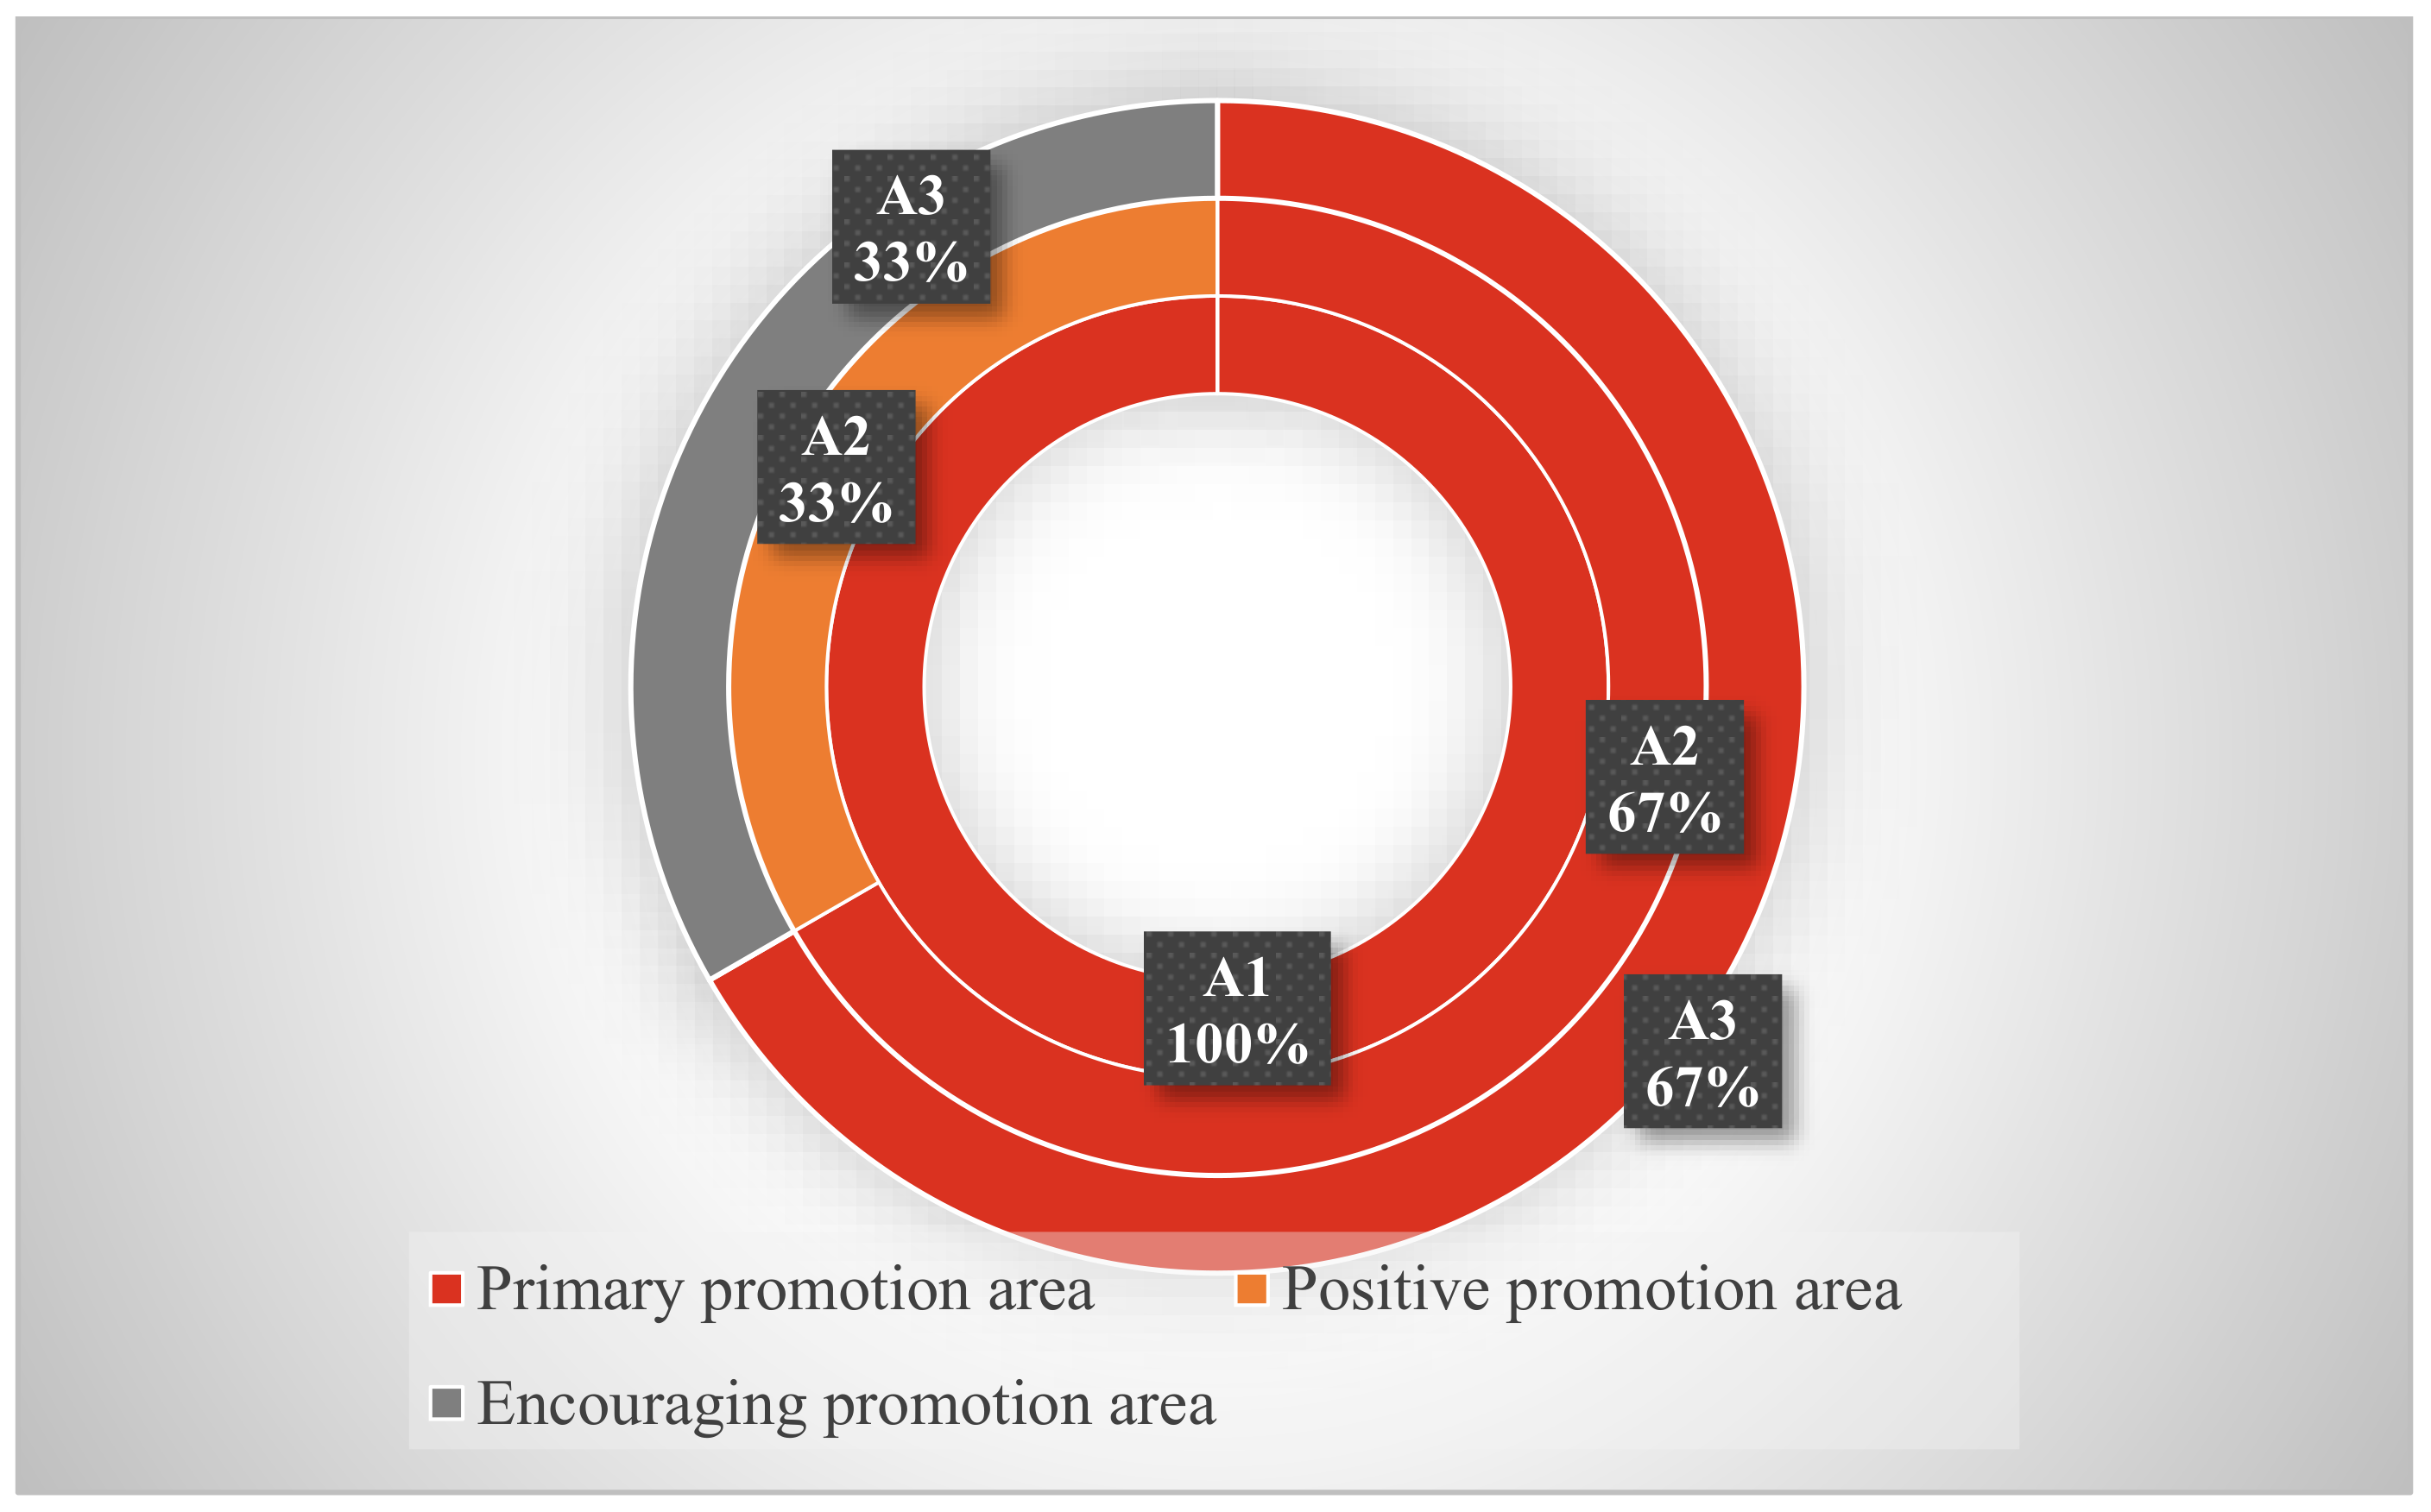
According to the data shown in Table 2, the mandatory policies are reflected in three aspects: affordable housing project support (A1), punishments for contract violation (A2), and disposal of unqualified projects (A3). Figure 3 further reveals the proportions of these three mandatory policies in different promotion areas. From the perspective of mandatory policy, A1, A2, and A3 are the most frequently used in the primary promotion area, the proportions are 100% (A1), 67% (A2), and 67% (A3), respectively. From the perspective of promotion areas, three mandatory policies are adopted in the primary promotion area with the same frequency; the most frequent mandatory policy adopted in positive promotion area is A2; the most frequent mandatory policy adopted in the encouraging promotion area is A3.
It can be found that no matter which mandatory policy is adopted, the proportion of the primary promotion area adopting this policy is the largest. Compared with other areas, cities in the primary promotion area like Beijing, Tianjin, and Shanghai have limited construction land [32], dense populations, and active economies [33,34], leading to rising housing demand and prices [35]. To address these housing problems, the government has provided plenty of affordable housing for living, especially in the primary promotion area. Meanwhile, due to the lack of adequate practice and experience in prefabricated construction [13], support for affordable housing projects offers a great opportunity for the development of prefabrication, with its characteristics of large scale, simple design and standardized structure. Other than promoting prefabrication with positive incentives, punitive measures also promote the development of prefabrication. To reduce the influences of contact violation and unqualified projects on prefabricated construction, it is necessary to formulate mandatory punitive policy regarding these two aspects.
3.2. Incentives
3.2.1. Fund Support
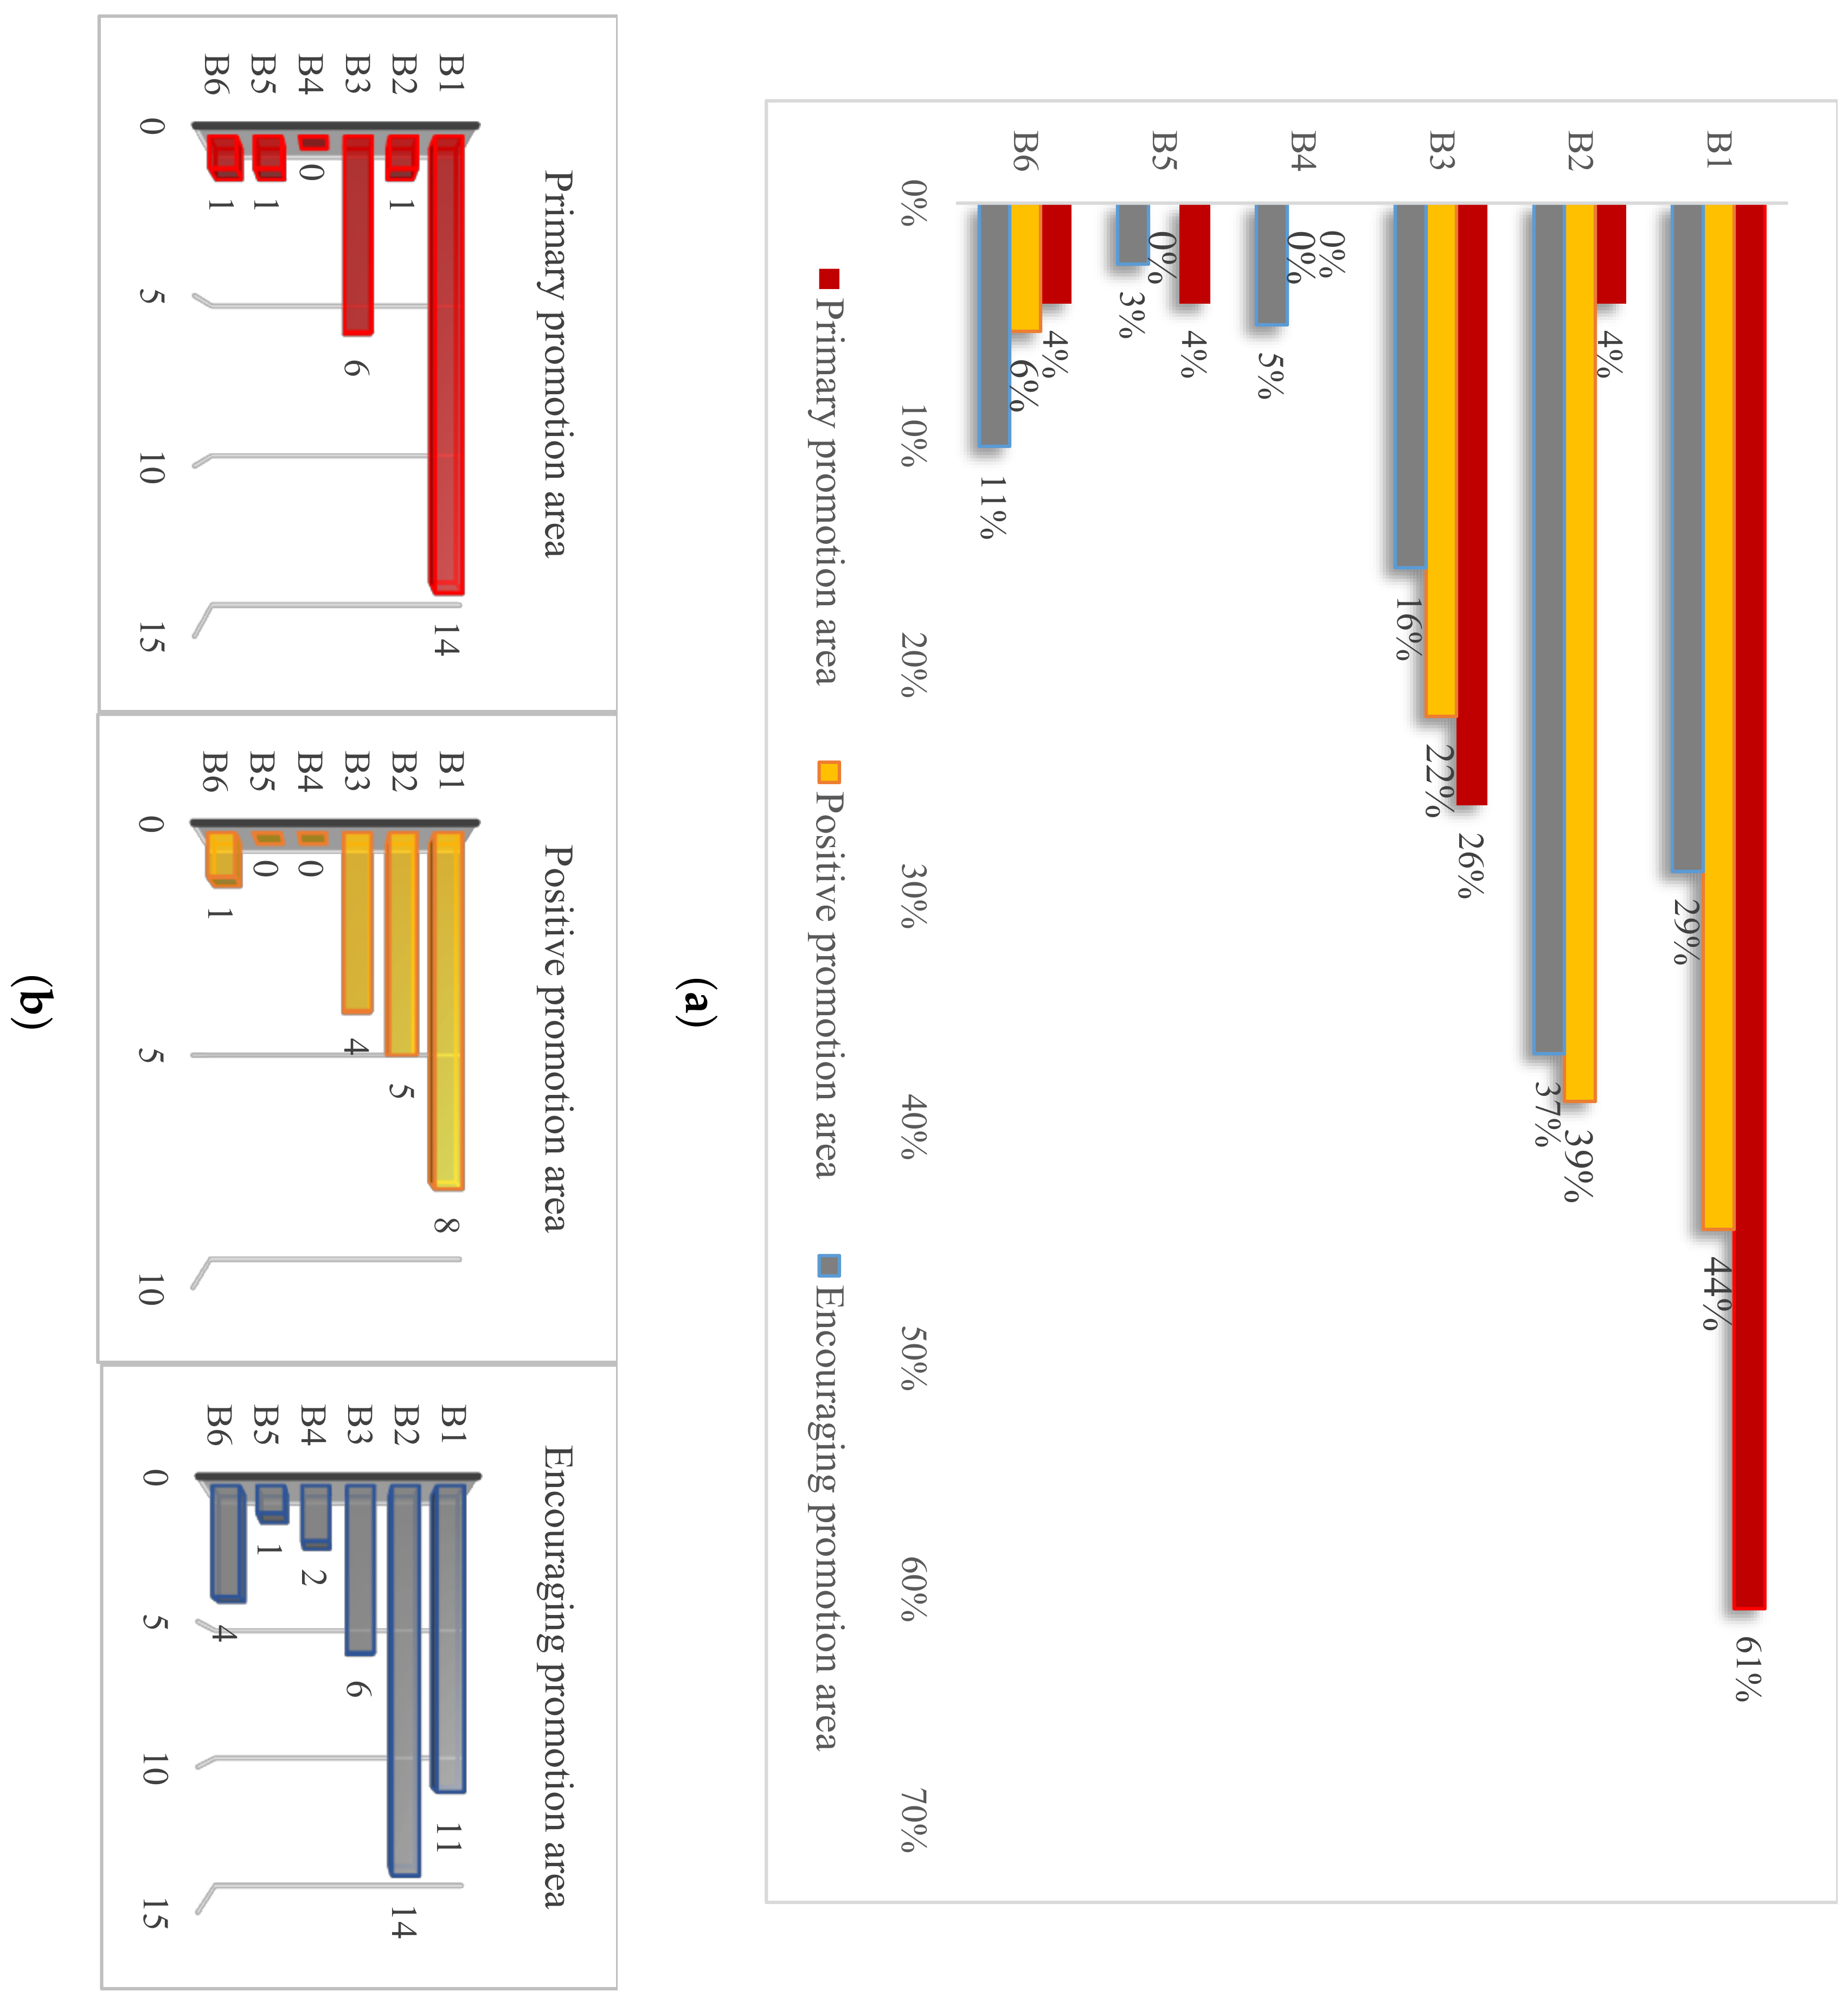
The specific policies of fund support include financial reward (B1), special fund support (B2), incorporation of incremental costs into construction costs (B3), post-construction subsidy (B4), expansion of the use of original special funds (B5), and preferential policy for other fees (B6) (e.g., social insurance fee). Although there has been a series of policies, the focuses of these policies varied from area to area (see Figure 4). On the whole, the policies of B1, B2 and B3 account for the largest proportions compared with B4, B5, and B6, which demonstrates their effectiveness in most cities in China. To be specific, in the primary promotion area, the percentage of using B1 is up to 61%, followed by B3 (26%). Although B2 was frequently used in the other two promotion areas, it was rarely used in the primary promotion area. In the positive promotion area, the percentage of using B1 was close to 50%, followed by B2 (39%) and B3 (22%). In the encouraging promotion area, B2 accounted for the largest proportion (37%), followed by B1 (29%) and B3 (16%).
The overall results are similar to the findings of previous studies, namely, that financial support is a direct and effective way to motivate the adoption of a particular action [36,37]. Arguably, “Financial reward” (B1) should be the foremost policy considered in all promotion areas for promoting prefabrication. However, the most frequent policy implemented in the encouraging promotion area was “Special fund support” (B2). For example, the Xiangyang (in Hubei province) government provided special funds on circular economy development for manufacturers of prefabricated components. In comparison to the cities in the primary promotion area, the economic construction of cities in the encouraging promotion area remained at a low level. Take private developers in the encouraging promotion area, for example, high initial costs discouraged them from using prefabrication due to the limited funds; support from special funds could release their economic burden. In contrast, the policy of special fund support is more adaptable to cities with low economic levels in the positive promotion area and the encouraging promotion area.
3.2.2. Tax Privilege
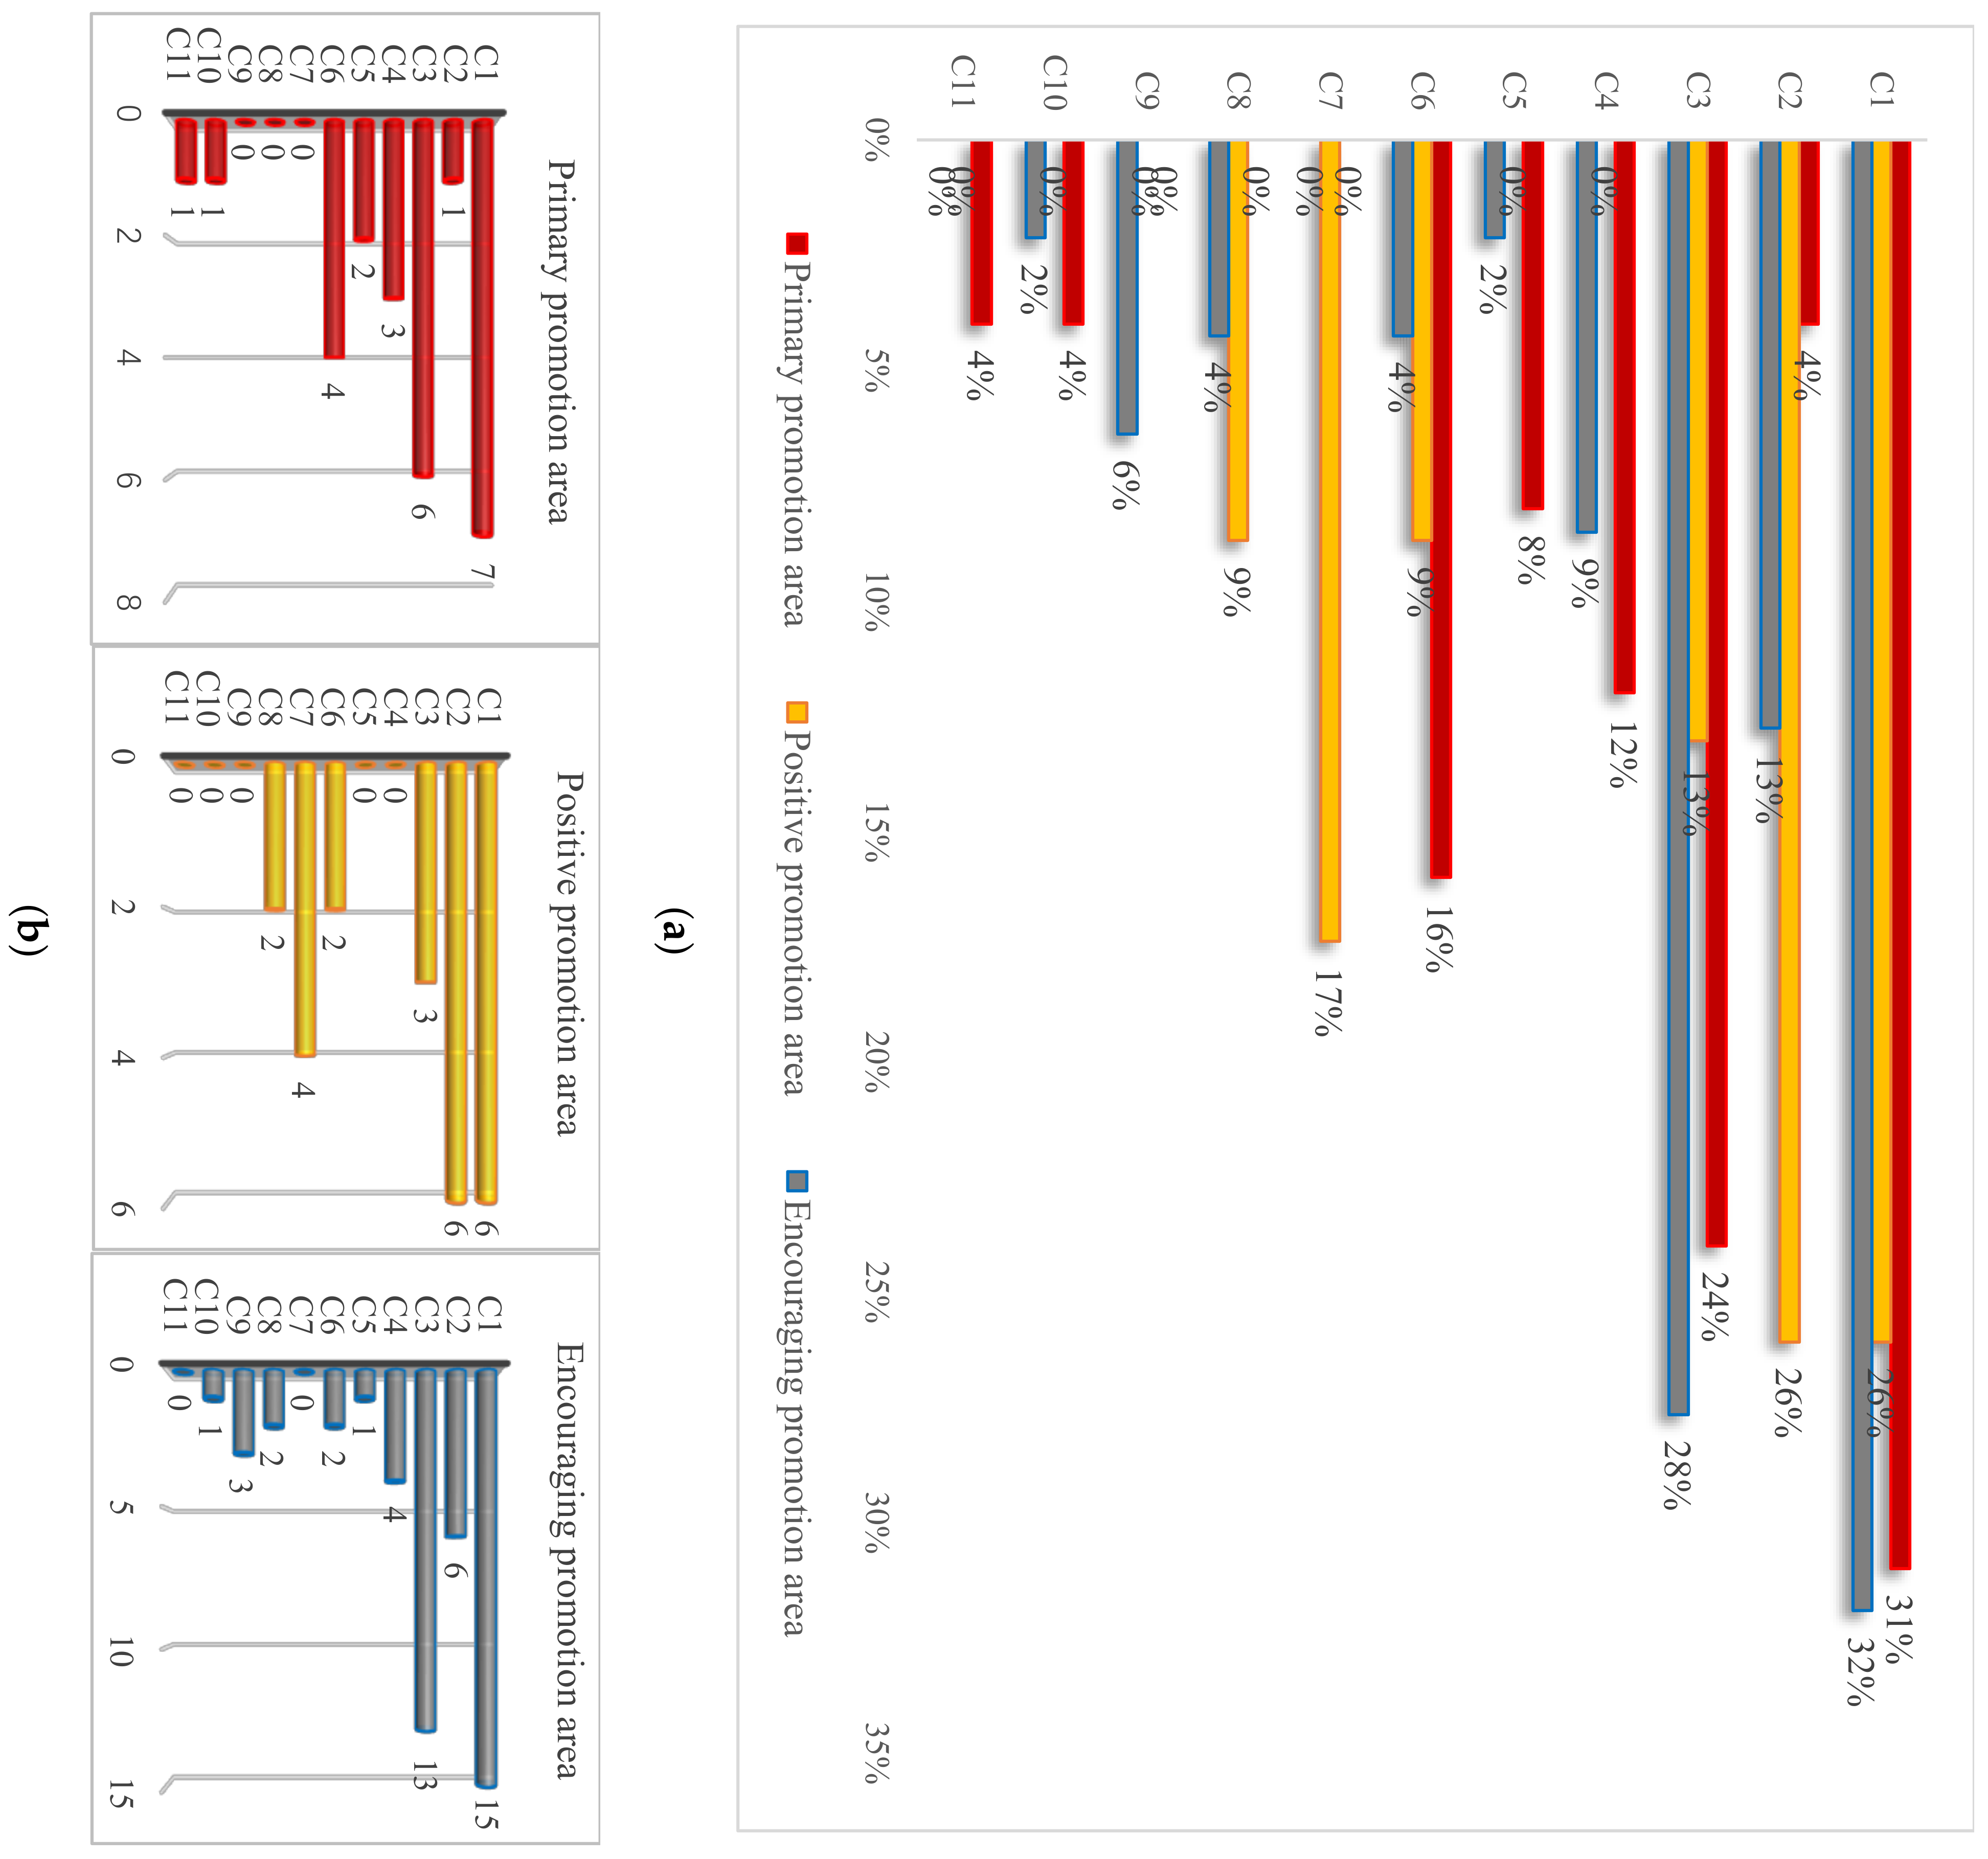
The policy of tax privilege includes 11 categories, and the targeted stakeholders include private developers, contractors, manufacturers, research institutions and consumers. Among these policies, C1 and C2 were formulated for manufacturers; C3 was formulated for contractors; C4 was formulated for research institutions; C5, C6, C7, C8, C9, and C11 were formulated for private developers; C10 was formulated for consumers. Comparing the proportions shown in Figure 5, it can be found that C1, C2, C3, and C6 have been widely implemented in the above three promotion areas, C4, C5, C10, and C11 have been extensively used in the primary promotion area, C7 and C8 have been commonly adopted in the positive promotion area, and C9 has been popularly applied in the encouraging promotion area.
The supply of components in conventional construction is limited to the contractual relationship between contractors and suppliers [38], while the supply of prefabricated components is limited to the contractual relationship between developers and manufacturers. For manufacturers, due to the fact that the market scale hasn’t been formed, the manufacturing cost of prefabricated components is heavy. At the same time, with the additional payments of tax, there are only a few precast factories in China, leading to the high prices for prefabricated components, which further impedes developers in adopting prefabrication, thus hindering the development of prefabrication. Accordingly, the government has promulgated not only financial incentives, but also tax privileges for manufacturers. The basic tax incentives, including value-added tax (VAT) and income tax (IT), are adaptable to all promotion areas. For example, the Hebei government offered manufacturers a tax incentive consisting of a 50% VAT rebate if the materials met the relevant regulations. This not only releases the economic burden from manufacturers, but also controls the price of the prefabricated components.
For contractors, the policy of tax privilege is related to the quality guarantee deposit. At present, one popular implemented policy is the calculation of the quality guarantee deposit by multiplying the contract price (minus the total price of prefabricated components) by 2%. This practice has proved that contractors are more willing to adopt prefabrication after the implementation of tax privilege in some cities such as Zhejiang and Heilongjiang.
For research institutions, due to the development of prefabrication in China is still in its initial stage at present, it is necessary to establish relevant scientific research institutions to explore relevant technology, standardized design, construction method, etc. The current research institutions involve universities, scientific research institutions, and research department in enterprises. To successfully conduct scientific research, the governments in many cities provide research and development expenses. This policy has been widely implemented in these promotion areas according to the economic development level in different areas, which demonstrates its effectiveness.
For private developers, more than 50 percent of tax policies are targeted at them, focusing on the operation and maintenance stage of prefabricated buildings. Among these policies, C5, C6, and C11 are commonly used in the primary promotion area. According to a survey, most prefabricated projects are located in eastern China, such as Guangdong, Shanghai, and Jiangsu, where they are within the primary promotion area. With the massive prefabricated components that are necessary to produce, there is a strong demand for infrastructure, advanced devices, etc. Thus, policies for reducing infrastructure fees, property quality guarantee deposits and tariff fees are necessary for developers.
For consumers, housing prices directly affect their purchases of prefabricated residential buildings. According to a report “2016 Zhuhai property market report”, the average housing price in big cities such as Zhuhai can reach up to 19612.62 RMB/m2, let alone in mega cities such as Beijing. Compared with conventional buildings, the higher housing price of prefabricated buildings keeps consumers away. In addition to direct financial subsidy, the most effective way is to reduce the house deed tax, which has been widely implemented not only in the primary promotion area, but also in the positive promotion area and the encouraging promotion area.
3.2.3. Loan Support
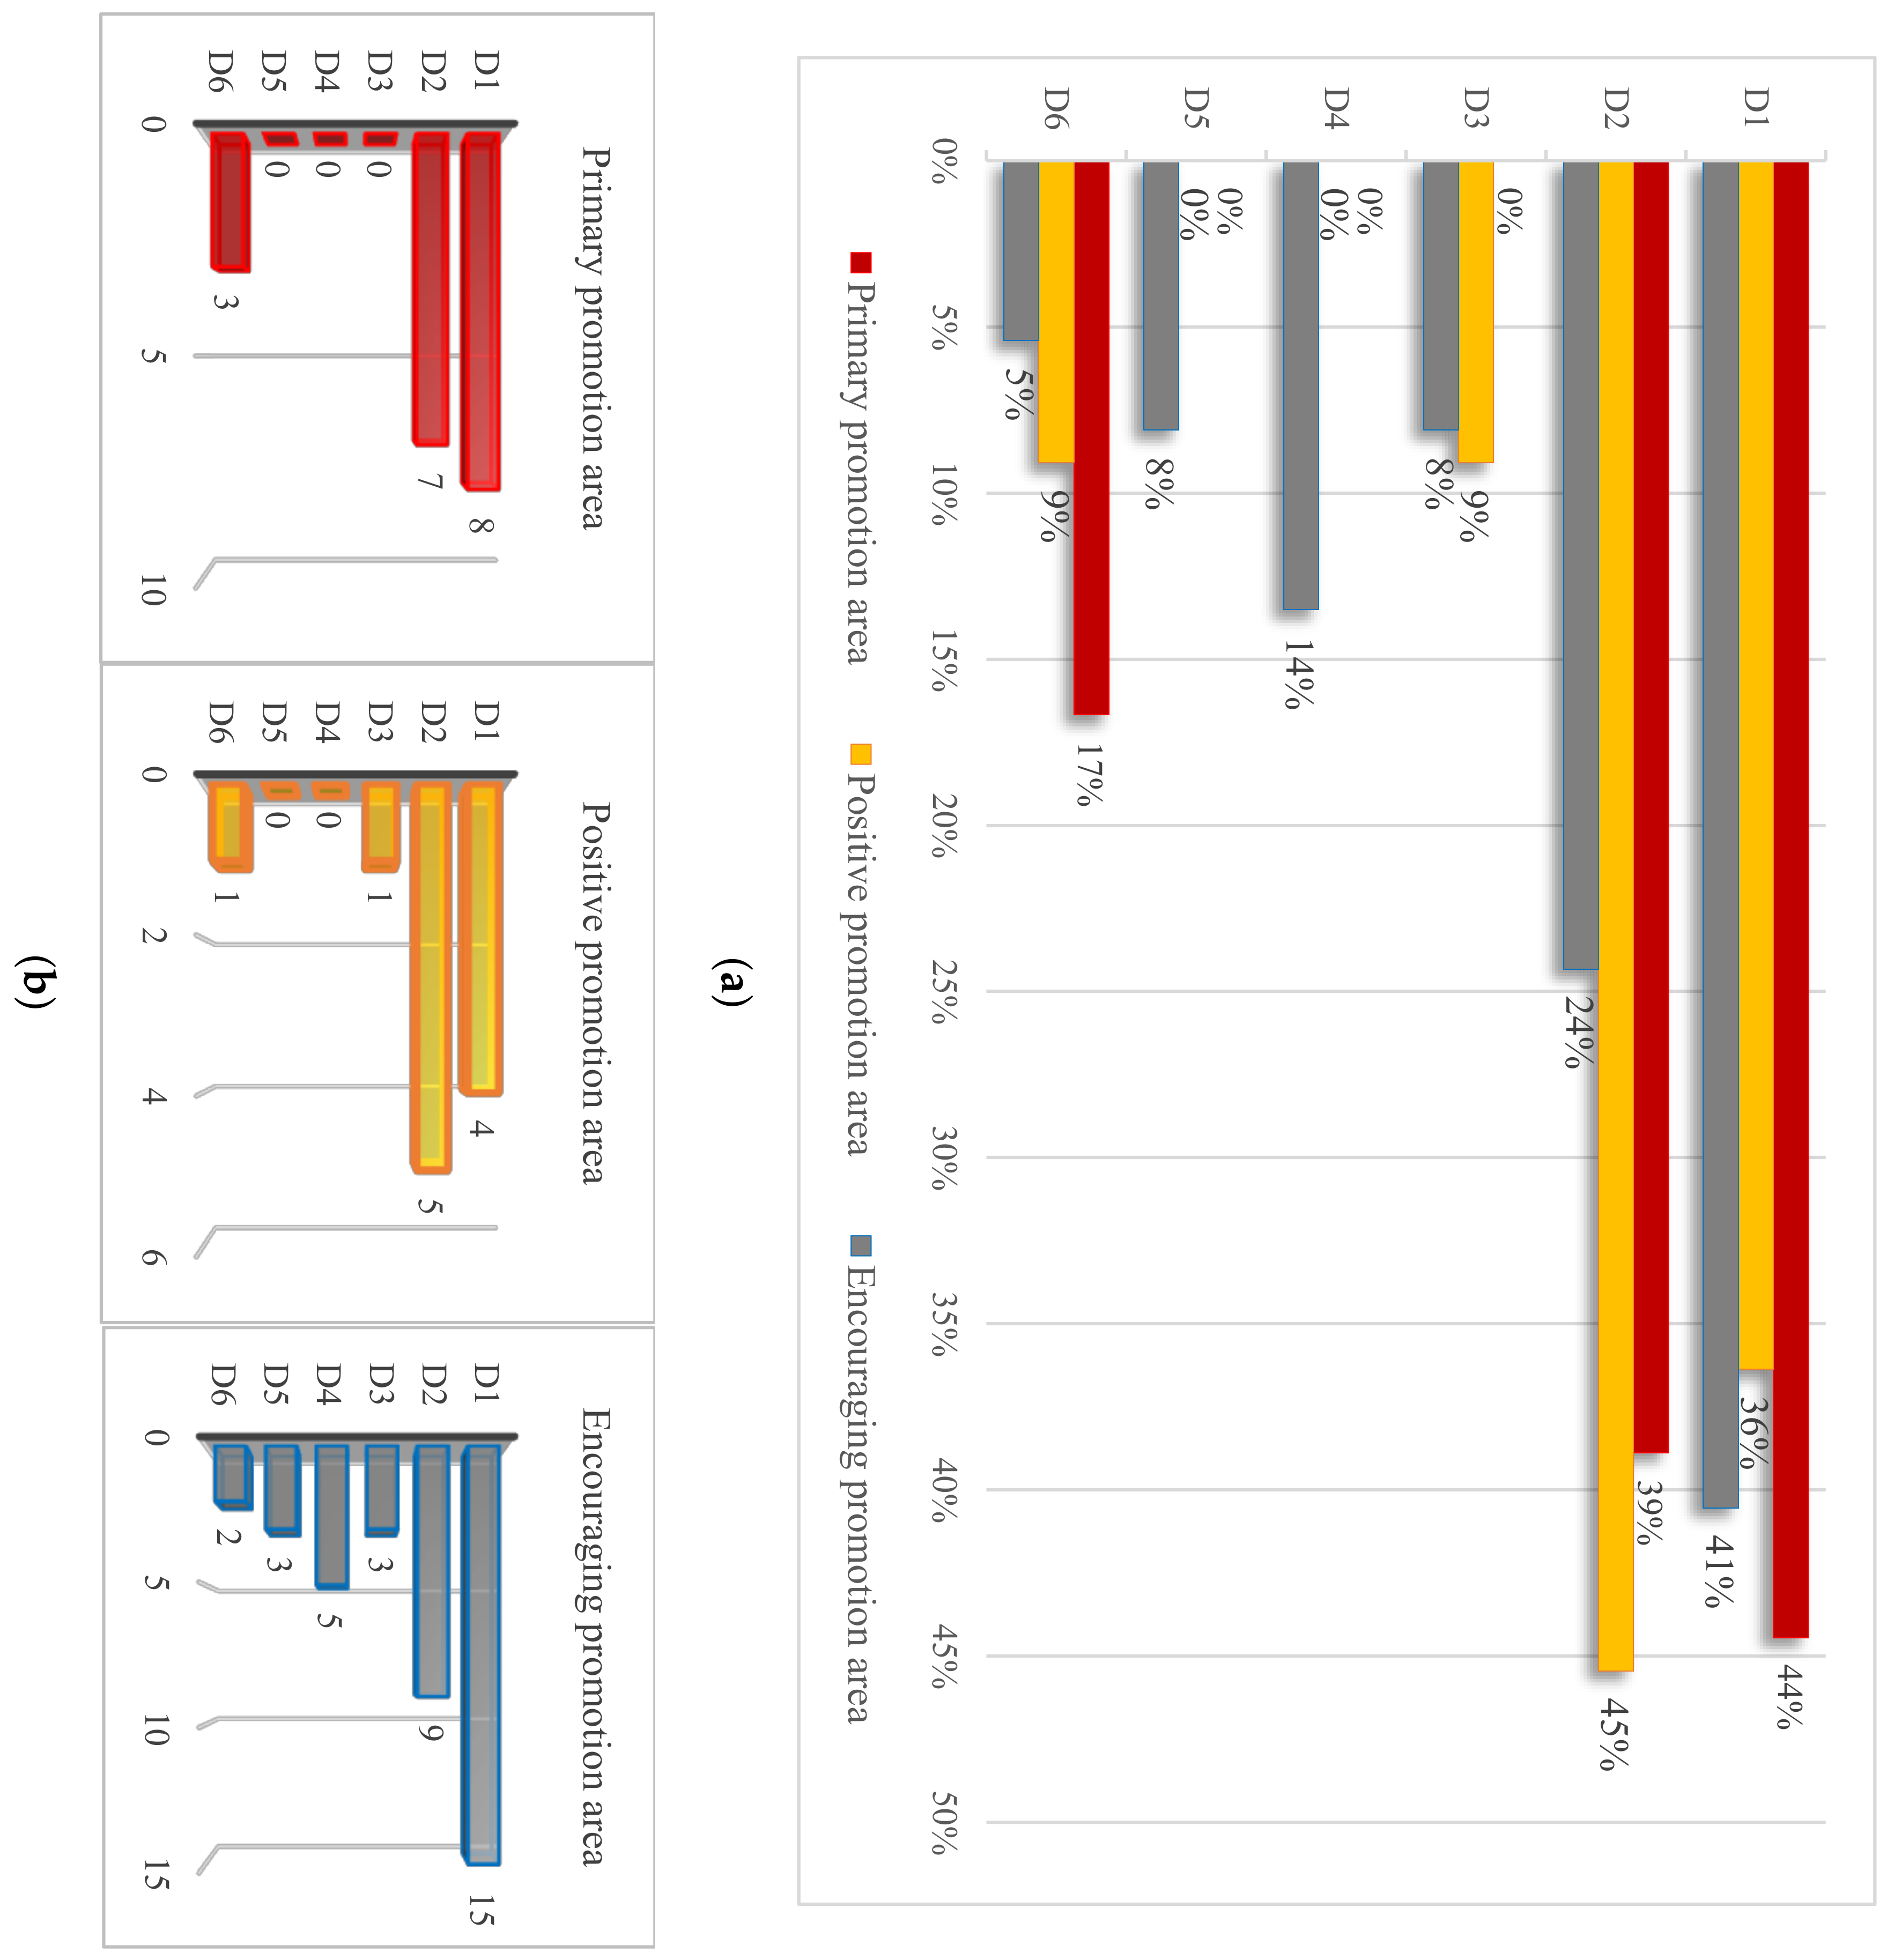
Figure 6 shows the categories of loan support, including “Priority lending” (D1), “Raise the loan limit and credit period” (D2), “Subsidized interest” (D3), “Capital attraction” (D4), “Broaden financing channels” (D5), and “Minimum down payment ratio of housing fund loan” (D6). The main stakeholders involved in the policy of loan support include private developers and consumers; D1, D3, D4, and D5 were formulated for private developers, while D2 and D6 were formulated for consumers. The numerical comparison in Figure 6 reveals that the policies implemented in different promotion areas are different. According to the overall proportion of policies adopted, D1, D2 and D6 are widely used in all promotion areas, while D3, D4 and D5 are commonly used in the encouraging promotion area.
The decisive role of developers in adopting prefabrication has been highlighted by many scholars [39,40]. However, over the past decades, many developers have rejected the use of prefabrication because they did not have enough funds to afford the high initial cost [28]. The implementation of loan support has achieved great results; for example, the Shandong government encourages financial service institutions (e.g., banks) to provide loan support with respect to loan limits, credit periods, and interest rates to enterprises within the building industry, which promotes the establishment of the construction industry park to some extent. In addition to the basic policy of priority lending, capital channeling is also effective, particularly in the encouraging promotion area. Probably for this reason, the financing partner is able to support private enterprises that are severely lacking within the encouraging promotion area. Thus, the assistance of attracting capital and broadening financing channels is crucial for these enterprises. For consumers, although massive options for prefabricated buildings structures satisfy the personalized needs of consumers, the price of prefabricated buildings is around 300~400 RMB/m2 higher than conventional buildings, which prevents them from adopting prefabrication [13]. In this context, loan support such as D2 and D6 is an effective way to release their burden.
3.2.4. Floor Area Reward
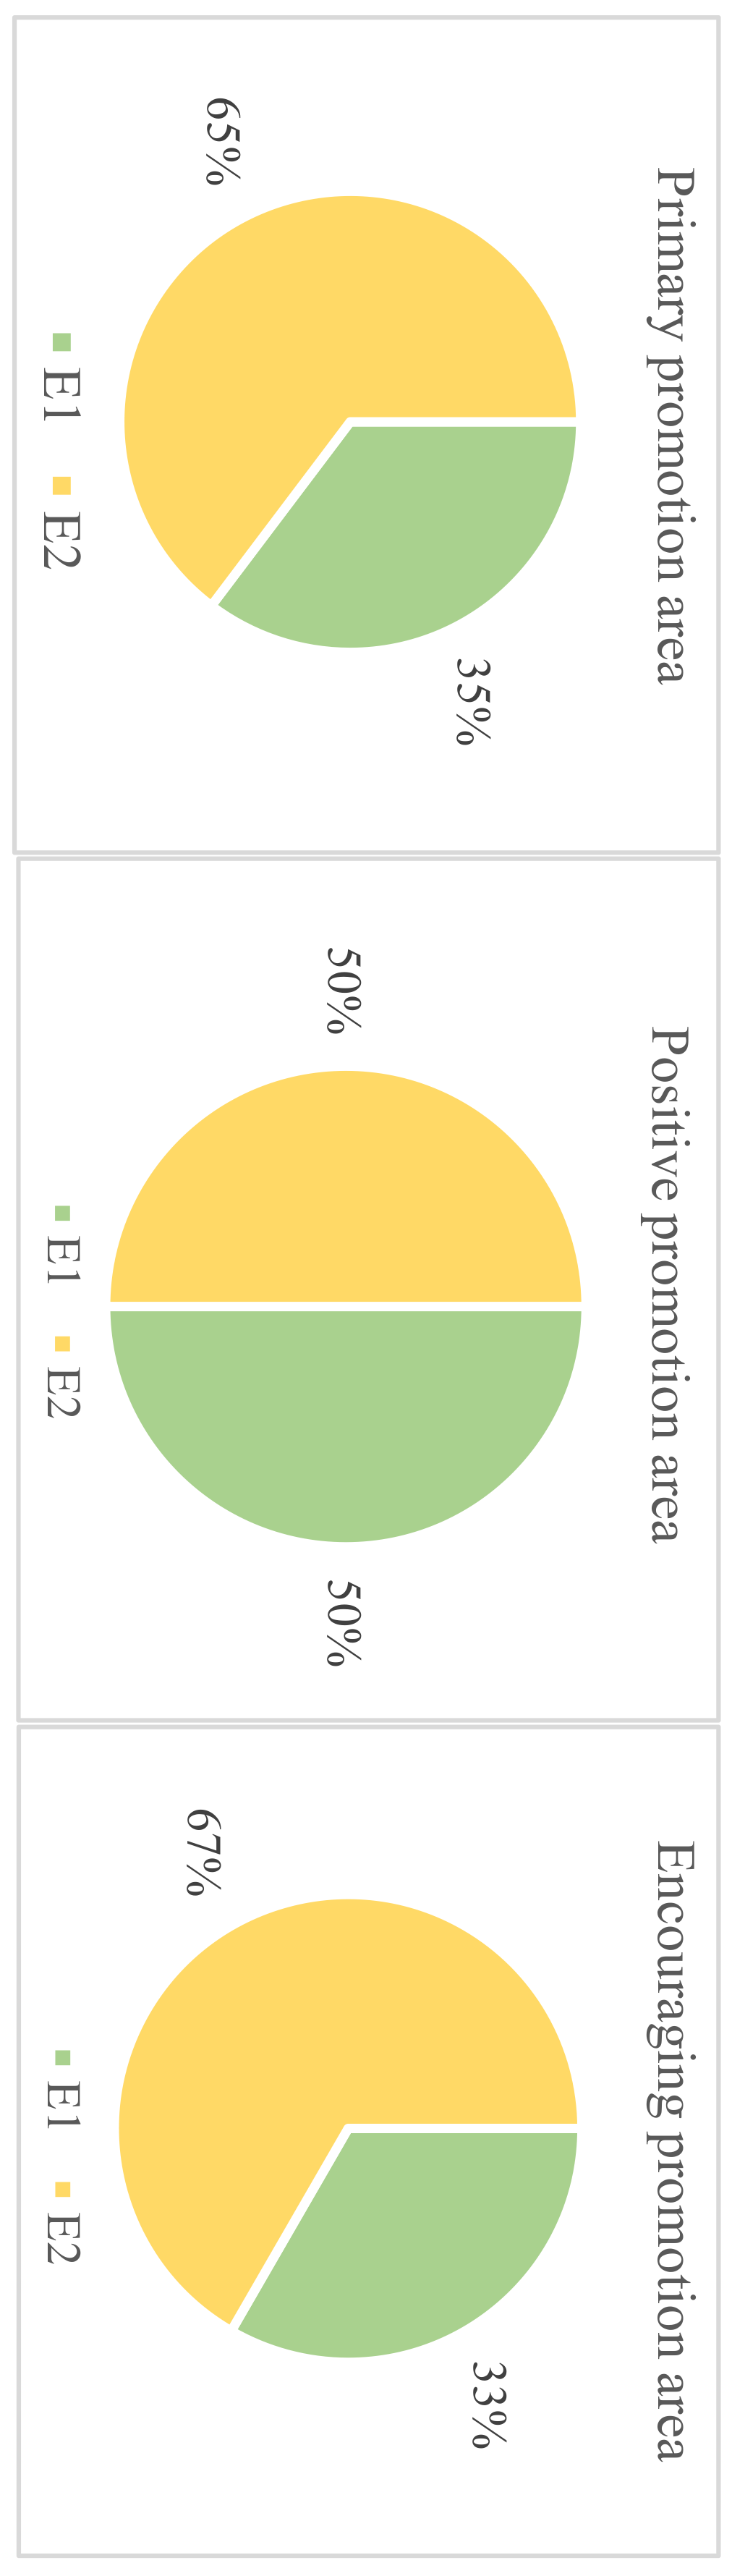
The floor area reward incentive was first issued by the Beijing municipal government in March 2010, namely, prefabricated projects can be rewarded with 3% of floor area. Since then, the governments of cities like Shanghai, Shenzhen, Changsha have stipulated a series policy related to floor area reward. The floor area reward policy includes the “Volume rate bonus” (E1) and the “Deduction of prefabricated building area of external wall” (E2) with the proportion of each policy in each of the different promotion areas being presented in Figure 7. For the proportion of promotion areas using E2, there is no obvious numerical difference between the above three promotion areas. Specifically, in the primary promotion area and the encouraging promotion area, E2 is more commonly used than E1; in positive promotion area, E1 and E2 are adopted with the same frequency (see Table 3).
E1 is aimed at balancing the incremental costs of prefabricated construction. According to a Chinese report, by the end of 2015 in Beijing, the cast in situ structure cost of prefabricated building surpassed that of conventional building by 200~500 RMB/m2, but the overall cost was basically equal to the conventional cast in situ structure, and even slightly profitable. However, due to the lower housing price in encouraging promotion area, the benefits of volume rate bonus cannot offset incremental cost. Compared with E1, focusing on the application of prefabricated technology, E2 emphasizes projects using prefabricated external wall. Although a complete technological system and standard systems have not yet been formed, prefabricated external wall technology (especially thermal insulation external wall) has led to prefabricated external wall becoming one of the main prefabricated components manufactured in precast factories [41,42]. Therefore, many prefabricated projects in the above three promotion areas have adopted this technique in order to meet the corresponding assembly rate.
3.2.5. Land Policy
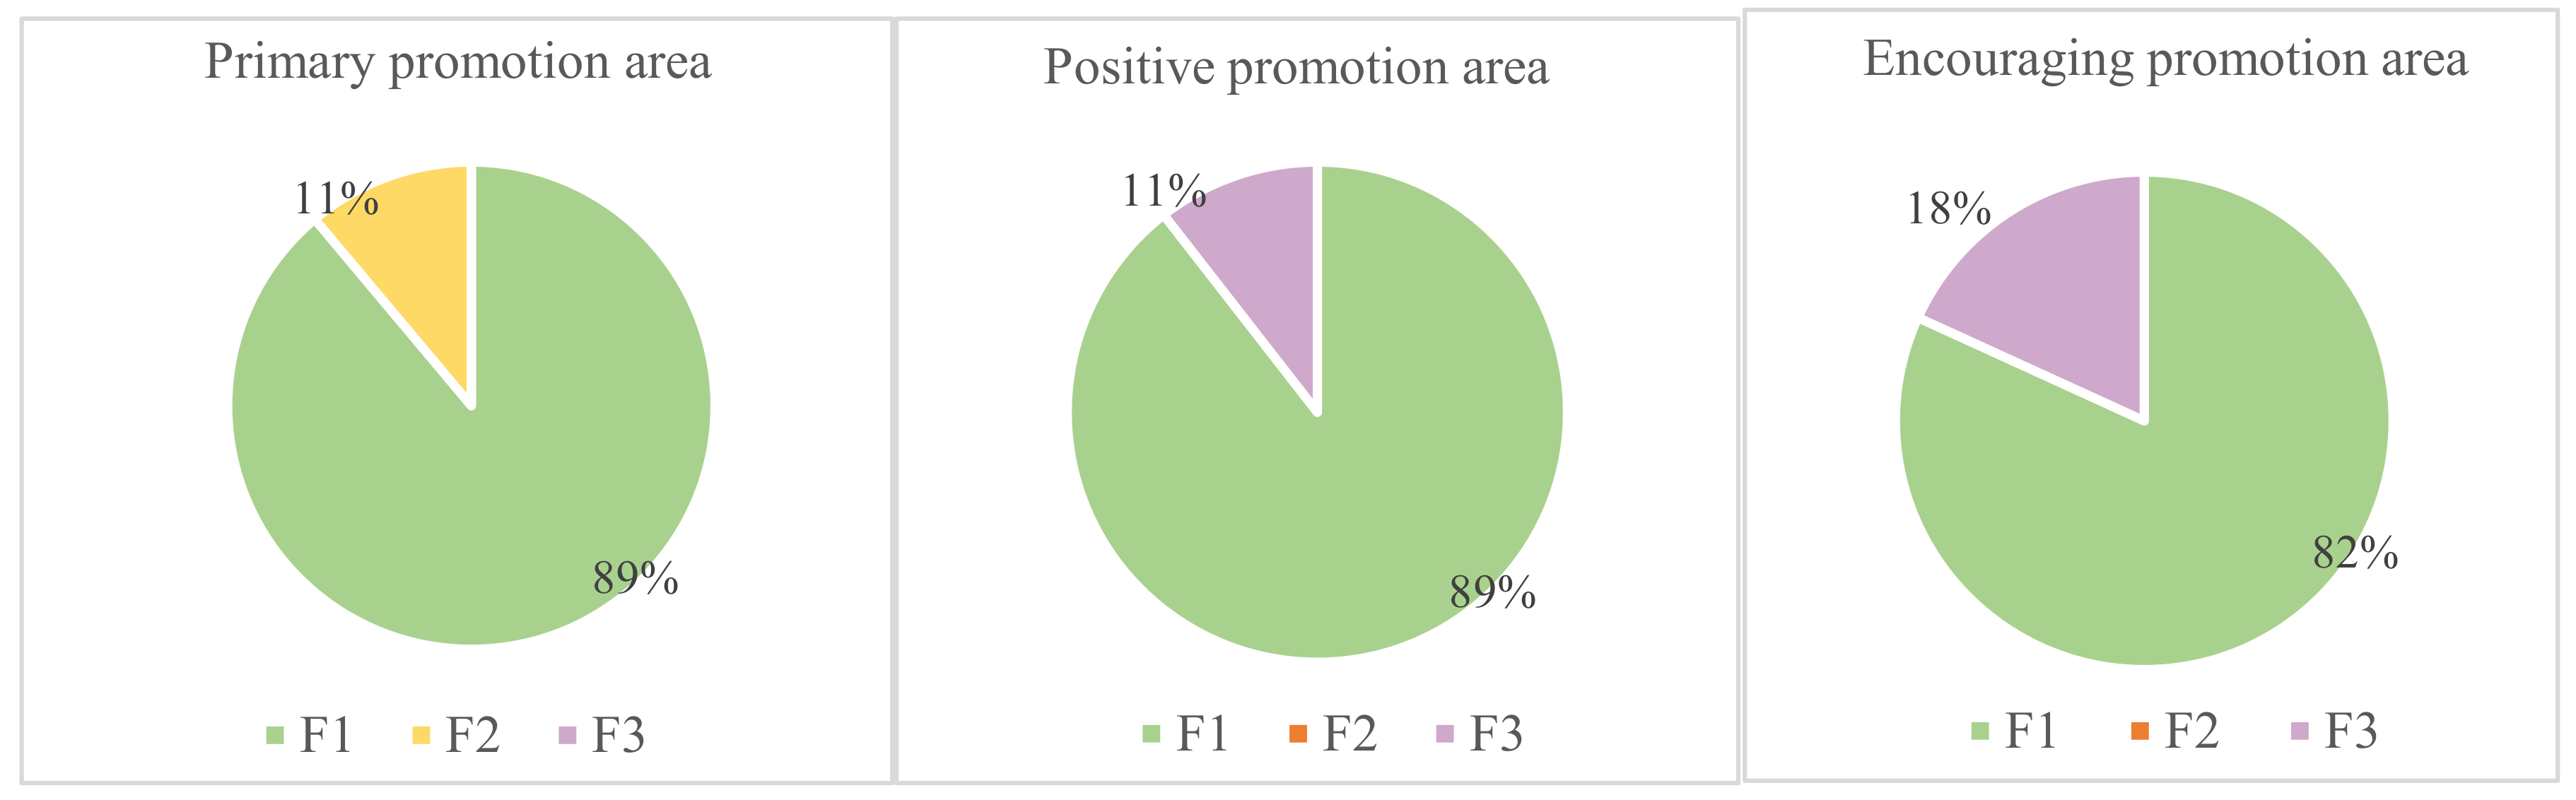
Due to the increasing housing demand and the decreasing land supply, land prices are becoming higher than ever before, impeding the adoption of prefabrication for developers, to a certain extent [43]. Accordingly, governments have taken land into policy consideration in attracting developers to the adoption of prefabrication. Land policies include “Priority land supply” (F1), “Land-transferring fees free” (F2), and “Pay land-transferring fees by stages” (F3) (see Table 4). Figure 8 visually shows the proportion of each policy used in the different promotion areas. The widespread implementation of F1 in the three promotion areas proves its effectiveness for developing prefabrication. In comparison with F1, F2 and F3 were less widely adopted in these promotion areas.
Due to the residential land supply shrinking sharply every year, each time the government auctions land, there are many developers scrambling to purchase it [44]. Thus, priority land supply has been identified as a significant incentive that has been adopted in many cities. According to research conducted by Jianan et al. [45], the influence of “City construction level” on urban land price cannot be ignored; with the increasing level of city construction, the land-transferring fee is getting higher than before, especially in the primary promotion area. The policies of F2 and F3 were promulgated to address these problems; take, for example, the detailed regulations issued by the government of Inner Mongolia; the time limit for paying the whole land-transferring fee by installments stipulated in the land transfer contract should not exceed one year, in principle. Despite the effectiveness of land policy having been proved in many areas, there remain several regulations that need to be implemented, including land supply according to the assembly rate of prefabricated buildings, and the setting of an appropriate rate for paying land-transferring fees by installment according to different areas.
3.2.6. Non-Economic Incentives
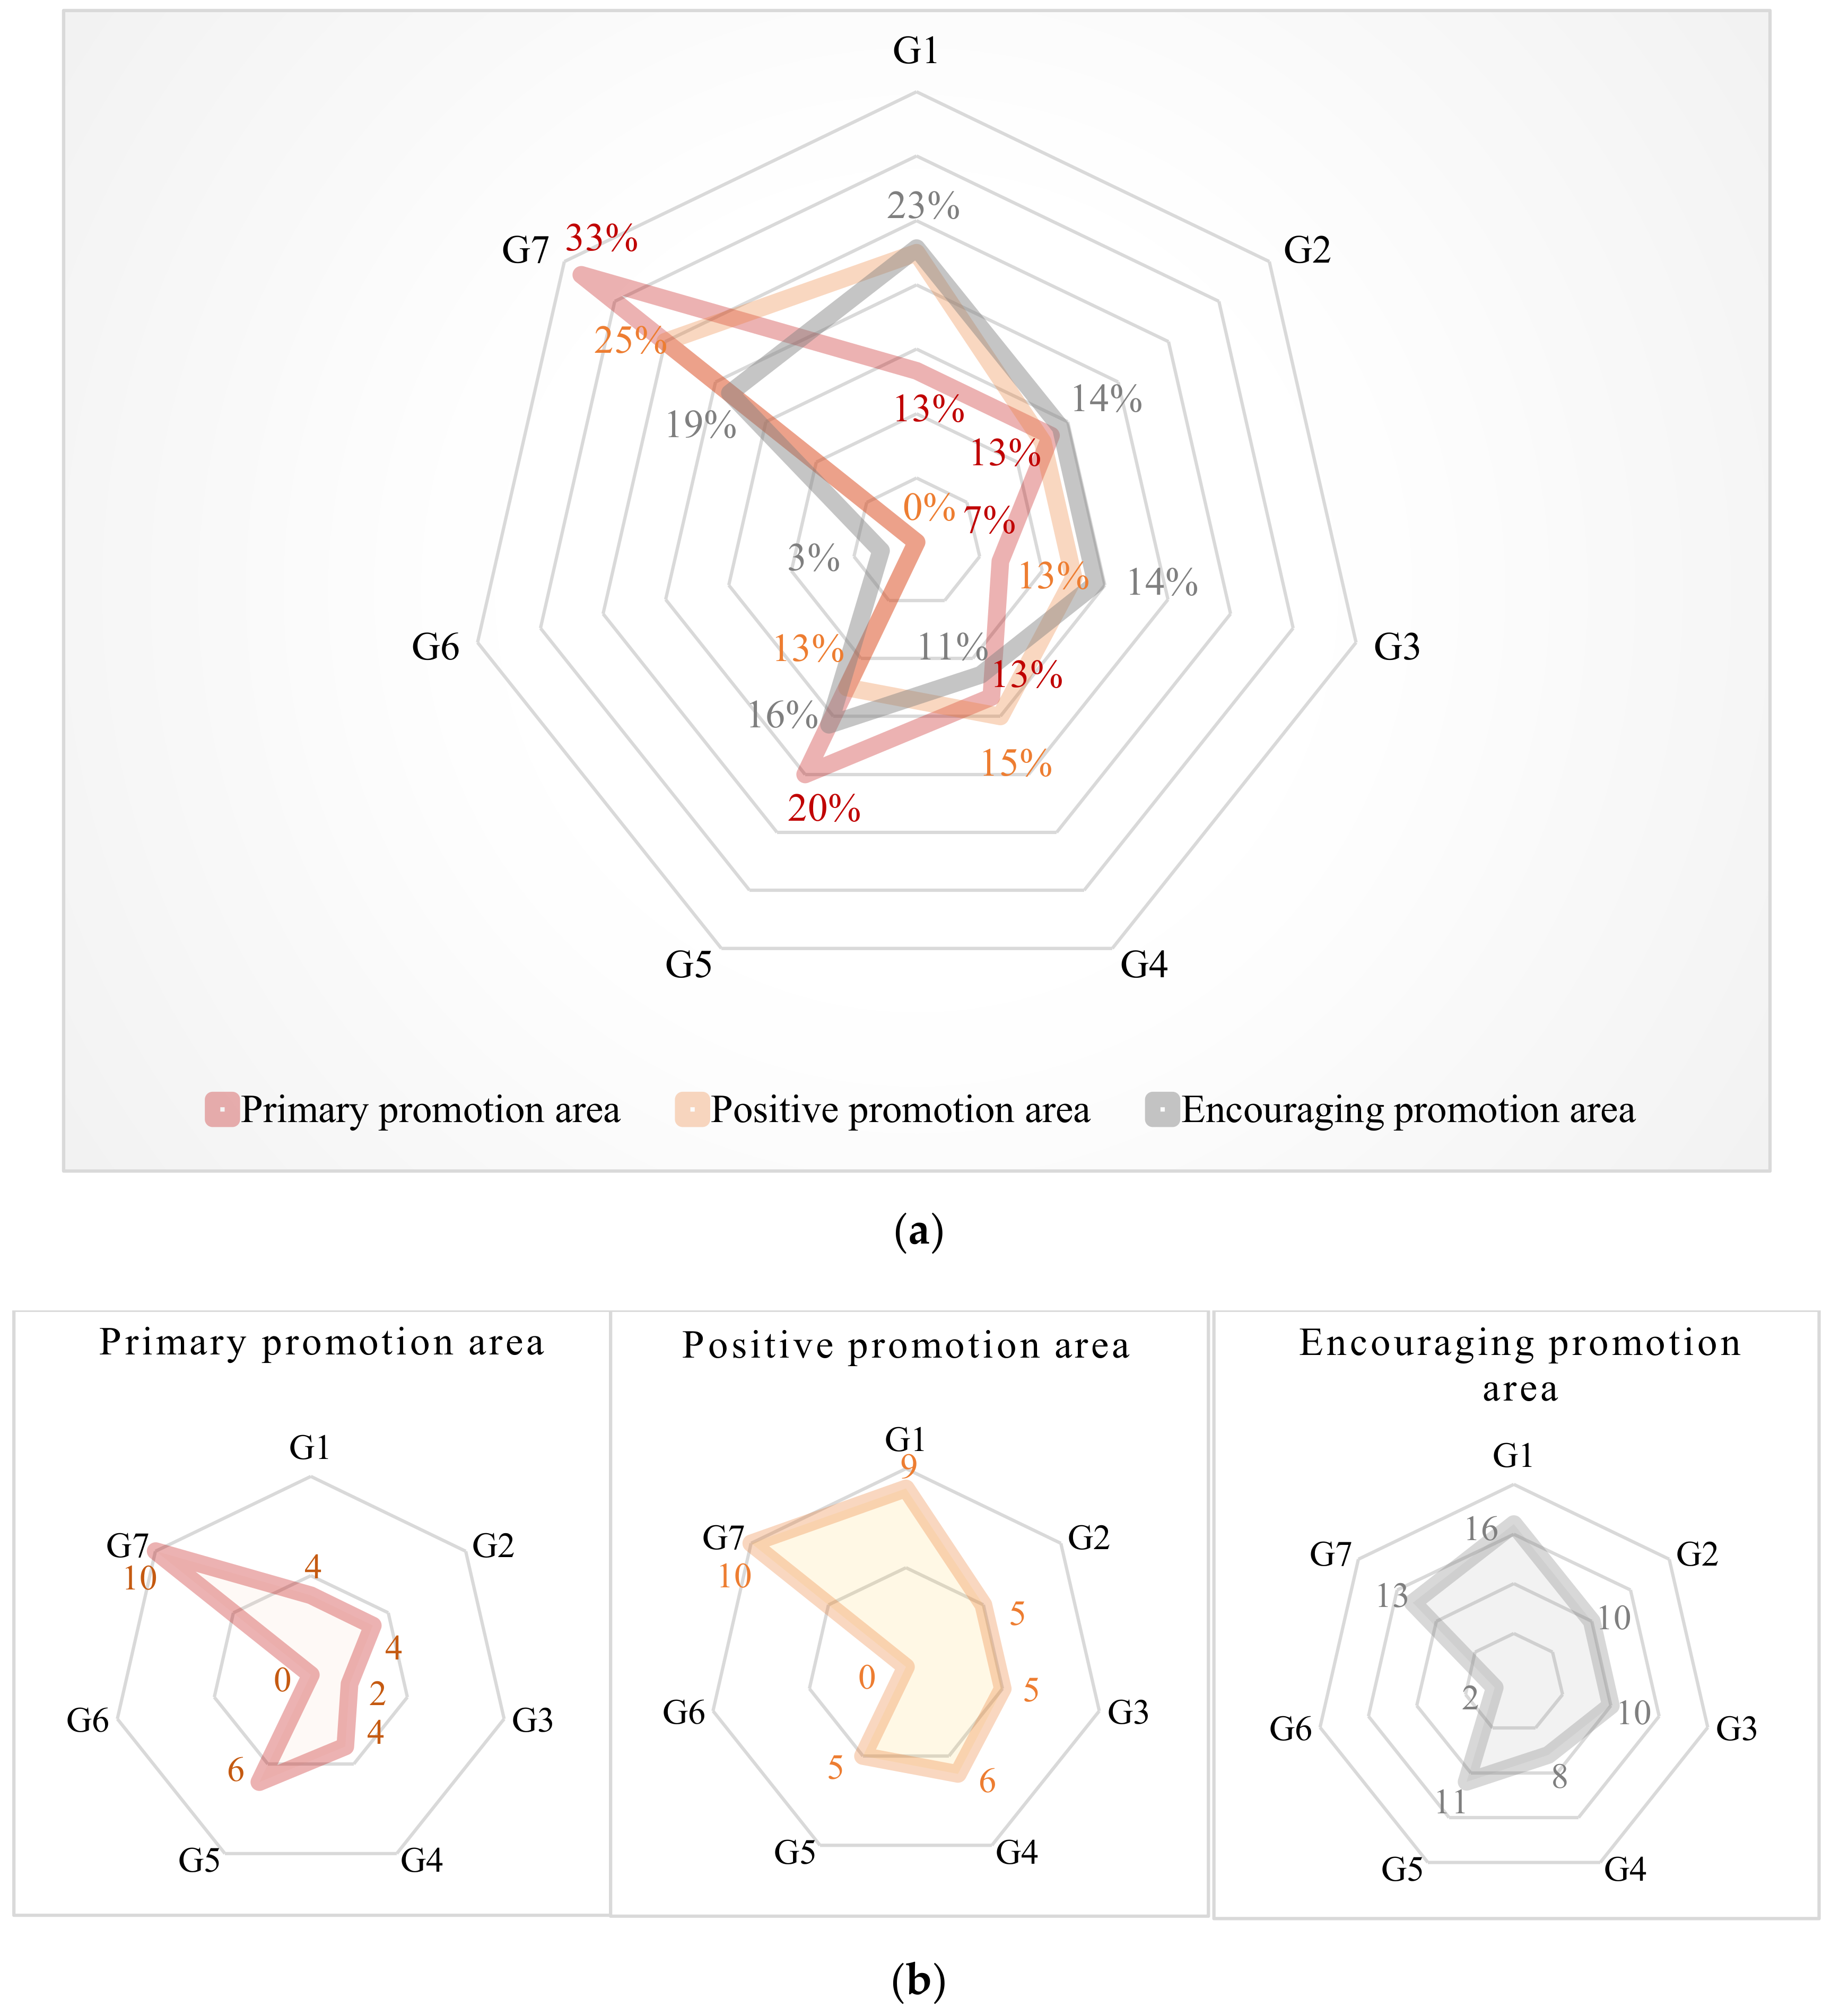
According to the data from Figure 9, non-economic incentives include “Reputation incentive” (G1) (e.g., qualification promotion, priority awards, credit scoring), “Pre-sale policy” (G2), “Optimize the approval process” (G3), “Bidding policy” (G4), “Traffic support” (G5), “Exemption from performance bond and tender bond” (G6) and “Other incentives” (G7) (e.g., technical assistance, environmental protection, professionals introduction). Figure 9 visually shows the proportion and frequency of each of these non-economic incentives in the different promotion areas. Compared with the other incentives, G6 is obviously the least widely adopted in the three promotion areas, implying that the other six incentives are applicable in most areas. However, there are numerical differences for the incentives between promotion areas. In the primary promotion area, G5 and G7 are commonly used as incentives, while G1 and G3 are rarely used.
The results demonstrate that there is a strong need for environmental protection, favorable traffic conditions, a complete technical system, and experienced personnel in the primary promotion area. Actually, with the proposed initiative of “Sustainable development”, the enterprises not only focus on economic subsidies, but also focus on their corporate social responsibility (CSR) [46,47]. In the primary promotion area, in particular, they are willing to adopt prefabrication if there are incentives related to environment. From the perspective of the traffic environment, due to the fact that precast components are heavy and bulky, favorable traffic conditions have become a critical driving force in the development of prefabrication [9]. However, traffic congestion in big cities [48] such as Beijing has limited the development of prefabrication. In fact, a large proportion of enterprises inadequately use technologies (e.g., BIM, RFID) due to a lack of the relevant personnel. Thus, there is an urgent need for techniques and experienced personnel, especially in the primary promotion area. Take Shenzhen in the primary promotion area, for example; the government stated that the proportion of prefabricated building floor area in newly built building floor area is expected more than 30%. To meet this goal, in addition to the support of economic incentives, the support of non-economic incentives is also highly necessary.
3.3. Policy Effectiveness Assessment
In fact, the government plays a leading role at the beginning for introducing prefabrication, but the ultimate decision regarding the adoption of prefabrication depends on the market. Although the Chinese government has promulgated massive incentives to motivate stakeholders to adopt prefabrication, it remains to be further explored whether they are willing to adhere to prefabrication in the face of obstacles occurring in the supply chain of prefabricated components. Therefore, many Chinese researchers conducted a series of studies, many of which involve the classification of policy tools, identification of incentive categories, and quantitative analysis of policy text. There are massive studies related to policy identification, while studies evaluating the effectiveness of the policies are lacking. Thus, this section aims to quantitatively analyze the effectiveness of policies formulated for promoting prefabrication.
For most of the existing policies regarding prefabrication, the main aim is to meet a given proportion of prefabricated building area in new building area. According to P8, issued by the Ministry of Housing and Urban-Rural Development in March 2017, by 2020, prefabricated building area should account for more than 15% of new building area nationwide, including more than 20% in the primary promotion area, more than 15% in the positive promotion area, and more than 10% in the encouraging promotion area. The implementation of the policy will have a great impact on prefabricated floor area, prefabricated building market size, and the numbers of production enterprises and industrial parks; therefore, they can be considered as indicators for measuring the effectiveness of policy implementation.
3.3.1. Number of Prefabricated Components Production Enterprises and Industrial Parks
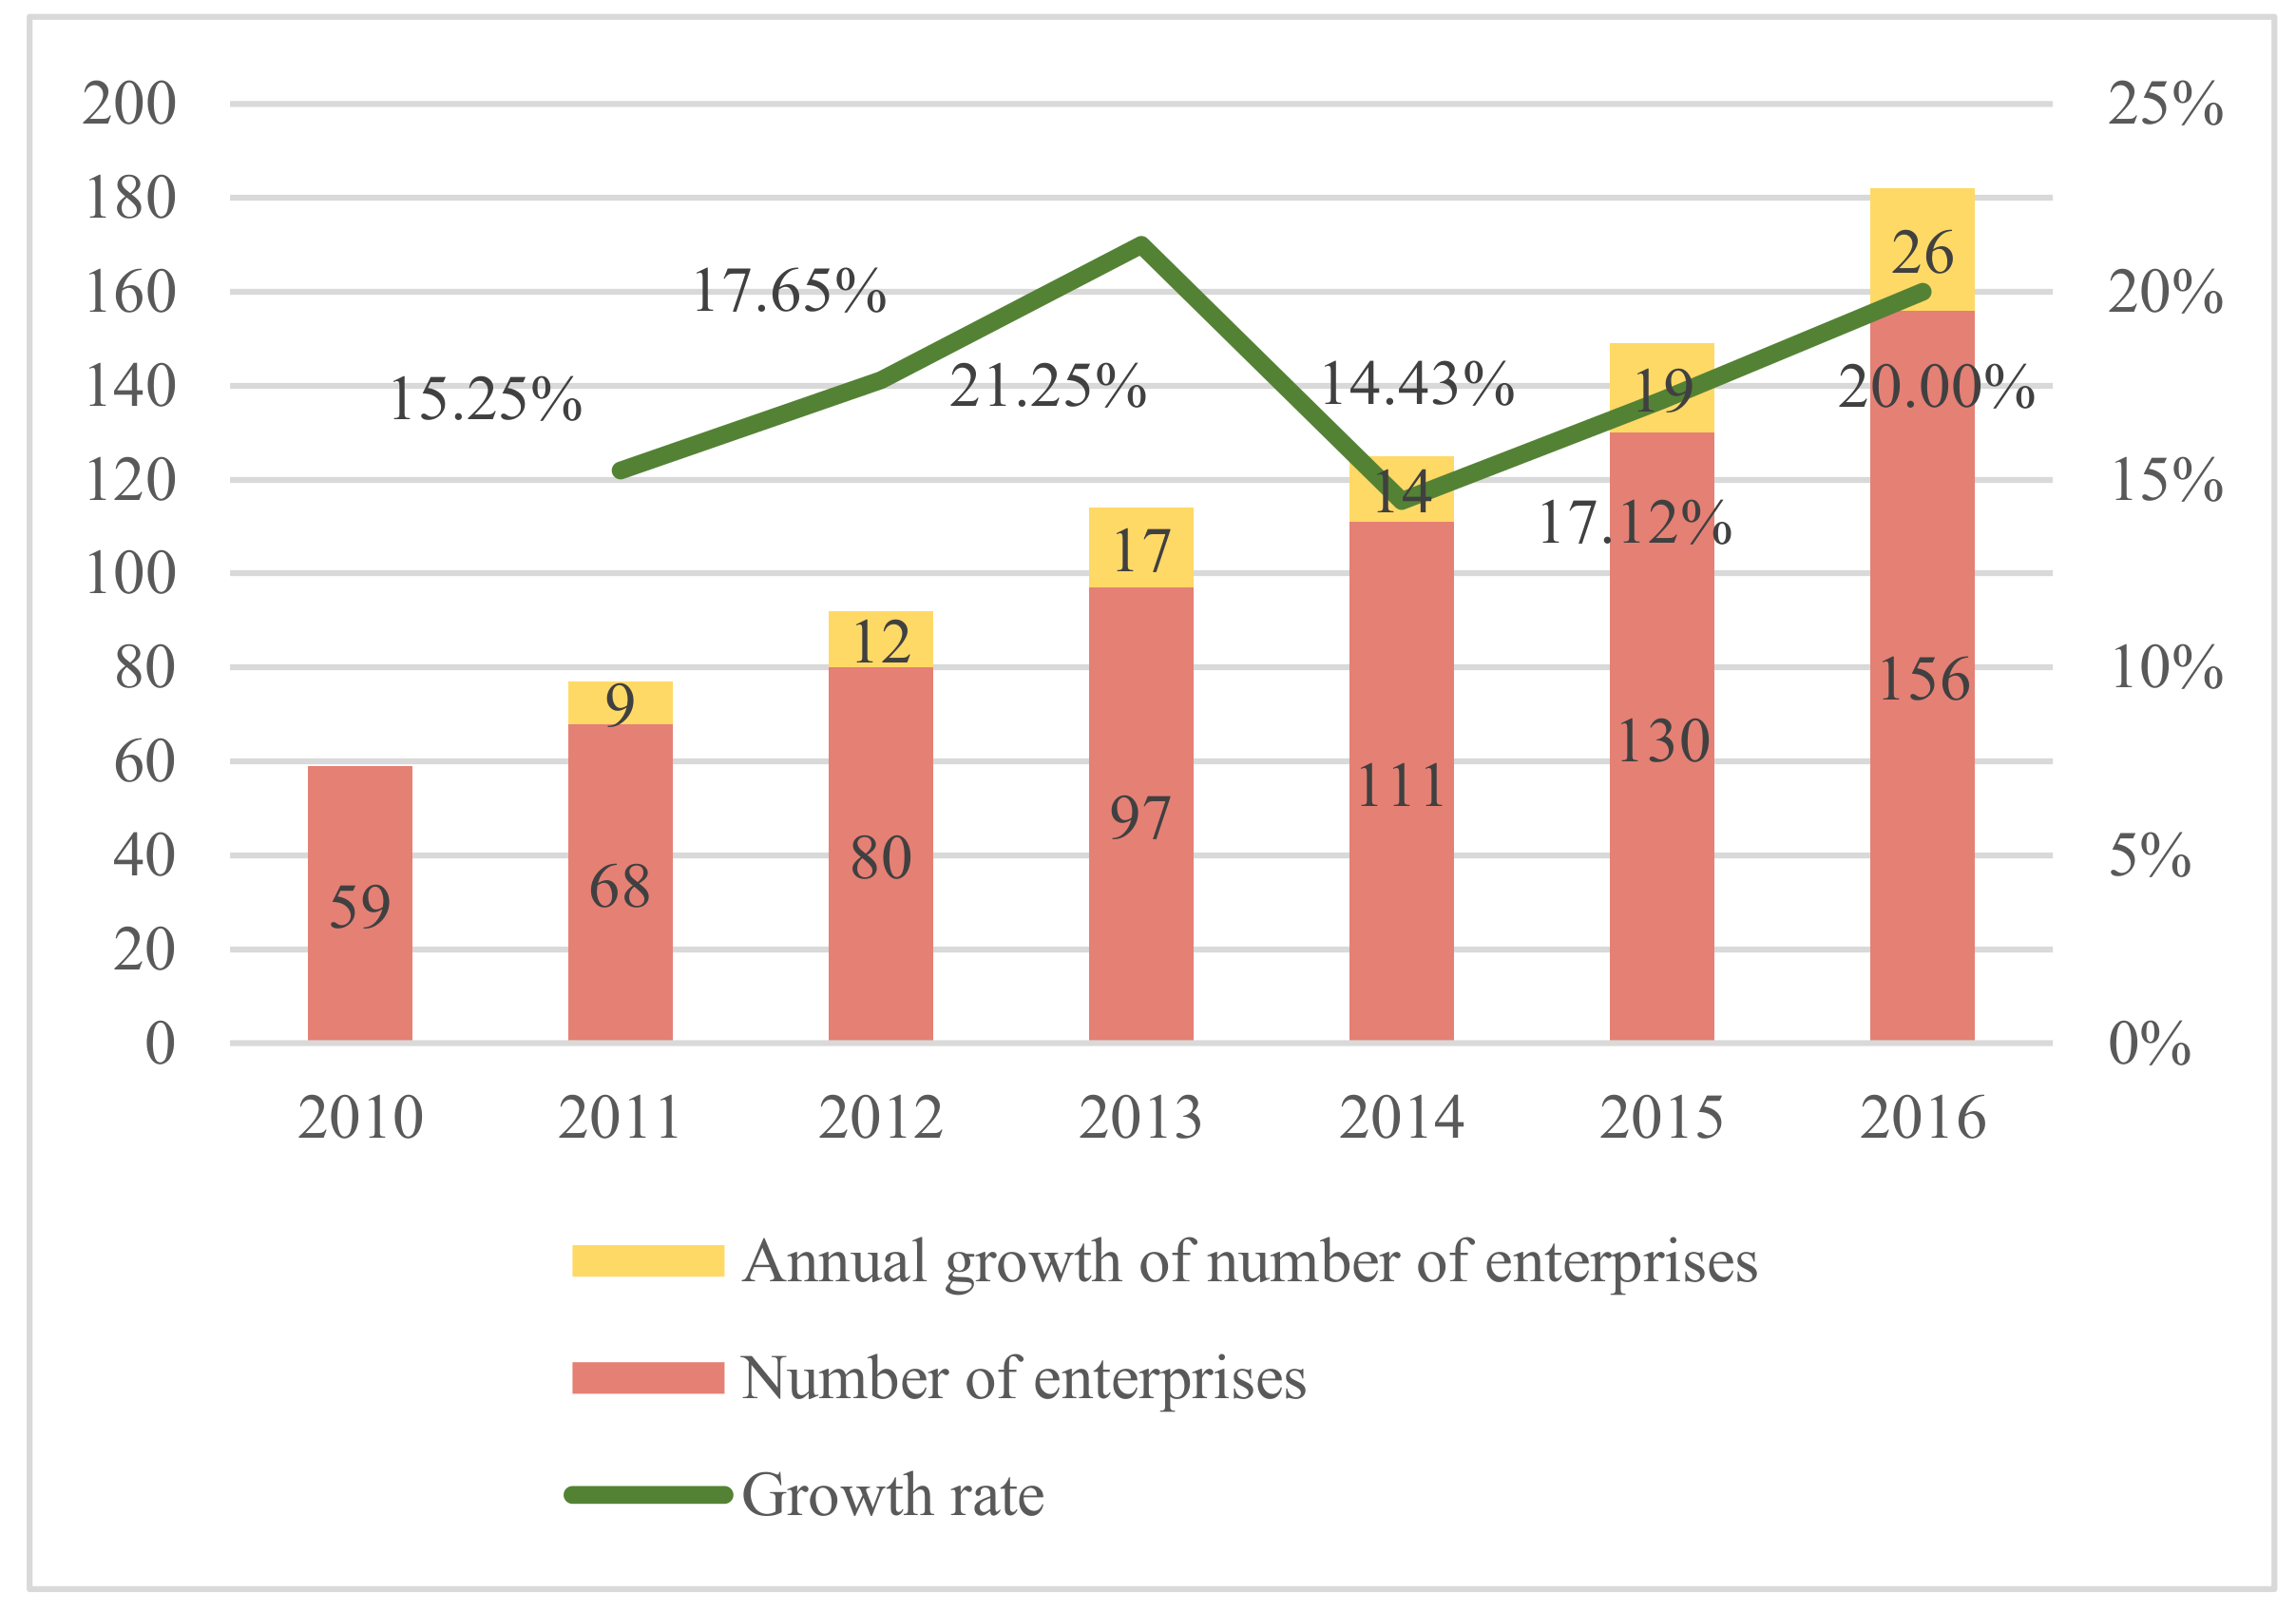
Figure 10 illustrates the annual number of production enterprises in 2010–2016; detailed data is shown in Table 5. Compared with conventional construction, which focuses on the cast in situ process, prefabricated construction pays more attention to the production and assembly stages. In the assembly stage, the main work is completed by special machinery and equipment, with little impact on the whole construction process. However, producing prefabricated components requires unique materials [49], advanced technologies and devices [50], and automatic production lines [51], leading to a high initial cost that would hinder the development of prefabricated production enterprises.
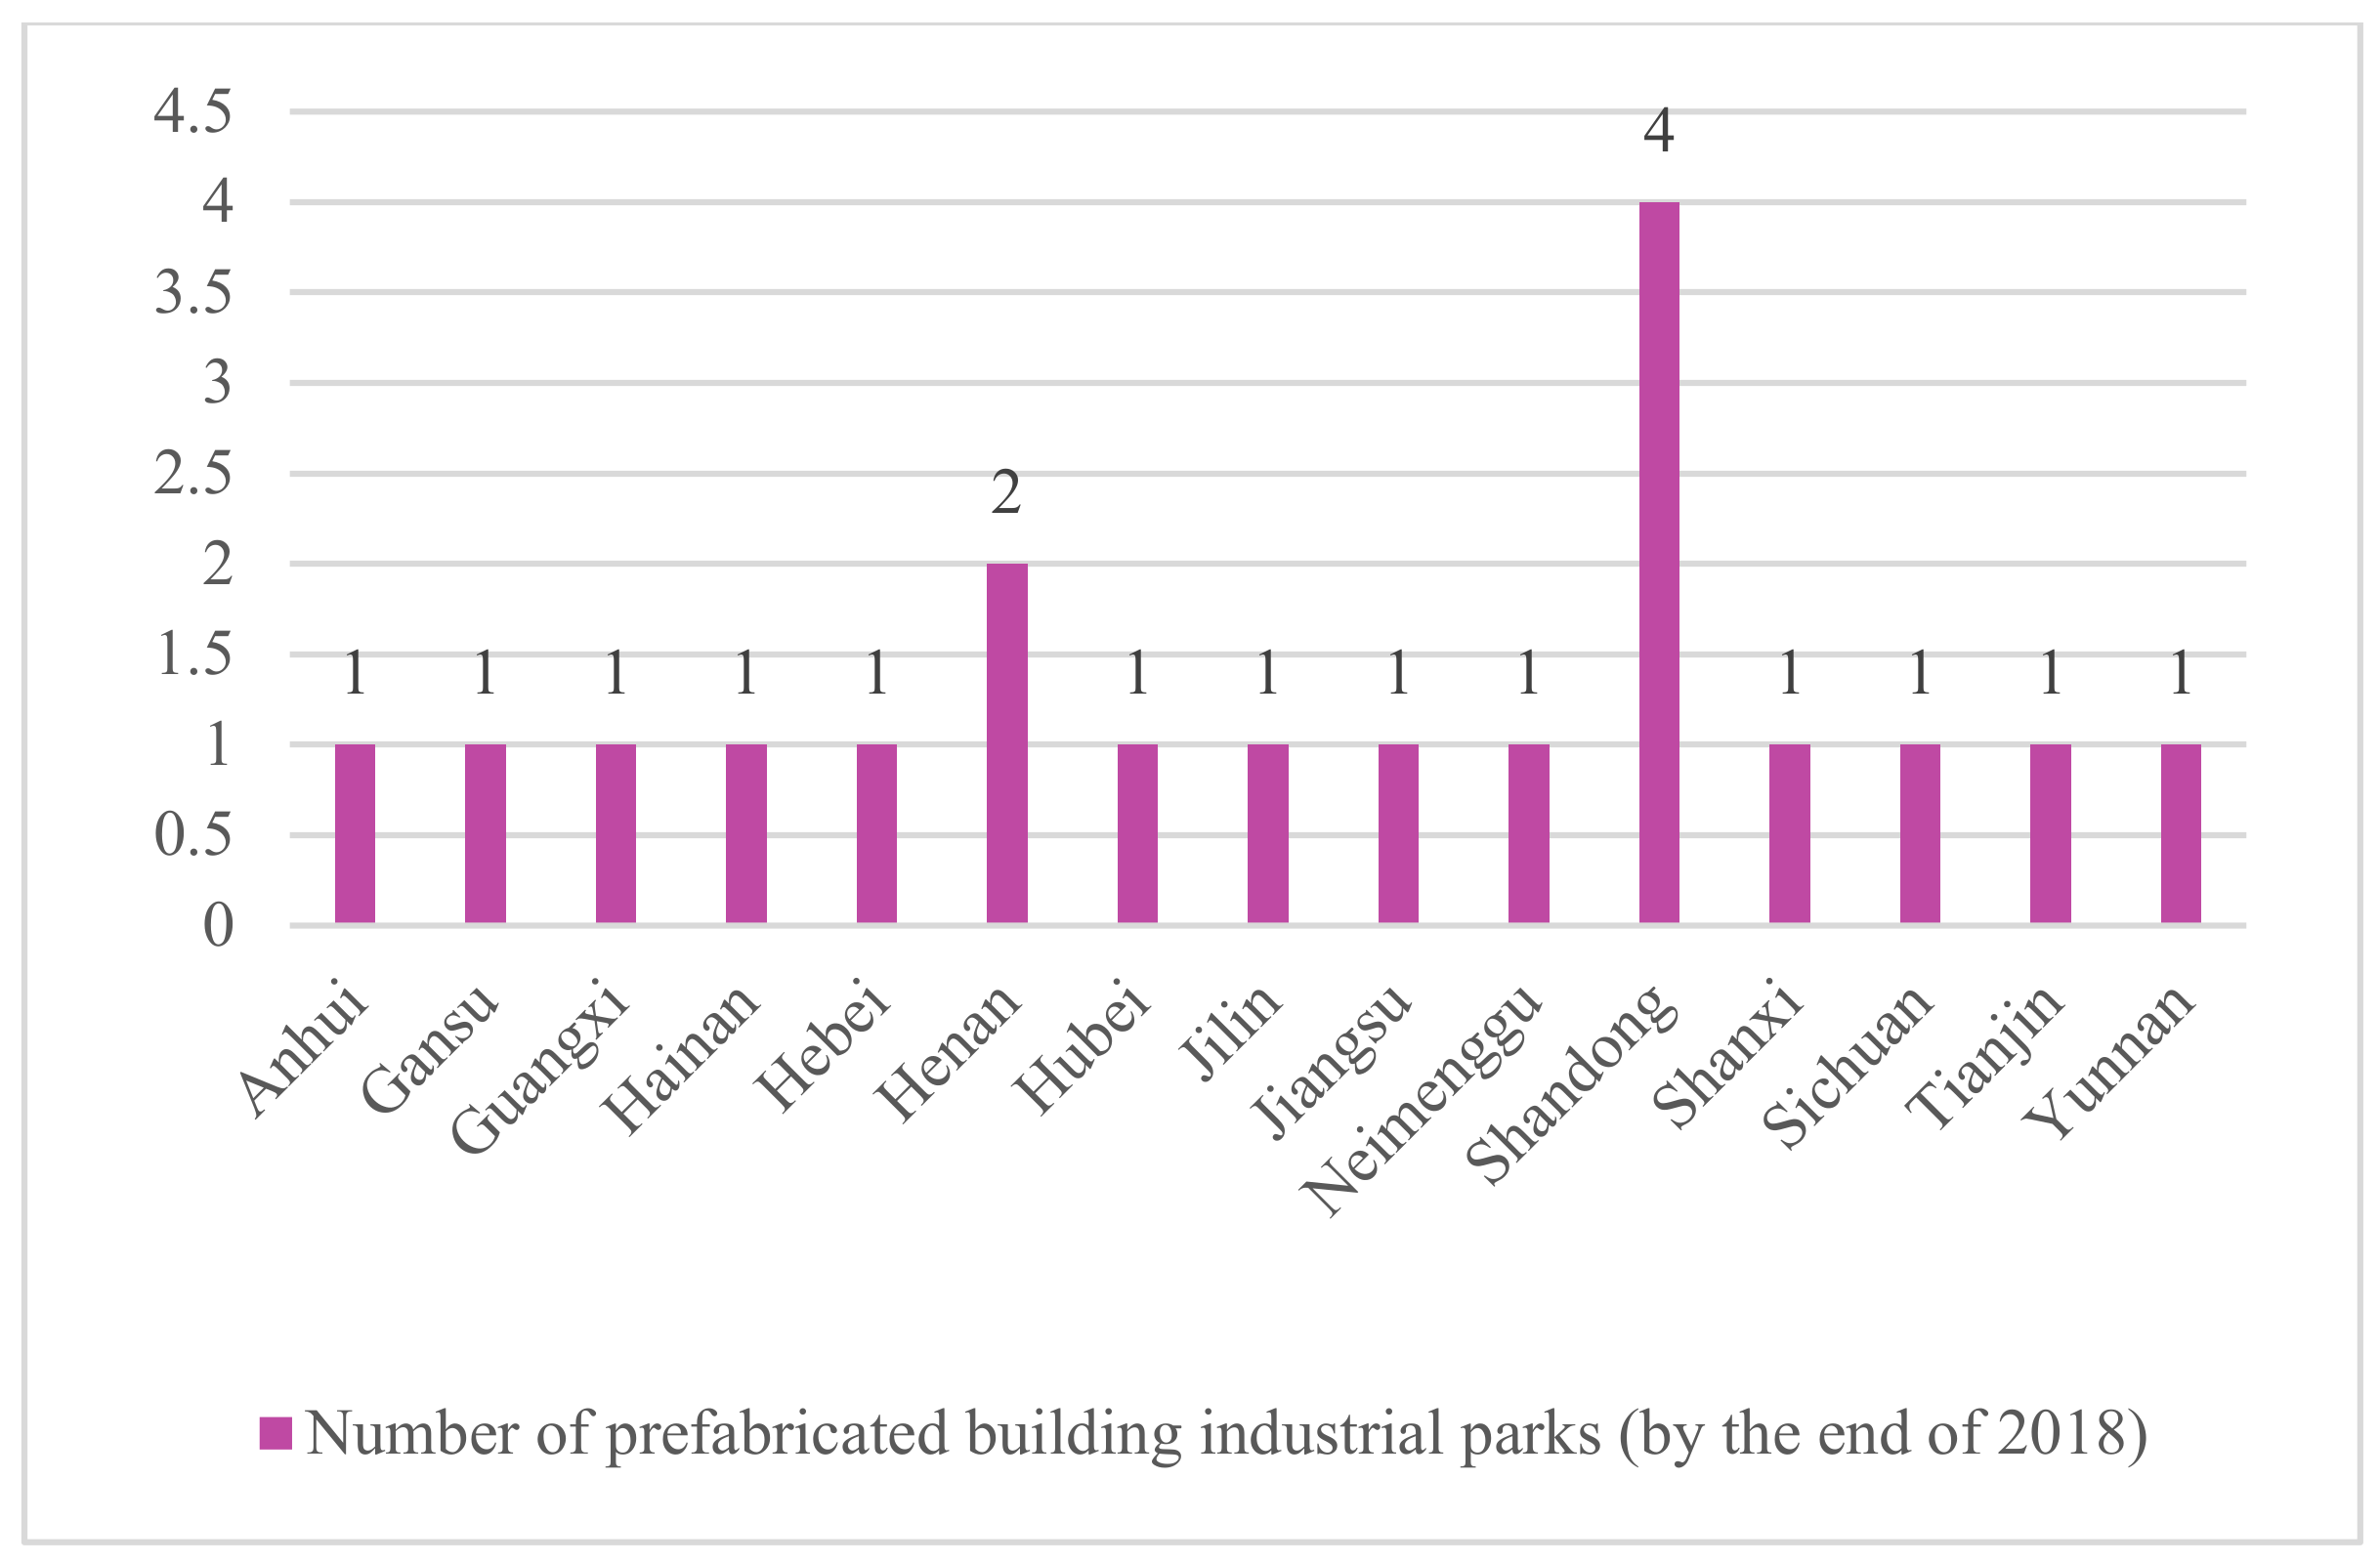
Thus, the governments in different areas formulated a series of incentives for motivating manufacturers, such as tax privilege and reputation incentives. It is obvious that the number of production enterprises increased from 2010 to 2016. However, there are two turning points in the growth rate: one is in 2014, and the other is in 2015. In 2014, although the total number of production enterprises showed an upward trend, the growth rate suddenly slowed down. In addition, by 2015, with the specific development scheme issued by the government, the growth rate had picked up and maintained the trend of growth. By the end of 2016, the number of production enterprises had reached 156, with an increase of 20% over 2015. Furthermore, with the local incentives gradually being implemented, the total number of prefabricated building industrial parks was up to 19 by the end of 2018 (see Figure 11), Shandong possesses the greatest number of industrial parks, followed by Henan. Generally, the increasing number of production enterprises and industrial parks demonstrates the effectiveness of policies for promoting prefabrication.
3.3.2. Prefabricated Floor Area
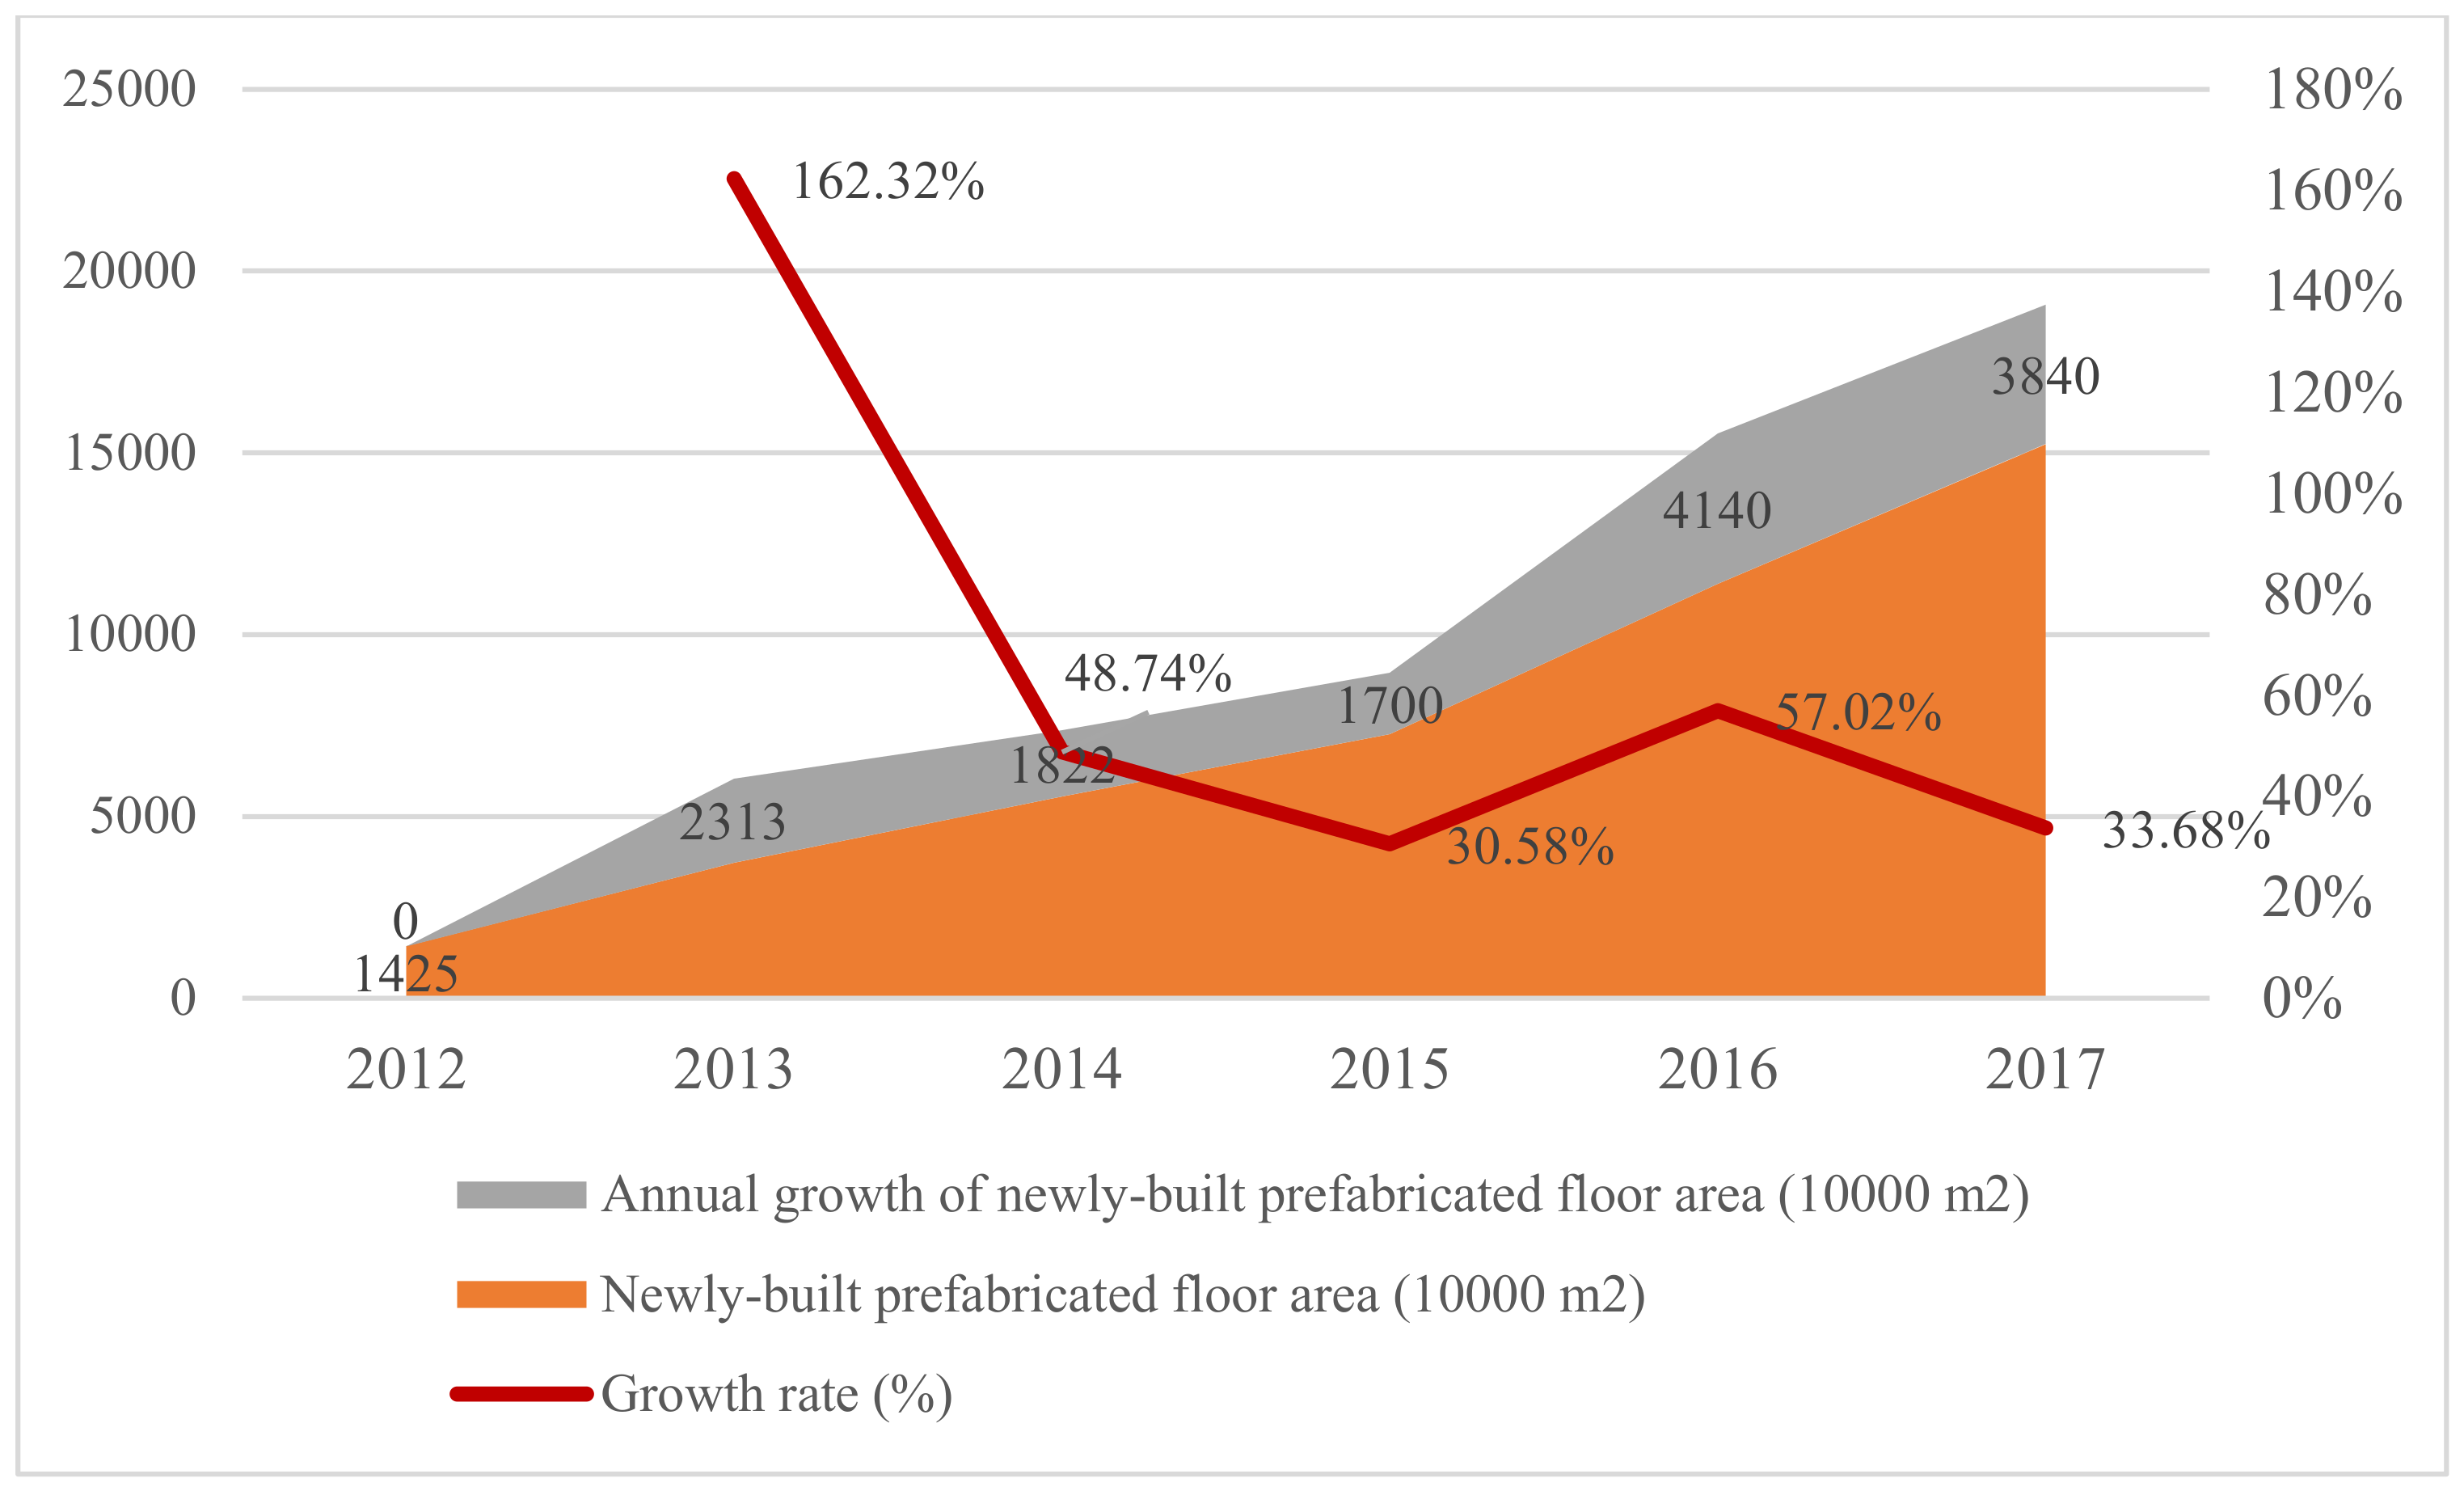
The impact of policies on prefabrication are directly reflected in the prefabricated floor area. Figure 12 reveals the annual newly built prefabricated floor area in 2012–2017; detailed data is shown in Table 6. It can be found that the prefabricated floor area increased from 2012 to 2017, but the growth rate was exhibiting a downward trend by the end of 2015. Especially in 2014, the growth rate presents a significant decreasing trend. Subsequently, the highest growth rate occurs in 2016.
There are reasons for the trend in growth rate. In 2013, the government adhered to the real estate policies of restriction order and limited loans to regulate housing prices. However, these policies led to a sustained increase in housing prices in first-tier and second-tier cities, while the market in third-tier and fourth-tier cities has been sluggish. Over the next year, the whole newly built floor area in mainland China decreased sharply, negatively affecting newly built prefabricated floor area. In addition, in 2014, in order to stimulate consumption in the real estate market, the central government introduced a series of policies, including loosening restrictions, and reducing payment ratios and interest rates on second- and third-tier cities. Subsequently, the real estate market began warming up. Thus, the declining growth rate eased slightly in 2015. Meanwhile, the Chinese government enacted policy (P4) for developing prefabrication in 2015. This was the first time development planning had been carried out, namely, that prefabricated building area would account for more than 20% of new building area by 2020, and more than 50% by 2025. Driven by the policy, the growth rate of newly built prefabricated floor area peaked in 2016. Since then, affected by the base expansion of newly built building area, the growth rate has slowed down. On the whole, the implementation of policy, such as floor area rewards and priority land support, does contribute to the adoption of prefabrication.
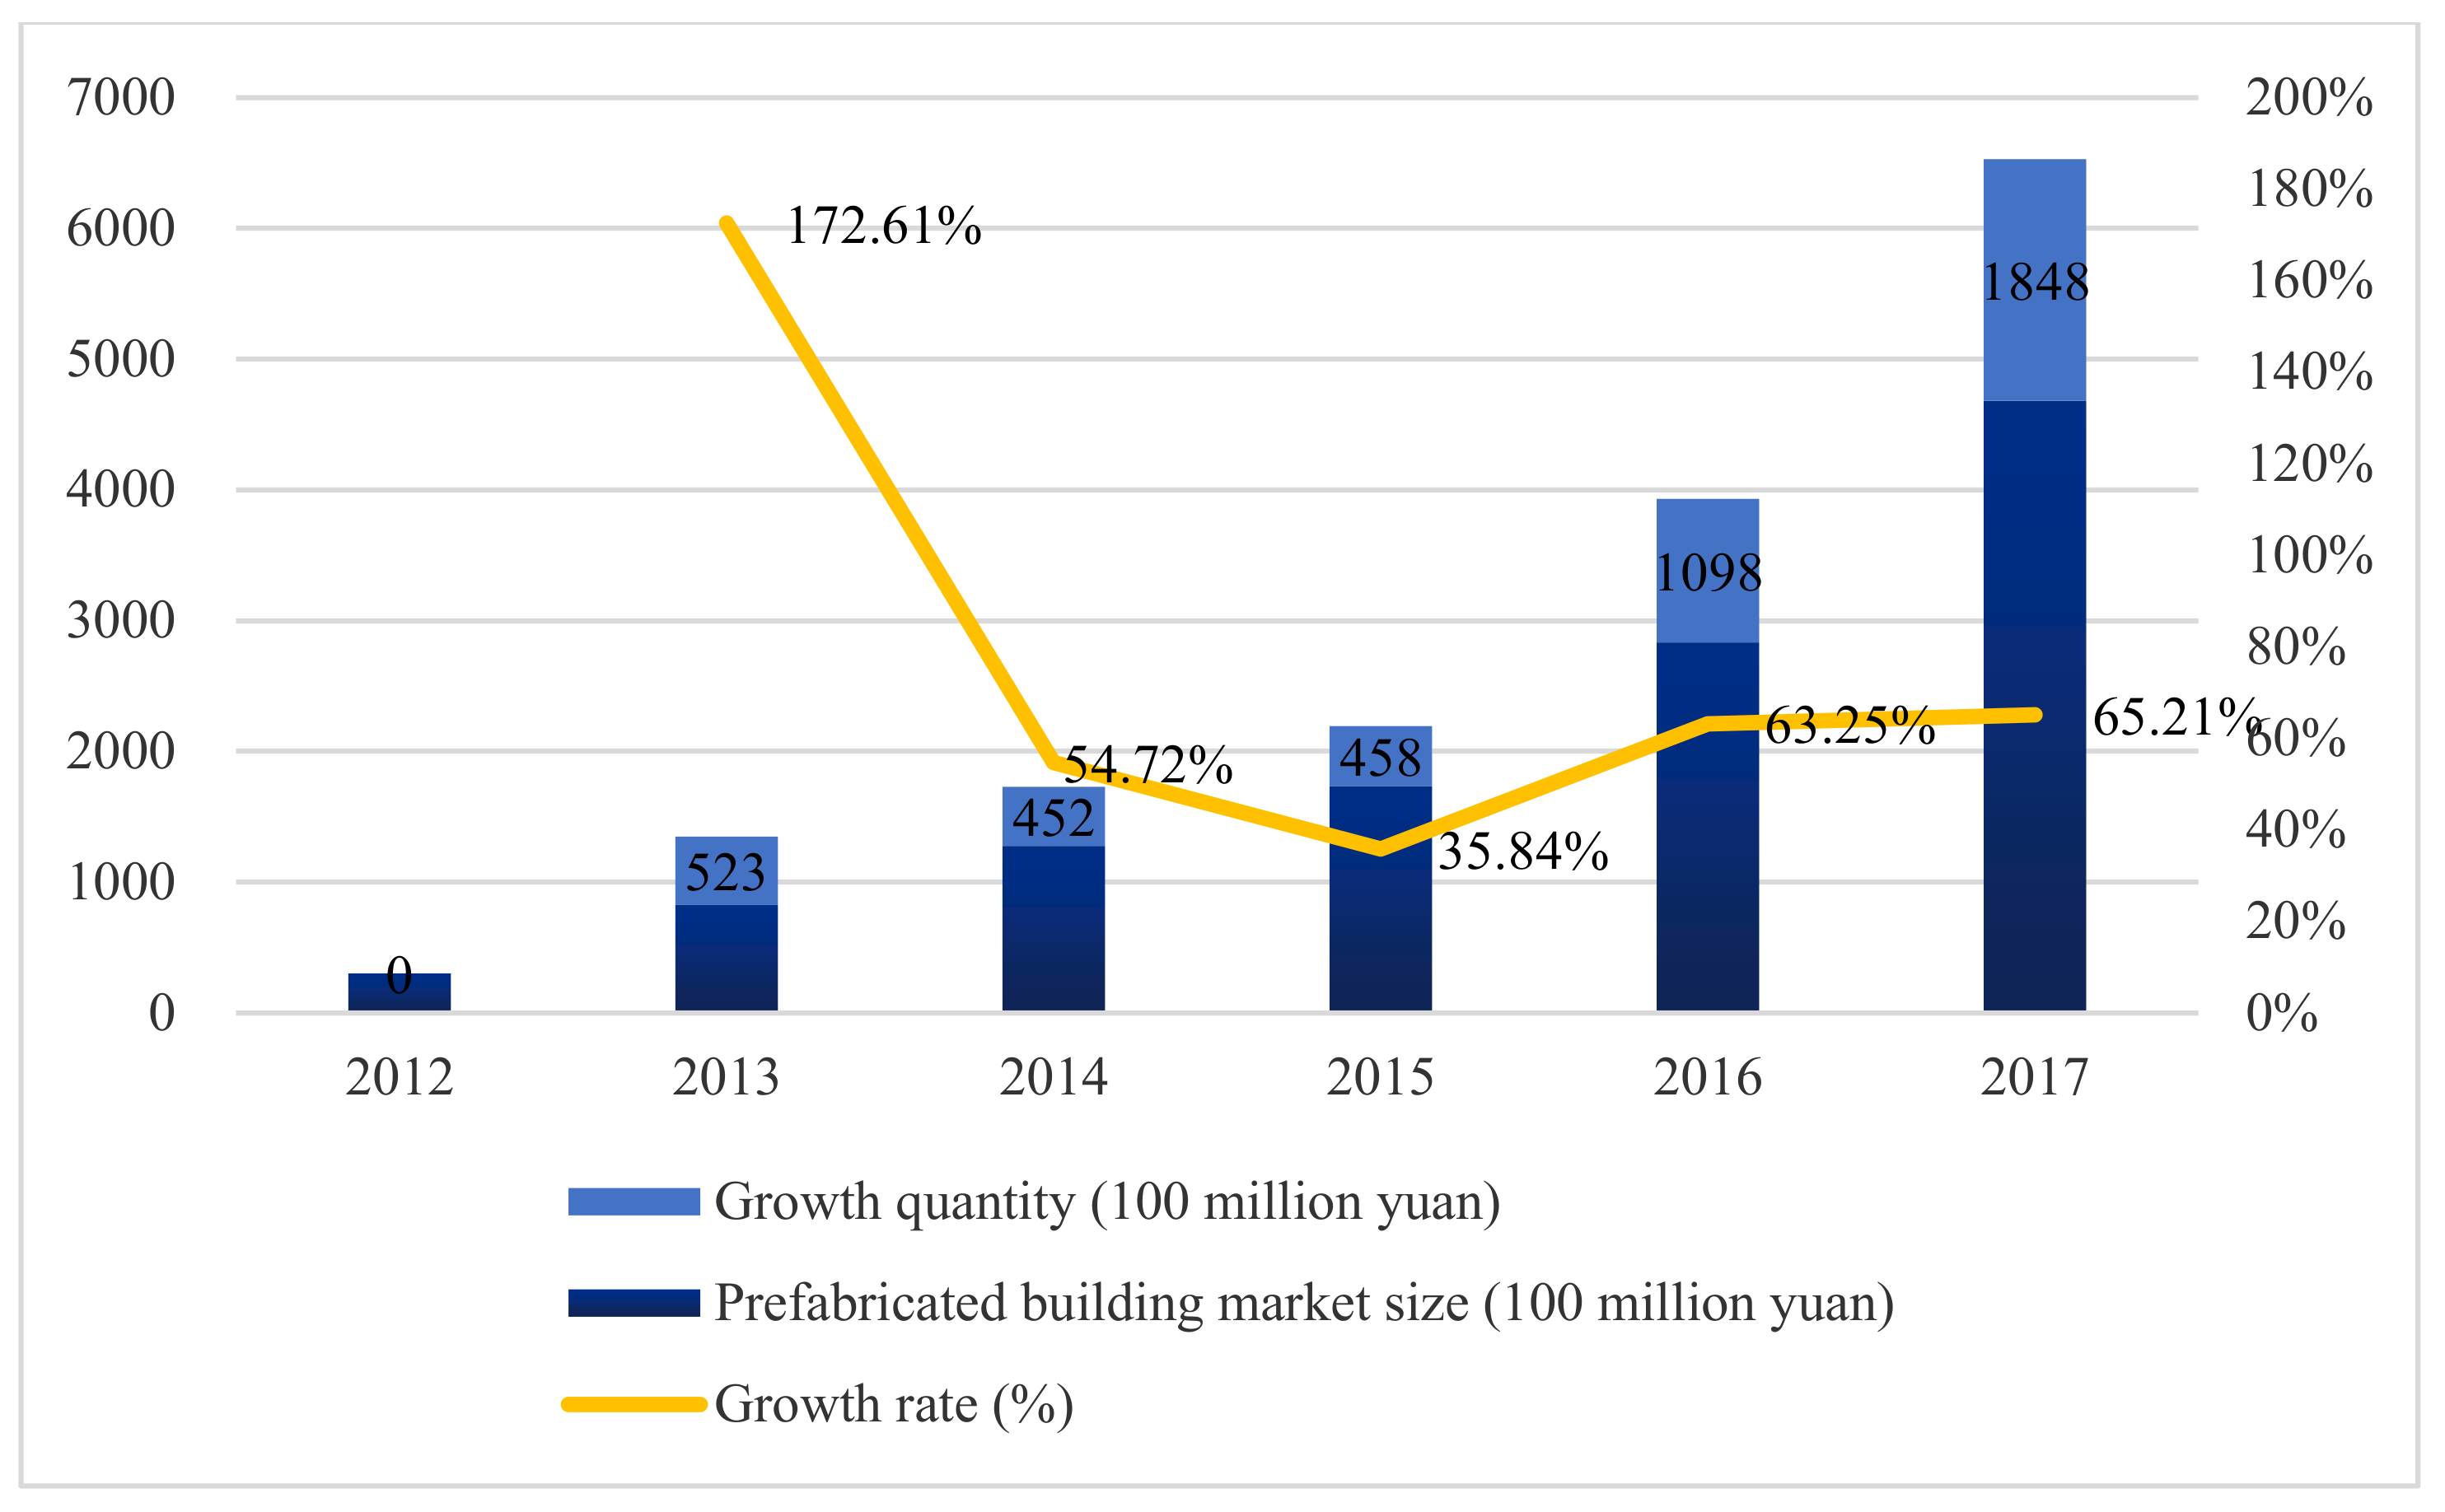
3.3.3. Prefabricated Building Market Size
Similar to prefabricated floor area, the scale of prefabricated building market size can also be considered an indicator for directly measuring the impact of policy implementation. Figure 13 presents the annual prefabricated building market size in China during 2012–2017; detailed data is shown in Table 7. It can be found that the change of growth rate of prefabricated building market size is consistent with newly built prefabricated floor area. After putting forward the preliminary plan in March 2015, in February 2016, the Chinese government promulgated subsequent goals in P5, namely, prefabricated building area should account for 30% of new building area within 10 years. Subsequently, the government divided all cities into three promotion areas for developing prefabrication according to local conditions (P6), and further set definite targets in different promotion areas (P8). According to research conducted by Han, Skibniewski and Wang [38], the profit levels of enterprises in the prefabricated construction supply chain are proportional to the prefabricated construction market size. In order to achieve the targets mentioned in P8, the governments in different promotion areas have formulated various incentives, including mandatory policies and incentives. The continuous expansion of prefabricated building demonstrates the effectiveness of existing prefabricated policies as a whole.
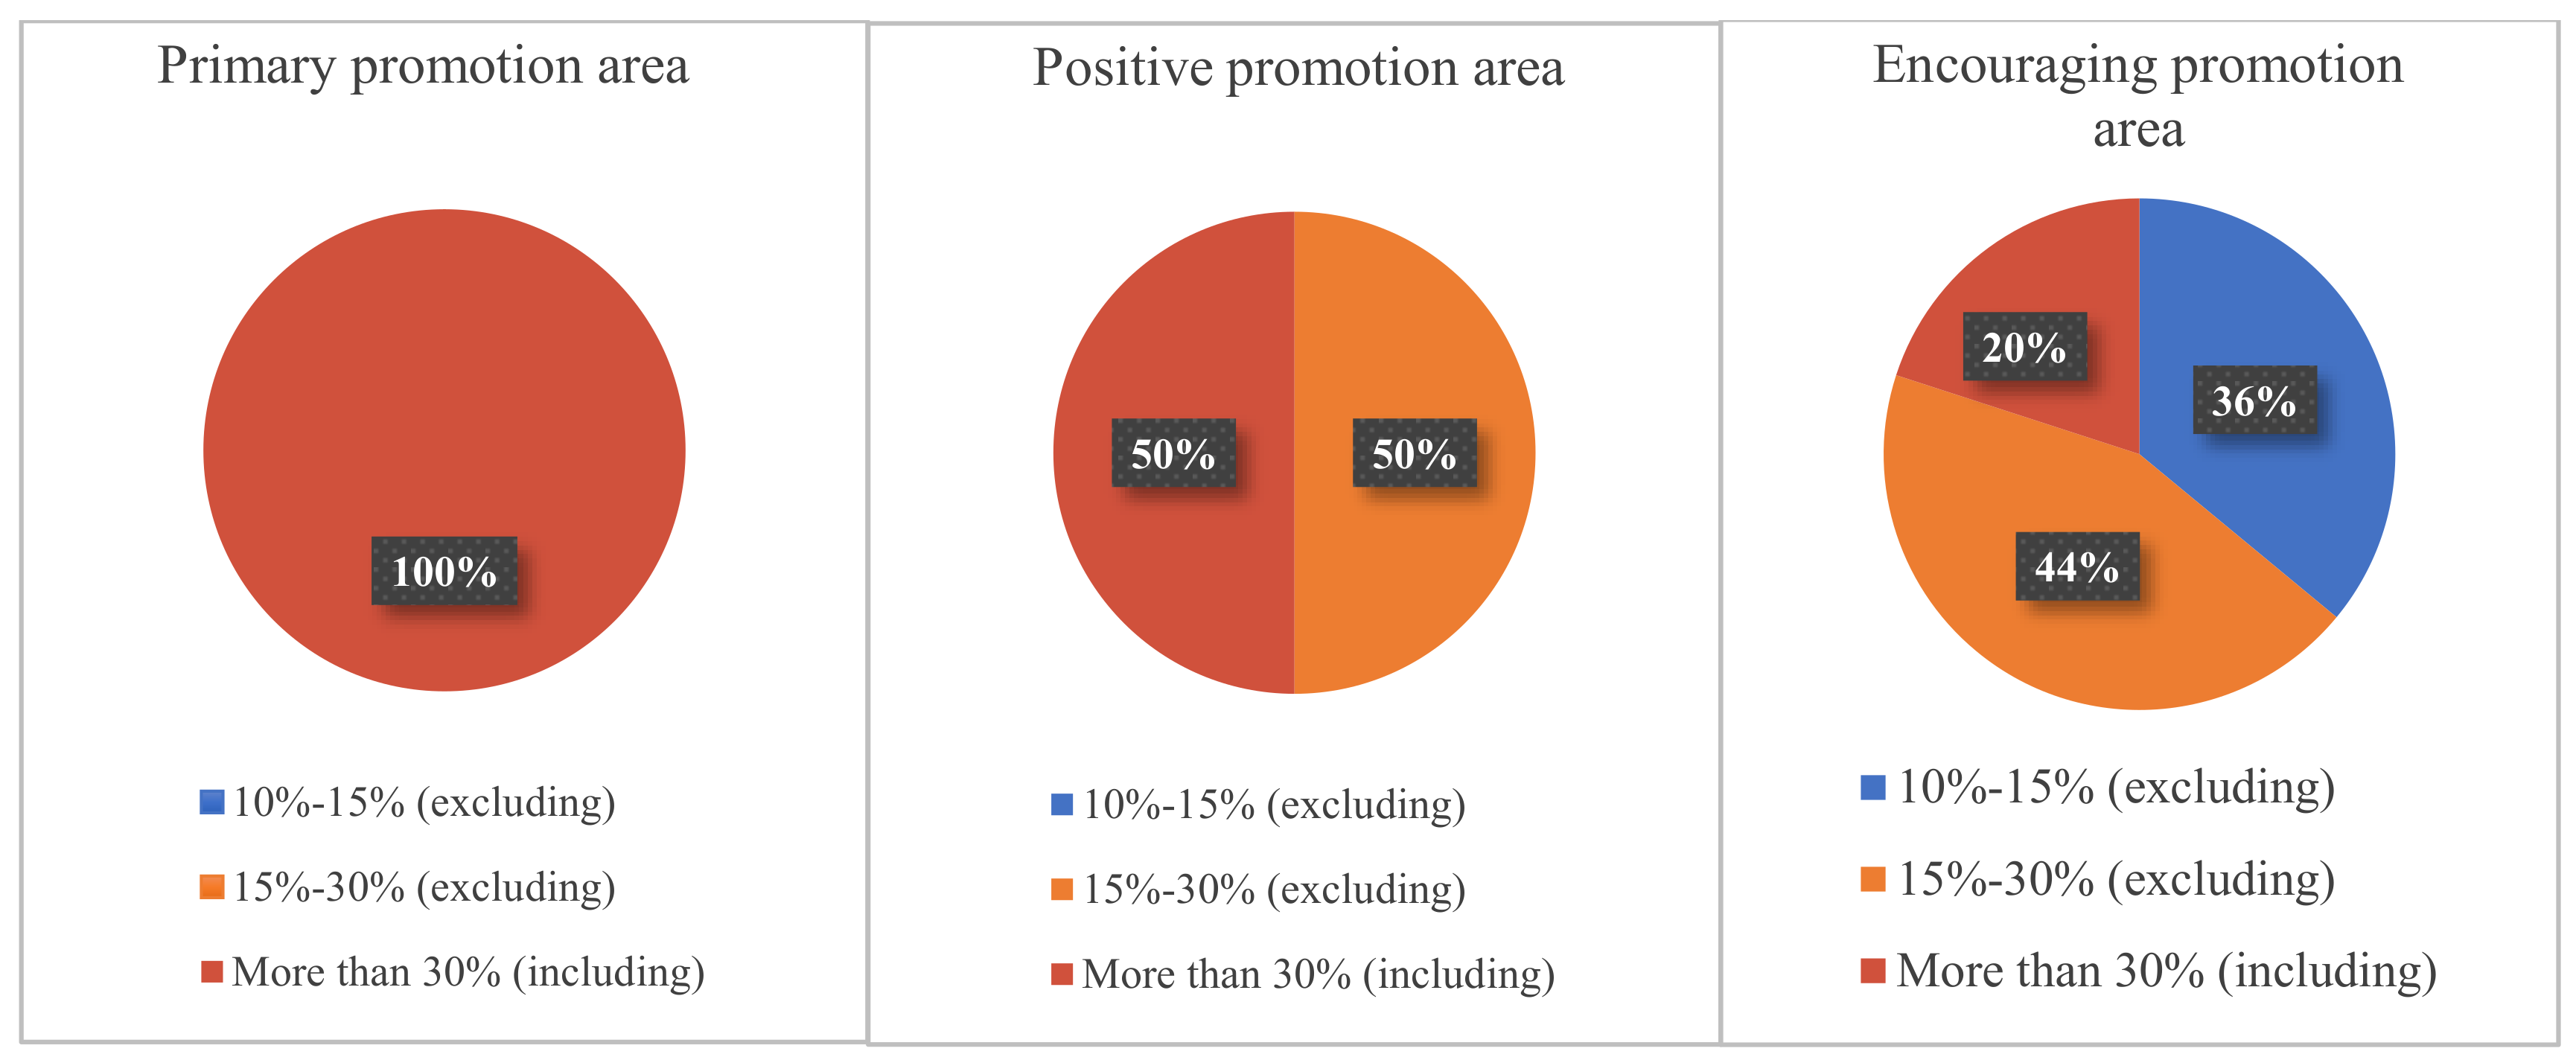
3.3.4. Expected Prefabricated Building Area Ratio in 2020
Prefabricated building area ratio refers, in this paper, to the proportion of prefabricated building area in a new building area. Figure 14 visually shows the proportions of expected prefabricated building area ratio in different promotion areas, and the specific frequencies are listed in Table 8. An overview of the expected ratios determined by the governments in different cities can be divided into three ranges: the first range is 10%–15% (exclusive); the second rage is 15%–30% (exclusive); and the third range is over 30% (inclusive). It can be seen that the expected ratios of the primary promotion area selected in this paper are all in the third range. In the positive promotion area, the proportions of cities with an expected prefabricated building area ratio in the second range and those in the third range are split 50/50. In the encouraging promotion area, cities with expected ratios in the first range account for 36%, those in the second range account for 44%, and those in the third range account for 20%.
This data reveals that the target of expected prefabricated building area ratio in the primary promotion area is over 30% (inclusive), in the positive promotion area it is over 15% (inclusive), and in the encouraging promotion it is over 10% (inclusive). According to a survey conducted by PIRI [53], the prefabricated building area ratio reached 2.7% in 2015 and 9.1% in 2018; it can therefore be calculated that the average annual increment of expected prefabricated building area ratio is 2.1% in the past few years. In fact, with the continuous incentive policies being promulgated by the governments for promoting prefabrication, prefabricated building is warming up again and showing a trend of rapid development. According to one report, the average annual increment of the growth rate has increased to 3 percentage points in recent years so as to achieve those targets.
3.4. Lessons Learnt
On the basis of the analysis of the impact of policies on the above indicators, it can be found that the implementation of policy has had a positive impact on these indicators. On the whole, prefabrication presents a trend of continuing development under the influence of policies promoting it. However, more specifically, the effectiveness of policies varies among different stakeholders and implementation areas. Both of these factors should be taken into consideration in policy making.
In the primary promotion area, there is a high level of economic development, a complex transportation environment, a high price for commodities, etc. Thus, direct economic incentives such as financial subsidy, tax privilege, and floor area reward are the most effective methods for promoting the use of prefabrication to private enterprises. For consumers, due to the high housing prices in the primary promotion area, the most effective ways are related to reducing housing prices, such as house deed tax deduction or exemptions, raising the loan limit, credit period, and minimum down payment ratio of housing fund loans. For scientific research institutions, to break through the obstacles in the process of prefabrication implementation, special funds, research and development expenses, and professionals are essential.
In the positive promotion area and the encouraging promotion area, the level of economic development was lower than in the primary promotion area. Thus, to promote the development of prefabrication, in addition to economic support, opportunity is also foremost. It can be seen that the proportion of non-economic incentives rises in the positive promotion area and the encouraging promotion area. For private enterprises, not only do they want to obtain profits, but they also want to improve their qualifications. Thus, in addition to economic incentives, non-economic incentives, such as reputation incentives, were also effective for them. For scientific research institutions and consumers, there were a few incentive policies directly related to them; thus, most of the incentives for them were effective. In fact, in addition to learning from the experience of other developed countries’ policy making in the same field, cross-disciplinary learning could also result in significant gains, such as in the field of building renovation [54].
3.5. Challenges Ahead
Nevertheless, there are many difficulties in the implementation of this policy, which can be summarized on the basis of four aspects: unclear goals, inconsistent subsidy standards, difficult practical operation, and low awareness.
With respect to unclear goals, governments in different areas had proposed prefabrication development goals according to the local conditions. However, how these goals should be accomplished was unclear in many areas. For example, the Qinghai government proposed that prefabricated construction was preferable for affordable housing, municipal infrastructure projects, and projects with financial funds and full investment by state-owned enterprises. It can be found that the specific targets (e.g., assembly rate) of these projects was lacking.
With regard to inconsistent subsidy standards, the governments in different areas had proposed a financial subsidy policy. For example, the Henan government proposed that by 2025, the municipal government would subsidize 50 RMB/m2 for projects with a prefabrication rate of more than 30% and an assembly rate of more than 50%. However, there is more than one technical system for buildings, and the subsidy standards could be different for different technical building systems.
With respect to difficulties related to practical operation, floor area reward ranked first. The whole process of floor area reward involves many departments, including the Ministry of Housing and Urban-Rural Development of the People’s Republic of China, the Ministry of Land and Resources of the People’s Republic of China, National Development and Reform Commission, etc. There are many possible risks in this process that cannot be controlled [55]; thus, the implementation of a floor area reward was in an awkward position.
Although there has been some improvement in awareness, stakeholder awareness of prefabrication remains low. Private developers prefer conventional construction methods because of the incremental costs associated with prefabricated construction. In addition, due to lacking propaganda related to prefabricated technology, consumer awareness of prefabrication is not comprehensive enough.
4. Conclusions
Incentive policies are essential for promoting prefabrication technology in the construction industry. Although a series of prefabrication incentive policies has been promulgated by the Chinese government in recent decades, whether these policies are effective or not has not been thoroughly investigated in the existing literature. This paper aims to evaluate the effectiveness of these policies in different promotion areas in China.
On the basis of a comprehensive investigation, the existing incentive policies were classified into seven groups, including mandatory policy, fund support, tax privilege, floor area reward, loan support, land supply, and non-economic incentives. The effectiveness of these policies was further explored with respect to the number of production enterprises for prefabricated components, prefabricated floor area, prefabricated building market size, and expected prefabricated building area ratio. The results showed that economic incentives were more effective in the primary promotion area compared to non-economic incentives, whereas non-economic incentives were more effective in the positive promotion area and the encouraging promotion area. Specifically, with regard to economic incentives, fund support, tax privileges, and floor area rewards were more effective for promoting the implementation of prefabrication in the primary area; in the positive promotion area, tax privileges, fund support, and land supply were more effective; in the encouraging promotion area, fund support, tax privileges, and loan support were more effective. With regard to non-economic incentives, they were more effective in the encouraging promotion area.
The research findings of this study make contributions in terms of both practical and academic aspects. From a practical perspective, this study provides a comprehensive overview of the existing incentive policies for promoting prefabrication in China, which could serve as a useful reference in regions that are willing to promote prefabrication. From an academic perspective, this study divided the promotion areas into three groups on the basis of governmental guidelines and separately investigated their policy effectiveness. This idea is different from the methodology employed in previous studies (e.g., Jiang, Li, Li and Gao [9], Li, Li, Wu and Li [12] Mao, Shen, Pan and Ye [13]), which treated different areas in China as a single entity. The research findings of this study prove that the policy effectiveness in different areas could be inconsistent due to differences in the local economic or industrial conditions. Thus, it is suggested to conduct future research focusing on areas with similar situations, rather than treating a country which has different situations as a single unified whole.
Author Contributions
Conceptualization, W.J. and Z.W.; methodology, L.L.; validation, J.F. and M.F.A.-A.; writing—original draft preparation, L.L. and Z.W.; writing—review and editing, T.Y.; supervision, W.J.
Funding
The authors would like to express their sincere gratitude for funding from the China Postdoctoral Science Foundation, grant number 2019M651295, the Humanities and Social Sciences Grant, Ministry of Education of China, grant number 17YJCZH191, the Research Start-up Funding in Shenzhen, grant number 000376.
Acknowledgments
The authors thank the editors and anonymous reviewers for their valuable and constructive suggestions for improving this paper.
Conflicts of Interest
The authors declare no conflict of interest.
References
- Li, Z.D.; Shen, G.Q.; Alshawi, M. Measuring the impact of prefabrication on construction waste reduction: An empirical study in China. Resour. Conserv. Recycl. 2014, 91, 27–39. [Google Scholar] [CrossRef] [Green Version]
- Xue, H.; Zhang, S.; Su, Y.; Wu, Z. Capital Cost Optimization for Prefabrication: A Factor Analysis Evaluation Model. Sustainability 2018, 10, 159. [Google Scholar] [CrossRef]
- Hanafi, M.H.; Farrell, P.; Yusoff, M.N.; Abdullah, S.; Razak, A.A. Installation systems of on-site prefabricated concrete components: A qualitative approach. Int. J. Constr. Manag. 2018, 18, 343–350. [Google Scholar] [CrossRef]
- Wu, Z.; Yu, A.T.W.; Poon, C.S. An off-site snapshot methodology for estimating building construction waste composition—A case study of Hong Kong. Environ. Impact Assess. Rev. 2019, 77, 128–135. [Google Scholar] [CrossRef]
- Wang, Y.; Li, H.; Wu, Z. Attitude of the Chinese public toward off-site construction: A text mining study. J. Clean. Prod. 2019, 238, 117926. [Google Scholar] [CrossRef]
- Xue, H.; Zhang, S.; Su, Y.; Wu, Z.; Yang, R.J. Effect of stakeholder collaborative management on off-site construction cost performance. J. Clean. Prod. 2018, 184, 490–502. [Google Scholar] [CrossRef]
- Correia Lopes, G.; Vicente, R.; Azenha, M.; Ferreira, T.M. A systematic review of Prefabricated Enclosure Wall Panel Systems: Focus on technology driven for performance requirements. Sustain. Cities Soc. 2018, 40, 688–703. [Google Scholar] [CrossRef]
- Park, M.; Ingawale-Verma, Y.; Kim, W.; Ham, Y. Construction policymaking: With an example of singaporean government’s policy to diffuse prefabrication to private sector. KSCE J. Civil Eng. 2011, 15, 771–779. [Google Scholar] [CrossRef]
- Jiang, L.; Li, Z.; Li, L.; Gao, Y. Constraints on the Promotion of Prefabricated Construction in China. Sustainability 2018, 10, 2516. [Google Scholar] [CrossRef]
- Liang, X.; Yu, T.; Hong, J.; Shen, G.Q. Making incentive policies more effective: An agent-based model for energy-efficiency retrofit in China. Energy Policy 2019, 126, 177–189. [Google Scholar] [CrossRef]
- NBS. China urban construction statistical yearbook. 2016. Available online: http://www.stats.gov.cn/tjsj/tjcbw/201706/t20170613_1502795.html (accessed on 1 August 2019).
- Li, L.; Li, Z.; Wu, G.; Li, X. Critical Success Factors for Project Planning and Control in Prefabrication Housing Production: A China Study. Sustainability 2018, 10, 836. [Google Scholar] [CrossRef]
- Mao, C.; Shen, Q.; Pan, W.; Ye, K. Major Barriers to Off-Site Construction: The Developer’s Perspective in China. J. Manag. Eng. 2015, 31, 04014043. [Google Scholar] [CrossRef]
- General Office of the State Council, P. Decision on Strengthening and Developing the Construction Industry. Available online: https://baike.baidu.com/item/%E5%9B%BD%E5%8A%A1%E9%99%A2%E5%85%B3%E4%BA%8E%E5%8A%A0%E5%BC%BA%E5%92%8C%E5%8F%91%E5%B1%95%E5%BB%BA%E7%AD%91%E5%B7%A5%E4%B8%9A%E7%9A%84%E5%86%B3%E5%AE%9A/22270408?fr=aladdin (accessed on 24 July 2019).
- MOHURD. Outline for the Development of Building Industrialization. Constr. Tech. 1995, 8, 1–3. [Google Scholar]
- General Office of the State Council, P. Green Building Action Plan. Available online: http://www.gov.cn/zhengce/content/2013-01/06/content_4572.htm (accessed on 24 July 2019).
- MOHURD. Outline of Modern Development of Building Industrialization. Available online: http://www.precast.com.cn/index.php/news_detail-id-4866.html (accessed on 26 July 2019).
- General Office of the State Council, P. Suggestions on Further Strengthening Urban Planning and Construction Management. Available online: http://www.gov.cn/zhengce/2016-02/21/content_5044367.htm (accessed on 24 July 2019).
- General Office of the State Council, P. Guidance on Vigorously Developing Prefabricated Buildings. Available online: http://www.gov.cn/zhengce/content/2016-09/30/content_5114118.htm (accessed on 24 July 2019).
- General Office of the State Council, P. 13th Five-Year Comprehensive Work Plan for Energy Conservation and Emission Reduction. Available online: http://www.gov.cn/zhengce/content/2017-01/05/content_5156789.htm (accessed on 24 July 2019).
- MOHURD. 13th Five-Year Prefabricated Building Action Plan. Available online: http://www.mohurd.gov.cn/wjfb/201703/t20170327_231283.html (accessed on 25 July 2019).
- MOHURD. 13th Five-Year Plan for the Development of Construction Industry. Available online: http://www.mohurd.gov.cn/wjfb/201705/t20170503_231715.html (accessed on 25 July 2019).
- MOHURD. The circular on the issuance of working guidelines for 2018. Available online: http://www.mohurd.gov.cn/wjfb/201804/t20180404_235620.html (accessed on 26 July 2019).
- Lu, W.; Yuan, H. A framework for understanding waste management studies in construction. Waste Manag. 2011, 31, 1252–1260. [Google Scholar] [CrossRef] [PubMed] [Green Version]
- Zou, P.X.W.; Xu, X.; Sanjayan, J.; Wang, J. Review of 10 years research on building energy performance gap: Life-cycle and stakeholder perspectives. Energy Build. 2018, 178, 165–181. [Google Scholar] [CrossRef]
- Roelofs, C.; Sprague-Martinez, L.; Brunette, M.; Azaroff, L. A qualitative investigation of Hispanic construction worker perspectives on factors impacting worksite safety and risk. Environ. Health 2011, 10. [Google Scholar] [CrossRef]
- Li, Z.; Shen, G.Q.; Xue, X. Critical review of the research on the management of prefabricated construction. Habitat Int. 2014, 43, 240–249. [Google Scholar] [CrossRef] [Green Version]
- Tam, V.W.Y.; Fung, I.W.H.; Sing, M.C.P.; Ogunlana, S.O. Best practice of prefabrication implementation in the Hong Kong public and private sectors. J. Clean. Prod. 2015, 109, 216–231. [Google Scholar] [CrossRef]
- Mao, C.; Xie, F.; Hou, L.; Wu, P.; Wang, J.; Wang, X. Cost analysis for sustainable off-site construction based on a multiple-case study in China. Habitat Int. 2016, 57, 215–222. [Google Scholar] [CrossRef]
- Yu, T.; Liang, X.; Shen, G.Q.; Shi, Q.; Wang, G. An optimization model for managing stakeholder conflicts in urban redevelopment projects in China. J. Clean. Prod. 2019, 212, 537–547. [Google Scholar] [CrossRef]
- Shi, Q.; Zhu, J.; Hertogh, M.; Sheng, Z. Incentive Mechanism of Prefabrication in Mega Projects with Reputational Concerns. Sustainability 2018, 10, 1260. [Google Scholar] [CrossRef]
- Tian, L.; Ma, W. Government intervention in city development of China: A tool of land supply. Land Use Policy 2009, 26, 599–609. [Google Scholar] [CrossRef]
- Li, K.; Ma, Z.; Zhang, G. Evaluation of the supply-side efficiency of China’s real estate market: A data envelopment analysis. Sustain. Switz. 2019, 11, 288. [Google Scholar] [CrossRef]
- Gao, W.; Wang, X.; Haifeng, L.; Zhao, P.; Ren, J.; Toshio, O. Living environment and energy consumption in cities of Yangtze Delta Area. Energy Build. 2004, 36, 1241–1246. [Google Scholar] [CrossRef]
- Wu, J.; Gyourko, J.; Deng, Y. Evaluating the risk of Chinese housing markets: What we know and what we need to know. China Econ. Rev. 2016, 39, 91–114. [Google Scholar] [CrossRef] [Green Version]
- Yu, T.; Tang, Q.; Wu, Y.; Wang, Y.; Wu, Z. What Determines the Success of Culture-Led Regeneration Projects in China? Sustainability 2019, 11, 4847. [Google Scholar] [CrossRef]
- Wu, Z.; Jiang, M.; Cai, Y.; Wang, H.; Li, S. What Hinders the Development of Green Building? An Investigation of China. Int. J. Environ. Res. Public Health 2019, 16, 3140. [Google Scholar] [CrossRef] [PubMed]
- Han, Y.; Skibniewski, M.J.; Wang, L. A Market Equilibrium Supply Chain Model for Supporting Self-Manufacturing or Outsourcing Decisions in Prefabricated Construction. Sustainability 2017, 9, 2069. [Google Scholar] [CrossRef]
- Chen, Q.; Liu, P.H.; Chen, C.T. Evolutionary game analysis of government and enterprises during promotion process of prefabricated construction. J. Interdiscip. Math. 2017, 20, 1587–1593. [Google Scholar] [CrossRef]
- Gibb, A.G.F.; Isack, F. Re-engineering through pre-assembly: Client expectations and drivers. Build. Res. Inf. 2003, 31, 146–160. [Google Scholar] [CrossRef]
- Cao, X.; Li, X.; Zhu, Y.; Zhang, Z. A comparative study of environmental performance between prefabricated and traditional residential buildings in China. J. Clean. Prod. 2015, 109, 131–143. [Google Scholar] [CrossRef]
- Wu, Z.; Li, H.; Feng, Y.; Luo, X.; Chen, Q. Developing a green building evaluation standard for interior decoration: A case study of China. Build. Environ. 2019, 152, 50–58. [Google Scholar] [CrossRef]
- Zhang, L.; Chen, L.; Wu, Z.; Zhang, S.; Song, H. Investigating Young Consumers’ Purchasing Intention of Green Housing in China. Sustainability 2018, 10, 1044. [Google Scholar] [CrossRef]
- Wang, W.; Wu, Y.; Sloan, M. A framework dynamic model for reform of residential land supply policy in urban China. Habitat Int. 2018, 82, 28–37. [Google Scholar] [CrossRef]
- Jianan, S.; Xiaobin, J.I.N.; Jian, T.; Zhihong, Z.; Ning, D.; Jie, Z.; Yinkang, Z. Analysis of Influencing Factors for Urban Land Price and Its Changing Trend in China in Recent Years. Acta Geogr. Sin. 2011, 66, 1045–1054. [Google Scholar]
- Mao, C.; Liu, G.; Shen, L.; Wang, X.; Wang, J. Structural Equation Modeling to Analyze the Critical Driving Factors and Paths for Off-site Construction in China. KSCE J. Civil. Eng. 2018, 22, 2678–2690. [Google Scholar] [CrossRef]
- Wu, Z.; Yu, A.T.W.; Shen, L. Investigating the determinants of contractor’s construction and demolition waste management behavior in Mainland China. Waste Manag. 2017, 60, 290–300. [Google Scholar] [CrossRef]
- Zhou, Z.; De Schutter, B.; Lin, S.; Xi, Y. Two-Level Hierarchical Model-Based Predictive Control for Large-Scale Urban Traffic Networks. IEEE Trans. Control Syst. Technol. 2017, 25, 496–508. [Google Scholar] [CrossRef]
- Abdou, O.A.; Murali, K.; Morsi, A. Thermal performance evaluation of a prefabricated fiber-reinforced plastic building envelope system. Energy Build. 1996, 24, 77–83. [Google Scholar] [CrossRef]
- Hwang, B.G.; Shan, M.; Looi, K.Y. Key constraints and mitigation strategies for prefabricated prefinished volumetric construction. J. Clean. Prod. 2018, 183, 183–193. [Google Scholar] [CrossRef]
- Xue, H.; Zhang, S.; Su, Y.; Wu, Z. Factors Affecting the Capital Cost of Prefabrication—A Case Study of China. Sustainability 2017, 9, 1512. [Google Scholar] [CrossRef]
- PIRI. Report of Development Pattern and Investment Strategy Planning on China Residence Industrialization (2019–2024). Available online: https://bg.qianzhan.com/report/detail/748317cefd1944f2.html (accessed on 1 August 2019).
- PIRI. Report of Industry Strategic Planning and Enterprise Strategic Planning on China Assembled Building Industry (2019–2024). Available online: https://bg.qianzhan.com/report/detail/1804091123108595.html?v=title (accessed on 28 July 2019).
- D’Oca, S.; Ferrante, A.; Ferrer, C.; Pernetti, R.; Gralka, A.; Sebastian, R.; Veld, P.O. Technical, Financial, and Social Barriers and Challenges in Deep Building Renovation: Integration of Lessons Learned from the H2020 Cluster Projects. Buildings 2018, 8, 174. [Google Scholar] [CrossRef]
- Yu, T.; Shen, G.Q.; Shi, Q.; Lai, X.; Li, C.Z.; Xu, K. Managing social risks at the housing demolition stage of urban redevelopment projects: A stakeholder-oriented study using social network analysis. Int. J. Proj. Manag. 2017, 35, 925–941. [Google Scholar] [CrossRef]
Figure 1.
Incentive policy framework.

Figure 2.
First-level incentive policy: (a) Comparative proportions of first-level incentive policy among three promotion areas; (b) Comparative frequency of first-level incentive policy among three promotion areas.
Figure 2.
First-level incentive policy: (a) Comparative proportions of first-level incentive policy among three promotion areas; (b) Comparative frequency of first-level incentive policy among three promotion areas.


Figure 3.
Comparative proportions of mandatory policy among three promotion areas.

Figure 4.
Incentive of fund support: (a) Comparative proportions of fund support among three promotion areas; (b) Comparative frequency of fund support among three promotion areas.
Figure 4.
Incentive of fund support: (a) Comparative proportions of fund support among three promotion areas; (b) Comparative frequency of fund support among three promotion areas.

Figure 5.
Incentive of tax privilege: (a) Comparative proportions of tax privilege among three promotion areas; (b) Comparative frequency of tax privilege among three promotion areas.
Figure 5.
Incentive of tax privilege: (a) Comparative proportions of tax privilege among three promotion areas; (b) Comparative frequency of tax privilege among three promotion areas.

Figure 6.
Incentive of loan support: (a) Comparative proportions of loan support between three promotion areas; (b) Comparative frequency of loan support between three promotion areas.
Figure 6.
Incentive of loan support: (a) Comparative proportions of loan support between three promotion areas; (b) Comparative frequency of loan support between three promotion areas.

Figure 7.
Comparative proportions of floor area reward between three promotion areas.

Figure 8.
Comparative proportions of land policy between three promotion areas.

Figure 9.
Non-economic incentives: (a) comparative proportions of non-economic incentives among three promotion areas; (b) comparative frequency of non-economic incentives among three promotion areas.
Figure 9.
Non-economic incentives: (a) comparative proportions of non-economic incentives among three promotion areas; (b) comparative frequency of non-economic incentives among three promotion areas.

Figure 10.
Annual amounts of prefabricated components production enterprises.

Figure 11.
Prefabricated industrial parks in China (by the end of 2018).

Figure 12.
Annual growth of newly built prefabricated floor area.

Figure 13.
Annual growth of prefabricated building market size.

Figure 14.
Expected prefabricated building area ratio by 2020 in three promotion areas.


Table 1.
Frequency of policies in three promotion areas.
| Policy Categories | Frequency | |||
|---|---|---|---|---|
| Primary Promotion Area | Positive Promotion Area | Encouraging Promotion Area | ||
| A | Mandatory policy | 4 | 1 | 1 |
| B | Fund support | 21 | 20 | 39 |
| C | Tax privilege | 16 | 26 | 31 |
| D | Floor area reward | 15 | 15 | 21 |
| E | Loan support | 12 | 12 | 25 |
| F | Land supply | 9 | 18 | 18 |
| G | Non-economic incentives | 19 | 24 | 59 |
| Total frequency | 96 | 116 | 194 | |
Table 2.
Frequency of mandatory policy in three promotion areas.
| Mandatory policy | Frequency | |||
|---|---|---|---|---|
| Primary Promotion Area | Positive Promotion Area | Encouraging Promotion Area | ||
| A1 | Affordable housing projects support | 2 | - | - |
| A2 | Punishment for contact violation | 2 | 1 | - |
| A3 | Disposal of unqualified projects | 2 | - | 1 |
Table 3.
Frequency of floor area reward in three promotion areas.
| Floor Area Reward | Frequency | |||
|---|---|---|---|---|
| Primary Promotion Area | Positive Promotion Area | Encouraging Promotion Area | ||
| E1 | Volume rate bonus | 6 | 12 | 7 |
| E2 | Deduction of prefabricated building area of external wall | 11 | 12 | 14 |
Table 4.
Frequency of land policy in three promotion areas.
| Land Policy | Frequency | |||
|---|---|---|---|---|
| Primary Promotion Area | Positive Promotion Area | Encouraging Promotion Area | ||
| F1 | Priority land supply | 8 | 17 | 18 |
| F2 | Land-transferring fees free | 1 | - | - |
| F3 | Pay land-transferring fees by stages | - | 2 | 4 |
Table 5.
Number statistics of production enterprises during 2010–2016.
| Year | Number of Enterprises | Annual Growth of Number of Enterprises | Growth Rate |
|---|---|---|---|
| 2010 | 59 | - | - |
| 2011 | 68 | 9 | 15.25% |
| 2012 | 80 | 12 | 17.65% |
| 2013 | 97 | 17 | 21.25% |
| 2014 | 111 | 14 | 14.43% |
| 2015 | 130 | 19 | 17.12% |
| 2016 | 156 | 26 | 20.00% |
Table 6.
Newly built prefabricated floor area in 2012–2017.
| Year | Newly Built Prefabricated Floor Area (10000 m2) | Annual Growth of Newly Built Prefabricated Floor Area (10000 m2) | Growth Rate (%) |
|---|---|---|---|
| 2012 | 1425 | - | - |
| 2013 | 3738 | 2313 | 162.32% |
| 2014 | 5560 | 1822 | 48.74% |
| 2015 | 7260 | 1700 | 30.58% |
| 2016 | 11,400 | 4140 | 57.02% |
| 2017 | 15,240 | 3840 | 33.68% |
Notes: Data from PIRI [53].
Table 7.
Prefabricated building market size in 2012–2017.
| Year | Prefabricated Building Market Size (100 Million Yuan) | Growth Quantity (100 Million Yuan) | Growth Rate (%) |
|---|---|---|---|
| 2012 | 303 | - | - |
| 2013 | 826 | 523 | 172.61% |
| 2014 | 1278 | 452 | 54.72% |
| 2015 | 1736 | 458 | 35.84% |
| 2016 | 2834 | 1098 | 63.25% |
| 2017 | 4682 | 1848 | 65.21% |
Notes: Data from PIRI [53].
Table 8.
Frequency of regulations related to expected prefabricated building area ratio.
| Assembly Rate | Primary Promotion Area | Positive Promotion Area | Encouraging Promotion Area |
|---|---|---|---|
| 10%–15% (excluding) | - | - | 9 |
| 15%–30% (excluding) | - | 6 | 11 |
| More than 30% (including) | 3 | 6 | 5 |
© 2019 by the authors. Licensee MDPI, Basel, Switzerland. This article is an open access article distributed under the terms and conditions of the Creative Commons Attribution (CC BY) license (http://creativecommons.org/licenses/by/4.0/).
Share and Cite
MDPI and ACS Style
Jiang, W.; Luo, L.; Wu, Z.; Fei, J.; Antwi-Afari, M.F.; Yu, T. An Investigation of the Effectiveness of Prefabrication Incentive Policies in China. Sustainability 2019, 11, 5149. https://doi.org/10.3390/su11195149
AMA Style
Jiang W, Luo L, Wu Z, Fei J, Antwi-Afari MF, Yu T. An Investigation of the Effectiveness of Prefabrication Incentive Policies in China. Sustainability. 2019; 11(19):5149. https://doi.org/10.3390/su11195149
Chicago/Turabian StyleJiang, Weiping, Lirong Luo, Zezhou Wu, Jianbo Fei, Maxwell Fordjour Antwi-Afari, and Tao Yu. 2019. "An Investigation of the Effectiveness of Prefabrication Incentive Policies in China" Sustainability 11, no. 19: 5149. https://doi.org/10.3390/su11195149
Note that from the first issue of 2016, this journal uses article numbers instead of page numbers. See further details here.