A Comprehensive Thermal Comfort Analysis of the Cooling Effect of the Stand Fan Using Questionnaires and a Thermal Manikin

Department of Architectural Engineering, University of Seoul, Seoul 02504, Korea
*
Author to whom correspondence should be addressed.
†
Contributed equally to this work.
Sustainability 2019, 11(18), 5091; https://doi.org/10.3390/su11185091
Submission received: 14 August 2019
/
Revised: 12 September 2019
/
Accepted: 12 September 2019
/
Published: 17 September 2019
Abstract
:In this study a quantitative analysis was performed on the effect on thermal comfort of the stand fan, a personal cooling device that creates local air currents. A total of 20 environmental conditions (indoor temperatures: 22, 24, 26, 28, and 30 °C; fan modes: off, low (L) mode, medium (M) mode, and high (H) mode) were analyzed using questionnaires on male and female subjects in their 20s and a thermal manikin test. The contents of the questionnaire consisted of items on thermal sensation, thermal comfort, thermal acceptability, and demands on changes to the air velocity. This step was accompanied by the thermal manikin test to analyze the convective heat transfer coefficient and cooling effect quantitatively by replicating the stand fan. Given that this study provides data on the cooling effect of the stand fan in quantitative values, it allows for a comparison of energy use with other cooling systems such as the air conditioner, and may be used as a primary data set for analysis of energy conservation rates.
1. Introduction
Indoor air velocity is one of the key physical variables affecting occupant comfort, along with dry air temperature, radiation temperature, and relative humidity [1]. However, indoor air velocity has mostly been studied with a focus on draft—air currents that cause thermal discomfort. More recently, the emphasis has been shifting to observe the positive effects of air currents in warm weather conditions that improve occupant comfort and energy conservation [2]. Konz et al. [3] found that an increase in average air current increase by 0.1 m/s (between 0.4 and 1.2 m/s) in oscillating and fixed personal fans can have equal comfort level to a maximum 0.40 °C increase in temperature. Hseieh [4] studied the thermal comfort according to varying temperatures and air velocities with male and female college students of medium activity level and showed that a 0.23 m/s increase of air velocity offset a 1 °C increase. Such a result indicates that at the same activity levels, the existence of a fan may raise the optimal indoor temperature for thermal comfort compared to situations without a fan. Toftum and Nielsen [5] conducted a study of 10 male subjects where they were exposed to average velocity gradually increasing from 0.05 to 0.40 m/s for temperatures between 11 and 20 °C to see if the subjects could feel the movement or air and whether it caused discomfort. In a comparison of dissatisfied responses at two different activity levels, there was less dissatisfaction at high activity levels rather than lower ones. Another study administered a questionnaire to the occupants of schools and offices in Australia. Seventy percent of the respondents answered that when the thermal sensation of the body was slightly warm or hot, they preferred a wind velocity higher than 0.2 m/s. This surpasses the air velocity suggested by ASHRAE Standard 55-2013 [6] to prevent the risk of the draft. Even at a neutral body thermal sensation, half of the respondents said that they wanted a higher air velocity than 0.2 m/s [7]. Sun et al. [8] attached a small fan to each corner of a chair to create an upward current and examined the thermal comfort and individual usage patterns of 32 college students at indoor temperatures of 22, 24, and 26 °C. At 26 °C, the subjects expressed satisfaction at the high air velocity from the fans but felt coldness at the waist for 22 and 24 °C. Also, the overall thermal sensation of the body was determined by the thermal sensation at the waist, arms, calves, and feet. This showed that while the lower parts of the body are less affected by the surrounding environment [9], the upper body is directly exposed to the air current, thereby playing a key role in determining the overall thermal sensation of the body. Further, when the subjects were allowed to manipulate the air velocity, 90% of them changed the air velocity within an hour.
On the other hand, higher indoor air current has cooling effects, not only maintaining the thermal comfort of the occupant at a higher temperature but also lowering the cooling energy consumption of the building compared to air conditioners [2]. Further, it has been reported that air current has a positive relationship with thermal comfort in fields other than buildings (i.e., automobiles, indoors, underground mines) [10,11,12]. Yang et al. [13] expressed the cooling fan efficiency of fans using an index called cooling fan efficiency (CFE). They conducted a thermal manikin test with air velocity between 0.6 and 2.5 m/s at temperatures of 24, 26, 28, and 30 °C. The CFE appeared higher at lower temperatures and higher wind velocity, and the rise of fan air velocity not only increased the cooling effect on the human body but also the energy consumption. The thermal manikin test showed that the maximum cooling effect according to the air velocity of the fan was −2 °C, proving that the stand fan is an energy-efficient technology that satisfies thermal comfort under warm weather conditions. Zhai et al. [14] looked not only at temperatures of 26, 28, and 30 °C but also relative humidity levels of 60% and 80%, administering a questionnaire for subjects in an experiment using the stand fan. Eighty percent of the subjects replied that they could accommodate up to 30 °C and 60%, but showed discomfort at 30 °C and 80%, requesting higher air velocity. Ho et al. [15] used numerical simulation to analyze the indoor fluid flow and heat transfer in a room with a ceiling fan. When the ceiling fan is operational, it creates a strong circulation of air, inducing convective heat transfer and displaying an even temperature distribution. As a result, the predictive mean vote (PMV) value shifted to cool with the increase in air velocity created by the fan. That is, even in the circumstances with higher heat load, the ceiling fan has a cooling effect, making it possible to maintain thermal comfort.
Various studies around the world have found that indoor temperature setting regulations can cause occupant discomfort [16], thereby leading to a negative effect of lowered productivity [17,18]. As such, to increase the productivity in high indoor temperature, further cooling through building control [19] or stand fan may be used.
Therefore, this study aimed at a quantitative analysis of the cooling effect of the stand fan, a personal cooling device creating local air current, on thermal comfort. As it is not possible to objectivize or quantify all subjects at same conditions [20], this study analyzed the cooling effect of stand fan through questionnaires for subjects and an experiment using a thermal manikin.
2. Method
As can be seen in Figure 1, this study conducted an analysis of the indoor thermal comfort questionnaire following the operation of a stand fan and that of the cooling effect of the stand fan using a thermal manikin. The specifics are as follows:
- Step ①: Prior to studying the cooling effect of the fan and its impact on the occupant thermal comfort, the air velocity the temperature at the location of the occupant was measured. Assuming that the occupant would be sitting, the air current was measured at the foot level (0.1 m), head level (1.1 m), and the level parallel to the fan (0.6 m), where the air current was likely to be the strongest.
- Step ②: To derive the impact of stand fan operation according to indoor temperature on thermal comfort, a questionnaire was administered to 16 university and graduate students in their 20s. Indoor temperature conditions were 22, 24, 26, 28, and 30 °C, and the fan was set to off mode (Off), low mode (L), medium mode (M), and high mode (H), which were combined to create 20 environmental conditions.
- Step ③: The thermal manikin test was conducted in the environmental chamber. Indoor temperature and relative humidity represented the same conditions as in the questionnaires. The airflow devices were calibrated to the same conditions as the air velocity at the three levels in ①.
- Step ④: Through the thermal manikin test, the heat flux of each body part was measured and used to obtain the coefficient of convective heat transfer.
- Step ⑤: The convective heat transfer coefficient (obtained through the thermal manikin test and the sensitivity of each body part) was utilized to calculate the cooling effect of the stand fan for each of the three modes (L, M, and H).
- Step ⑥: A comprehensive analysis of the cooling effect was derived through the questionnaire and the thermal manikin on the stand fan.
The above process is repeated for each set temperature (22–30 °C, 2 °C interval).
3. Questionnaire for Thermal Comfort
3.1. Setting for the Questionnaire
3.1.1. Standing Fan
The specifications of the fan used to analyze the cooling effect are as shown in Table 1. As a product of company H, the fan has five 14-inch wings and has the function that allows its four modes to be adjusted by remote control. Its height is adjustable between 0.7 and 0.86 m. This study had the fan’s center set at a 0.6-m height for the experiment. This is the same height as the ASHRAE Standard 55-2013 [6] uses to assess thermal comfort with the occupant sitting down.
The fan power increases the air velocity from level 1 to 4, and this study utilized only the fan power from 1 to 3, leaving out level 4. Here, we express level 1 as the low mode (L), level 2 as the medium mode (M), and level 3 as the high mode (H). Table 2 shows the air velocity according to fan mode.
3.1.2. Object Space
To ensure that only the air velocity caused by the fan would be measured by minimizing the effect of crosswind, a single room of sufficient size was chosen so that the experiment would be less affected by other structures such as pillars. The selected room was a single room with the dimensions of 6.88 m (L) × 8.64 m (W) × 3 m (H), with pillars (0.68 m × 0.5 m) on the west and east side of the room. Desks, chairs, and a whiteboard were piled on the western wall of the room, making the actual area used for measurement approximately 46 m2.
3.1.3. Indoor Temperature Control of Target Space
Two electric heat pump (EHP) devices installed on the ceiling were used for indoor temperature control. To ensure that the air current from the EHP did not affect the occupant, a thin vinyl was installed at 2-m height to create a temporary ceiling between the EHP and the occupant’s head. Also, as two fans would not have any effect if they were more than 3 m apart [21], questionnaires were administered in groups of two.
3.1.4. Questionnaire Conditions
Figure 2 shows the position of the fan and the occupant. F indicates the fan, and O indicates the occupant location. X is the measurement spots of indoor temperature and humidity. The distance between F1 and F2 is 3.0 m, and the distance between the fan and the occupant is 1.5 m. Also, to minimize discomfort such as dry eyes that may be induced by the extended exposure to air current given the length of the experiment and to account for the actual use of the fan when sitting at a desk, the fan was positioned so that the air current from it reached the occupant from the side (left).
The indoor environment conditions for the questionnaire is as shown in Table 3. There are five indoor temperatures: 22, 24, 26, 28, and 30 °C; the fan modes consisted of off, low (L), medium (M), and high (H). Also, the relative humidity was kept within the comfort range of 40–60%. To ensure consistency of the temperature and the humidity, a measurement devices were installed at X to monitor the conditions in the duration of the questionnaire process.
3.1.5. Study Subjects
Study subjects consisted of 16 university and graduate students, 8 male and 8 female. These students were born in Korea and are familiar with the Korean climate. Similar with Fong et al.’s study [16], experiments were conducted with students from the area. Table 4 shows the physical attributes of the study subjects, who were healthy students in the 20s with an average age of 26.
To ensure psychological variables such as stress did not affect the comfort assessment, study subjects were recommended to have at least 7 h of sleep the previous night. It was notified prior to the experiment that they were to wear underwear, half-sleeves, long summer pants (excluding jeans), socks, and slippers. Those with longer hair were required to tie their hair. During the questionnaire, the occupants’ activities were limited to light reading and writing; they were not allowed to leave their spots during the experiment.
3.1.6. Questionnaire Procedures
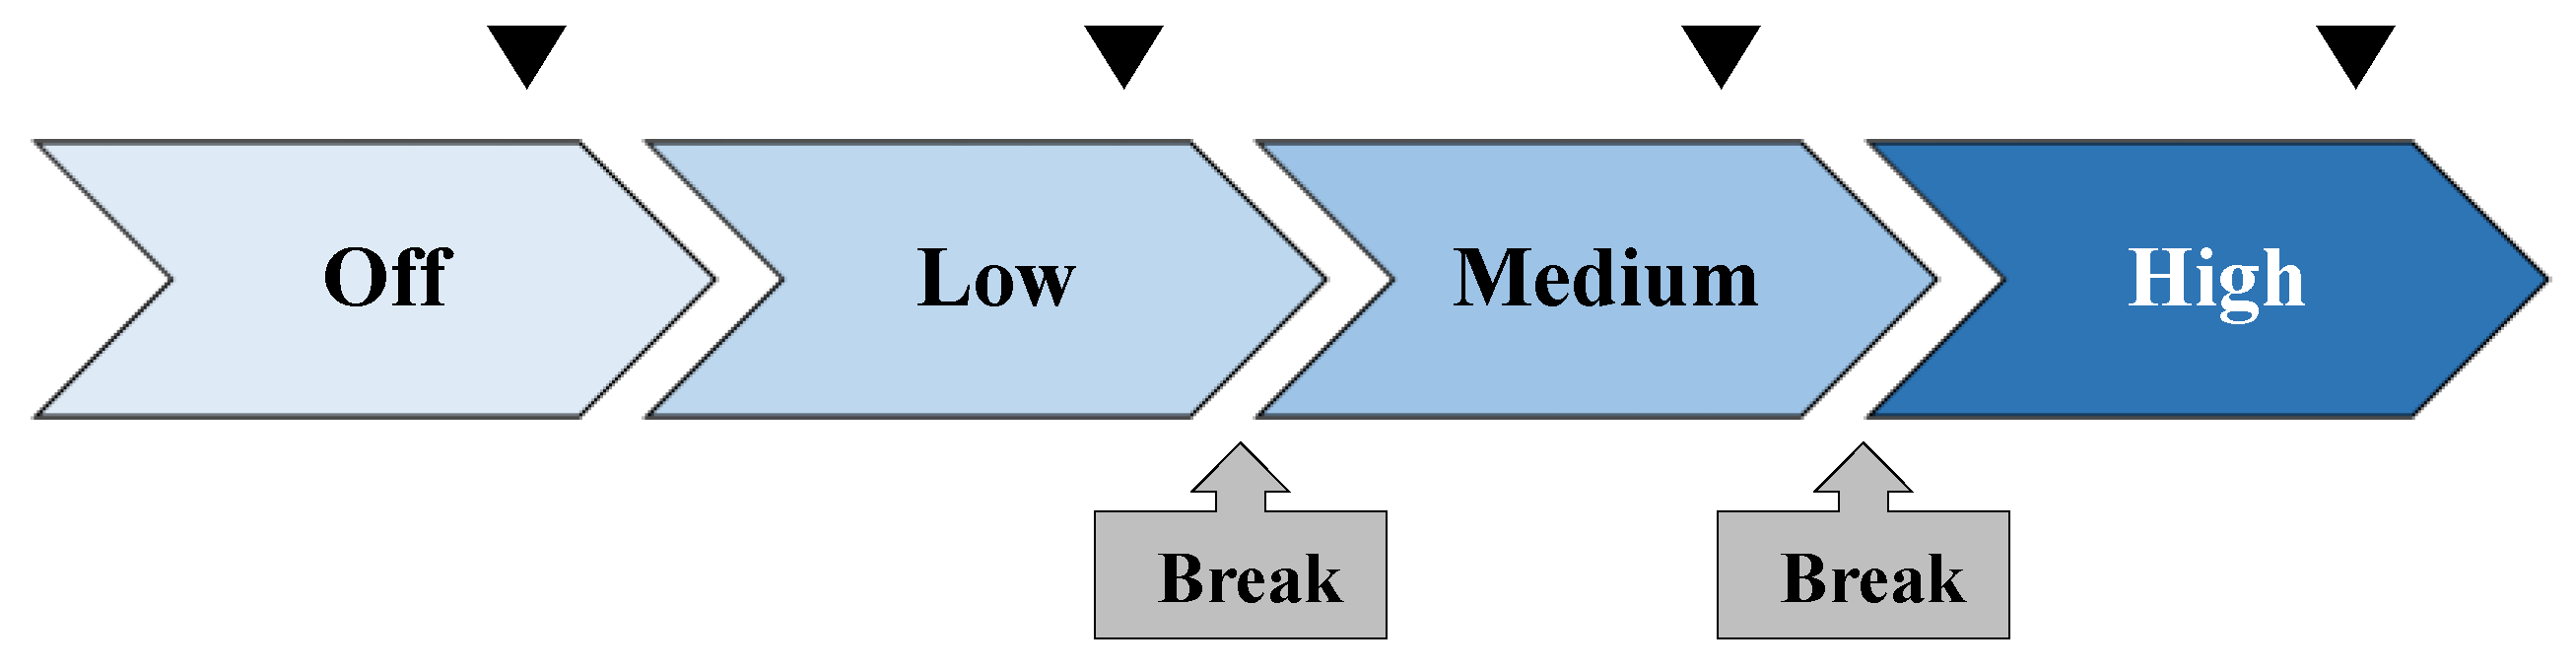
The procedures for the questionnaire are as shown in Figure 3. Fan mode started at Off, and changed to Low, Medium, and High in that order. “▼” indicates the administration of the questionnaire. Each subject took 15 min to adapt to indoor temperature before operating the fan, and they were given a 5-min break before the change to the fan mode within the room. Once the questionnaires were collected for the four fan modes under one temperature conditions, the indoor temperature was adjusted. The subjects were allowed at this point to leave the space for a 25–30-min break. If the subjects complained of severe cold or heat they filled out the survey immediately, stopping the experiment and allowing the subjects to take a break.
3.1.7. Questionnaire Contents
As can be seen in Table 5, the contents of the questionnaire constituted of thermal sensation, thermal comfort, thermal acceptability, and demands on changes to the air velocity. A questionnaire was administered over 20 times according to changes in the experiment conditions.
3.2. Questionnaire Results
3.2.1. Thermal Sensation (TS)
The first item on the questionnaire asked about the general thermal sensation. The subjects were instructed prior to the experiment to express thermal sensation on a scale of –3 (cold), −2 (cool), −1 (slightly cool), 0 (neutral), +1 (slightly warm), +2 (warm), and +3 (hot). Table 6 shows the average thermal sensation and thermal comfort among the 16 study subjects according to fan mode. According to the ASHRAE Standard 55-2013 [6], thermal sensation from −1 to +1 is regarded as representing comfort when assessing the indoor thermal environment through a questionnaire. However, when compared to the second item thermal comfort, subjects selected a thermal sensation in the range of −2 to 0 when they answered that the thermal environment was comfortable. Such a low thermal sensation appears to be due to the age group of the subjects (who were in their 20s), indicating that that −2 (cool) is pleasantly cool. Also, as the experiment was conducted during July in the summer, a cooler sensation may have been preferred.
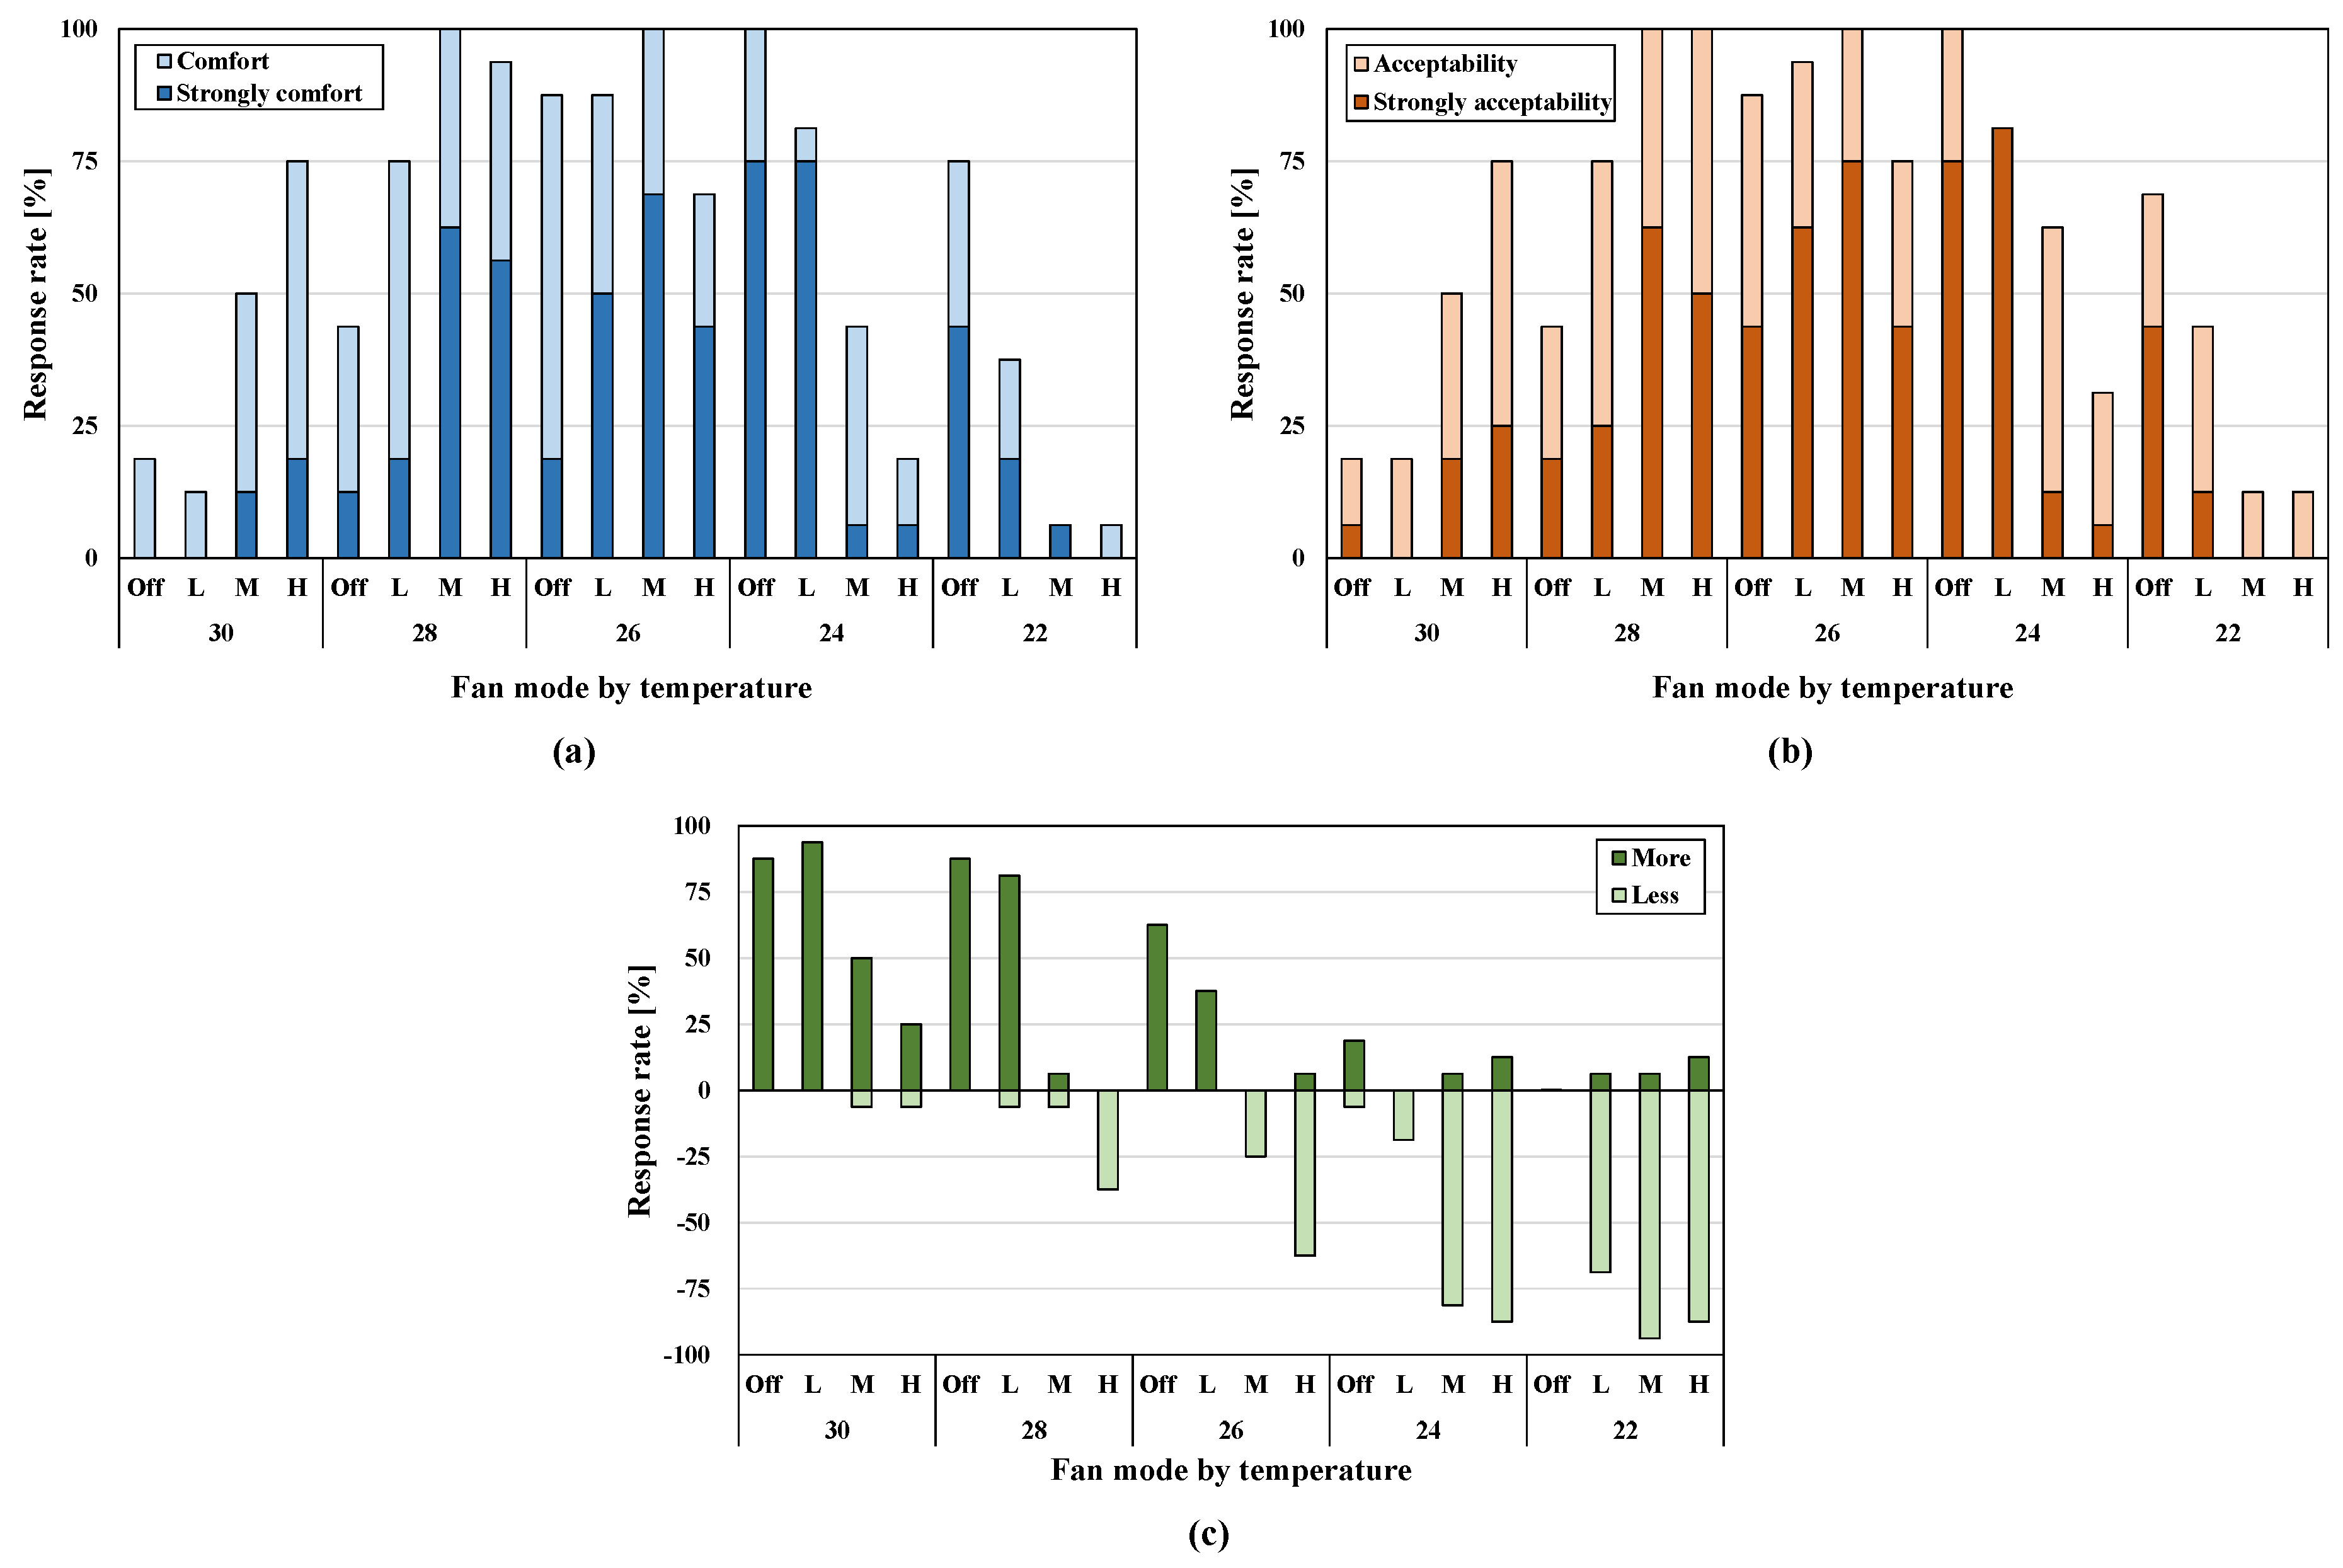
3.2.2. Thermal Comfort (TC) and Thermal Acceptability (TA)
Figure 4 shows the proportion of the responses to each item of the questionnaire. At 22 °C, more than 75% of the responses did not show thermal comfort, with the exception of the L mode, and no one felt strong comfort at H mode. Even when the fan was not in operation, the proportion of those who reported strong comfort was 44%, less than half. This indicates that for thermal comfort the fan should not be operated. In contrast, the responses in the comfort range was 75%, but those who showed “strong comfort” represented 19%, indicating that the operation of the fan did not have a positive impact on the thermal comfort of occupants. That is, at 22 and 30 °C occupants cannot feel thermal comfort, making them the limit temperatures on use of the fan. These results are similar to those of a previous study [14].
The responses on TC and TA were mostly similar. At an Off mode of 22 °C, 75% of the responses indicated comfort, but the responses on acceptability did not reach 75%. At an H mode of 26 °C, the comfort responses were 69%, but acceptability was over 75%.
3.2.3. Demands on Changes to the Air Velocity
Figure 4c shows the demands on changes to the air velocity. Here, the proportion of positive (+) responses indicate more, and the negative (−) responses indicate less.
At Off and L modes of 30 °C, most responses demanded a stronger air velocity, but at M and H modes, 50% of the occupants did not demand a stronger air velocity although the thermal discomfort had not yet been relieved. Also, no respondents wanted a higher wind velocity at H mode at any of the temperature conditions.
4. Thermal Manikin Experiment
4.1. Experiment Overview
A thermal manikin test was conducted to quantify the cooling effect of the stand fan. This experiment measured the heat flux in each body part, which was used to calculate the convective heat transfer coefficient and the cooling effect.
4.2. Thermal Manikin Experiment
4.2.1. Environmental Chamber
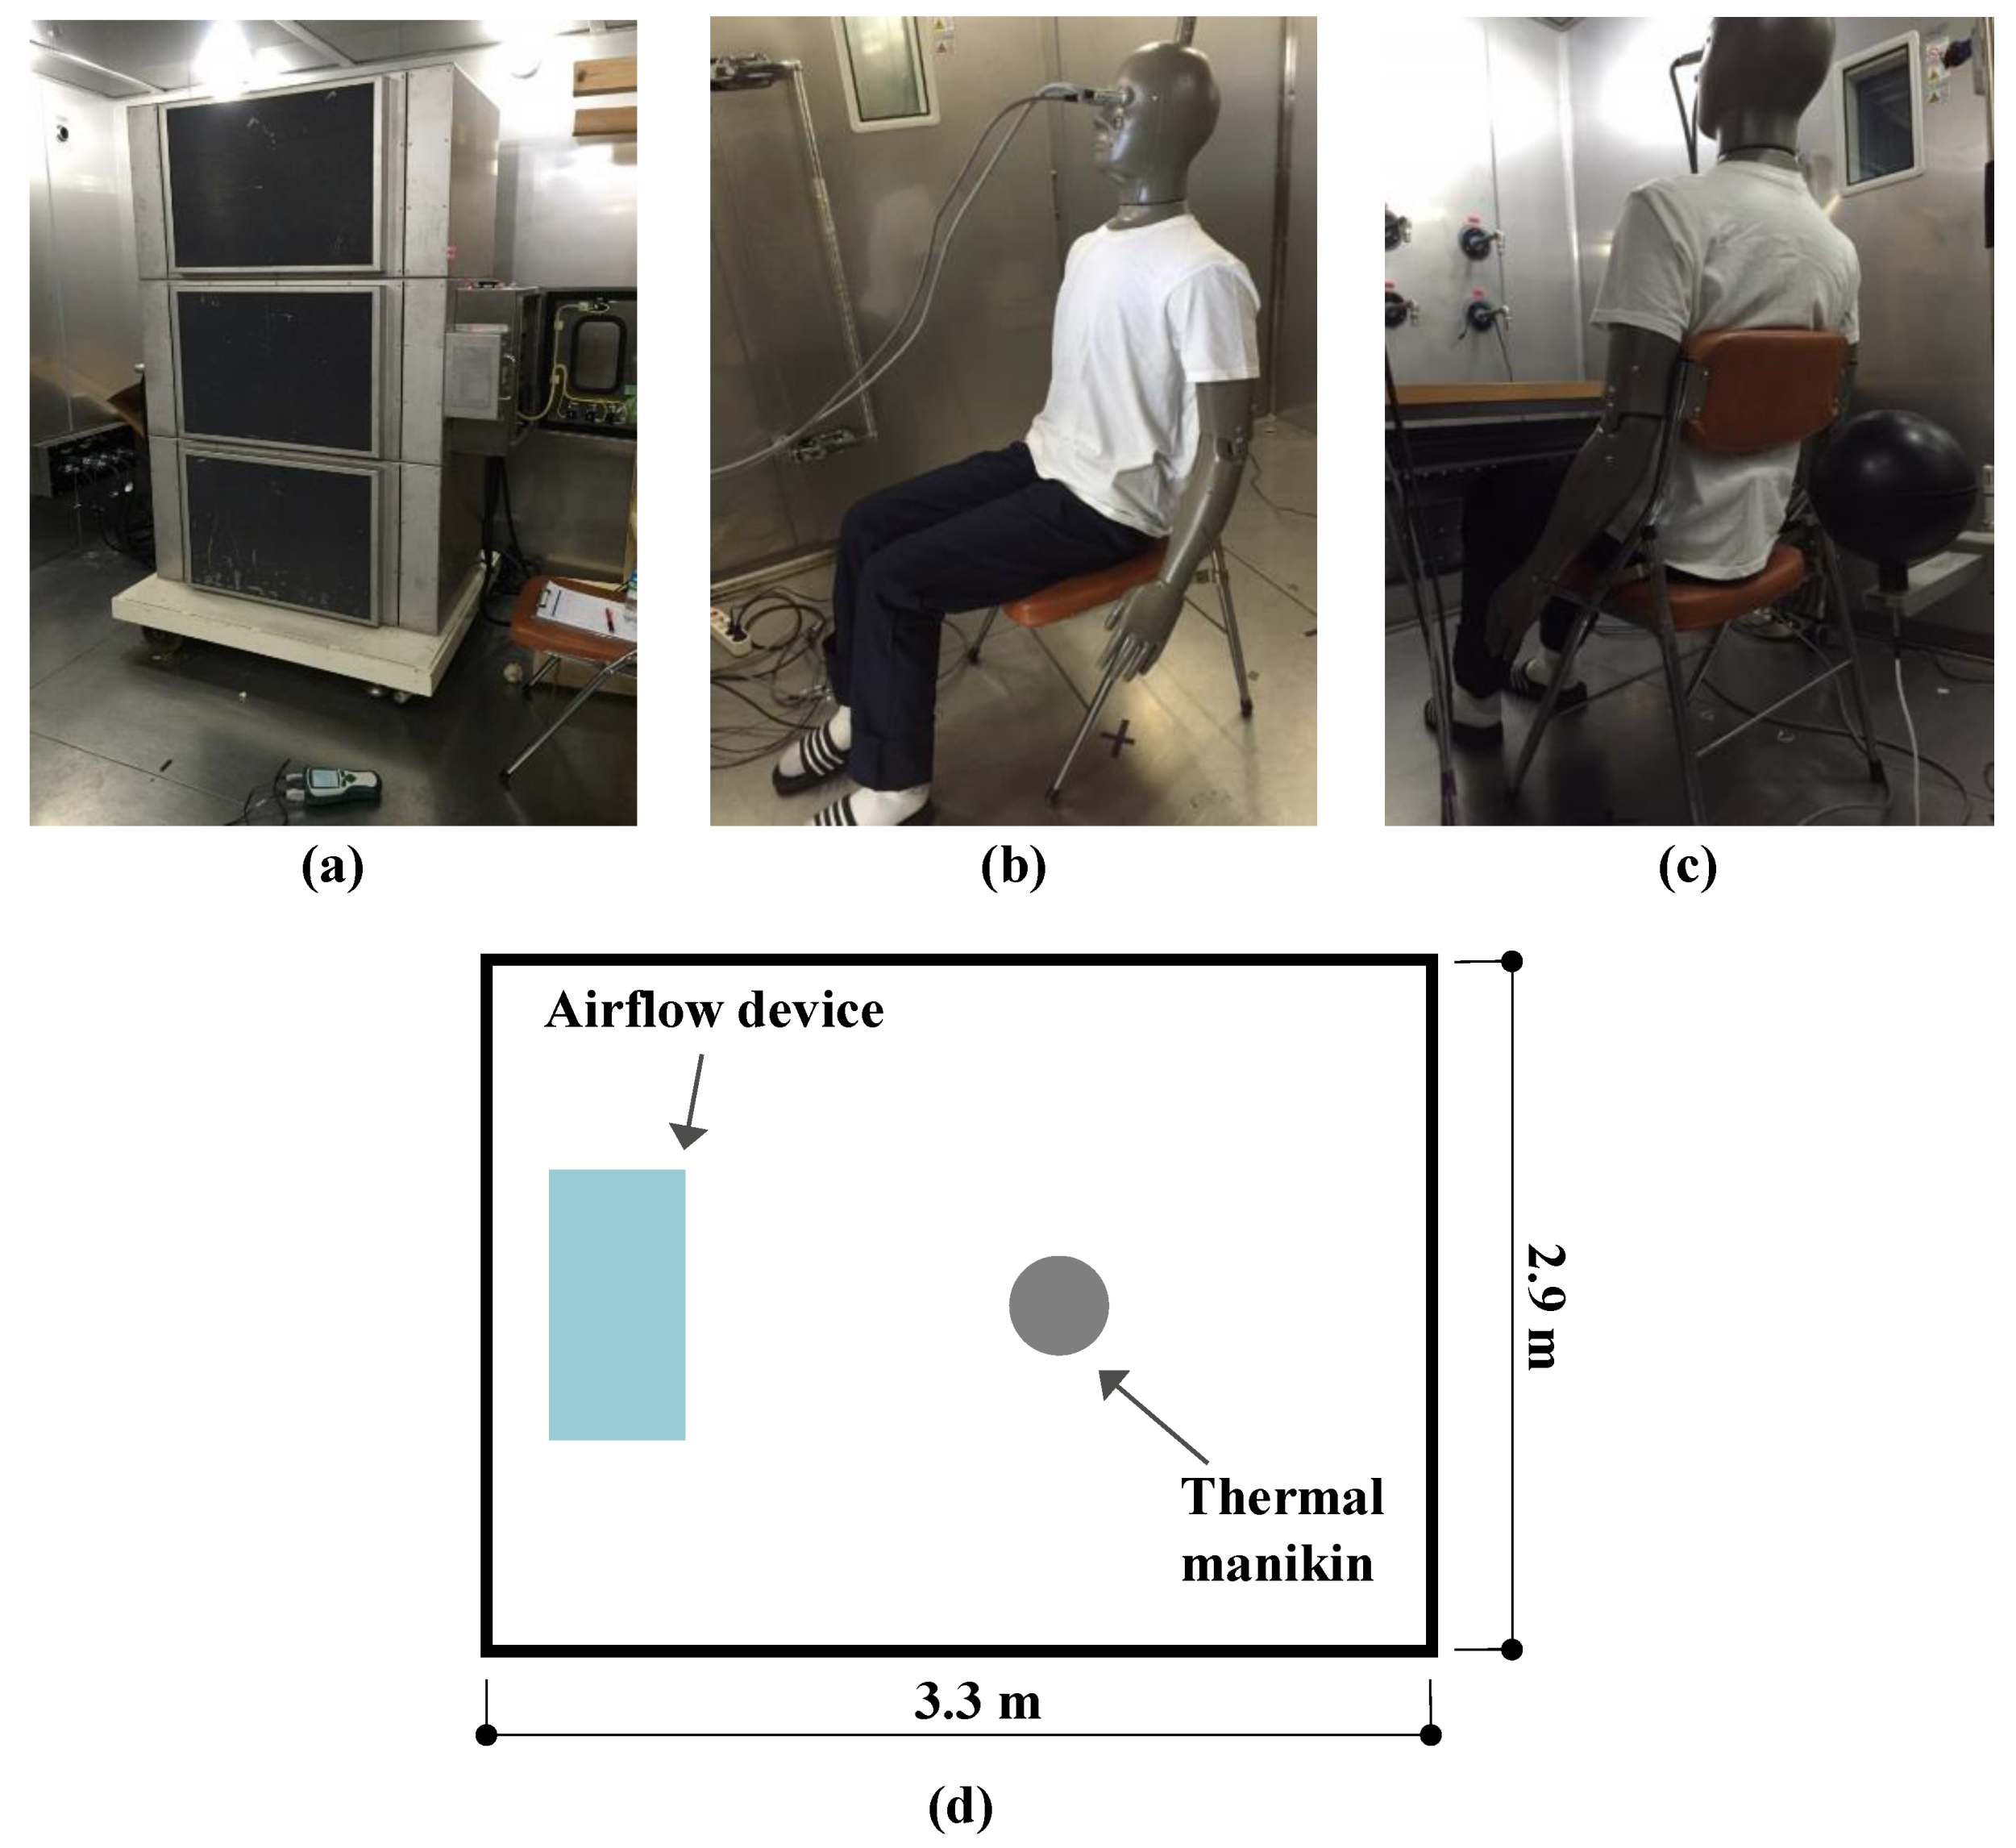
The thermal manikin test was conducted in an environment chamber within the research facility. This chamber constitutes of an airflow device (0.7 m × 0.48 m) with three fans stacked on top of each other as seen in Figure 5a, and a thermal manikin (“Newton”), as seen in Figure 5b,c. The size of the chamber is 3.3 m (L) × 2.9 m (W) × 2.9 m (H) as shown in Figure 5d. The environment control within the chamber is as shown in Table 7.
4.2.2. Environmental Conditions
The temperature conditions inside the chamber were adjusted between five temperatures of 22, 24, 26, 28, and 30 °C, and air velocity mode constituted of four modes, off, low, medium, and high. Experiments were conducted for a total of 20 environment conditions that combined the two. Given the limitations in space, the standing fan was replaced with the airflow device within the chamber. Indoor temperature, relative humidity, and air velocity were kept as the same as what was used for the questionnaire survey. The clothing of the thermal manikin was made to be similar to the instructed clothing for the questionnaire in Figure 2c, as can be seen in Figure 5b,c. Fourteen body segments ( is the body segments), as can be seen in Table 8, were used for the thermal manikin test to measure the heat flux and derive the convective heat transfer coefficient.
4.2.3. Airflow Device
To maintain the same conditions as the questionnaire, the air flow was made to come from the left. The airflow device was calibrated so that the airflow would create the same air velocity as the stand fan from the position of the manikin. Table 9 compares the air velocity of the stand fan and the air velocity of the airflow device in the chamber. Using the air velocity measurements at 0.1, 0.6, and 1.1 m from the ground, root mean square error (RMSE) and mean bias error (MBE) were used to analyze the similarity between the two sets of values. Based on the assessment that the air velocity of the stand fan for the questionnaire was similar to that of the airflow device, the experiments were carried out.
4.3. Experiment Results
4.3.1. Convective Heat Transfer Coefficient
Convective heat transfer coefficient () can be derived from the thermal manikin test. According to a previous study [22], according to the change in air velocity can be derived as in Equation (1)
where is the coefficient of convective heat transfer (W/m2K), is the air velocity (m/s), and and are the coefficients.
value for each body part and indoor temperature conditions were organized by , and the coefficient of determination R2 (see Table 10 [23]).
The hand value shows significant changes according to the adjustments in air velocity. Head and forearm follow values follow with a higher value. On the other hand, value for most of the lower body appears to be relatively less affected by the increase in air velocity.
An interesting aspect in the for different body parts derived through the thermal manikin test is that the opposite side of the body from direct contact with the air flow has a very low R2 value (highlighted in Table 10). That is, the coefficient of convective heat transfer in the body parts opposite to the air flow appeared to have no correlation to the air velocity from the standard point when the fan is in operation. Also, such body parts seems to increase as the air velocity of the fan increase. To look at the value for the whole body, the results are similar to the findings of previous researchers, with an value range of 0.5–0.6. Also, the value appeared to increase as the indoor temperature increased.
4.3.2. Cooling Effect by the Stand Fan
Cooling effect by the stand fan may be expressed as the difference in equivalent temperature () [24]. Here, the equivalent temperature is defined as, “The uniform temperature of the imaginary enclosure with air velocity equal to zero in which a person will exchange the same dry heat by radiation and convection as in the actual non-uniform environment” [25]. Assuming that the before and after test of the thermal manikin test is equivalent to the stand on/off state, the cooling effect () the difference in equivalent temperature are calculated as per Equations (2)–(4).
where is the equivalent temperature difference (°C), is the equivalent temperature when fan is on (°C), is the equivalent temperature when fan is off (°C), is the manikin-based equivalent temperature (°C), is the manikin-based skin temperature (°C), is the sensible heat loss (W/m2), is the coefficient of dry heat transfer (W/m2K), and is the coefficient of radiant heat transfer (W/m2K).
In this study, and used the values derived through the thermal manikin test, was calculated using Equation (1), and was assumed to be the widely accepted value regardless of the position of the human body: 4.7 W/m2K [26]. According to ASHRAE [27], emissivity can be assumed, and explicit solutions for are rarely obtained for clothed subjects due to the difficulties in measuring average clothed body surface temperature. Therefore the value = 4.7 W/m2K has been widely accepted as a reasonable whole-body estimate for general purposes.
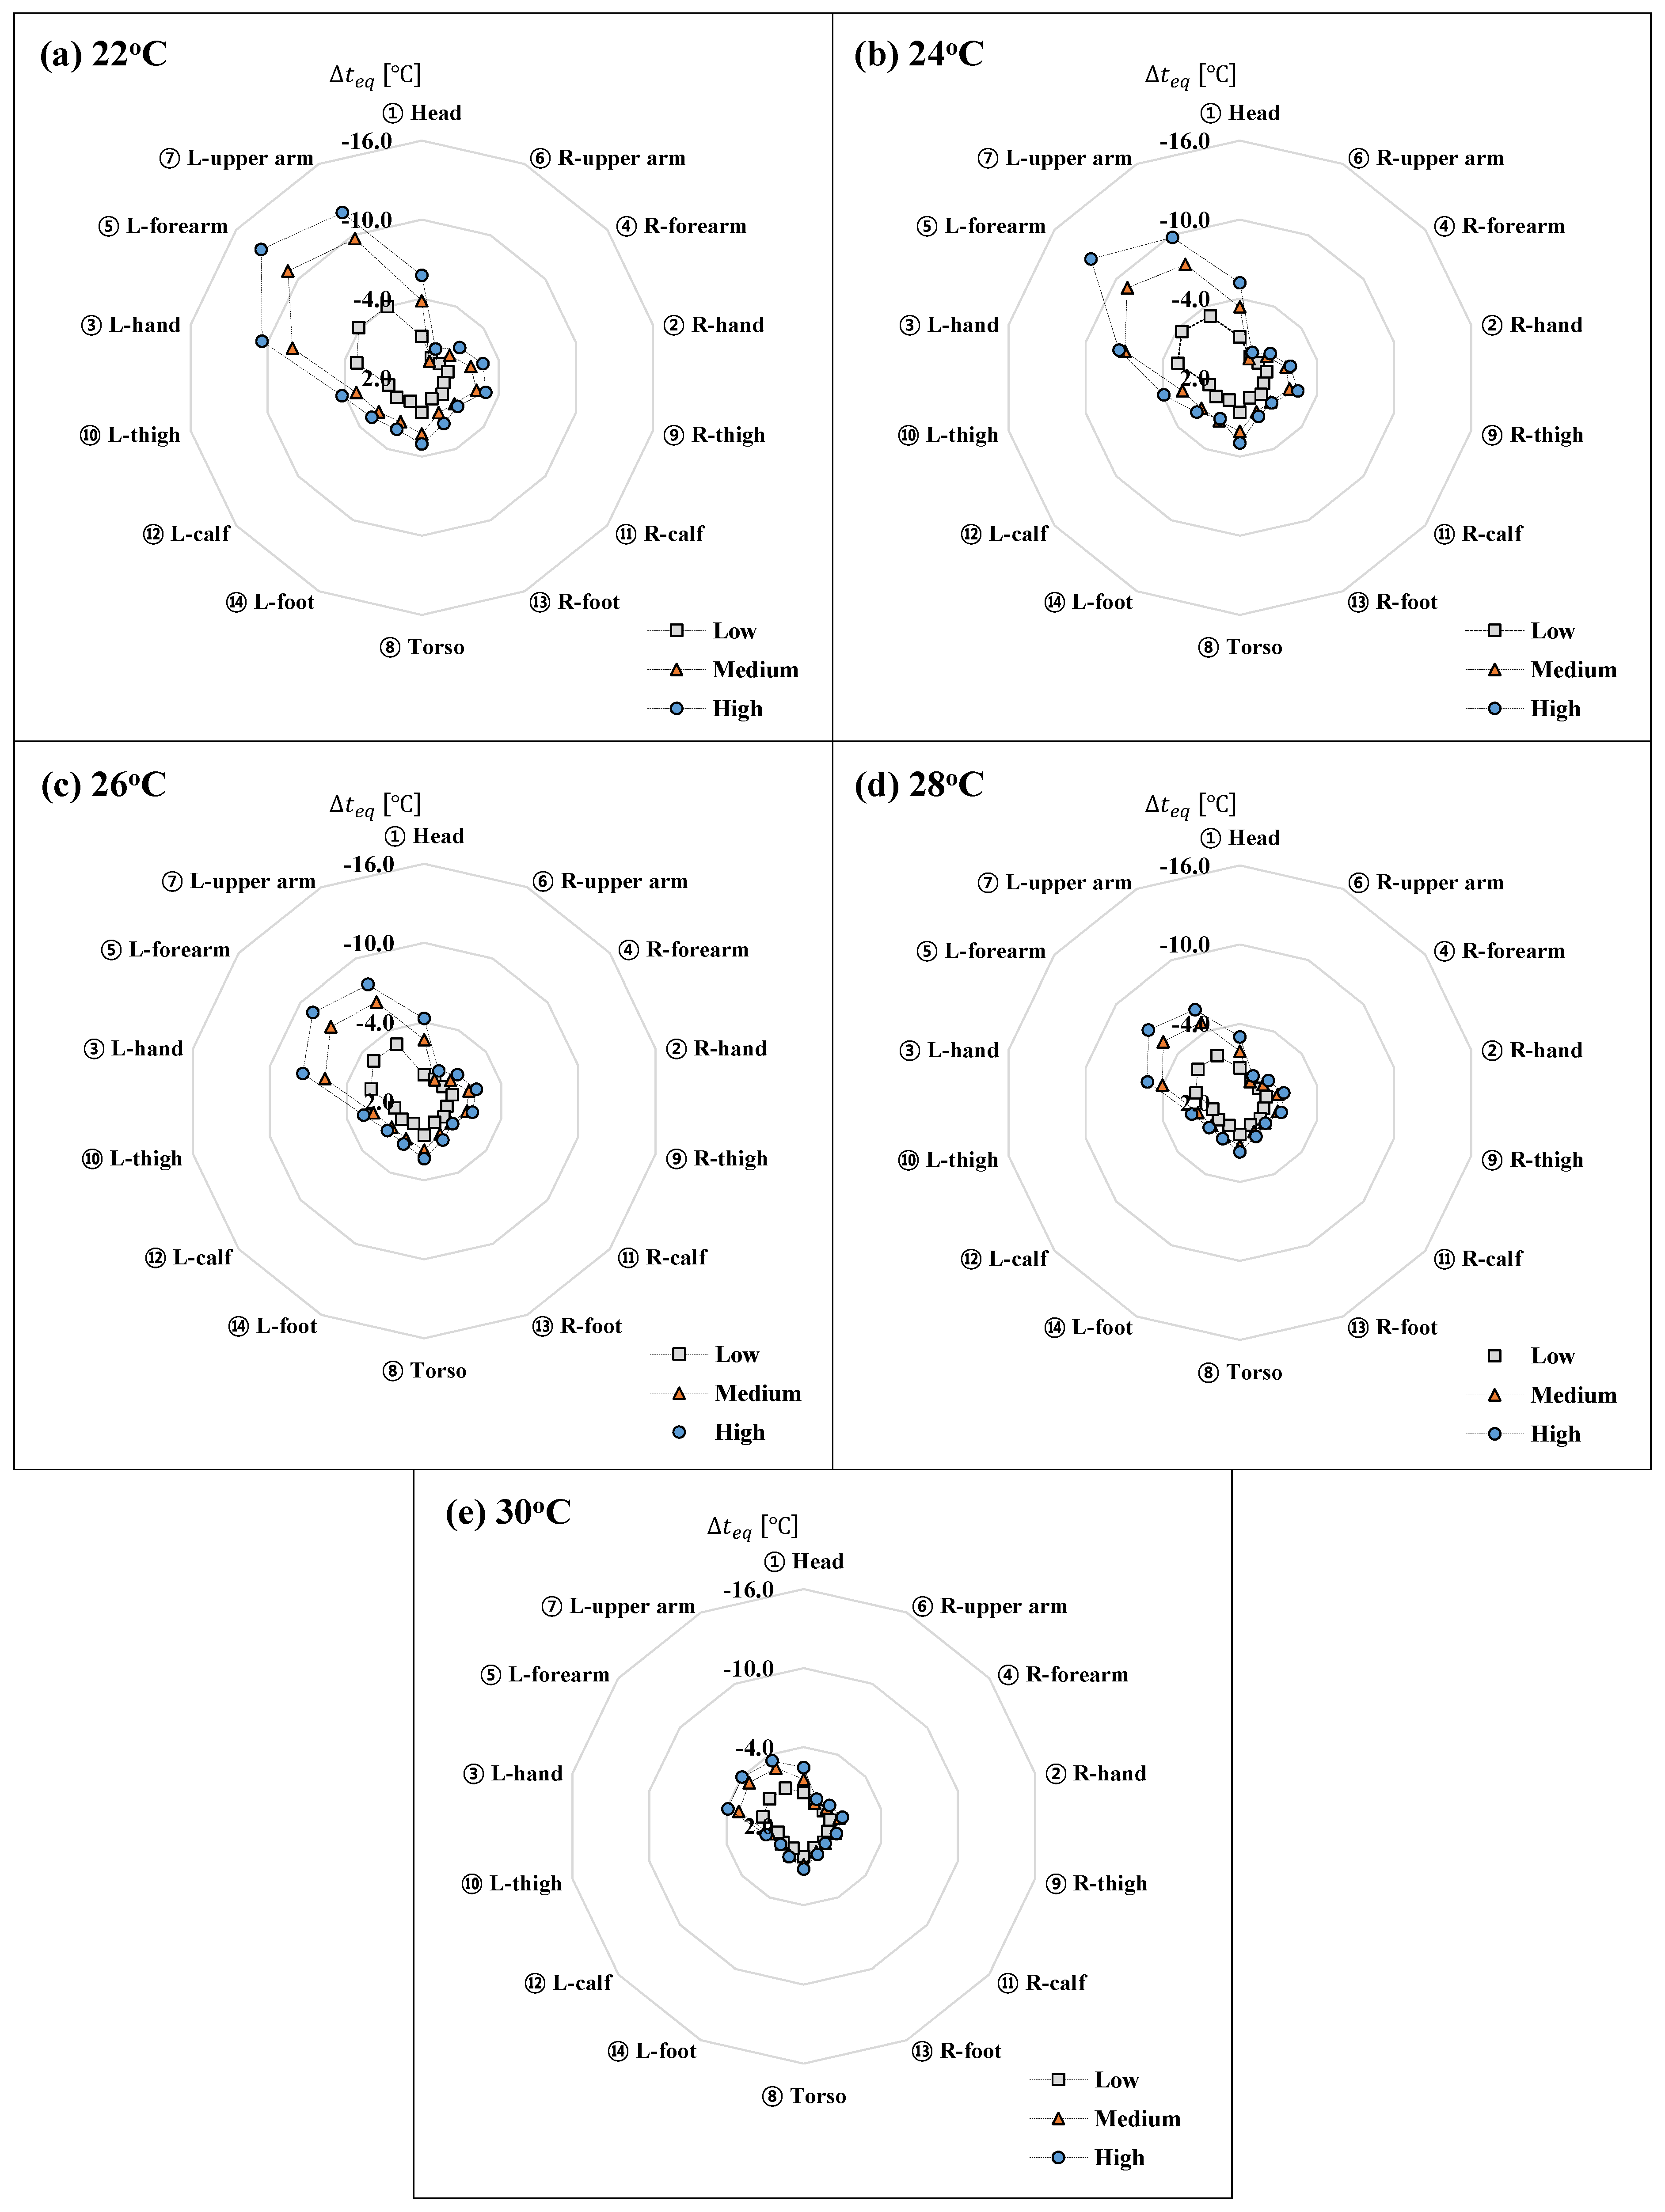
Figure 6 shows the cooling effect on each body part according to air velocity. The lower the indoor temperature and the stronger the fan speed, the more significant the cooling effect. As the airflow comes from the left, the left side of the body displayed a more significant cooling effect than the right side. In particular, the right arm and hand, which is level with the height of the fan, showed the most cooling effect. In the case of the thighs and calves, the left and right did not show much difference and had similar values. In the case of the right arm (especially in the upper right arm covered by clothing), there was little difference in cooling effect between different fan speeds. The cooling effect remained close to 0 °C, showing that airflow mostly did not reach the body part.
Figure 7 is a schematization of the cooling effect in each set temperature for 20 test conditions. This was calculated using Equation (5) to represent the cooling effect according to value, taking into consideration the aggravated value by the surface of the body part. Here, was based on the analysis of the sensitivity of each body segment [23] using the standardized regression coefficient (SRC) equation [28], as can be seen in Table 11.
where is the weighted cooling effect from body surface at indoor set-point temperature () (°C), is the cooling effect on the body segment at indoor set-point temperature () (°C), is the surface of the body segment [m2], is the sensitivity of body segment, is the indoor set-point temperature (i.e., 22, 24, 26, 28, 30) (°C), and is the body segments (i.e., 1 = head, 2 = R-hand, ⋯, 14 = L-foot).
As can be seen in Figure 7, the cooling effect is present for all but Off modes in every indoor set-point temperature. At 30 and 28 °C, the cooling effect of Off, L, M and H modes did not surpass 2 °C. However, H mode of 24 °C had the cooling effect higher than 2 °C, making it cooler than Off mode of 24 °C. Further, M and H mode of 24 °C may be cooler than the Off mode of 22 °C. Overall, the lower the temperature, the higher the cooling effect according to fan mode
5. Discussion
5.1. Comfort Conditions of Stand Fan Use
The above results may be combined to categorize the comfort conditions as seen in Table 12. Thermal sensation (TS) between −2 and 0, thermal comfort (TC) responses of “comfort” (strong comfort + comfort) over 75 %, and TA responses of “acceptable” (strongly acceptable, acceptable) over 75% were regarded as comfort conditions and marked as *. ** indicates that over 50% reported strong comfort, indicating the ideal comfort conditions. The ideal comfort conditions (**) were met at Off and L modes of 24 °C, L and M modes of 26 °C, and M and H modes of 28 °C. * indicates an Off mode of 26 °C, L mode of 28 °C, and H mode of 30 °C, where the subjects felt some heat.
5.2. Cooling Effect of the Stand Fan
The cooling effect results from the thermal manikin test were compared to the questionnaire results. First, the expected sensible indoor temperature that assumes that the indoor temperature decreased from the cooling effect of the stand fan was calculated using the following Equation (6).
where is the expected sensible indoor temperature (°C).
Figure 8 compares the expected sensible indoor temperature and TS for each set temperature. Here, the expected sensible indoor temperature reflects the cooling effect of each fan mode on the indoor temperature, and TS is the average value of the 16 subjects.
As can be seen from ① and ② of Figure 8, the TS values of Off mode at 28 and 26 °C were respectively 0.81 and 0.25. The expected sensible indoor temperature at Off mode of 28 °C turned out to be lower than H mode of 30 °C, but the questionnaire results show that the subjects felt slightly warm. Similarly, the expected sensible indoor temperature at Off mode of 26 °C turned out to be lower than M and H mode of 28 °C, but the questionnaire results showed the subjects felt slightly warm. At 26 and 28 °C, it appears that subjects felt cooler when there was air current compared to when there is not, even if the sensible indoor temperature is low. Such results are connected to the demand for air velocity change appearing as “more” in Off mode of 26 °C, and Off and L modes of 28 °C. However, in situations with indoor temperature such as 30 °C, a smaller air flow was felt to be hotter than none, as can be seen from ③ of Figure 8.
The TS for M mode of 28 °C, L mode of 26 °C, and Off mode of 24 °C were almost identical. This implies that the expected sensible indoor temperature may be different, but what the human body feels is similar.
At low indoor temperature, high velocity created an excessive cooling effect. That is, M and H modes of 26 °C and L, M, and H modes of 24 °C produced a TS below −1. At a very low indoor temperature, the subjects responded that it was very cold regardless of the stand fan.
As previously mentioned, the existing study considers −1~+1 TS to represent comfort, and the expected sensible indoor temperature was calculated to be 24.00–27.66 °C. However, the M and H modes of 26 °C each showed expected sensible indoor temperatures of 24.17 and 23.48 °C, but the TS was lower than −1. Further, H mode of 28 °C and L mode of 24 °C had TS slightly below −1, but was analyzed to be sufficiently acceptable (see Figure 4b).
6. Conclusions and Future Works
This study conducted a comprehensive analysis of the cooling effect of the local air currents from the stand fan. The study consisted of a questionnaire for male and female subjects in their 20s and a thermal manikin test. Comfort conditions for each set indoor temperature were derived. The main results are summarized as follows:
- The stand fan was most effective at M and L modes of 28 °C, Off and L modes of 26 °C, and Off mode of 24 °C. In situations with an indoor temperature of 28 °C, a stand fan would be able to create a sufficient cooling effect.
- It was possible to confirm that the human body feels cooling when airflow is created. However, with a set indoor temperature that is 30 or 22 °C the cooling effect due to airflow may produce different results than expected.
These data will prove useful for generating and operating a cooling strategy. Further, by providing an interpretation of the cooling effect in quantifiable values, it may be possible to use these data for a comparison with the energy use of other cooling systems such as air conditioning and for use as the primary material for assessing the energy consumption rate. Future studies on energy use would not only allow for a suggestion of energy-conserving cooling methods that take comfort conditions into account, but also a more accurate analysis of energy consumption.
Author Contributions
S.-H.M. and Y.K. (Younghoon Kwak) analyzed the results and wrote the full manuscript; Y.K. (Yeonjung Kim) performed the experiments and discussed the results and implications at all stages; J.-H.H. advised on all tasks and double-checked the results and the whole manuscript. All authors proofread the paper.
Acknowledgments
This work was supported by the National Research Foundation of Korea (NRF) grant funded by the Korea government (No. NRF-2017R1A2A2A05001443; and NRF-2019R1C1C1010956).
Conflicts of Interest
The authors declare no conflict of interest.
Abbreviations
| Nomenclature | |
| Surface area of body part (m2) | |
| Coefficient | |
| Coefficient of convective heat transfer (W/m2K) | |
| Coefficient of dry heat transfer (W/m2K) | |
| Coefficient of radiant heat transfer (W/m2 K) | |
| Body segments | |
| Coefficient | |
| R2 | Coefficient of determination |
| Sensitivity of body part | |
| Manikin-based equivalent temperature (°C) | |
| Equivalent temperature when fan is on (°C) | |
| Equivalent temperature when fan is off (°C) | |
| Aggravated cooling effect at indoor set-point temperature () (°C) | |
| Cooling effect for the body part at indoor set-point temperature () (°C) | |
| Manikin-based skin temperature (°C) | |
| Indoor set-point temperature (°C) | |
| Expected sensible temperature (°C) | |
| Sensible heat loss (W/m2) | |
| Air velocity (m/s) | |
| Acronyms and Abbreviations | |
| H | High mode of stand fan |
| L | Low mode of stand fan |
| M | Medium mode of stand fan |
| MBE | Mean bias error |
| PMV | Predictive mean vote |
| RMSE | Root mean square error |
| SRC | Standardized regression coefficient |
| TA | Thermal acceptability |
| TC | Thermal comfort |
| TS | Thermal sensation |
References
- Houghten, F.C.; Gutberlet, C.; Witkowski, E. Draft Temperatures and Velocities in Relation to Skin Temperature and Feeling of Warmth. ASHRAE Trans. 1938, 44, 289–308. [Google Scholar]
- Toftum, J. Air movement—Good or bad? Indoor Air Suppl. 2004, 14, 40–45. [Google Scholar] [CrossRef] [PubMed]
- Konz, S.; Al-Wahab, S.; Gough, H. The Effect of Air Velocity on Thermal Comfort. Proc. Hum. Factors Ergon. Soc. Annu. Meet. 1983, 27, 733–737. [Google Scholar] [CrossRef]
- Hseieh, K. The Effect of Air Velocity on Thermal Comfort with Moderate Activity. Master’s Thesis, Kansas State University, Manhattan, KS, USA, 1985. [Google Scholar]
- Toftum, J.; Nielsen, R. Impact of metabolic rate on human response to air movements during work in cool environments. Int. J. Ind. Ergon. 1996, 18, 307–316. [Google Scholar] [CrossRef]
- ASHRAE. ASHRAE Standard 55-2013, Thermal Environmental Conditions for Human Occupancy; American Society of Heating, Refrigerating and Air-Conditioning Engineers: Atlanta, GA, USA, 2013; p. 31. [Google Scholar]
- Arens, E.; Turner, S.; Zhang, H.; Paliaga, G. Moving air for comfort. ASHRAE J. 2009, 51, 18–28. [Google Scholar]
- Sun, W.; Cheong, K.W.D.; Melikov, A.K. Subjective study of thermal acceptability of novel enhanced displacement ventilation system and implication of occupants’ personal control. Build. Environ. 2012, 57, 49–57. [Google Scholar] [CrossRef]
- Yu, W.; Cheong, K.; Tham, K.; Sekhar, S.; Kosonen, R. Draft sensation study in a space served by displacement ventilation system in the tropics. Proc. Indoor Air 2005, 2005, 239–243. [Google Scholar]
- Zhang, H.; Dai, L.; Xu, G.; Li, Y.; Chen, W.; Tao, W. Studies of air-flow and temperature fields inside a passenger compartment for improving thermal comfort and saving energy. Part II: Simulation results and discussion. Appl. Therm. Eng. 2009, 29, 2028–2036. [Google Scholar] [CrossRef]
- Mao, Y.; Wang, J.; Li, J. Experimental and numerical study of air flow and temperature variations in an electric vehicle cabin during cooling and heating. Appl. Therm. Eng. 2018, 137, 356–367. [Google Scholar] [CrossRef]
- Roghanchi, P.; Kocsis, K.C.; Sunkpal, M. Sensitivity analysis of the effect of airflow velocity on the thermal comfort in underground mines. J. Sustain. Min. 2016, 15, 175–180. [Google Scholar] [CrossRef]
- Yang, B.; Schiavon, S.; Sekhar, C.; Cheong, D.; Tham, K.W.; Nazaroff, W.W. Cooling efficiency of a brushless direct current stand fan. Build. Environ. 2015, 85, 196–204. [Google Scholar] [CrossRef] [Green Version]
- Zhai, Y.; Zhang, H.; Zhang, Y.; Pasut, W.; Arens, E.; Meng, Q. Comfort under personally controlled air movement in warm and humid environments. Build. Environ. 2013, 65, 109–117. [Google Scholar] [CrossRef] [Green Version]
- Ho, S.H.; Rosario, L.; Rahman, M.M. Thermal comfort enhancement by using a ceiling fan. Appl. Therm. Eng. 2009, 29, 1648–1656. [Google Scholar] [CrossRef]
- Fong, M.L.; Lin, Z.; Fong, K.F.; Chow, T.T.; Yao, T. Evaluation of thermal comfort conditions in a classroom with three ventilation methods. Indoor Air 2011, 21, 231–239. [Google Scholar] [CrossRef] [PubMed]
- Lan, L.; Wargocki, P.; Lian, Z. Quantitative measurement of productivity loss due to thermal discomfort. Energy Build. 2011, 43, 1057–1062. [Google Scholar] [CrossRef]
- Niemelä, R.; Hannula, M.; Rautio, S.; Reijula, K.; Railio, J. The effect of air temperature on labour productivity in call centres—A case study. Energy Build. 2002, 34, 759–764. [Google Scholar] [CrossRef]
- Kwak, Y.; Huh, J.-H. Management of cooling energy through building controls for thermal comfort and relative performance in an office building. Sci. Technol. Built Environ. 2019, 25, 139–148. [Google Scholar] [CrossRef]
- Hoof, V. Forty years of Fanger’s model of thermal comfort: Comfort for all? Indoor Air. 2008, 18, 182–201. [Google Scholar] [CrossRef]
- Kim, Y.J. Thermally Comfortable Operating Conditions and the Cooling Effect of a Stand Fan in Summer. Master’s Thesis, University of Seoul, Seoul, Korea, 2016. (In Korean). [Google Scholar]
- Oliveira, A.V.M.; Gaspar, A.R.; Francisco, S.C.; Quintela, D.A. Analysis of natural and forced convection heat losses from a thermal manikin: Comparative assessment of the static and dynamic postures. J. Wind Eng. Ind. Aerodyn. 2014, 132, 66–76. [Google Scholar] [CrossRef]
- Mun, S.-H.; Kim, Y.-J.; Huh, J.-H. Analysis on the Actual Cooling Effect of the Standing Fan: A Comparative Study of Heat Loss and Thermal Comfort for Body Segments. In Proceedings of the 15th IBPSA Conference, San Francisco, CA, USA, 7–9 August 2017; pp. 564–569. [Google Scholar] [CrossRef]
- Schiavon, S.; Melikov, A. Evaluation of the cooling fan efficiency index for a desk fan and a computer fan. 11th Int. J. Biometeorol. 2017, 40, 141–156. [Google Scholar] [CrossRef]
- Nilsson, H.; Holmér, I.; Bohm, M.; Noren, O. Definition and theoretical background of the equivalent temperature. In CABCLI Seminar Dissemination of Results from EQUIV-Project; JTI—Swedish Institute of Agricultural and Environmental Engineering: Florence, Italy, 18–19 November 1999; pp. 31–40. [Google Scholar]
- De Dear, R.J.; Arens, E.; Hui, Z.; Oguro, M. Convective and radiative heat transfer coefficients for individual human body segments. Int. J. Biometeorol. 1997, 40, 141–156. [Google Scholar] [CrossRef] [PubMed] [Green Version]
- ASHRAE. Thermal comfort. In 2013 ASHRAE Handbook-Fundamentals (SI); American Society of Heating, Refrigerating and Air-Conditioning Engineers: Atlanta, GA, USA, 2013; p. 9. [Google Scholar]
- Domínguez-Muñoz, F.; Cejudo-López, J.M.; Carrillo-Andrés, A. Uncertainty in peak cooling load calculations. Energy Build. 2010, 42, 1010–1018. [Google Scholar] [CrossRef]
Figure 1.
Flow chart of the study.

Figure 2.
Thermal comfort questionnaire according to the location of the occupant and the fan. (a) Floor plan of the occupant and the fan; (b) Position of the occupant and the fan; (c) Administration of the thermal comfort questionnaire.
Figure 2.
Thermal comfort questionnaire according to the location of the occupant and the fan. (a) Floor plan of the occupant and the fan; (b) Position of the occupant and the fan; (c) Administration of the thermal comfort questionnaire.

Figure 3.
Questionnaire procedure according to fan mode.

Figure 4.
Percentage of responses to questionnaire. (a) Thermal comfort; (b) Thermal acceptability; (c) Demands on changes to the air velocity.
Figure 4.
Percentage of responses to questionnaire. (a) Thermal comfort; (b) Thermal acceptability; (c) Demands on changes to the air velocity.

Figure 5.
Thermal manikin in the test chamber. (a) Airflow device; (b) Thermal manikin (front); (c) Thermal manikin (back); (d) Plan of the test chamber.
Figure 5.
Thermal manikin in the test chamber. (a) Airflow device; (b) Thermal manikin (front); (c) Thermal manikin (back); (d) Plan of the test chamber.

Figure 6.
Cooling effect () on each body segment according to indoor set-point temperature. (a) 22 °C; (b) 24 °C; (c) 26 °C; (d) 28 °C; (e) 30 °C.
Figure 6.
Cooling effect () on each body segment according to indoor set-point temperature. (a) 22 °C; (b) 24 °C; (c) 26 °C; (d) 28 °C; (e) 30 °C.

Figure 7.
Temperature of weighted cooling effect according to fan mode by each indoor set-point temperature.
Figure 7.
Temperature of weighted cooling effect according to fan mode by each indoor set-point temperature.

Figure 8.
Comparison of expected sensible indoor temperature and thermal sensation according to fan mode by each indoor set-point temperature.
Figure 8.
Comparison of expected sensible indoor temperature and thermal sensation according to fan mode by each indoor set-point temperature.


Table 1.
Specifications of the stand fan.
| Picture of the Model | Product Details | |
|---|---|---|
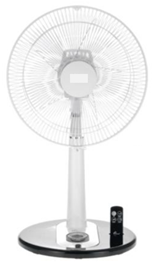 | Model | EFe-492R |
| Air velocity | Levels 1–4 | |
| Electricity consumption | Level 1 (8 W) | |
| Level 2 (33 W) | ||
| Level 3 (39 W) | ||
| Level 4 (45 W) | ||
| Weight | 3.4 kg | |
| Dimensions | 0.40 (L) × 0.35 (W) × 0.70–0.86 (H) m | |
Table 2.
Air velocity according to fan mode.
| Fan Mode | Air Velocity |
|---|---|
| Level 1 (Low mode) | 1.48 m/s |
| Level 2 (Medium mode) | 3.55 m/s |
| Level 3 (High mode) | 4.73 m/s |
Table 3.
Indoor environment conditions for the questionnaire.
| Indoor Temperature (°C) | 22 | 24 | 26 | 28 | 30 |
| Fan mode | Off, Low (L), Medium (M), High (H) | ||||
| Relative humidity (%) | 40–60 | ||||
Table 4.
Physical attributes data of subjects (* standard deviation).
| Sex | Number of Subjects | Age | Height (m) | Weight (kg) |
|---|---|---|---|---|
| Female (F) | 8 | 25 ± 1 * | 158.8 ± 2.7 * | 53.8 ± 7.8 * |
| Male (M) | 8 | 28 ± 2 * | 176.5 ± 3.8 * | 76.9 ± 8.2 * |
| F + M | 16 | 26 ± 2 * | 167.6 ± 9.7 * | 65.3 ± 14.2 * |
Table 5.
Questionnaire contents and possible responses.
| Item | Content | Possible Responses |
|---|---|---|
| 1 | Thermal sensation (TS) | · 7-point scale (−3, −2, −1, 0, 1, 2, 3) |
| 2 | Thermal comfort (TC) | · Strongly comfort |
| · Comfort | ||
| · Discomfort | ||
| · Strongly discomfort | ||
| 3 | Thermal acceptability (TA) | · Strongly acceptability |
| · Acceptability | ||
| · Unacceptability | ||
| · Strongly unacceptability | ||
| 4 | Demands on changes to the air velocity | · More |
| · No | ||
| · Less |
Table 6.
Average TS according to fan mode and proportion of “Comfort” responses.
| Indoor Temperature (°C) | Fan Mode | Average TS | Responses within −1~1 Range (%) | Responses within −2~0 Range (%) |
|---|---|---|---|---|
| 30 | Off | 2.19 | 20 | 20 |
| L | 2.31 | 30 | 30 | |
| M | 0.94 | 80 | 80 | |
| H | −0.19 | 90 | 90 | |
| 28 | Off | 0.81 | 58 | 58 |
| L | 0.25 | 83 | 83 | |
| M | −0.63 | 92 | 100 | |
| H | −1.00 | 83 | 100 | |
| 26 | Off | 0.25 | 92 | 92 |
| L | −0.69 | 100 | 100 | |
| M | −1.31 | 58 | 100 | |
| H | −1.88 | 17 | 75 | |
| 24 | Off | −0.63 | 75 | 100 |
| L | −1.31 | 58 | 92 | |
| M | −2.31 | 17 | 67 | |
| H | −2.75 | 8 | 25 | |
| 22 | Off | −1.94 | 25 | 67 |
| L | −2.50 | 17 | 33 | |
| M | −3.00 | 0 | 0 | |
| H | −3.00 | 0 | 0 |
Table 7.
Environment control inside the chamber.
| Chamber Environment Control | Specification |
|---|---|
| Airflow device | 0.6–6 m/s |
| Temperature | −40–80 °C |
| Humidity | 20–95% |
Table 8.
Body segments for measurement points.
| Thermal Manikin | i | Segment |
|---|---|---|
 | ① | Head |
| ② | R(right)-hand | |
| ③ | L(left)-hand | |
| ④ | R-forearm | |
| ⑤ | L-forearm | |
| ⑥ | R-upper arm | |
| ⑦ | L-upper arm | |
| ⑧ | Torso | |
| ⑨ | R-thigh | |
| ⑩ | L-thigh | |
| ⑪ | R-calf | |
| ⑫ | L-calf | |
| ⑬ | R-foot | |
| ⑭ | L-foot |
Table 9.
Comparison of air velocity between the stand fan and the airflow device. RMSE: root mean square error; MBE: mean bias error.
Table 9.
Comparison of air velocity between the stand fan and the airflow device. RMSE: root mean square error; MBE: mean bias error.
| Height [m] | Off (m/s) | Low (m/s]) | Medium (m/s) | High (m/s) | ||||
|---|---|---|---|---|---|---|---|---|
| Survey | Manikin | Survey | Manikin | Survey | Manikin | Survey | Manikin | |
| 0.1 | 0.05 | 0.16 | 0.10 | 0.22 | 0.22 | 0.22 | 0.24 | 0.22 |
| 0.6 | 0.07 | 0.19 | 0.48 | 0.41 | 1.57 | 1.44 | 1.98 | 1.87 |
| 1.1 | 0.04 | 0.17 | 0.16 | 0.31 | 0.27 | 0.37 | 0.32 | 0.45 |
| Average | 0.05 | 0.17 | 0.25 | 0.31 | 0.69 | 0.68 | 0.85 | 0.85 |
| RMSE | 0.10 | 0.11 | 0.09 | 0.10 | ||||
| MBE | 0.10 | 0.10 | 0.08 | 0.09 | ||||
Table 10.
Coefficient of convective heat transfer for each body segment according to indoor temperature (Highlight cells imply little correlation between air velocity increase and [23].
Table 10.
Coefficient of convective heat transfer for each body segment according to indoor temperature (Highlight cells imply little correlation between air velocity increase and [23].
| i | 22 °C | 24 °C | 26 °C | 28 °C | 30 °C | ||||||||||
|---|---|---|---|---|---|---|---|---|---|---|---|---|---|---|---|
| R2 | R2 | R2 | R2 | R2 | |||||||||||
| ① | 7.47 | 0.37 | 0.93 | 7.56 | 0.39 | 0.94 | 7.28 | 0.40 | 0.78 | 7.80 | 0.37 | 0.94 | 8.06 | 0.38 | 0.94 |
| ② | 9.13 | 0.21 | 0.79 | 9.19 | 0.19 | 0.79 | 9.25 | 0.23 | 0.85 | 9.41 | 0.22 | 0.80 | 9.84 | 0.22 | 0.81 |
| ③ | 9.61 | 0.60 | 0.98 | 9.97 | 0.55 | 0.97 | 9.87 | 0.62 | 0.98 | 10.21 | 0.60 | 0.97 | 11.05 | 0.61 | 0.98 |
| ④ | 6.83 | 0.16 | 0.61 | 7.05 | 0.12 | 0.60 | 7.20 | 0.18 | 0.63 | 7.53 | 0.14 | 0.51 | 8.11 | 0.16 | 0.58 |
| ⑤ | 5.10 | 0.94 | 0.99 | 5.20 | 0.97 | 0.99 | 5.20 | 0.94 | 0.99 | 5.26 | 0.95 | 0.99 | 5.84 | 0.92 | 0.99 |
| ⑥ | 4.71 | 0.02 | 0.00 | 4.78 | 0.01 | 0.01 | 4.92 | 0.10 | 0.20 | 5.01 | 0.05 | 0.07 | 5.38 | 0.10 | 0.23 |
| ⑦ | 2.52 | 1.44 | 0.99 | 2.82 | 1.38 | 0.99 | 2.66 | 1.44 | 0.99 | 2.62 | 1.45 | 0.99 | 3.04 | 1.40 | 0.99 |
| ⑧ | 0.60 | 0.90 | 0.96 | 0.61 | 0.96 | 0.97 | 0.74 | 0.87 | 0.97 | 0.83 | 0.81 | 0.96 | 1.20 | 0.66 | 0.96 |
| ⑨ | 1.21 | 0.85 | 0.67 | 1.24 | 0.85 | 0.70 | 1.28 | 0.81 | 0.62 | 1.08 | 0.88 | 0.62 | 0.89 | 0.87 | 0.50 |
| ⑩ | 1.64 | 0.95 | 0.91 | 1.64 | 1.00 | 0.89 | 1.47 | 1.01 | 0.89 | 1.25 | 1.04 | 0.85 | 0.89 | 1.14 | 0.79 |
| ⑪ | 1.41 | 0.61 | 0.76 | 1.55 | 0.57 | 0.79 | 1.82 | 0.51 | 0.66 | 2.02 | 0.46 | 0.69 | 3.75 | 0.24 | 0.43 |
| ⑫ | 1.57 | 0.90 | 0.91 | 1.76 | 0.85 | 0.90 | 1.94 | 0.81 | 0.87 | 2.15 | 0.74 | 0.83 | 4.22 | 0.48 | 0.75 |
| ⑬ | 3.27 | 0.22 | 0.67 | 3.52 | 0.19 | 0.60 | 3.58 | 0.23 | 0.64 | 4.05 | 0.19 | 0.63 | 4.79 | 0.13 | 0.44 |
| ⑭ | 3.12 | 0.30 | 0.77 | 3.44 | 0.25 | 0.67 | 3.49 | 0.29 | 0.71 | 3.91 | 0.25 | 0.71 | 4.77 | 0.19 | 0.61 |
| Avrage | 2.68 | 0.62 | 0.92 | 2.77 | 0.62 | 0.93 | 2.83 | 0.62 | 0.91 | 2.95 | 0.59 | 0.91 | 3.49 | 0.54 | 0.90 |
Table 11.
Standardized regression coefficients for each body segment [23].
Table 11.
Standardized regression coefficients for each body segment [23].
| I | Segment | Standardized Regression Coefficients |
|---|---|---|
| ① | Head | 0.93 |
| ② | R(right)-hand | 0.86 |
| ③ | L(left)-hand | 1.00 |
| ④ | R-forearm | 1.00 |
| ⑤ | L-forearm | 0.98 |
| ⑥ | R-upper arm | 0.87 |
| ⑦ | L-upper arm | 0.93 |
| ⑧ | Torso | 0.90 |
| ⑨ | R-thigh | 0.89 |
| ⑩ | L-thigh | 0.88 |
| ⑪ | R-calf | 0.89 |
| ⑫ | L-calf | 0.86 |
| ⑬ | R-foot | 0.95 |
| ⑭ | L-foot | 0.97 |
Table 12.
Selection of fan mode for optimal thermal comfort condition.
| Indoor Set-Point Temperature (°C) | Fan Mode | Thermal Sensation (TS) | Thermal Comfort (TC; %) | Strongly Acceptable + Acceptable (%) | Comfort Conditions of Fan Use | ||
|---|---|---|---|---|---|---|---|
| Comfort | Strong Comfort | Total | |||||
| 30 | Off | 2.19 | 19 | 0 | 19 | 19 | |
| L | 2.31 | 13 | 0 | 13 | 19 | ||
| M | 0.94 | 38 | 13 | 50 | 50 | ||
| H | −0.19 | 56 | 19 | 75 | 75 | * | |
| 28 | Off | 0.81 | 31 | 13 | 44 | 44 | |
| L | 0.25 | 56 | 19 | 75 | 75 | * | |
| M | −0.63 | 38 | 63 | 100 | 100 | ** | |
| H | −1.00 | 38 | 56 | 94 | 100 | ** | |
| 26 | Off | 0.25 | 69 | 19 | 88 | 88 | * |
| L | −0.69 | 38 | 50 | 88 | 94 | ** | |
| M | −1.31 | 31 | 69 | 100 | 100 | ** | |
| H | −1.88 | 25 | 44 | 69 | 75 | ||
| 24 | Off | −0.63 | 25 | 75 | 100 | 100 | ** |
| L | −1.31 | 6 | 75 | 81 | 81 | ** | |
| M | −2.31 | 38 | 6 | 44 | 63 | ||
| H | −2.75 | 13 | 6 | 19 | 31 | ||
| 22 | Off | −1.94 | 31 | 44 | 75 | 69 | |
| L | −2.50 | 19 | 19 | 38 | 44 | ||
| M | −3.00 | 0 | 6 | 6 | 13 | ||
| H | −3.00 | 6 | 0 | 6 | 13 | ||
© 2019 by the authors. Licensee MDPI, Basel, Switzerland. This article is an open access article distributed under the terms and conditions of the Creative Commons Attribution (CC BY) license (http://creativecommons.org/licenses/by/4.0/).
Share and Cite
MDPI and ACS Style
Mun, S.-H.; Kwak, Y.; Kim, Y.; Huh, J.-H. A Comprehensive Thermal Comfort Analysis of the Cooling Effect of the Stand Fan Using Questionnaires and a Thermal Manikin. Sustainability 2019, 11, 5091. https://doi.org/10.3390/su11185091
AMA Style
Mun S-H, Kwak Y, Kim Y, Huh J-H. A Comprehensive Thermal Comfort Analysis of the Cooling Effect of the Stand Fan Using Questionnaires and a Thermal Manikin. Sustainability. 2019; 11(18):5091. https://doi.org/10.3390/su11185091
Chicago/Turabian StyleMun, Sun-Hye, Younghoon Kwak, Yeonjung Kim, and Jung-Ho Huh. 2019. "A Comprehensive Thermal Comfort Analysis of the Cooling Effect of the Stand Fan Using Questionnaires and a Thermal Manikin" Sustainability 11, no. 18: 5091. https://doi.org/10.3390/su11185091
Note that from the first issue of 2016, this journal uses article numbers instead of page numbers. See further details here.