1. Introduction
Cleaner production (CP) is one of the environmental tools used to address sustainability challenges. It may be defined as the continuous application of an integrated preventive strategy to processes, products, and services in order to increase efficiency in the use of materials and energy while reducing environmental pollution [
1,
2]. Since its introduction, CP has brought environmental gains and cost reductions to large intensive industries [
3], achieving recognition from supranational entities such as United Nations Environmental Program (UNEP), who considers CP as one of their supportive activities and programs [
4]. CP can be used as a way to implement the industrial-ecology approach on a smaller scale: CP is more focused on reducing risk and material and energy consumption, as well as preventing pollution in a specific production system [
5].
CP has the additional advantage of highlighting areas of improvement in material and energy consumption that can be used in combination with other tools aimed at improving environmental gains, such as Ecodesign, which is used to obtain higher quality products by choosing alternative materials with less environmental impacts, re-designed processes, and adequate final disposal of products’ components [
6]. Another characteristic of CP is its suitability for small- and medium-sized enterprises, owing to the relatively low cost of implementation [
7]. As a result, CP has been used to improve environmental performance in production systems, with generally good results in a range of successful case studies [
1], demonstrating not only the energy and material savings accrued from the use of CP, but also the financial savings in the development of more sustainable products.
Environmental performance can influence the competitiveness of a product. Therefore, a variety of companies are now looking to re-evaluate the environmental performance of their products [
8] by implementing environmental approaches and programs. However, environmental performance can yield either positive or negative outputs when examined within a broader context. Sometimes, enterprises pursuing technological innovation can obtain contradictory results in environmental performance. Some authors affirmed that even the pursuit of environmental innovation could lead to undesirable results on environmental performance [
9] because of the complexity of factors involved during the life cycle of the product. Therefore, it is necessary to analyze the relationship between environmental tools—such as CP—and broader environmental approaches, methods, and tools—such as life cycle assessment (LCA)—in order to make them more effective [
10]. The notion of tradeoff becomes relevant here because it is often challenging to obtain positive environmental performance in all aspects when redesigning a product, process, or service.
Tradeoff relates to situations when compromise is required, such as when sacrificing one element or area to obtain benefits in another area [
11]. Such situations are sometimes unavoidable, but as their presence might be foreseeable, they may also be handled with various methods and tools to enhance or reassess the results obtained while using environmental programs like CP. Several researchers have encountered this situation in their analysis, which is a sign that despite that several Ecodesign tools provide some support in tradeoff situations, not all of them support a robust qualitative and quantitative approach. Researchers usually consider several strategies ranging from the use of Ecodesign checklists to more sophisticated tools such as Ecodesign scenarios [
12], impact and probability Matrix [
13], or tradeoff significance methods based on probability distribution [
14], among others. Although Ecodesign tools are designed to be useful and straightforward to support decision making, they are more effective when taking a full life-cycle perspective [
11].
One of the most used tools to assess environmental impacts from a systematic point of view, including the cradle to grave approach, is LCA. It is a structured and comprehensive method [
15], based on an international standardized framework [
13,
14,
15,
16], with a holistic approach used to assess environmental impacts [
17,
18,
19,
20]. It is precisely because of its systemic and rigorous technical application that it is one of the preferred assessment methods [
21], used by an increasing number of scientists, academics, and practitioners.
However, LCA and CP are usually seen as environmental tools that usually give contradicting results.
Figure 1 lists some characteristics of both tools, which can be perceived as advantages or disadvantages depending on the point of view of a practitioner or scientist, and the capacity of a company producing resources. If an assessment is sought in a company with limited resources, and there is no staff with experience in LCA, CP may be considered a better option. On the other hand, if the practitioner has enough experience in LCA and the company has enough resources, CP may be considered unnecessary owing to its apparent lack of technical or scientific rigor, in addition to its limited scope.
This study intends to address the following questions: Do CP and LCA represent opposite points of view when attempting to assess the sustainability of a product system? What criteria should small or medium enterprises use to implement LCA to enhance or complement a CP program? How can small and medium enterprises with limited financial resources approach the results of CP programs after implementing any impact assessments such as LCA? These questions gain significant relevance when enterprises, despite their size and financial constraint, commit to improving the environmental performance of their products.
2. Materials and Methods
2.1. Previous CP Results and Main Achievements
This study represents the second phase of an academic project carried out at a small wood industry located in Brazil, in the metropolitan region of Salvador Bahia. The main source of material for that company was located in the city of Eunápolis, 651 km away from Salvador de Bahia. The main product being produced at that time was a model of a wooden chair, mostly made of bonded boards of Eucalyptus
urophylla. The first phase of the project, carried out in 2017, consisted of the implementation of a CP program aimed to increase the sustainability of that particular production. The CP program did not include any environmental impact assessment nor LCA, because of limitations of time and resources, but, as stated by Gutierrez et al. [
7], LCA was among the recommendations. As a result, an LCA study was implemented to assess the environmental impacts of the re-designed model—already being produced by that time—with the basic model.
The CP program followed the Cleaner Production Program developed by the United Nations Industrial Development Organization (UNIDO) / United Nations Environment Programme (UNEP) and adapted by the National Center for Clean Technologies (CNTL) in Brazil. A schematic diagram of such implementation is presented in
Figure 2.
The planning and organization of the CP program included administrative steps to organize the cleaner production team and to set responsibilities to be distributed among the administrative and operative workforce. The pre-evaluation stage consisted of the selection of the product or process to be analyzed. The eucalyptus chair was then selected as the target-product, mainly owing to its high production volume. That eucalyptus chair was also the preferred chair used in different shopping centers in the metropolitan area of Salvador Bahia.
The evaluation process represented the measure of mass and energy balances related to the production process. That included the direct measure, quantification, and validation through material flow analysis of the energy, water, and materials being used to produce the model. After that evaluation, a feasibility study was carried out, applying eco-design principles to reduce waste and materials at the source of every process needed to complete the product. Once a new design was proposed and approved to production, a report expressing these improvements was issued.
The changes in the new design included the elimination of parts that provided redundant support, redesigning the manufacturing process of the biggest parts to reduce material consumption, and finally changing the material of the seat from bonded eucalyptus to a plywood seat with a more efficient production process. The differences between the basic model and the redesigned one are presented in
Figure 3.
The increase in the efficiency of resources included reductions in both material and energy, as indicated in
Table 1 and
Table 2.
These results represented the entry point of discussion between the use of CP and the use of LCA. Up to that moment, all results of the CP program were considered as environmental gains that were aligned with the objectives of the program. They represented savings in raw materials, waste production, and energy consumption (direct electricity consumed by the equipment for the re-designed model production). The change of the material of the seat (i.e., the use of plywood planks instead of bonded eucalyptus boards) was one of the changes that accounted for the higher gains in material reduction and waste generation. The CP team, considering the results, were willing to extend the CP principles to other products, but were also willing to assess the environmental gains with a scientific tool such as LCA, following the recommendation given and published by the authors of [
7].
2.2. Goal and Scope
The objective of the study was to perform a comparative LCA between the previous model of the eucalyptus chair and the new design that was developed following the recommendations of the CP program. As the availability of data and financial reports was limited, this study is considered a basic study without full ISO compliance.
Regarding the accuracy and completeness of the data, the study included measured data from the productive process of the models previously collected on the CP program (weight of the parts and residues, energy consumption per machinery, and waste produced at every manufacturing stage). Data inconsistencies were complemented by mass and energy balances [
7]. Regarding the rest of the stages needed for the Life Cycle Inventory (LCI), it was necessary to adapt data from specialized literature and complete the gaps with database values or estimated values based on formulas or distances. As a result, the LCI included the previous inventory data from the CP program, as well as new data estimated or calculated. This was the case for the seedling production processes, forest maintenance, harvesting process, lumber mill process, drying process, transports, product use, and final disposition scenario.
Some LCA results were also compared with reported values from the literature as reference. A material cutoff criterion was taken in order to dismiss those materials accounting for less than 1% of the materials required to produce the wooden chair. As for the assessment comparison methods, the ILCD 2011 midpoint (ILCD stands for International Reference Life Cycle Data System, developed by the Joint Research Center (JRN) of the Institute for Environment and Sustainability of the European Commission.) method and cumulative energy demand method were selected because of their diverse characterization and relevance.
Although the Ecoinvent 3.4 database included information about eucalyptus products, it was considered that specific data would be needed in order to properly assess the impacts in this case. The reasoning behind that was that inventory values from eucalyptus wood in the database could be significantly different from the ones of the Brazilian wood industry, mostly because of high differences in edaphoclimatic conditions, wood productivity, harvesting technology, national electrical grid, and average distances between the planted forest, sawmills, production facilities, and municipal landfills. As a result, it was decided that the best approach would be having a cradle to grave system considering specific Brazilian conditions when possible.
Figure 4 presents the product system boundaries and the reference flux to produce the basic model. The same procedure was carried out to represent the product system for the redesigned model, whose differences were basically at the amount of wood and energy required at the manufacturing process, incorporating the new material (plywood).
The scope included modeling the forest maintenance process (considering 20 years of land occupation from former pasturelands transformed to eucalyptus planted forest) and incorporating specific conditions for the Brazilian harvesting, lumber mill, drying, manufacturing, product use, and final disposal at the municipal landfill.
The functional unit was chosen from a utility point of view rather than a material point of view (units produced or material amount), as it is not recommended to make a direct comparison between mere products [
22], but rather to compare the similar service they are intended to fulfill as functional units. As the specific wooden chair was designed to serve for 12 h per day, during a minimum average of three years before planned obsolescence (i.e., prearranged reform of the food court, taking place every three years), an equivalent service span life was calculated. The functional unit was defined as 12,600 h in continuous service, considering 350 service days for the shopping center, and that both chairs can serve those years before being discharged. As a result, the values presented in
Figure 4 are expressed in equivalences to produce one unit of the basic model.
2.3. Life Cycle Inventory
Life cycle inventory included first-hand data collected at the host enterprise during the CP program implemented; secondary data adapted from previous studies related to eucalyptus plantations in Salvador Bahia, Brazil [
23]; and complementary data adapted from other specialized literature.
This study declares that allocation had to be included at some steps of the life cycle modeling because other wooden co-products such as shavings, sawdust, and firework are also generated at large scale at the lumber mill and manufacturing facilities, but their final destination is not part of the scope of this study. Therefore, their material flows and environmental contributions were considered using mass allocation distribution. In order to assess the better results, an iterative process took place during the LCA, in order to identify gaps and assure the accuracy of results. SimaPro
® by PRé Consultants was the specialized software used to list the inventory for the different stages of the production system for the basic model and the redesigned model. The inventory list of the different materials at the different stages of the production system is included in the
supplementary material from Table S1 to Table S9.
2.4. Life Cycle Impact Assessment
In order to have a comprehensive set of impact, ILCD 2011 midpoint was selected as the evaluation impact method, to assess global warming potential, human toxicity, eutrophication, land use, and water depletion, among others. In addition, cumulative energy demand was selected as the assessment method to report the total energy impact of each product. SimaPro
® was again used to run the impact assessments. The selection of those methods was to allow a broader discussion and better visualization of the tradeoffs among the products evaluated. This study declares that normalization (normalization, as defined by ISO 14044 standard, is a process to calculate the magnitude of the results of impact category indicator relative to an external value in order to bring all the results on the same scale) was used during the impact analysis. The limitations of this procedure are recognized, and as some authors have stated in different publications, external normalized results may lead to biases where freshwater ecotoxicity, human toxicity, and marine ecotoxicity are commonly among the highest impact categories [
24]. As stated in the goal and scope, this study is not full ISO-compliant. ISO 14040 and 14044 standards support normalization, considering it an optional step that allows expressing results using a common reference [
17], but the interpretation should take into account the possible bias that this procedure includes. Nevertheless, their use is not restricted [
16,
24], and normalization can still provide valuable insight [
15], as the objective of the study is not to establish conclusive final values on every impact category, but rather to present decision support, especially in the combined use of CP and LCA. The comparative Life Cycle Impact Assessment (LCIA) is a stage that would be addressed according to the availability of resources that may go from limited software capabilities—such as this study—and full capabilities of numerical analysis tools that include uncertainty analysis or Monte Carlo simulation for scenario analysis.
2.5. Interpretation
The interpretation of the results had to go beyond a descriptive-comparative LCA, intended to select the best option between a set of dissimilar alternatives [
14]. Owing to a limitation on software capabilities, the interpretation proposed an alternative path to deal with the tradeoffs proposing a flowchart to evaluate the situation in order to take the corresponding action that may include the use of more specific tradeoff analysis tools.
Initially, individual results for LCIA were calculated in order to assess their environmental impacts while contrasting some results with the literature. After that, a normalization procedure was carried out to identify the higher normalized impact category among the results of each product. This procedure provided valuable insight regarding the magnitude of the results relative to an external value in the same scale.
As a second step, a comparison was made between the normalized results of both products. By comparing them, it was possible to identify those characterization factors (already normalized and sorted) that presented an increase in their values relative to the re-designed model. Those impact characterization factors would eventually become the objectives of the final tradeoff analysis.
Owing to software limitations, it was not possible to perform a typical uncertainty analysis among the results of the normalized characterization factors (usually present in LCA studies). Instead, a second cut-off criterion was defined to aid in the analysis of the possible differences; those normalized values whose relative difference between the same characterization factors was less than 5% would not be considered in the final stage of the analysis, as their results would be extremely close. This simplified approximation was considered as sufficient to avoid focusing on characterization factors whose result might be hard to distinguish with confidence
The final interpretation among the tradeoffs included only those characterization factors that met the cut-off criteria and that at the same time represented an increase in their impact value with respect to the original model. The final tradeoff analysis includes identifying the source of the increase in the impact presented per characterized factor that would allow further discussion on how to reduce or overcome such results.
Regarding the results of the cumulative energy demand methodology, they were treated separately, as they came from a single-issue method, and no normalization was needed to bring the results into the same unit. Despite that, they were included and considered as relevant for the host enterprise, but had to go through the second criterion in order to be included in the final analysis of tradeoffs.
4. Discussion
The results obtained from the LCIA contradicted some of the conclusions obtained from the results reported in the previous CP program. The LCA identified areas where the re-designed model had higher environmental impacts than the basic model; apparently, the re-designed model implied more energy consumption and had a bigger carbon emission than the original model, among others.
4.1. Results Interpretation
Even though most of the impact category presented reductions when comparing the basic model with the re-designed one, some of those results needed to be analyzed carefully to avoid misinterpretation. For instance, the increase presented in the impact category of global warming potential (+230%) was explained, taking into account that the life cycle model implemented considered the temporary removal of carbon dioxide from the atmosphere or carbon uptake [
15]. In that regard, the general ILCD recommendation (as per prevision 7.4.3.7.3 from the ILCD Handbook: General guide for LCA, (pp. 226–227, [
15])) is to consider the carbon dioxide intake as an
input of resources from air, and to consider the very same amount in the outputs as
emissions to air (something that apparently neutralizes the intake value of biogenic carbon), but at the same time, that recommendation indicates to consider another output flux known as correction flow for delayed emission of biogenic carbon dioxide within first 100 years. That consideration provides −0.01 kg of CO
2-equivalents per 1 kg per year [
15].
As presented in
Figure 6 and
Figure 7, such flow represents carbon capture, expressed as a negative value (or avoided impact) in the climate change impact factor, affecting the final value. As for the land-use factor, the reasoning was that in Brazil, the analyzed eucalyptus forest considered the transformation from pasture to intensive forest cultivation, which creates the resulting credit (also expressed as avoided impact) for the land-use impact category. Once it is noticed that the original chair required more material than the re-designed chair (10.3 kg vs. 7.2 kg of wood, respectively, as presented in
Table 1), the resulting impact values make sense. The final figures for climate change potential and the rest of the impacts include all the contributions made during the life cycle.
Once taking those corrections flows into account, the final value of the global-warming impact factor was considered within reported values. As an example, a previous assessment of a similar product in Europe (a wooden chair of 4.05 kg mass) reported a total of 0.93 kg CO
2 Equation [
25] using the CML 2001–2010 assessment method, developed by the institute of environmental sciences at Leiden University.
Regarding the cumulative energy demand, the LCIA results were significantly higher than the results reported in the original CP program. These values can be understood considering that LCIA considers all the contributions that are included from a life cycle approach, which includes not only the direct electricity used in the manufacture of the products, but the total energy contained in materials, transports, and transformations up to the final destination. The final value for the redesigned chair is 5% higher than the value of the basic model, mostly for the cumulative energy contained in the plywood seat that substituted the eucalyptus seat on the basic model. That amount of energy was not part of the CP program; therefore, it was not considered when the savings in energy were estimated.
Table 6 presents the final values after implementing the LCIA with the cumulative energy demand method.
4.2. Dealing with Tradeoffs
Tradeoffs are sometimes unavoidable when attempting Ecodesign for sustainability. The productive process, from seedling to manufacturing, accounted for almost half of the environmental impacts, followed by final disposition and transport. Among those productive processes, it was necessary to determine which characterization factors should be analyzed more deeply.
The normalization of characterized values was useful to identify impact categories in reference to an external value that could be used as a guide to set the priorities.
Figure 8 presents the sorted results after the LCIA normalization.
In order to define which characterized factors were relevant to be analyzed, a percentage of change among the same normalized characterization factors was calculated. Even though the percentage of the change is equal to the ones visualized after the LCIA, in this case, all of the values were sorted following the normalization rule, as well as being expressed in the same unit of measure. The results indicated that, in decrescent order, human toxicity (non-cancer effects), particulate matter, and climate change potential had to be analyzed in detail, as they presented increases in their normalized results relative to the values of the basic model, as shown in
Figure 9. These impact categories also fulfilled the cutoff criterion of having a higher than 5% change.
Regarding the cumulative energy demand, despite that it was not included in the normalization procedure, they were included intentionally in this section because the energy demand was considered one of the main achievements during the CP program implemented. Despite that the LCA results using the cumulative energy demand method were significantly higher than the values reported during the CP program, the difference among such a value in the comparison was just about 5%. As a result, it did not pass the second cutoff criterion.
Table 7 presents the selection of the final characterization factors that fulfilled the cutoff criterion.
Although the re-designed chair partially fulfilled the objectives stated in the CP program, a more in-depth analysis of the sources for human toxicity indicated that the presence of substances such as zinc, mercury, lead, and arsenic, among others, generated during the transport of materials and products required for the manufacture of the re-designed model, followed by the final disposal and landfill processes. In this case, the re-designed chair presented higher values, mostly owing to the change in the material of the seat (plywood) at those stages of the life cycle. Other literature findings regarding wood base products and processed wood products, such as plywood, had also indicated that most of the environmental impacts occur outside the plant in the modern furniture industry in Brazil [
26], so this finding was considered aligned with those observations. A detail of the main substances reported in this characterization factor is presented in
Table 8.
Regarding the increase of particulate matter in the re-designed model, the primary substances identified were particulates <2.5 um, sulfur dioxide, nitrogen oxides, and ammonia. Once again, the source of such increase was identified to be the manufacture of the material of the seat (plywood).
Table 9 present the values of those substances in the particulate matter impact category.
Finally, following the order established for the normalization, the last characterization factor to be analyzed in the tradeoff discussion was the increase in the global warming potential factor. In this case, the main explanation was a bit different from the others; despite that the incorporation of the plywood seat did increase the value of the global warming potential, the main reason here was the reduction of the material used to manufacture the re-designed model. This reduction implied less capture of biogenic carbon in the form of raw material, as explained herein—
Section 4.1, interpretation of results.
4.3. Proposed Flowchart for Small and Medium Enterprises Attempting CP Programs
The previous CP program carried out in 2017 concluded that by substituting part of the raw material and by changing some stages of the production process, it was possible to reduce waste generation, as well as material and energy consumption. Even though those environmental goals were achieved at that time, the following LCA study demonstrated that a broader scope is relevant in order to avoid transference of impacts among products or materials.
The LCA demonstrated the presence of environmental tradeoffs among the impact characterization factors of the re-designed model, mostly owing to the changes made in the material of the seat and the manufacturing process. Even though it was not possible to carry out the LCA during the implementation of the CP program in 2017 (something that might have prevented the decision to change the material of the seat from bonded eucalyptus pieces to plywood), this study helps to highlight the relevance of the timing when complementing a CP program with an LCA. As a result of this, a flowchart that could aid to identify this kind of situation, as well as other possible situations when implementing a CP program, was proposed. The flowchart can help to identify a situation in which it is necessary to complement the CP program with an LCA.
The proposed flowchart can also help to avoid unnecessary costs and time associated with the implementation of a full LCA in cases that might be unnecessary. Carrying out an LCA from the beginning might be out of reach for micro and small enterprises owing to the need for financial resources and properly trained personnel. That situation could discourage the implementation of an initiative to make environmental improvements in a productive process.
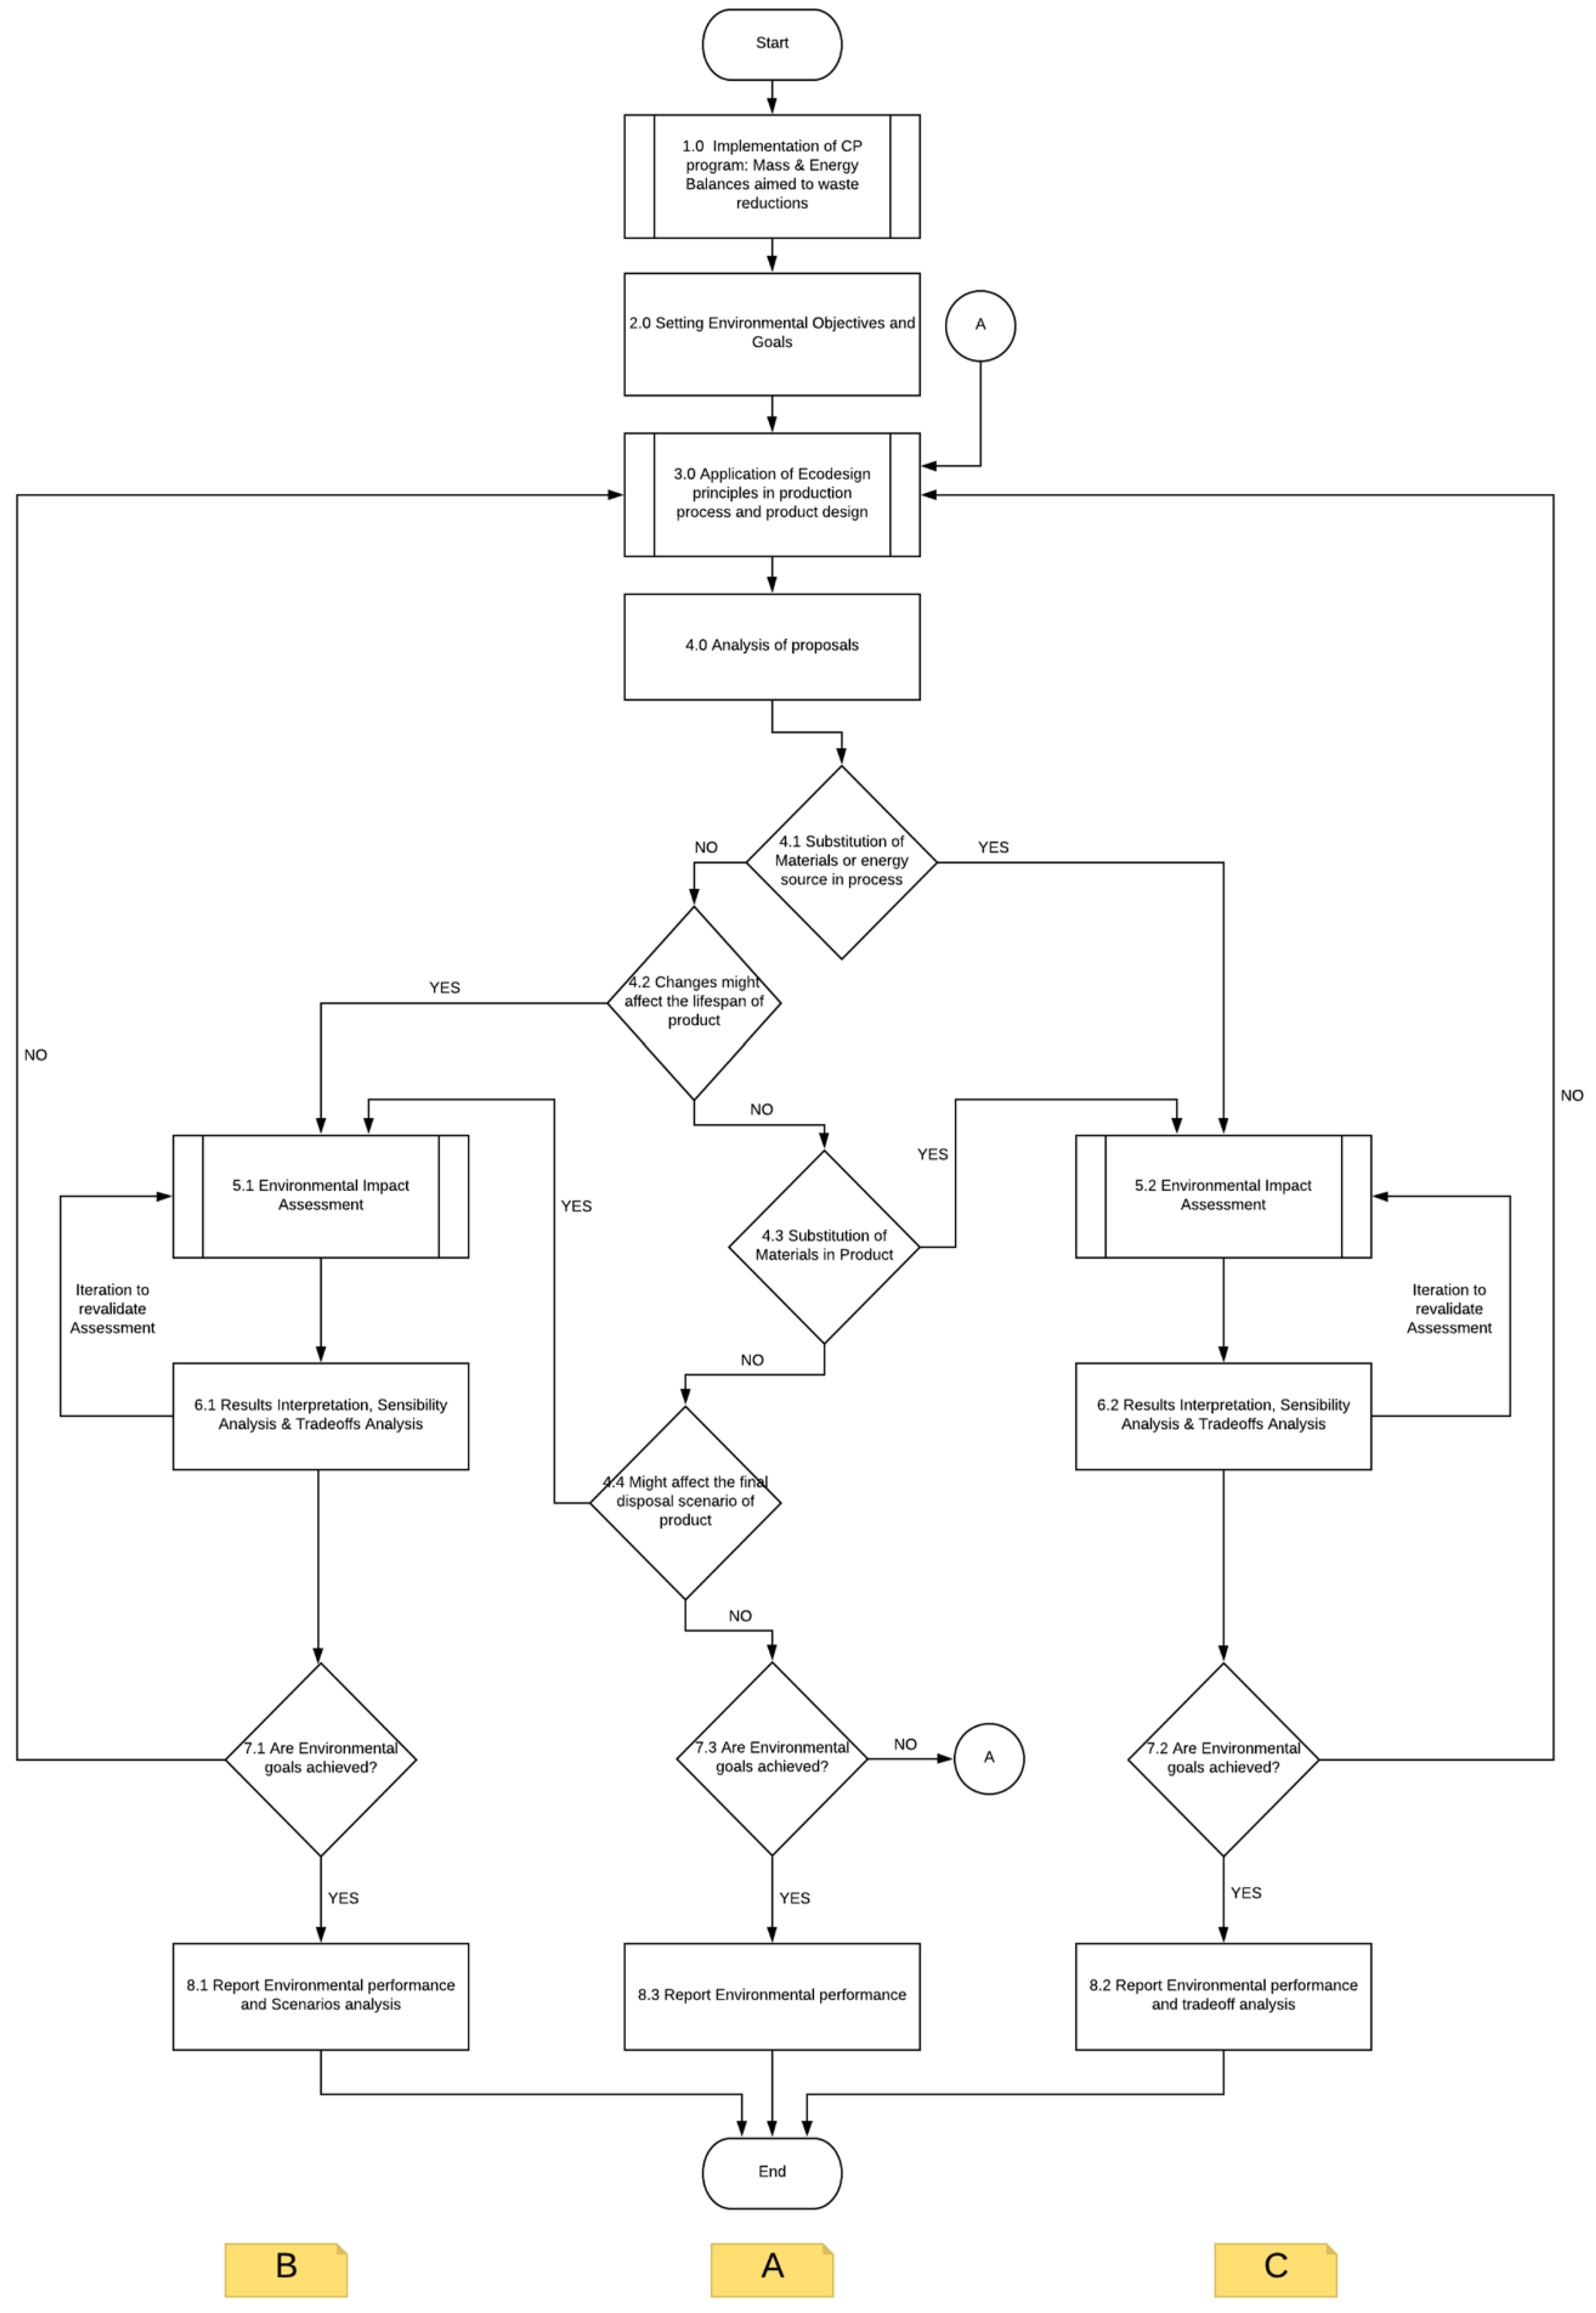
The proposed flowchart is presented in
Figure 10. The procedure can follow the steps included in areas A, B, and C. Steps 1.0 to 4.0 represent a common path. The decisions 4.1, 4.2, 4.3, and 4.4 represent necessary questioning that can be evaluated while implementing a CP program. In the case any of such decisions having an affirmative answer, a complementary assessment tool is required in order to analyze unidentified tradeoffs. The path contained within area C is suggested when material or energy substitutions are made, focusing on environmental assessment methods and tradeoff analysis aimed to quantify the relative differences among the most relevant impact (like the approach carried out in this case study), but can also include sensitivity analysis or Monte Carlo simulations. The selection of the tool to address the tradeoffs will depend on the availability of resources and the assessment method selected. Area B path is similar to area C and is suggested when the production process or lifespan is affected in the CP program. It is focused on—but not limited to—changes that require forecasting scenarios.
Finally, it is essential to highlight that areas A, B, or C are not intended to represent any hierarchy among environmental strategies or among the environmental performance of tools. It is possible to have better environmental performance in any of them. What the area A path does highlight is that if there are no changes among energy sources, material, processes, or lifespan, then it is not necessary to carry out another environmental assessment because there will not be environmental tradeoffs, and as a result, the environmental gains from the CP program can be reported with confidence.
5. Conclusions
At the beginning of this paper, some questions regarding CP and LCA were established. After the implementation of this study, it was possible to answer them.
First, it was questioned if CP and LCA represent opposite points of view when attempting to assess the sustainability of a product system. It was concluded that the answer is no. They do not represent opposite points of view, and this conclusion considers the real results obtained in the case of study, which signalized the presence of increments and decrements among the values of the characterized impact factors of the products evaluated. It is possible that similar situations of contradictory results in other case studies reinforced the idea that the tools are not compatible, but this study identified at least one of the main reasons of this misconception of the tools: the timing of the LCA is relevant. The late implementation of the assessment prevented evaluating the new material proposed for the seat in the CP program (plywood). By the time the LCA was carried out, and the increase in some characterization factors was identified, the production process and new design of the product were already in place.
It is recognized that CP programs provide a valuable framework that an LCA might not provide because it is out of its scope; first, the CP has the form of a continuous program, requesting the creation of a working team within the enterprise in charge of looking for new ways to reduce waste generation and material consumption in all the processes of the enterprise. It also requires measuring, estimating, and computing mass and energy balances, and owing to its flexibility and adaptability for any size of enterprise, it is recommended for national and international institutions as a way to attempt sustainability at an enterprise scale. Their limitations regarding the scope and the lack of scientific rigor also recognized, something that LCA does provide, along with the benefit of having a life cycle scope, something that helps to recognize and prevent shifting environmental burdens among processes or products. Indeed, they are not equivalent tools; carrying out just a CP program or an LCA are not considered equivalent as the information needed, time, resources, results, and the possible further actions might be different. The synergy is enhanced when used in combination.
Regarding the question of the criterion that a small or medium enterprise should use to implement LCA as the complement of a CP program, it is concluded that this criterion depends on the findings and recommendations of the CP team. Here, the proposed flowchart is found to be useful to help any CP team to identify the tradeoffs zones where LCA could be needed. As an example, if the flowchart would have been used in this case study, despite that the CP program did not propose changing the energy source or modifying so much the product composition (affecting its lifespan), the CP team suggested changing the material and the production process to reduce waste generation and material and energy consumption. According to the flowchart proposed, these changes would have requested an assessment using a specialized tool such as LCA before taking place.
Carrying out an LCA requires specialized knowledge, and that could be costly depending on the situations of the enterprises and the product or service being evaluated, among other variables. So how can small and medium enterprises with limited financial resources implement a CP program that might request an LCA? In that case, there is not a definitive answer, but this case of study was carried out facing those financial challenges with the aid of an academic institution that provided the staff and operative personnel, as well as other resources such as the software and other expenses. This would be considered an option, keeping in mind that the support might also be limited. It is also signalized that not having the capability to run an LCA should not stop any effort to improve the environmental performance of any product or service through a CP program, as long as some conditions—also identified in the proposed flowchart as no changes in energy source, lifespan, materials, or production processes—are met.
As some authors have stated, support for tradeoffs is commonly found in some Ecodesign tools, and their level of support might include life cycle perspective [
11]. Therefore, a direct implementation of an LCA is intended to offer support for the situation of tradeoffs. Usually, specialized software such as SimaPro
® includes in its expert-license a set of sensibility tools to interpret the results, as well as several capabilities to set scenarios, including Pedigree Matrix for uncertainty analysis and Monte Carlo simulation for probability distribution scenarios. That was not the case under the faculty license used in this study, but this limitation was not considered a stop. Instead, this situation was used as part of the framework and context that might be relevant to some micro and small enterprises in Latin America.
Regarding the specific product system of this case study, after the implementation of the LCA, it was recommended to the manager to revise the selection of the material of the seat in the redesigned model. More material options can still be considered, including other wood species with less impact and recycled wood from other processes, among others. Following the procedure proposed here, any future change in the material should include a life cycle perspective. Another suggestion made to the manager was to consider closer suppliers of wood. The distance of 621 km from the planted forest to the city of Salvador accounted for most of the impacts regarding CO2 emissions; therefore, sourcing the material from a nearer provided could improve the environmental performance of the products in that characterization factor.
Finally, it is highlighted that the current study does not pretend to discourage the implementation of any CP programs on behalf of performing the LCA. On the contrary, this study does highlight and encourage the continuous implementation of CP programs, especially in Latin America, where a large part of their economy depends on small- and medium-sized enterprises. In that sense, CP seems to be the logical first step in the pursuit of sustainability, owing to its lower need for financial resources.

 ,
, 


