Article

The Impacts of Groundwater Chemistry on Wetland Vegetation Distribution in the Northern Qinghai–Tibet Plateau

1
College of Geography and Environmental Science, Northwest Normal University, Lanzhou 730070, China
2
Gansu Engineering Research Center of Land Utilization and Comprehension Consolidation, Lanzhou 730070, China
3
The Administrative Center for China’s Agenda 21, Beijing 100038, China
4
State Key Laboratory of Urban and Regional Ecology, Research Center for Eco-Environmental Sciences, Chinese Academy of Sciences, Beijing 100049, China
5
Research Center for Eco-Environmental Sciences, University of Chinese Academy of Sciences, Beijing 100049, China
6
Management Bureau of Shiyang River Basin, Gansu Provincial Water Resources Bureau, Wuwei 733000, China
*
Authors to whom correspondence should be addressed.
Sustainability 2019, 11(18), 5022; https://doi.org/10.3390/su11185022
Submission received: 25 August 2019 / Revised: 10 September 2019 / Accepted: 11 September 2019 / Published: 13 September 2019

Abstract

:
Groundwater chemistry has an important impact on the vegetation distribution in inland areas. An in-depth understanding of the impact of groundwater chemistry on vegetation can help in developing an effective management strategy to protect the inland ecosystem. The aim of this study was to identify the influence of groundwater chemicals on species diversity and the distribution characteristics of wetland plants at multiple scales based on the groundwater chemical data from 15 sampling points and the distribution data of 13 plants in the Sugan Lake Wetland in 2016. The results show that the groundwater of the Sugan Lake Wetland is weakly alkaline, with high salinity and hardness; the water chemical type is Na-SO4-Cl; the concentration of the major water chemical parameters is significantly different and is the highest in the northwest, followed by the southwest, and is the lowest in the east; with an increase in the groundwater depth, the concentration of major water chemical parameters first showed an increasing trend followed by a decreasing trend; Artemisia frigida Willd, Poa annua L. and Triglochin maritimum L. were adapted to the environment with a higher ion concentration of the groundwater, and their salt resistance was the strongest; Blysmus sinocompressus and Polygonum are more adapted to the environment with lower salinity and hardness of groundwater; Thermopsis lanceolata has stronger adaptability to the ion concentration, salinity, and hardness of groundwater; other plants are adapted to environments where the ion concentration, salinity, and hardness of the groundwater are moderate.

1. Introduction

Water resources are the basis for maintaining the ecological environment and social development, and water quality is the key to protecting the ecological environment and ensuring social and economic sustainability [1,2]. As one of the most important water sources of terrestrial ecosystems, groundwater has profoundly influenced the growth and distribution of groundwater-dependent plants [3,4]. In arid inland areas, groundwater is one of the main sources of water for plant growth because of lower precipitation and because the role of the groundwater is more prominent [5]. It is important to clarify the relationship between groundwater chemical characteristics and the distribution and species diversity of the vegetation.
Studies on the relationship between groundwater and vegetation appeared earlier for inland arid and semi-arid regions [6,7,8] and focused on the relationship between groundwater levels and vegetation by using the monitoring data [9,10]. The change in the groundwater level can not only affect the water absorption of the vegetation roots, but also the changes in the water-salt characteristics of groundwater, thus affecting plant growth [11]. In recent years, the scope of research has gradually expanded, the content has become deeper, and research methods have become more and more abundant. In the scope of research, studies on the relationship between groundwater and vegetation in coastal wetlands and riparian wetlands is increasingly common. For example, Antonellini [12] studied the effects of groundwater salinity on the species richness of coastal pine forests and wetland vegetation in Ravenna, Italy, and found that pines have strong salt resistance (12 g/L) but cannot survive in shallow water. Shallow water and low salinity promote species richness or biodiversity in this area. Jia Huijun [13] analyzed the effects of groundwater on wetland vegetation species richness and uniformity in the middle reaches of the Yellow River. As far as the research content is concerned, many scholars have begun to pay attention to the relationship between groundwater chemical characteristics and vegetation. Groundwater hydrochemical characteristics can directly reflect the water quality. By studying the relationship between groundwater chemical characteristics and vegetation, specific factors affecting vegetation growth can be more clearly identified. An Lesheng [14] analyzed the impact of key water-salt factors of the groundwater on vegetation in the Yellow River Delta. Zhao Feng and Jin Hailong [15] studied the relationship between the groundwater hydrochemical characteristics and the growth of Populus euphratica of the Aqikesu River in the Aibi Lake Wetland Nature Reserve. Feng [16] found that the salinity difference of groundwater is an important factor that affects the distribution pattern of vegetation. In terms of research methods, remote sensing techniques and models have been widely used in the study of the relationship between groundwater and vegetation [17]. Howard [18] used Geographic Information System (GIS) techniques to identify and map the distribution of groundwater-dependent ecosystems in California to clarify the relationship between groundwater and surface ecosystems. Lv [19] used remote sensing images combined with groundwater data to evaluate the response of vegetation distribution to groundwater. Peters [20] studied the spatial pattern of vegetation in a groundwater-dependent system using the Ensemble Learning Based Model. Although the relationship between wetland groundwater characteristics and vegetation has received extensive attention, research on alpine inland wetlands is still non-existent to the best of our knowledge.
The plateau inland wetland is an important part of the wetland, and its special geographical location and environment highlight its role in ecological protection and biodiversity storage. Located in the northwestern part of the Qaidam Basin, the Sugan Lake Wetland is a typical plateau inland wetland with a relatively fragile ecological environment. Groundwater is the main source of water for wetlands, and there is a large amount of groundwater-dependent vegetation in the wetlands. In addition, in order to solve the ecological problems caused by the shortage of water resources, the government decided to transfer water from the Big Haerteng River in the water source areas of Sugan Lake Wetland to the Danghe Reservoir to alleviate the deterioration of the ecological environment in Dunhuang. After the start of water transfer, the decrease in the runoff of the Big Haerteng River causes adverse effects, such as reduced water in the Sugan Lake wetland, lower groundwater levels, and degradation of natural vegetation [21]. Therefore, it is important to understand the relationship between groundwater and vegetation distribution for wetland ecosystem protection. As such, the three main objectives for this study were: (1) to characterize the groundwater chemistry of the Sugan Lake Wetland; (2) to characterize the vegetation distribution and species diversity of the Sugan Lake Wetland; (3) to discuss the relationship between chemical characteristics of groundwater and vegetation distribution and species diversity. We anticipate that the findings from this study will provide a theoretical basis for the protection of wetland ecosystems and biodiversity in the context of water transfer.

2. Materials and Methods

2.1. Study Area

The Sugan Lake Basin (38°30′4″ N~39°14′40″ N, 93°35′40″ E~95°26′40″ E) is a nested basin in the northwestern part of the Qaidam Basin. The terrain is high in the east and low in the west, with an elevation of 2700~3800 m. It is located in the inland arid area with low precipitation, a dry climate, and a large temperature difference between day and night. The annual average temperature is 0~3 °C, and the difference between the east and the west is large. The elevation in the east is higher, the annual average temperature is −4.83 °C, the average annual precipitation is approximately 100 mm, and the evaporation is approximately 2100 mm, while the annual average temperature in the west is 3 °C, the precipitation is approximately 16 mm, and the evaporation is nearly 3200 mm. The Big and Small Haerteng Rivers in the eastern region are the main water supplies in the basin [22].
The Sugan Lake Wetland (93°45′28″ E~94°21′29″ E, 38°45′23″ N~39°7′12″ N) (Figure 1) is the tail wetland in the basin, located in the western part of the basin and including the large and small Sugan Lake and its surrounding marshes and meadows. This wetland is approximately fan-shaped and has an area of approximately 1492 km2. There are many kinds of vegetation in the wetland (which is an important vegetation distribution area in the Sugan Lake Basin), including Phragmites communis, Achnatherum splendens, Blysmus sinocompressus, Artemisia frigida Willd, Poa annua L., Carex tristachya, and Agropyron cristatum. Marsh water and groundwater are the main sources of wetland vegetation. Less precipitation and strong evaporation intensify the wetland salinization. The wetland is surrounded by a large area of the Gobi Desert, and the ecological environment is very fragile. Only a small number of Kazakhs are engaged in grazing activities outside the wetlands, and human activities are weak.

2.2. Sampling Sites and Groundwater Chemistry Data

Groundwater samples were collected from 15 sampling points in the Sugan Lake Wetland in August 2016. The selection of groundwater sampling points takes into account various factors, such as vegetation type, sample uniformity, and operability, so the sampling points all have good representation. The collection processes for the groundwater samples were carried out in accordance with the Geological and Mineral Laboratory Test Quality Management Regulations (DZ0130-2006) and the Groundwater Pollution Survey Evaluation Specification (DD2008-01). All samples were tested in the laboratory of the Geological Environmental Monitoring Institute of Gansu Province. The total dissolved solids (TDS) and pH value were measured by HANNA (HI3512) and the pH instrument (PHS-3D), respectively. Importantly, the pH meter needed to be calibrated before each test, and it was necessary to wash the instrument with distilled water before measuring a sample. The total hardness (TH, measured as CaCO3) and the total alkalinity (TA, calculated as CaCO3) were measured using the EDTA complexometric titration method and an acid–base titration method, respectively. Before testing the concentrations of the ions in the samples, all samples were filtered using 0.45 μm polycarbonate microfiber filters. Major cations (Na+, K+, Mg2+, and Ca2+) were analyzed by a Dionex-600 ion chromatograph (DIONEX, California, United States of America), and major anions (Cl, SO42−, and NO3) were analyzed by a Dionex-3000 ion chromatograph. HCO3 is measured by a double standard reagent titration. The comparative test analysis shows that the contamination of the sample during sampling, transportation, and processing was negligible.

2.3. Vegetation Distribution

In August 2017 and June 2018, key surveys were conducted on vegetation, and 81 vegetation survey points were selected (Figure 1) to provide basic data for the vegetation distribution in Sugan Lake Basin. The supervised classification of wetland plant types based on GF3 (Gaofen-3) images, with a resolution of 2 m × 2 m, and the establishment of interpretation marks depend entirely on preliminary field investigations of the vegetation. According to the distribution of major plant types near the groundwater sampling points and the vegetation survey sites, the main plant types in the wetlands are Phragmites communis, Artemisia frigida Willd, Poa annua L., Triglochin maritimum L, Triglochin palustre, Salicornia europaea, Mulgedium tataricum, Thermopsis lanceolata, Carex tristachya, Achnatherum splendens, Agropyron cristatum, Polygonum, Blysmus sinocompressus, and Tripolium vulgare. Among these types, Artemisia frigida Willd and Poa annua L. established the same interpretation mark, because the two types in the study area were found to be accompanied by the investigation process, and their distribution areas were similar. In addition, a large area of water and saline–alkali land is distributed in the wetland.

2.4. Statistic Analysis

Principal component analysis (PCA) was used to extract the major components of the groundwater chemical parameters, and the analysis process was completed via the SPSS (21 version) software. The variation coefficient (CV) is used to determine the spatial difference between the different parameters of water chemistry. Shannon’s Diversity Index (SHDI) is used to measure the species diversity of plants, based on a raster data of vegetation distribution, which is calculated by the Fragstats (4.2 version) software. The PCA was used to select the major water chemistry indexes in SPSS 21.
Redundancy Analysis (RDA) was carried out using CANOCO (4.5 version) to determine the correlation between the species and the water chemistry indexes at multiple scales. The RDA results are presented graphically on plots, where variations in each groundwater chemistry index and the plants for each spatial scale are shown as arrows along with their abbreviated names; the former are presented in red, and the latter are indicated in black. The significance of the correlation between the distribution of changes in the groundwater chemistry indexes and plants is shown by the length of the arrows. A longer arrow indicates a stronger correlation between them [23]. A vector of the relationships (directly proportional or inversely proportional) was interpreted from the position of the changed groundwater chemistry index relative to the end of the arrow. If the groundwater indexes were close to the end of the arrows, the correlation was positive. If they were on the opposite site, then the correlation was negative [23,24].

3. Results and Analysis

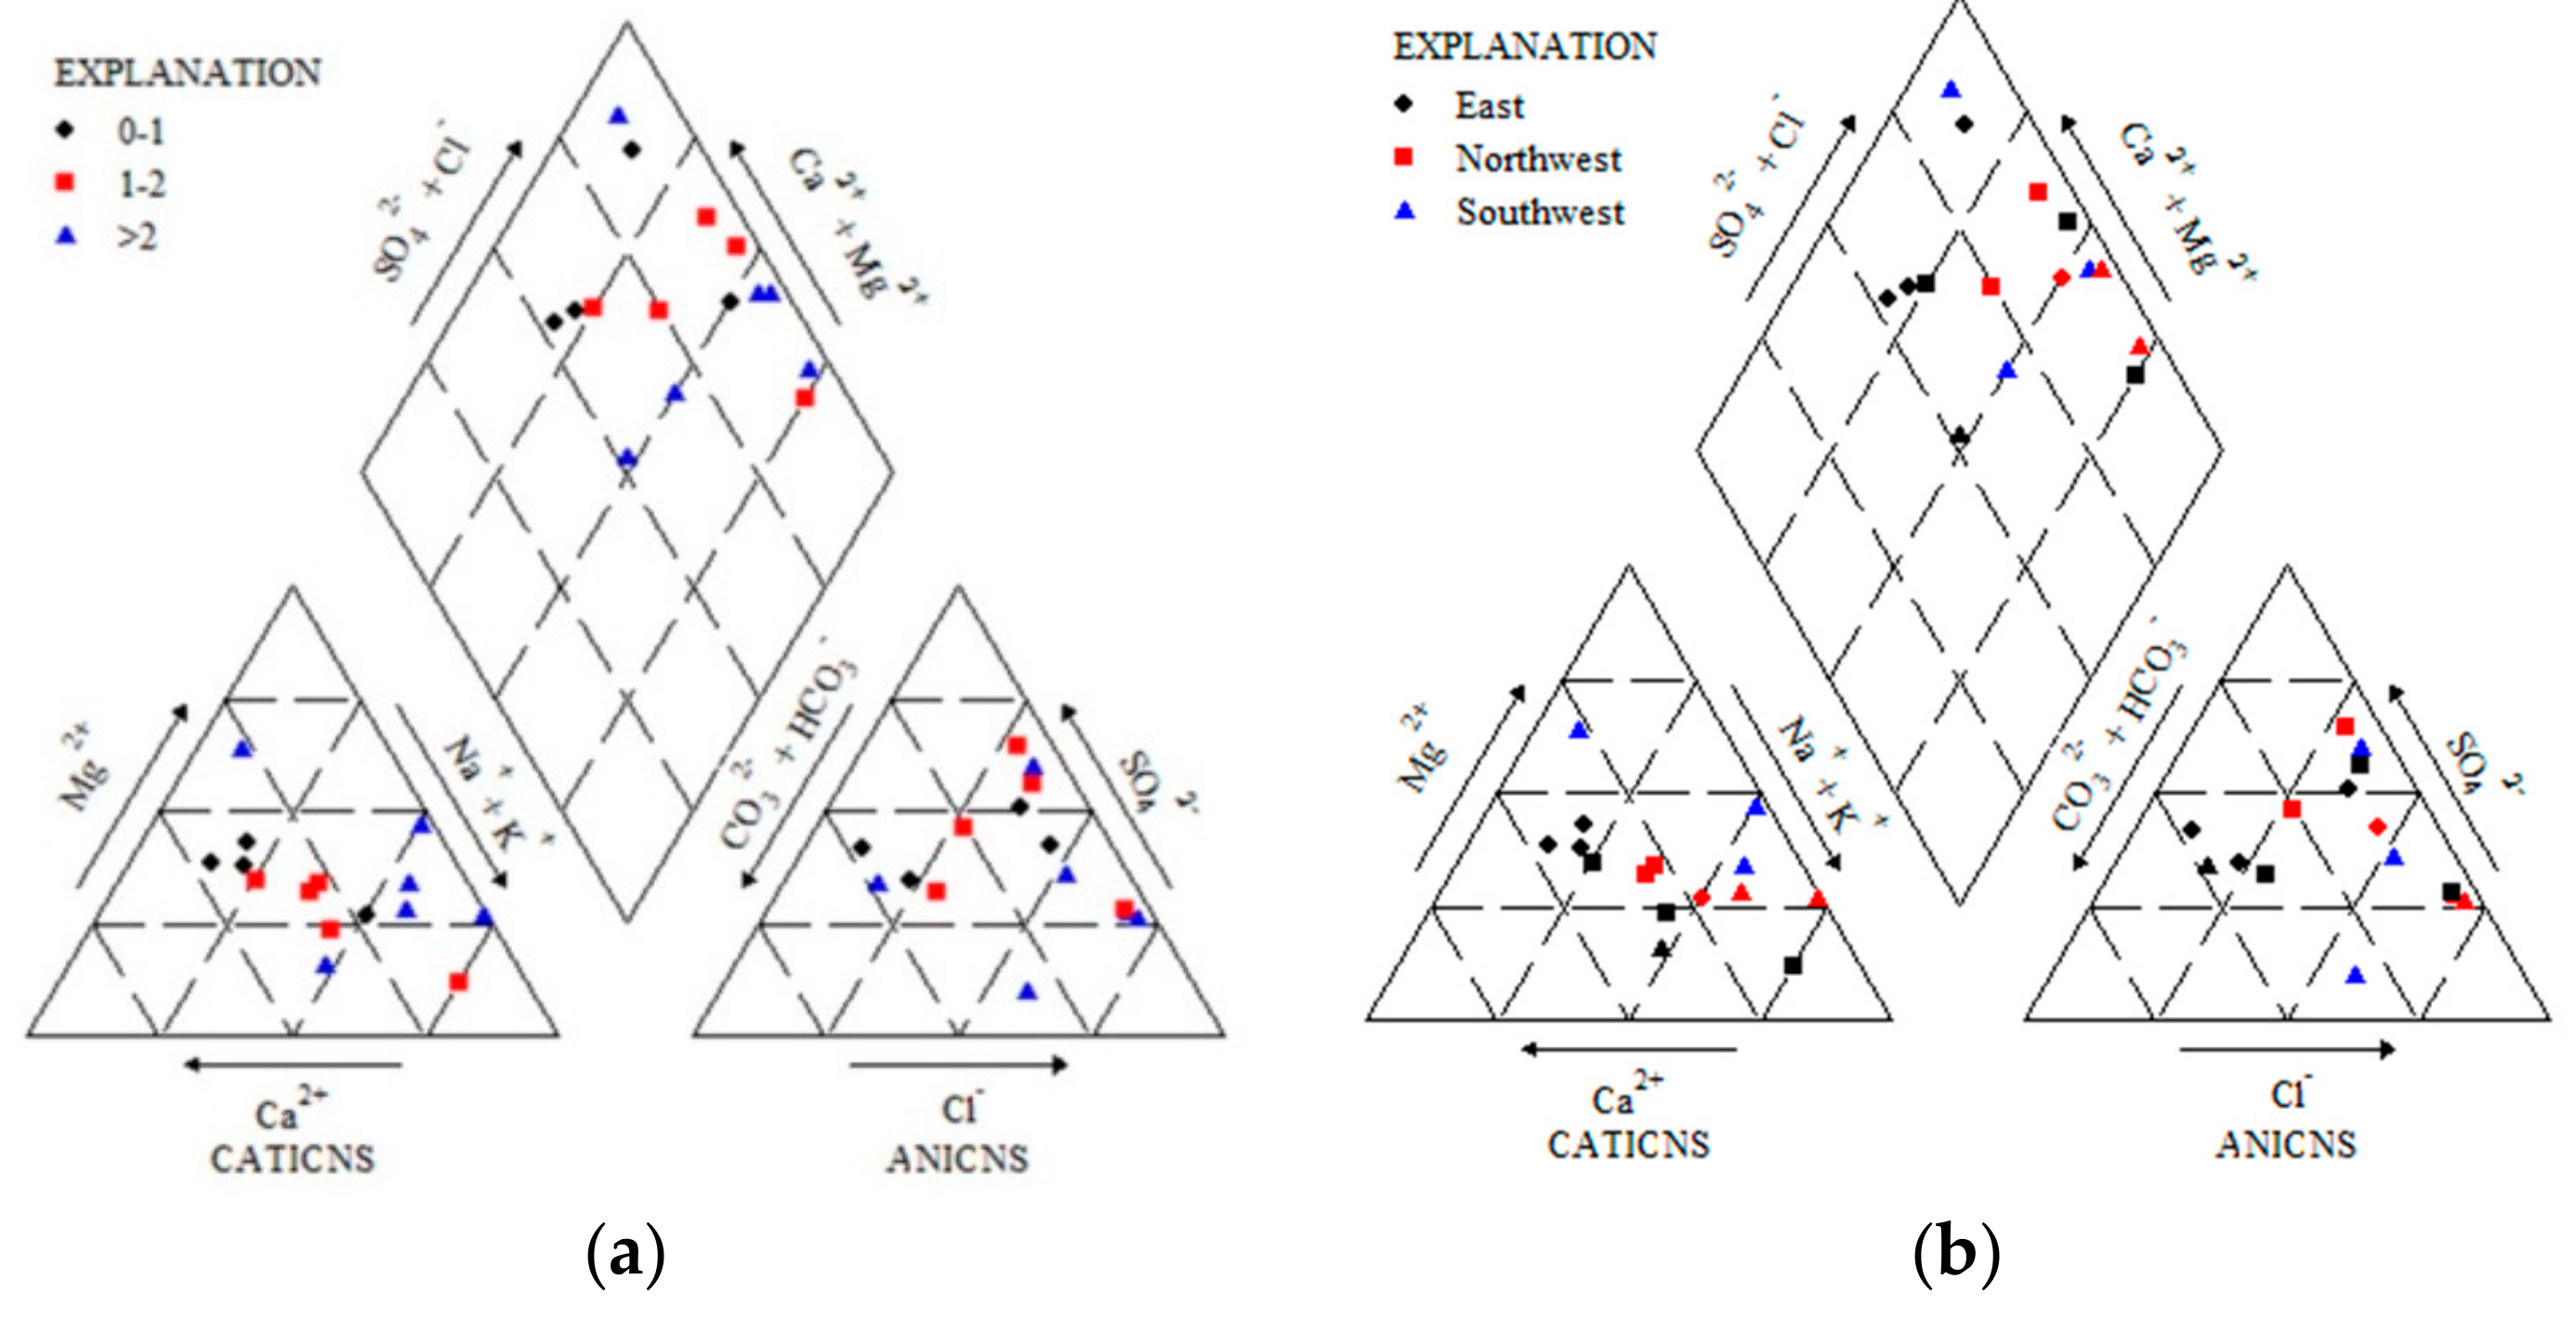
3.1. Analysis of Groundwater Chemical Characteristics

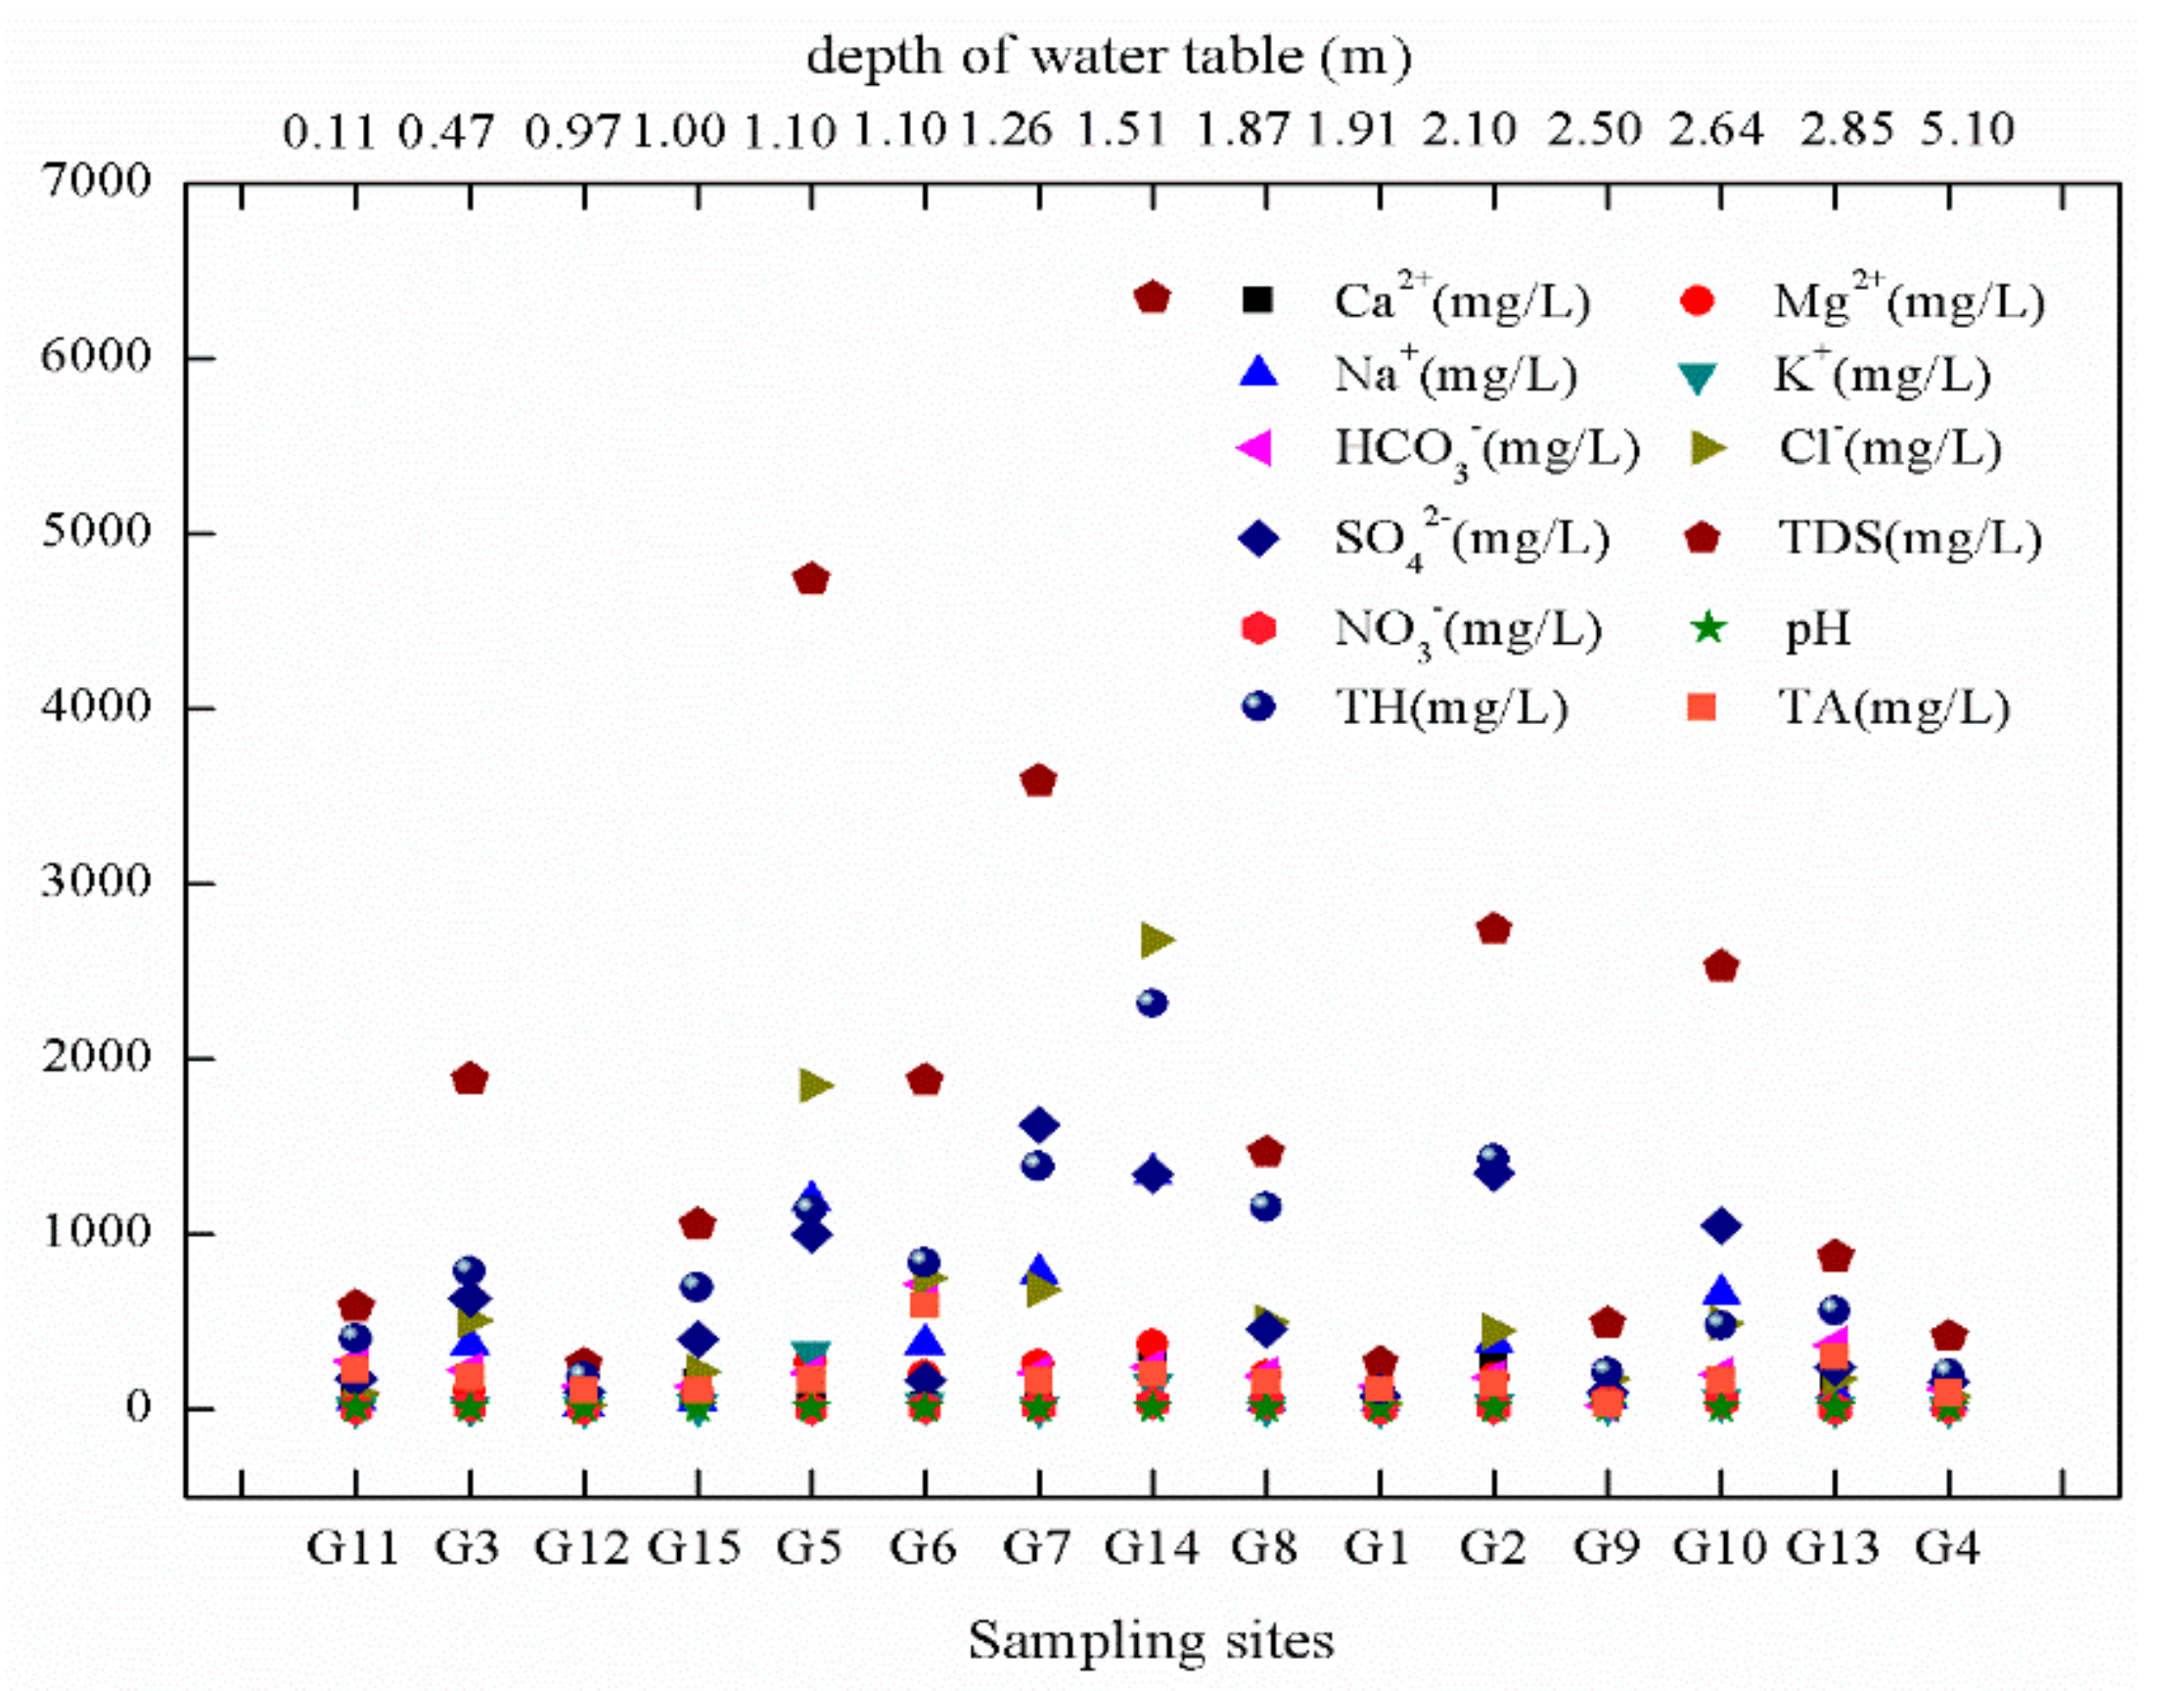
3.1.1. General Characteristics

The variation coefficient (CV) of the main water chemical parameters ranged from 0.64 to 1.89 (Table 1), indicating that the hydrochemical characteristics of the groundwater in the Sugan Lake Wetland are quite different. The CVs of Na+, K+, NO3, and pH are all greater than one, and the difference is very obvious. The average values of pH and TA were 7.86 and 181.87 (mg/L) in the groundwater, respectively, which are weakly alkaline. The average values of TDS and TH were 1940.42 (mg/L) and 790.52 (mg/L), respectively, indicating that the groundwater hardness was large. Among the major ions, the concentration of NO3 was the lowest, and the average value was only 19.52 (mg/L). The concentrations of the other chemicals were generally higher, with Na+, HCO3, Cl, and SO42− concentrations of 366.08 (mg/L), 220.48 (mg/L), 576.08 (mg/L), and 588.87 (mg/L), respectively. Na+ is the main cation, and SO42− and Cl are the main anions.

3.1.2. Spatial Distribution Characteristics

The difference in the concentration of the groundwater chemical parameters at different sampling points is shown in Figure 2. The abscissa is the sampling point. The groundwater depth increases gradually from left to right, and the ordinate is the concentration.
With an increase in the groundwater depth, the major hydrochemical parameters show a trend of increasing first and then decreasing (Figure 2). Through the analysis of the groundwater depth and the concentration of the major hydrochemical parameters, it was found that when the groundwater depth is approximately 1.5 m, the concentration of the major hydrochemical parameters reaches its maximum. In addition, the concentration of the groundwater’s chemical parameters at different sampling points shows three levels as a whole (Figure 3): G3, G5, G14, G2, and G10 are sampling points with relatively high concentrations; G6, G7, and G8 are sampling points with slightly lower concentrations; G11, G12, G15, G1, G9, G13, and G4 are sampling points with relatively low concentrations. The sampling points G2, G3, G4, G5, and G14 are located in the northwest of the wetland; the sampling points G6, G7, and G8 are located in the southwest of the wetland; and the other points are located in the eastern part of the wetland. Therefore, the concentration of the groundwater chemical parameters at different sampling points is highest in the northwest, followed by the distribution in the southwest, with the lowest concentration in the east.
Because of the obvious differences in the groundwater chemistry between different burial depths, a Piper Diagram was used to analyze the groundwater chemistry types at different depths (Figure 3). By analyzing Piper Figure 3a, it was found that when the groundwater depth is 0–1 m, the water chemistry type is Ca-Mg-SO4; when the groundwater depth is 1–2 m, the water chemistry type is Ca-Na-SO4; and when the groundwater depth is greater than 2 m, the water chemical type is Na-SO4-Cl. Figure 3b shows that the chemical type of the groundwater in the northwest is Mg-Na-SO4-Cl, the chemical type of groundwater in the southwest is Mg-Cl, and the chemical type of groundwater in the east is Ca-SO4. The overall water chemistry type of the Sugan Lake Wetland is Na-SO4-Cl.

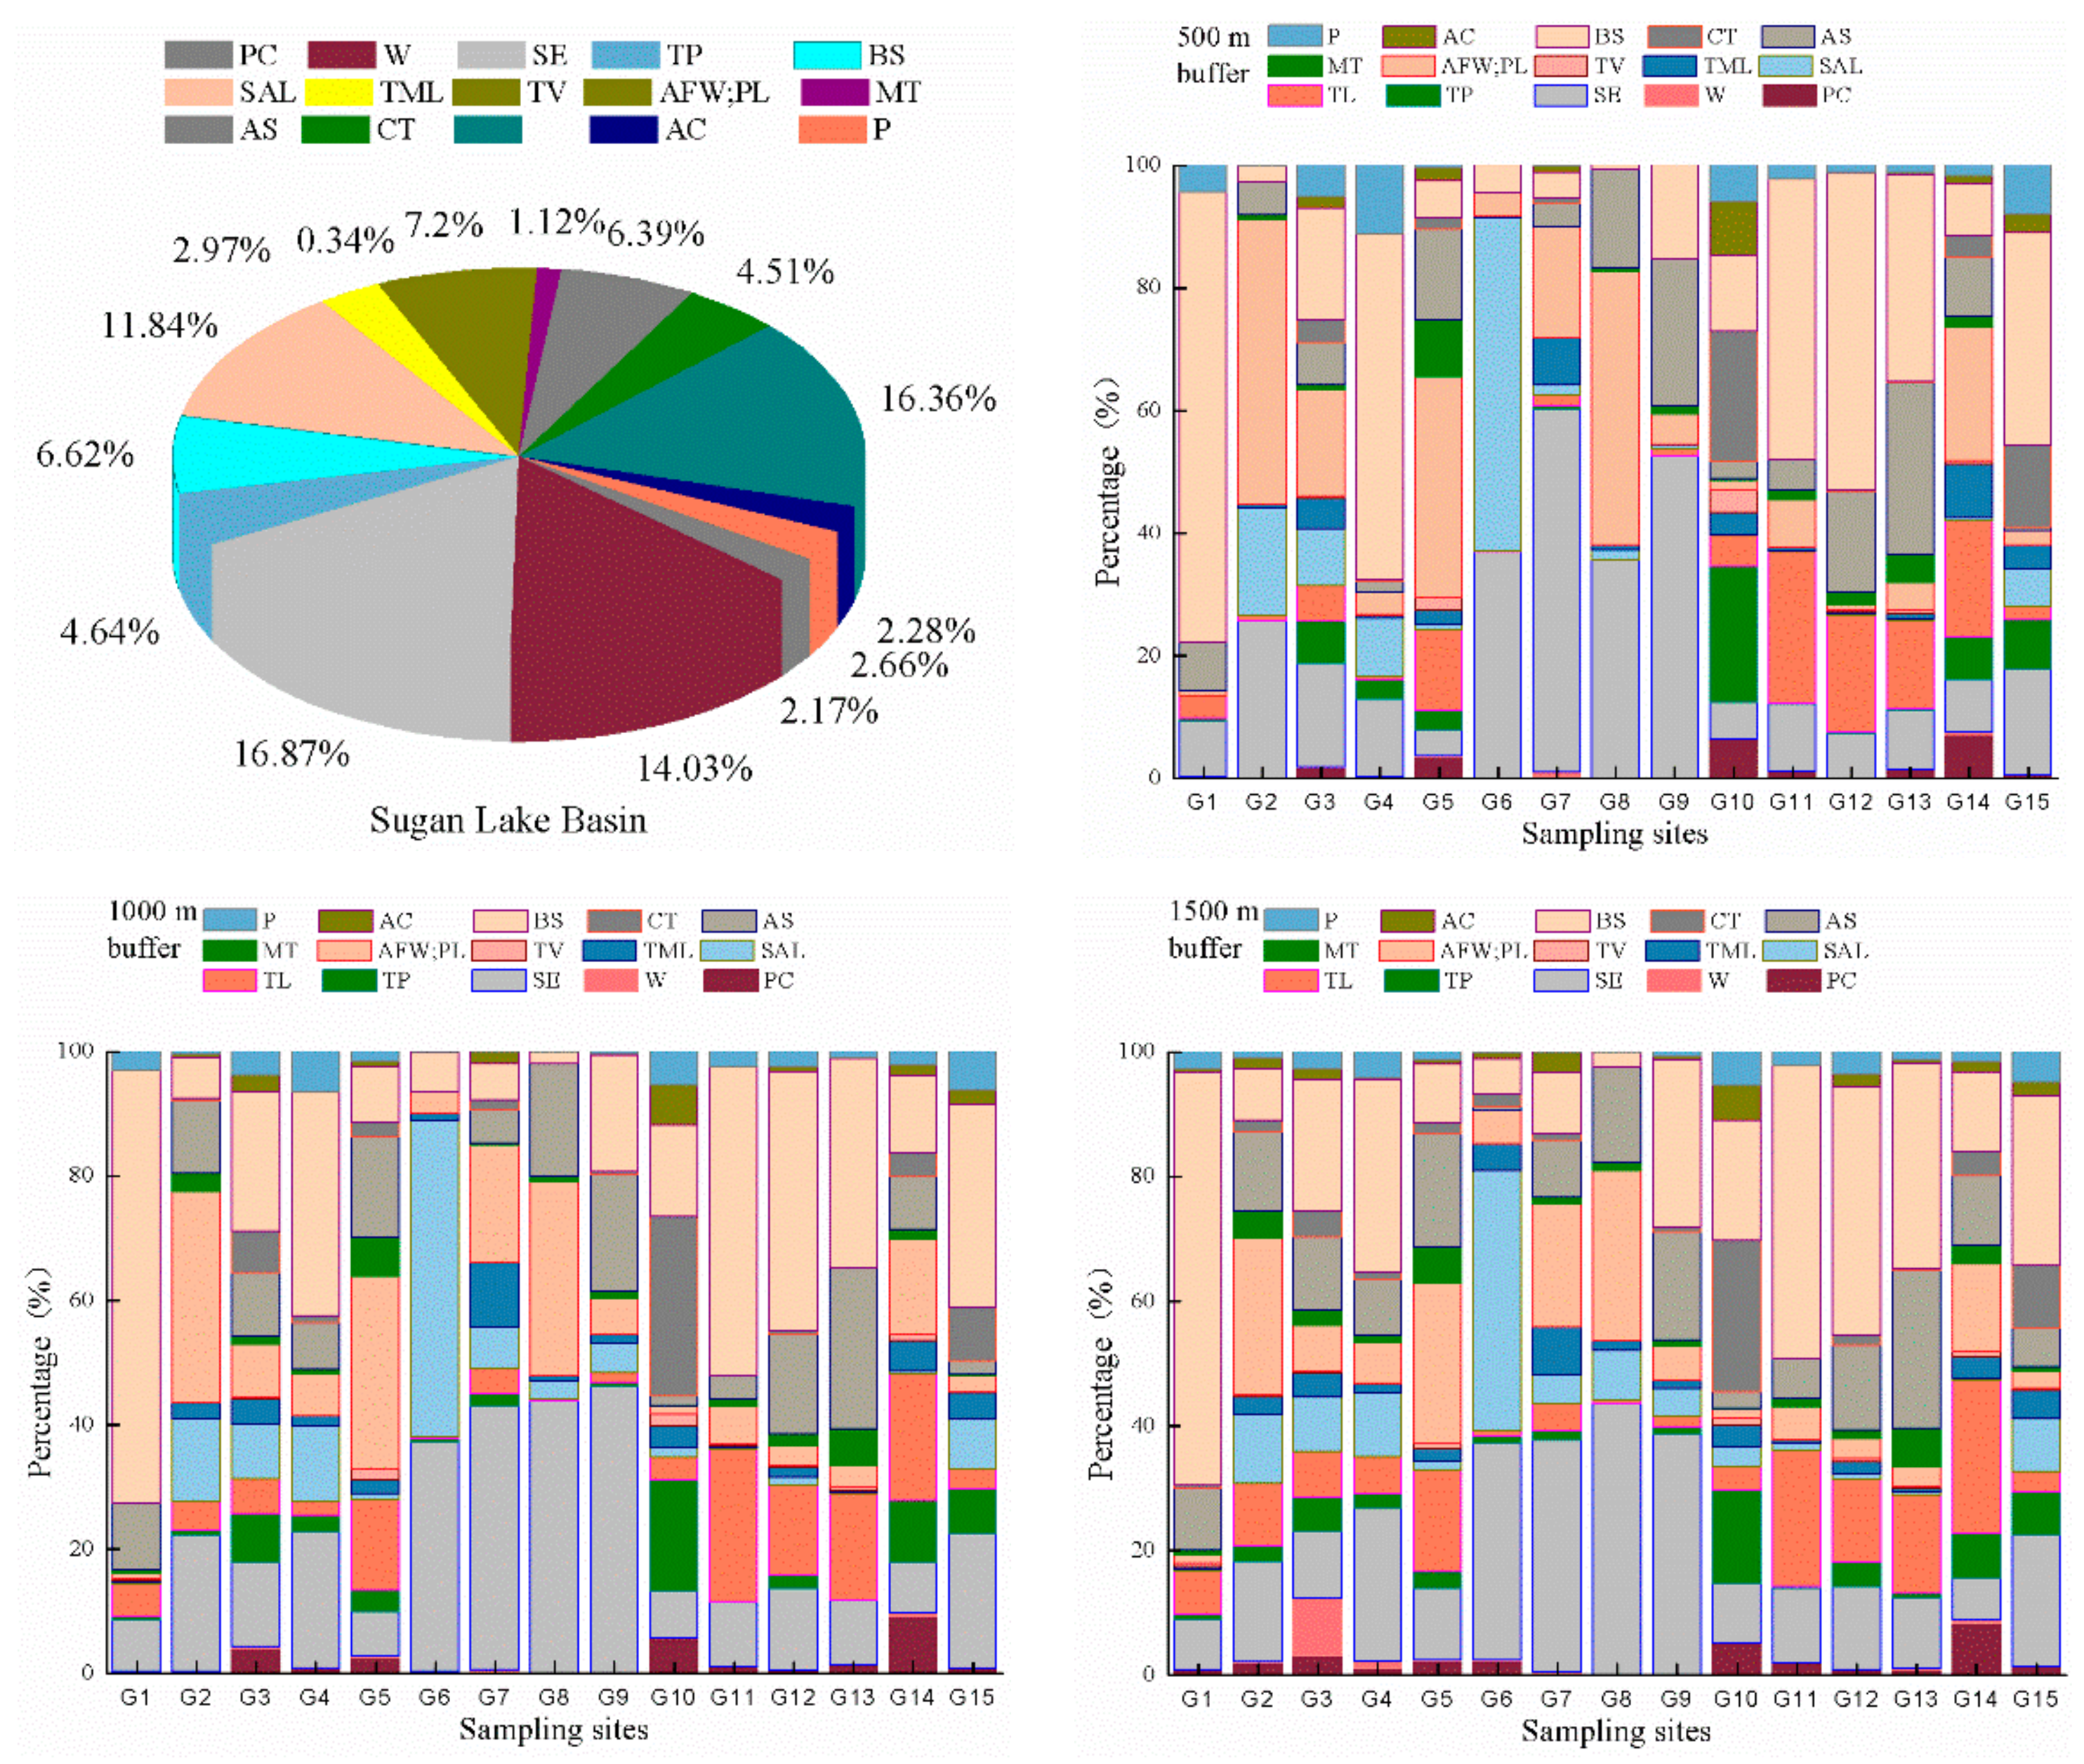
3.2. Vegetation Distribution Characteristics at Different Scales

3.2.1. Distribution Characteristics of Different Types

There are 14 kinds of plants in the Sugan Lake wetland: Phragmites communis, Artemisia frigida Willd, Poa annua L., Salicornia europaea, and Achnatherum splendens. In addition, there are large areas of water and saline–alkali land (Figure 4 and Figure 5). The waters and saline–alkali land account for 14.03% and 11.84% of the total area, respectively. The large and small Sugan Lakes are the main waters in the wetlands. The saline–alkali land is mainly distributed in the low-lying areas of the wetland and around the lake. The area of Salicornia europaea and Blysmus sinocompressus is 16.87% and 16.36%, respectively. The Salicornia europaea is mainly distributed in the middle of the wetland and other areas around the saline–alkali land. The Blysmus sinocompressus is mainly distributed in the eastern part of the wetland. Artemisia frigida Willd and Poa annua L. accounted for 7.2% of the total, and were distributed mainly in the northwest and southeast of the wetland, and other areas are also sporadically distributed. Thermopsis lanceolata and Achnatherum splendens accounted for 6.62% and 6.39% of the total, respectively. Thermopsis lanceolata was mainly distributed in the northwest of the wetland, and Achnatherum splendens was widely distributed in the marginal areas of the wetland. Tripolium vulgare had the smallest area, with only 0.34%. The percentage of other plants is relatively close. Phragmites communis and Carex tristachya are mainly distributed in the lakeside and swampy areas with abundant water, while the others are scattered throughout the whole wetland.
At a buffer scale of 500 m, the main plants of sampling points G1, G4, G11, G12, G13, and G15 are Blysmus sinocompressus, accounting for 73.58%, 56.35%, 45.88%, 51.81%, 33.70%, and 34.77%, respectively. Among them, G4 and G15 also have a large area of Salicornia europaea, sampling points G11 and G12 have a larger proportion of Thermopsis lanceolata, and G13 has a large area of Achnatherum splendens. The main plants of sampling points G2, G5, and G14 are Artemisia frigida Willd and Poa annua L., which account for 46.28%, 36.07%, and 21.78%, respectively. Among the points, G2 has a large area of Salicornia europaea, and G5 and G14 still contain Thermopsis lanceolata. The plant type of the G3 sampling point is relatively uniform and is mainly composed of the Blysmus sinocompressus, Artemisia frigida Willd, Poa annua L., and the Salicornia europaea. Salicornia europaea is one of the main plants of sampling points G6, G7, G8, and G9. Among the points, G7 and G8 also have a larger area of Artemisia frigida Willd and Poa annua L., and the area with Artemisia frigida Willd and Poa annua L. in G8 is larger than the area with Salicornia europaea. Sampling points G8 and G9 also have a large area of Achnatherum splendens. The plants near the G10 sampling point are mainly Carex tristachya and Triglochin palustre, followed by Blysmus sinocompressus. With buffers of 1000 and 1500 m, the main plant species near the sampling points did not change, and there was only a slight change in the proportion and species diversity.

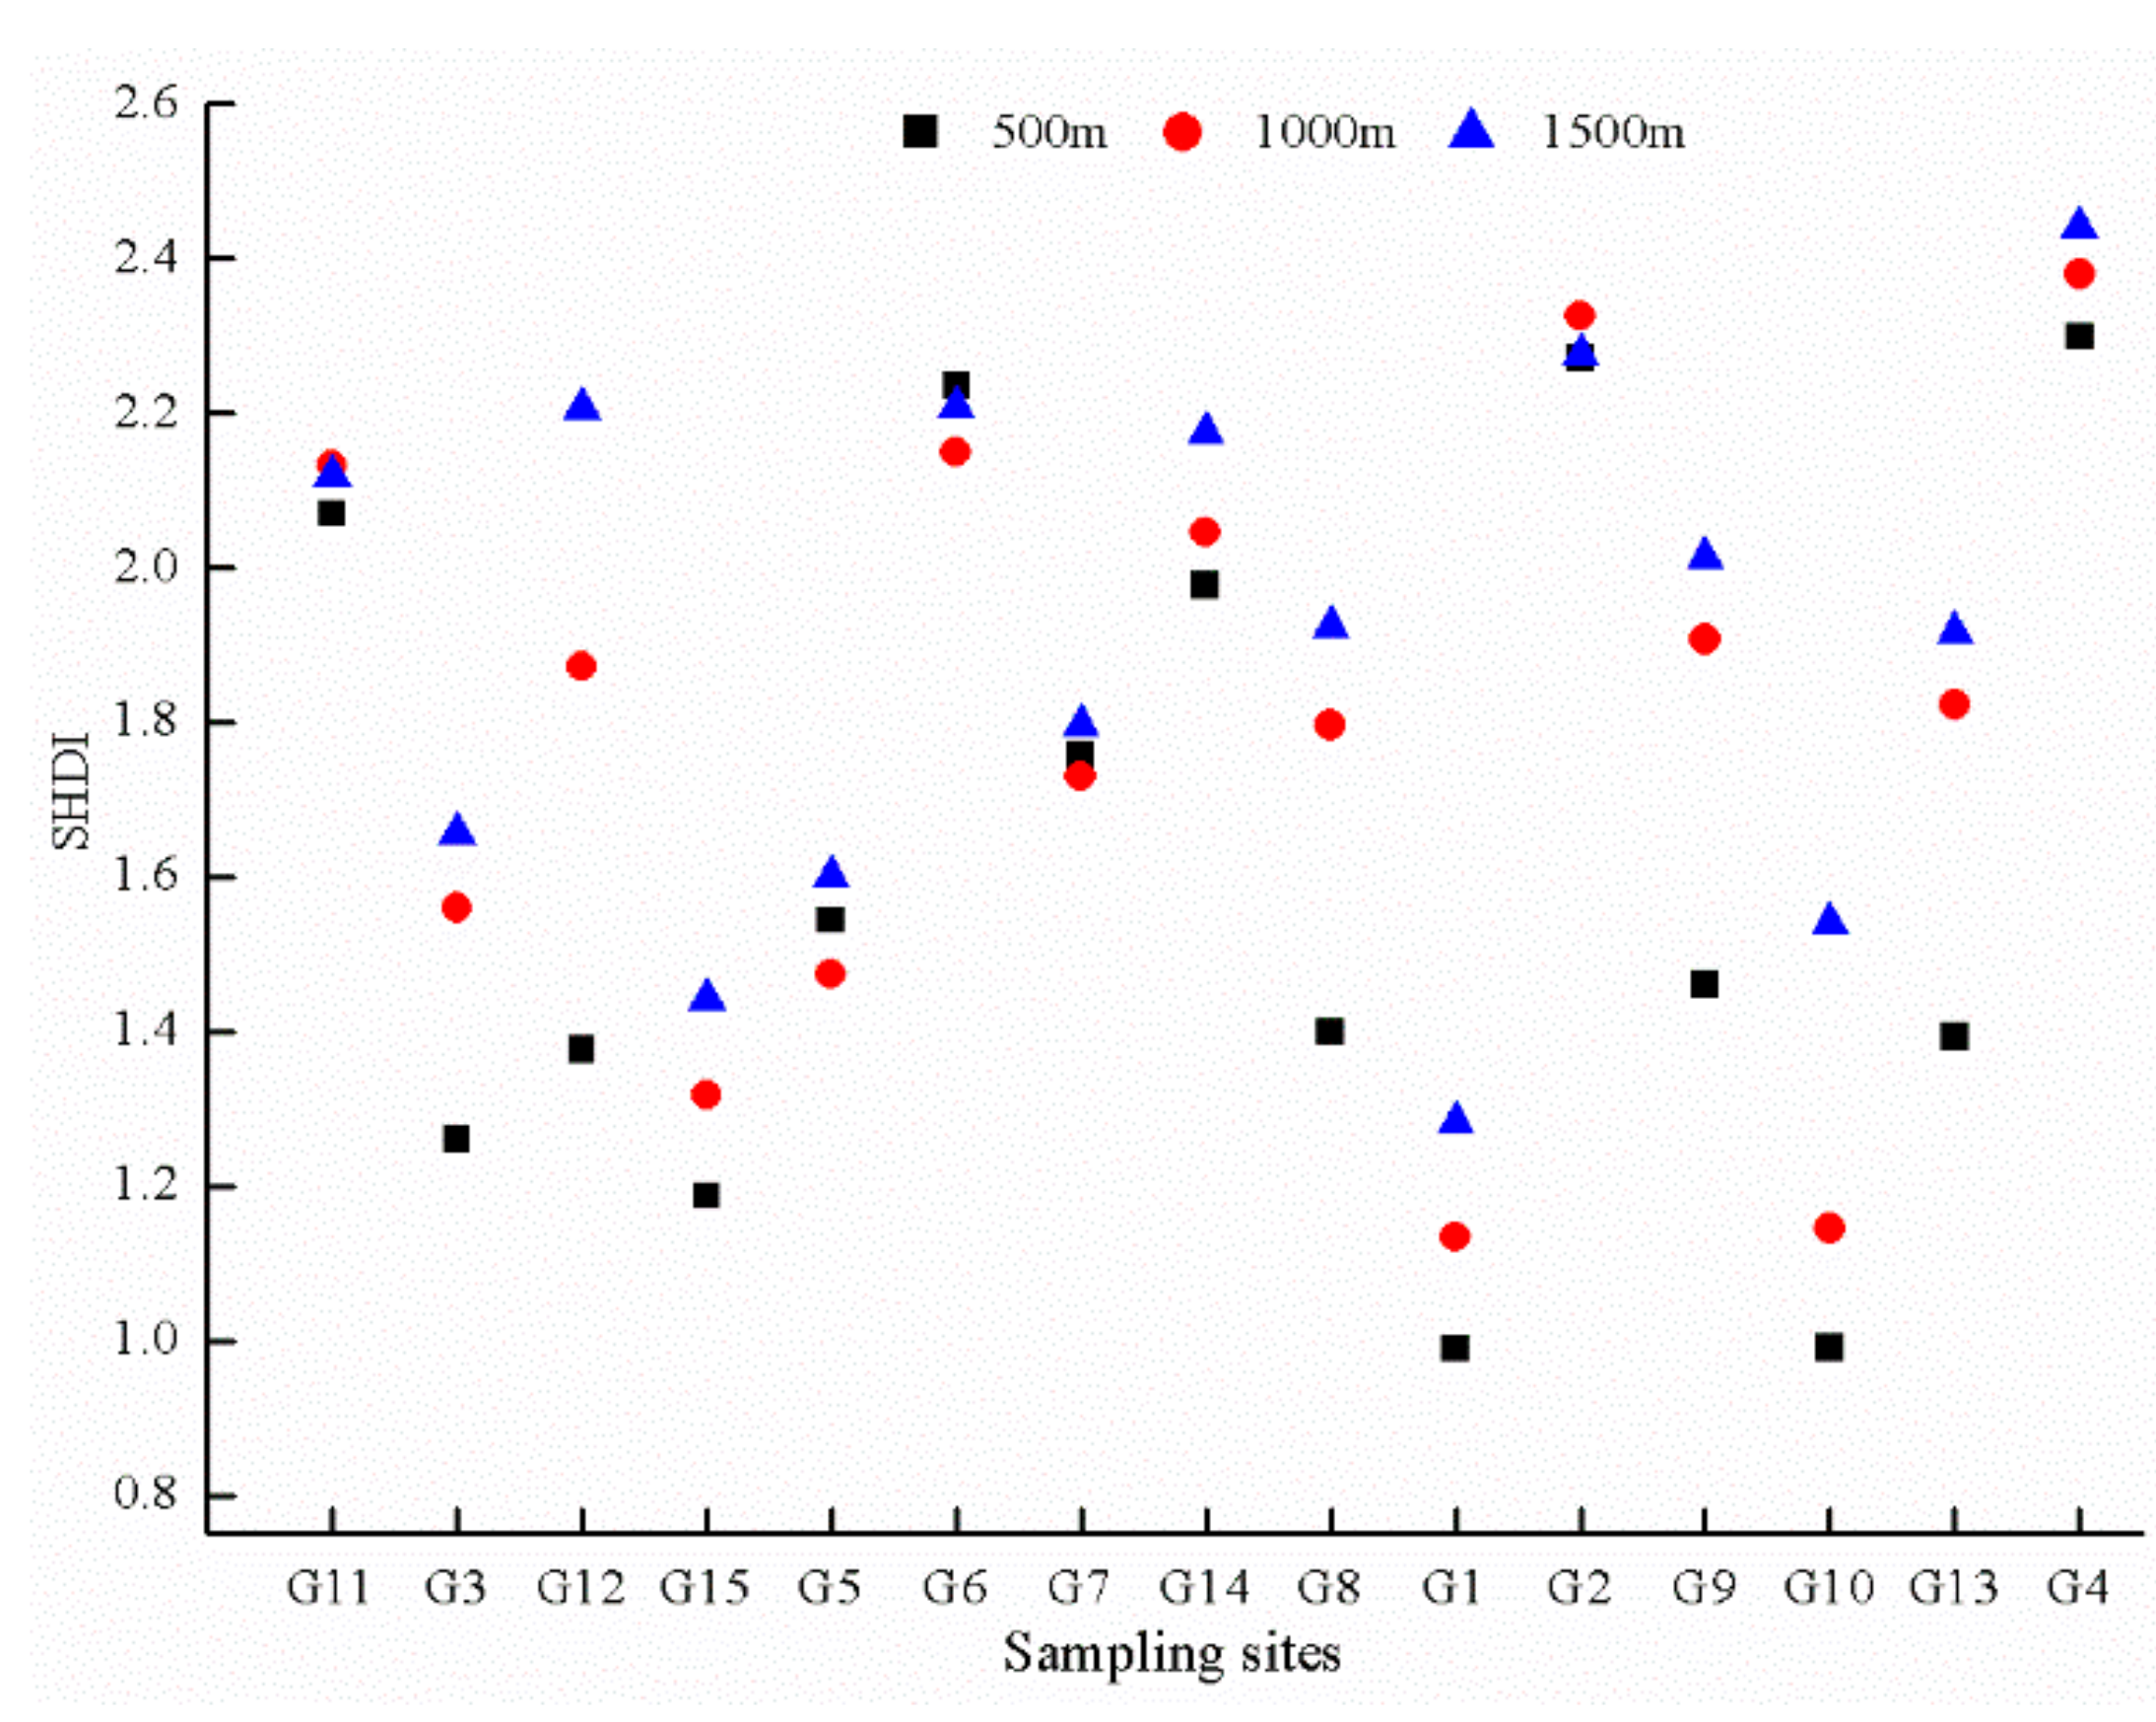
3.2.2. Species Diversity of Plants

SHDI can reflect the heterogeneity of a landscape. When SHDI = 0, the whole landscape consists of only one patch. However, when the value of SHDI increases, the types of patches increase, or each type shows a balanced distribution in the landscape. Through the variation of SHDI values at different sampling points (Figure 6), the SHDI value increases with an increase in the buffer scale. Although G2, G5, G6, and G11 are slightly different, the SHDI values of these sampling points under each buffer change little. There is a certain difference between the SHDI values at a 500 m buffer scale and other scales, and the SHDI values at the 1000 m buffer and the 1500 m buffer scale are relatively close. Thus, with an increase in buffer size, the abundance of plant species near the sampling point increases and the distribution is more uniform. When the buffer zone is greater than or equal to 1000 m, the abundance and uniformity of the plant species near the sampling point tend to be stable.
The SHDI values at the buffer scales of different sampling points ranged from 0.99 to 2.44, and the average values of SHDI at the 500, 1000, and 1500 m buffer scales were 1.61, 1.79, and 1.91, respectively, indicating that the plant species in the Sugan Lake Wetland were abundant. The SHDI values of G2, G4, G6, G11, and G14 are significantly higher than those of the other sampling points, and the values under different buffers are close. The SHDI values of sample points G8, G9, G10, G12, and G13 were significantly different in different buffers. The SHDI values of the G1, G10, and G15 sampling points are clearly lower than those of the other sampling points.

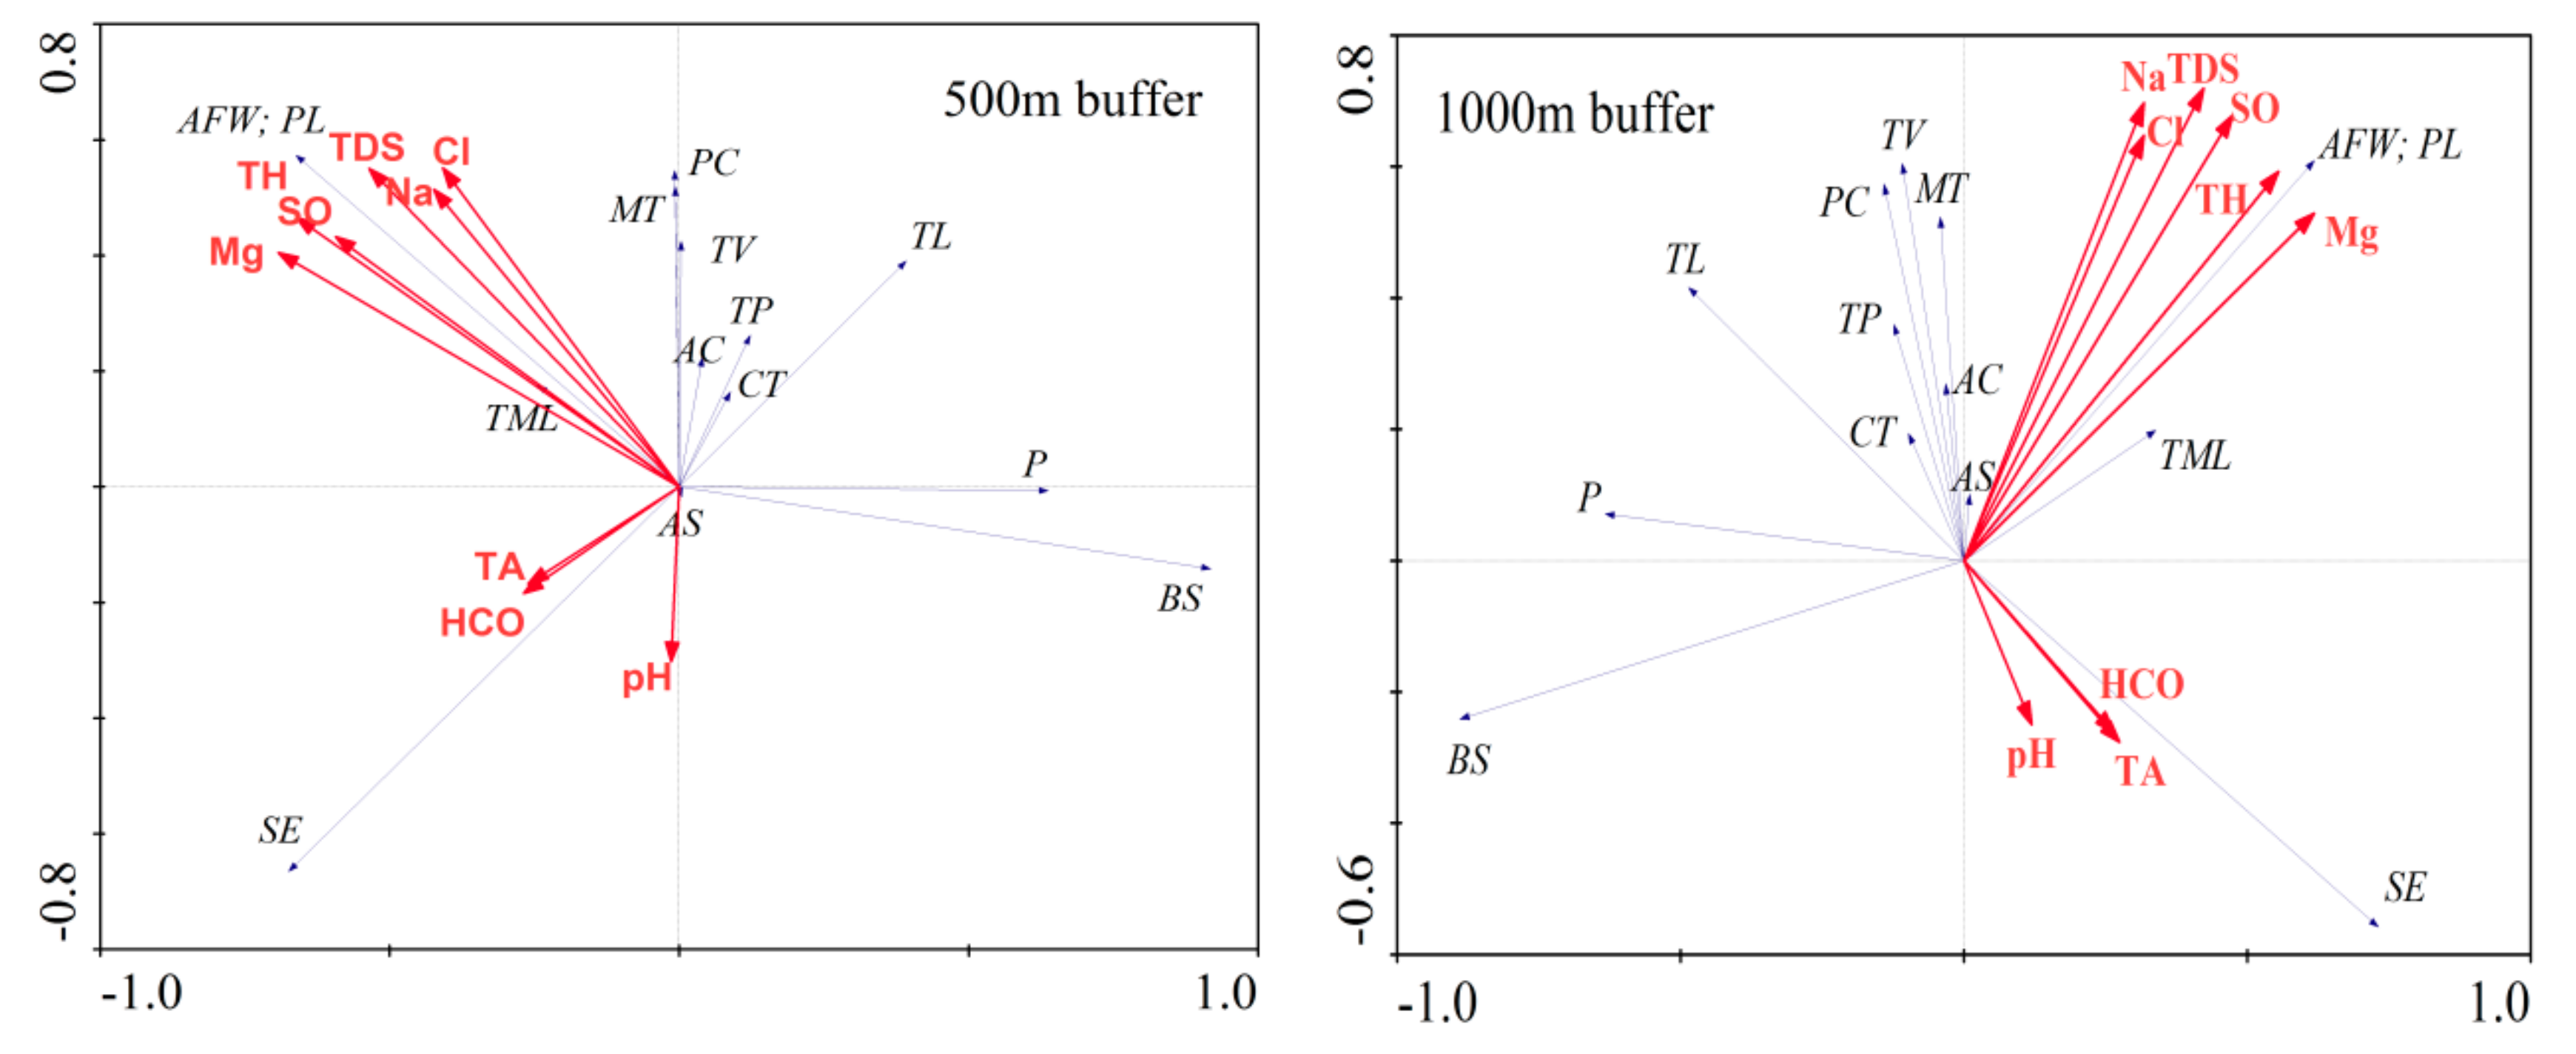
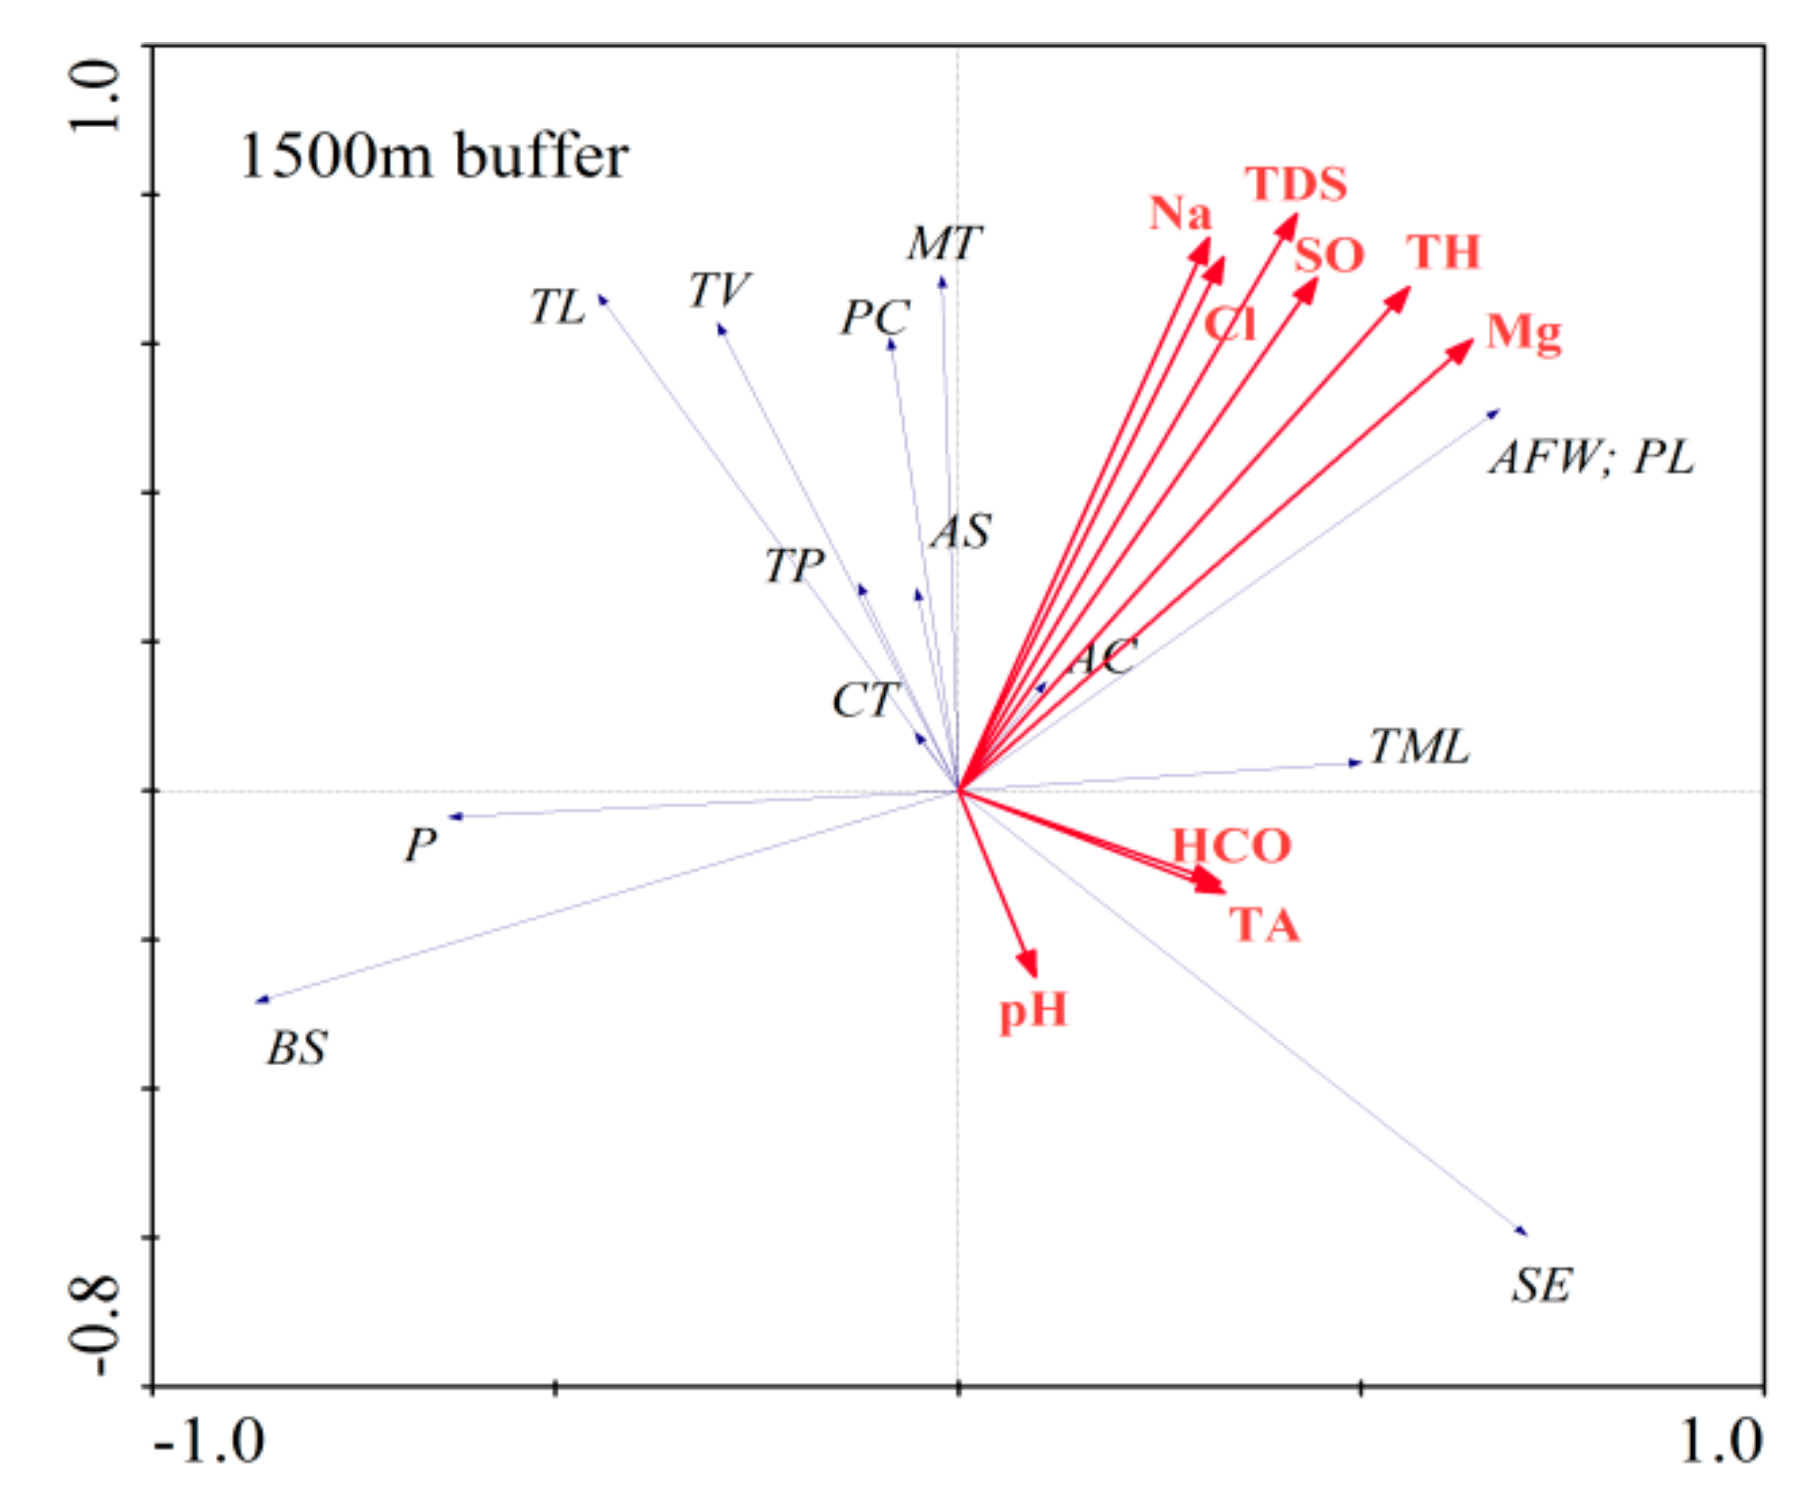
3.3. Relationship between Major Hydrochemical Components and Vegetation Distribution

The major hydrochemical parameters of the groundwater were analyzed by principal component analysis (Table 2), and three principal components were extracted. The variance contribution of the three principal components was 50.74%, 19.31%, and 15.65%, respectively, and the total cumulative contribution rate was 85.70% (Table 3). Mg2+, Na+, HCO3, Cl, and SO42−, together with pH, TDS, TH, and TA, were selected as the nine main components.
A redundant analysis was carried out by using the major components selected by principal component analysis and the percentage of plant types at different buffer scales to explore the relationship between the major hydrochemical components and the distribution of wetland plants. The results of the redundancy analysis (Figure 7) show that the correlations between the plants and the main hydrochemical parameters are consistent at the three buffer scales. There was a significant negative correlation between the Blysmus sinocompressus and Polygonum and other hydrochemistry parameters, except pH, indicating that the higher salinity in the groundwater of the Sugan Lake Wetland has an obvious inhibitory effect on the growth of Blysmus sinocompressus and Polygonum. The correlation with the pH is weak, mainly because pH presents weak alkalinity and has no obvious influence on the growth of various plants. Artemisia frigida Willd, Poa annua L., and Triglochin maritimum L. have a strong positive correlation with Cl, SO42−, Na+, Mg2+, TDS, and TH at the 500 and 1000 m buffer scales, indicating that the salt resistance of Artemisia frigida Willd, Poa annua L., and Triglochin maritimum L. is relatively strong, and the correlation is weakened at the 1500 m scale because there is a certain difference in the chemical characteristics of groundwater as the scale increases. Because the Salicornia europaea mainly grows around the saline–alkali land, it has a strong positive correlation with the total alkalinity and pH. Mulgedium tataricum, Phragmites communis, Carex tristachya, Achnatherum splendens, Triglochin palustre, and Agropyron cristatum showed a weak positive correlation with the major hydrochemical parameters and were negatively correlated with TA and pH, indicating that these plants have a certain salt resistance but are inhibited by the alkalinity of groundwater. There was a negative correlation between the Thermopsis lanceolata and the TA and a weak correlation with other major water chemical parameters, indicating that alkalinity is also a factor restricting the growth of the Thermopsis lanceolata, but it is less restricted by other hydrochemical indicators.

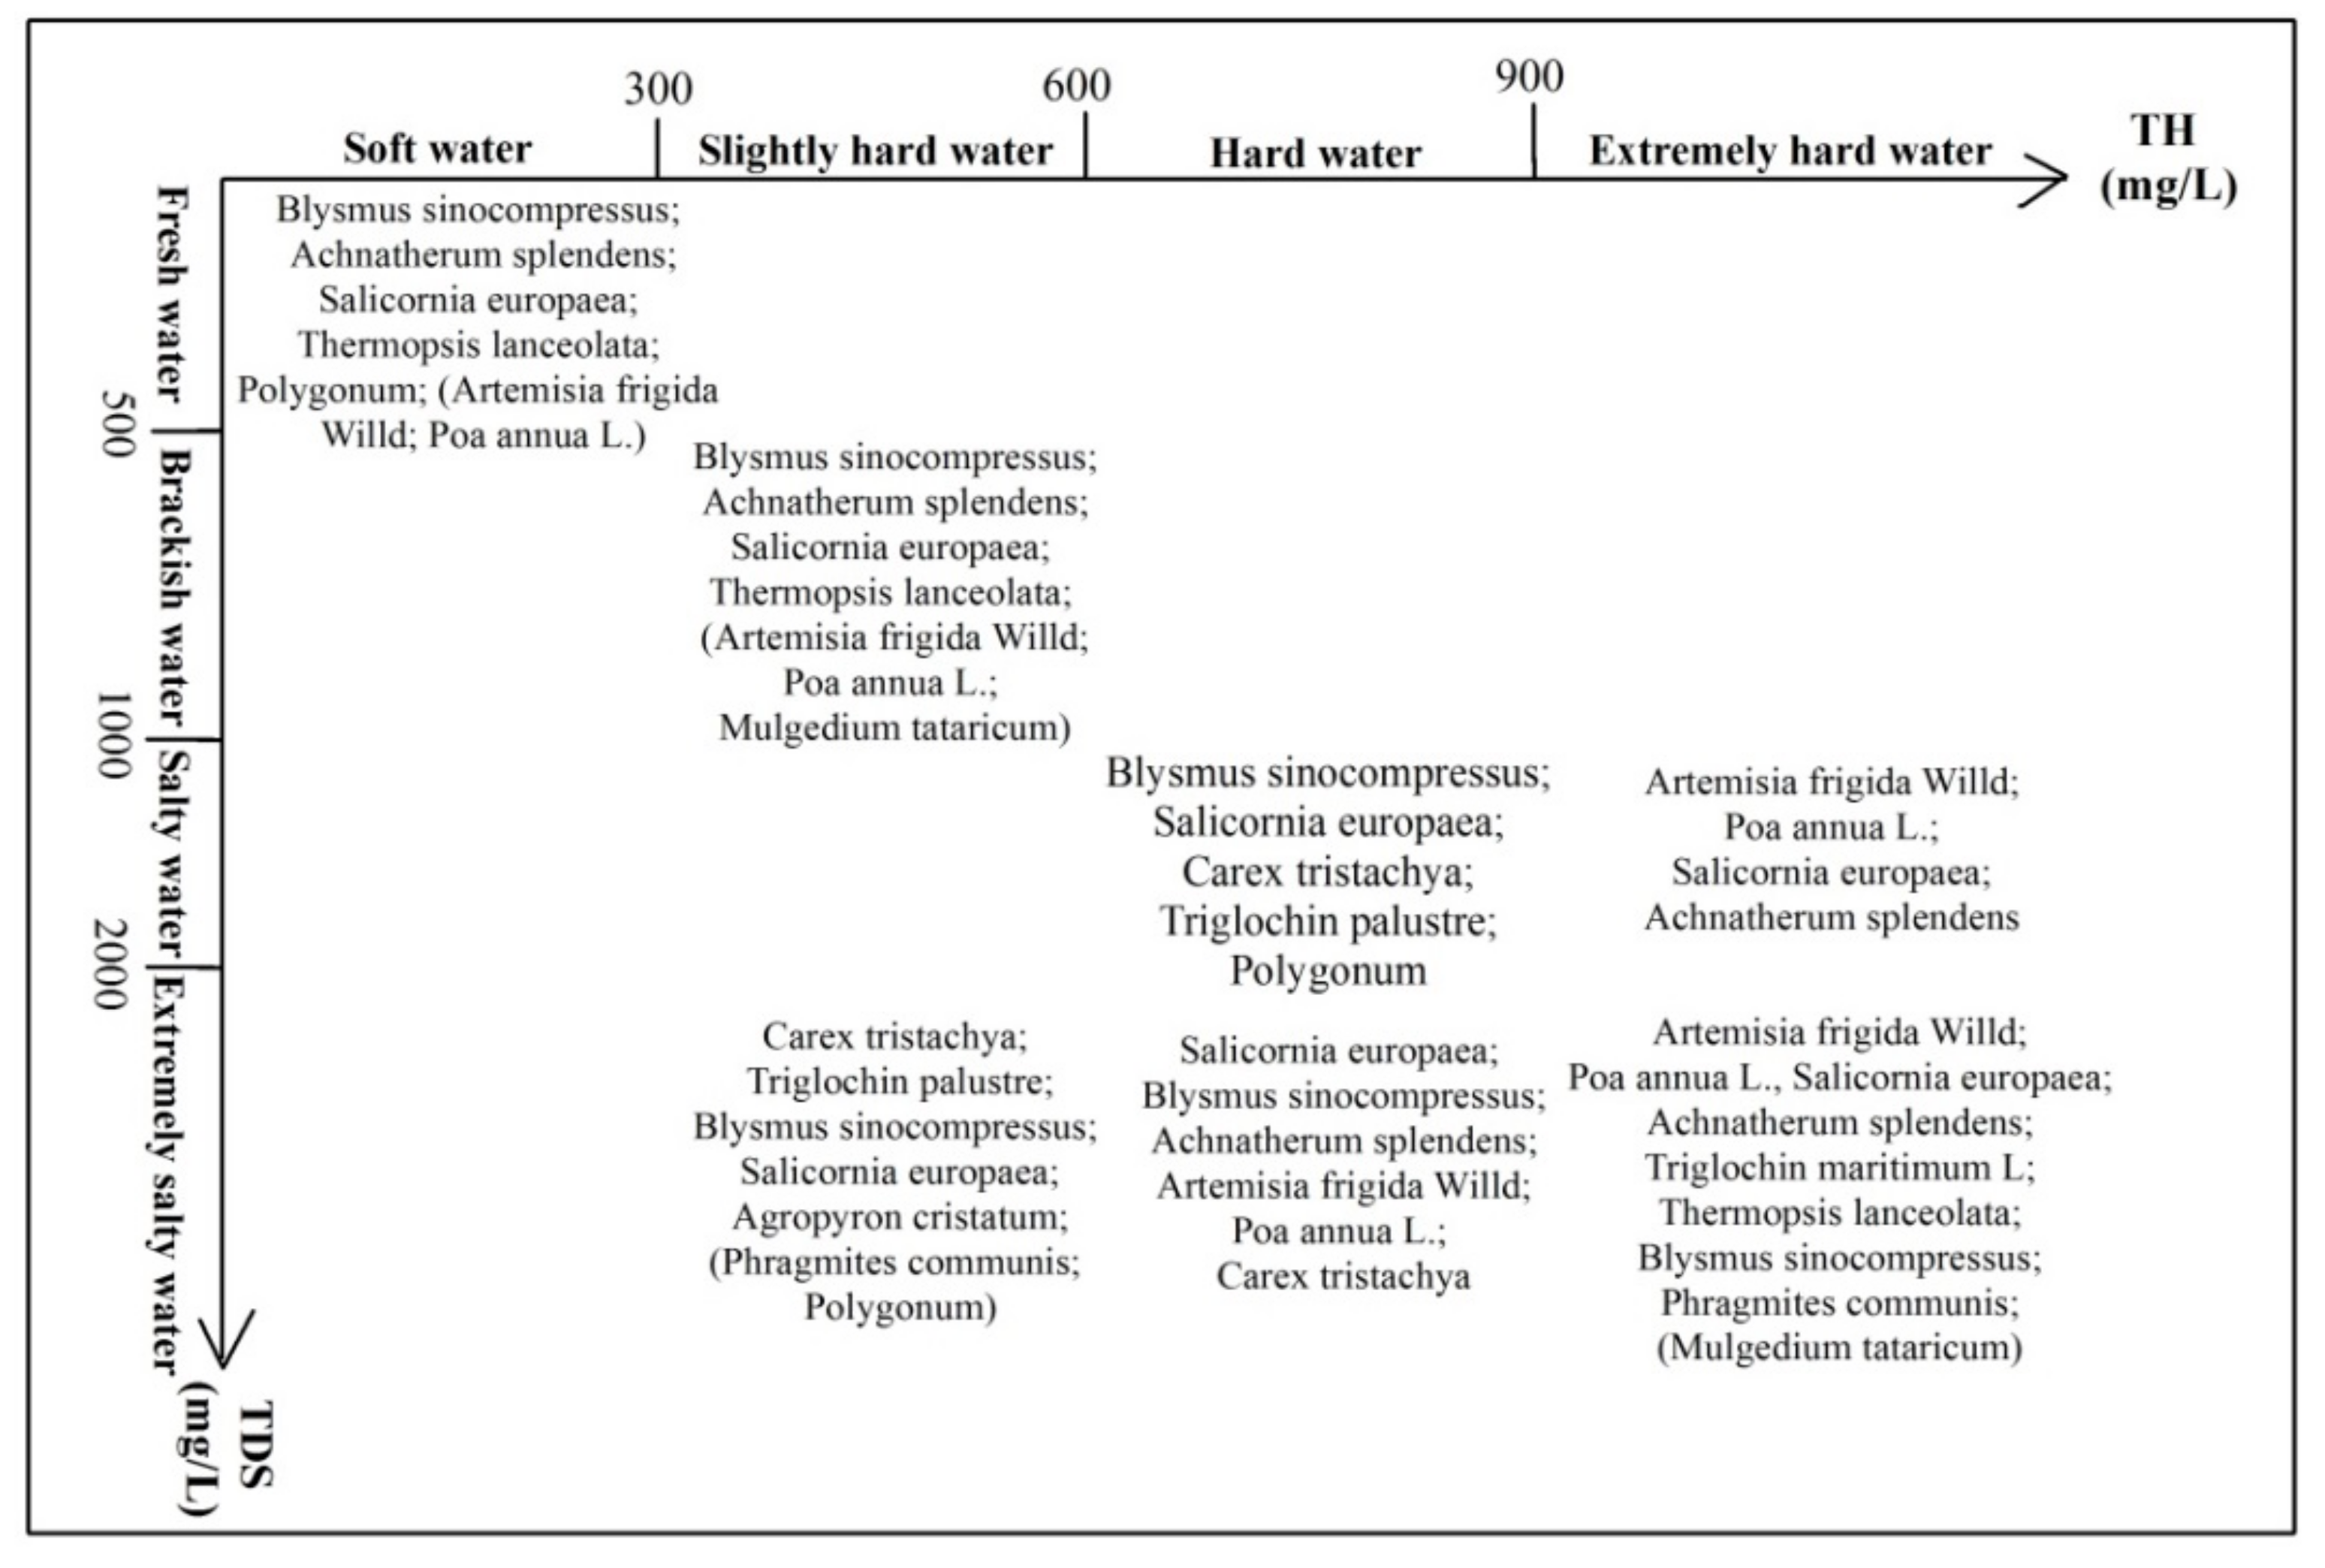
3.4. Relationship between Plant Distribution and Groundwater Quality

According to the TDS and TH of the groundwater in the wetland, the groundwater was divided into four grades [25]: fresh water, brackish water, salty water and extremely salty water, soft water, slightly water, hard water, and extremely hard water (Figure 8). According to the classification standard, the groundwater quality of all sampling points was divided, and G1, G4, G9, and G12 were found to be fresh and soft water; G2, G5, G7, and G14 are extremely salty and hard water; G3, G6, and G15 are salty and hard water; the G8 is salty and extremely hard water; G10 is extremely salty and slightly hard water; and G11 and G13 are brackish and slightly hard water.
A corresponding graph of the water quality type and plant species distribution was drawn (Figure 8). Due to the small changes in the dominant species of plants at the three buffer scales, the dominant species in the figure are still dominated by plants at the 500 m buffer scale, and the plants in brackets are of the type added at the 1000 and 1500 m buffer scales. It can be seen from the figure that Blysmus sinocompressus and Achnatherum splendens are mainly distributed near the sampling point where the salinity and hardness of the groundwater are low, which indicates that the Blysmus sinocompressus and Achnatherum splendens are more adapted to an environment with a better quality of groundwater. The distribution of Salicornia europaea is more extensive, but with an increase in salinity and hardness, the proportion of the Salicornia europaea increases gradually, mainly because the Salicornia europaea is primarily associated with saline–alkali land, and the salinity and hardness of groundwater near saline–alkali land tend to be relatively large. Artemisia frigida Willd and Poa annua L. are mainly distributed in areas where the groundwater is salty water, extremely salty water, or extremely hard water. Although there are also some distributions in areas where the salinity and hardness of the groundwater are low, these distributions mainly occur in areas outside the 500 m buffer zone with a small proportion, and there may be some differences between the nearby groundwater and the sampling points. Carex tristachya and Triglochin palustre are mainly distributed in areas with lower hardness but higher salinity of groundwater. Agropyron cristatum, Polygonum, and Phragmites communis have a small proportion at all buffer scales and are mainly distributed in areas with high salinity and hardness of groundwater. Mulgedium tataricum is found outside the 500 m buffer zone and grows in various water quality environments, so it is difficult to accurately judge its main living environment, which needs further research.

4. Discussion

As an important water source in the arid area, groundwater has an important impact on the distribution of vegetation. Different plants have large differences in the adaptation thresholds of the major ion concentration, TDS, and salinity of groundwater [26]. The vegetation will exhibit a spatial distribution pattern corresponding to changes in the groundwater’s chemical characteristics [27,28,29]. The suitable range of the key water-salt factors of groundwater in the Sugan Lake Wetland is obviously different. The concentration of major hydrochemical parameters of groundwater in the eastern part of the study area is relatively lower, so the plants in the eastern region are dominated by Blysmus sinocompressus, which has higher dominance, while the concentration of the major hydrochemical parameters of groundwater in northwest and southwest areas is higher, so Artemisia frigida Willd and Poa annua L. are mainly distributed in the northwest and southwest of the study area, and the northwestern region has the highest species diversity and the most uniform distribution of plant types.
Groundwater depth is one of the main factors affecting species diversity and vegetation distribution in wetlands [30,31]. The effects of the groundwater’s buried depth on vegetation are mainly manifested as oxygen stress, salinization stress, and water stress. Oxygen stress and salinization stress dominate shallow groundwater, while water stress dominates in deeper groundwater [32]. As the groundwater flows downward, the mixed effect of groundwater gradually decreases with an increase in depth. The groundwater salinity and the concentration of major ions change the most in shallow groundwater, and this change will gradually decrease as the depth increases [33,34]. The shallow groundwater in wetlands is the main area of vegetation root growth, and its hydrochemical composition directly affects the growth and development of vegetation [35]. The average depth of groundwater in the Sugan Lake Wetland is 1.77 m, which is relatively shallow, and the vegetation is obviously stressed by salt. The mineralization and concentration of major ions of groundwater first showed an increasing trend followed by a decreasing trend alongside an increase in groundwater depth, which is consistent with the results of previous research [33,34]. In addition, the study area belongs to the plateau inland wetland. With less precipitation and strong evaporation, the salt of shallow groundwater accumulates, and as the depth increases, the cumulative effect gradually weakens.
The adaptation thresholds of wetland vegetation to key factors of water-salt in groundwater are different in different environments, and the influence of water-salt factors on plant species diversity is also different. An Lesheng [14] studied the relationship between the key factors of water-salt and vegetation in the Yellow River Delta and found that the suitable range of Cl in groundwater for Phragmites communis growth in this area is 10~150 (mg/L), while the suitable range for Phragmites communis is basically above 491 (mg/L). In addition, previous studies have found that the lower the groundwater salinity in coastal wetlands, the richer the species diversity of plants [12]. In the Sugan Lake Wetland, the groundwater with lower salinity has a lower species diversity, while the regions with higher salinity have higher diversity. Mainly because the Sugan Lake Wetland is located in the inland plateau region, with less precipitation and strong evaporation, the salinity of its groundwater is generally high, and its average concentration of Na+, Cl, SO42−, and TDS reaches 366.08 (mg/L), 576.08 (mg/L), 588.87 (mg/L), and 1940.42 (mg/L), respectively. Therefore, the salt resistance of plants in the study area is generally stronger, and there are also many salt-resistance species, thereby making the species diversity richer in the environment with relatively higher salinity.
The water transfer project plans to transfer 100 million m3 of water per year from the Big Haerteng River. Significant water transfer will inevitably have a significant impact on the Sugan Lake Wetland. Water transfer directly affects the groundwater level and water chemistry of wetlands. If the groundwater level drops and the salinity increases, the species with stronger salt resistance may be more widely distributed, while the living space of plants with weaker salt resistance may be compressed or disappear. Some species may also mutate to adapt to the environment to form new species. In any case, the original vegetation distribution pattern and species diversity will change. Further, the original ecosystem of the wetland will also change, but the specific impact process needs further research.

5. Conclusions

Based on the analysis of the groundwater chemical characteristics, species diversity, and the distribution of plants in the Sugan Lake Wetland, the relationship between the species diversity and chemical characteristics of different species and chemical characteristics of groundwater has been studied. It was found that the hydrochemistry of groundwater in the Sugan Lake Wetland has obvious spatial differences. The concentration of hydrochemical parameters in the eastern part of the wetland is generally low. The northwest part of the wetland is located in the southern foot of the A-erh-chin Mountains and features the highest concentration, followed by the southwest. With an increase in groundwater depth, the concentration of the hydrochemical parameters of groundwater showed a trend of increasing first and then decreasing. The Blysmus sinocompressus and Polygonum are adapted to an environment with low groundwater salinity and hardness, and the salt resistance of Artemisia frigida Willd, Poa annua L., and Triglochin maritimum L. is stronger. Higher alkalinity has an inhibitory effect on most vegetation, except for the Salicornia europaea, which is not conducive to the diversity of wetland species. The higher or lower salinity and hardness of the groundwater in the Sugan Lake Wetland are not conducive to species diversity.
Government managers should strengthen the monitoring of wetland groundwater environments and formulate corresponding standards based on the concentration of groundwater hydrochemical indicators suitable for growing vegetation to prevent the degradation of vegetation and even the degradation of the ecological environment caused by the deterioration of water quality. In addition, impacts on the groundwater environment should not exceed the adaptation threshold of the vegetation when implementing various engineering constructions. This is also the road to sustainable development in line with China’s SDGs.

Author Contributions

Conceptualization, J.Z.; data curation, L.W., G.Z. (Guofeng Zhu), W.F. and L.L.; formal analysis, M.H.; funding acquisition, J.Z. and G.Z. (Guofeng Zhu); investigation, L.L.; methodology, J.X., G.Z. (Guoshuang Zhong), C.L. and Q.L.; Software, D.X. and Y.Z.; supervision, J.Z.; Writing—original draft, J.X.

Funding

This research was financially supported by the National Natural Science Foundation of China (41761047, 41661005, and 41661084), the National Natural Science Foundation innovation research group science foundation of China (41421061), and the Autonomous project of State Key Laboratory of Cryosphere Sciences (SKLCS-ZZ-2017).

Acknowledgments

I would like to thank the anonymous referees for their helpful comments and suggestions. I am also grateful to editors for their support in the processing of the article.

Conflicts of Interest

The authors declare no conflict of interest.

References

  1. Song, P.; Huang, G.; An, C.; Zhang, P.; Chen, X.; Ren, S. Performance analysis and life cycle greenhouse gas emission assessment of an integrated gravitational-flow wastewater treatment system for rural areas. Environ. Sci. Pollut. Res. 2019, 26, 25883–25897. [Google Scholar] [CrossRef] [PubMed]
  2. Han, B.; Meng, N.; Zhang, J.; Cai, W.; Wu, T.; Kong, L.; Ouyang, Z. Assessment and Management of Pressure on Water Quality Protection along the Middle Route of the South-to-North Water Diversion Project. Sustainability 2019, 11, 3087. [Google Scholar] [CrossRef]
  3. Dahlgren, R.A.; Richards, J.H.; Yu, Z. Soil and groundwater chemistry and vegetation distribution in a desert playa, Owens Lake, California. Arid. Soil Res. Rehabil. 1997, 11, 221–244. [Google Scholar] [CrossRef]
  4. Zhu, J.T.; Yu, J.J.; Wang, P.; Yu, Q.; Eamus, D. Distribution patterns of groundwater-dependent vegetation species diversity and their relationship to groundwater attributes in northwestern China. Ecohydrology 2013, 6, 191–200. [Google Scholar] [CrossRef]
  5. Yao, Y.; Zheng, C.; Liu, J.; Cao, G.L. Conceptual and numerical models for groundwater flow in an arid inland river basin. Hydrol. Process. 2015, 29, 1480–1492. [Google Scholar] [CrossRef]
  6. Gries, D.; Zeng, F.; Foetzki, A.; Arndt, S.K.; Bruelheide, H.; Thomas, F.M.; Runge, M. Growth and water relations of Tamarix ramosissima and Populus euphratica on Taklamakan desert dunes in relation to depth to a permanent water table. Plant Cell Environ. 2003, 26, 725–736. [Google Scholar] [CrossRef]
  7. Hipondoka, M.H.T.; Aranibar, J.N.; Chirara, C.; Lihavha, M.; Macko, S.A. Vertical distribution of grass and tree roots in arid ecosystems of Southern Africa: Niche differentiation or competition? J. Arid Environ. 2003, 54, 319–325. [Google Scholar] [CrossRef]
  8. An, L.S. Water-Salt Characters of Groundwater and Ecological in the Yellow River Delta. Ph.D. Thesis, Ocean University of China, Qingdao, China, 2012. [Google Scholar]
  9. Brunel, J.P. Sources of water used by natural mesquite vegetation in a semi-arid region of northern Mexico. Int. Assoc. Sci. Hydrol. Bull. 2009, 54, 375–381. [Google Scholar] [CrossRef]
  10. Mata-González, R.; Mclendon, T.; Martin, D.W.; Trlic, M.J. Vegetation as affected by groundwater depth and microtopography in a shallow aquifer area of the Great Basin. Ecohydrology 2012, 5, 54–63. [Google Scholar] [CrossRef]
  11. Chen, M.J.; Zhang, Q.X.; Wang, Y.; Yan, L.; Deng, W. Critical depth of recharge of the vegetation by groundwater in the West Liaohe Plain. Adv. Water Sci. 2019, 30, 24–33. [Google Scholar] [CrossRef]
  12. Antonellini, M.; Mollema, P.N. Impact of groundwater salinity on vegetation species richness in the coastal pine forests and wetlands of Ravenna, Italy. Ecol. Eng. 2010, 36, 1201–1211. [Google Scholar] [CrossRef]
  13. Jia, H.J.; Li, S.; Hao, J.; Song, H.J.; Guo, D.G. Study on the Relationship between Water Factors and Plant Diversity of Wetland in the Middle Reaches of the Yellow River (Longmen-Fenhe River into the Yellow River Entrance). J. Shanxi Agric. Sci. 2017, 45, 1325–1330. [Google Scholar] [CrossRef]
  14. An, L.S.; Zhao, Q.S.; Ye, S.Y.; Liu, G.Q.; Ding, X.G. Water-salt interactions factors and vegetation effects in the groundwater ecosystem in Yellow River Delta. Adv. Water Sci. 2011, 22, 689–695. [Google Scholar]
  15. Zhao, F.; Jin, H.L. Study on characteristics of groundwater and its impact on Populus euphratica along the banks of Aqikesu River. J. Arid Land Resour. Environ. 2011, 25, 186–188. [Google Scholar] [CrossRef]
  16. Feng, Y.; Sun, T.; Zhu, M.S.; Qi, M.; Yang, W.; Shao, D.D. Salt marsh vegetation distribution patterns along groundwater table and salinity gradients in yellow river estuary under the influence of land reclamation. Ecol. Indic. 2018, 92, 82–90. [Google Scholar] [CrossRef]
  17. Liu, H.; Zhao, W.Z.; Li, Z.K. Ecohydrology of Groundwater Dependent Ecosystems: A Review. Adv. Earth Sci. 2018, 33, 741–750. [Google Scholar] [CrossRef]
  18. Howard, J.; Merrifield, M. Mapping groundwater dependent ecosystems in California. PLoS ONE 2010, 5, e11249. [Google Scholar] [CrossRef]
  19. Lv, J.; Wang, X.S.; Zhou, Y.; Qian, K.Z. Groundwater-dependent distribution of vegetation in Hailiutu River catchment, a semi-arid region in China. Ecohydrology 2013, 6, 142–149. [Google Scholar] [CrossRef]
  20. Peters, J.; Bde, B.; Samson, R.; Verhoest, E.C. Modelling groundwater-dependent vegetation patterns using ensemble learning. Hydrol. Earth Syst. Sci. 2008, 12, 603–613. [Google Scholar] [CrossRef] [Green Version]
  21. Zhang, B. Numerical Simulation of Water Cycle Response in the Sugan Lake Basin under the Influence of Inter-Basin Water Transfer Project; China Institute of Water Resources and Hydropower Research: Beijing, China, 2018. [Google Scholar]
  22. Qiang, M.R.; Chen, F.H.; Zhang, J.W.; Gao, S.Y.; Zhou, A.F. Climate change recorded by stable isotope records of carbonate deposits in Sugan Lake near 2ka. Sci. Bull. 2005, 50, 1385–1393. [Google Scholar] [CrossRef]
  23. Sadyś, M.; Strzelczak, A.; Grinn-Gofroń, A.; Kennedy, R. Application of redundancy analysis for aerobiological data. Int. J. Biometeorol. 2015, 59, 25–36. [Google Scholar] [CrossRef] [PubMed]
  24. Cui, L.J.; Li, W.; Gao, C.J.; Zhang, M.Y.; Zhao, X.S.; Yang, Z.; Lei, Y.R.; Huang, D.; Ma, W. Identifying the influence factors at multiple scales on river water chemistry in the Tiaoxi Basin, China. Ecol. Indic. 2018, 92, 228–238. [Google Scholar] [CrossRef]
  25. Xiao, J.; Jin, Z.D.; Wang, J.; Zhang, F. Hydrochemical characteristics, controlling factors and solute sources of groundwater within the Tarim River Basin in the extreme arid region, NW Tibetan Plateau. Quat. Int. 2015, 380, 237–246. [Google Scholar] [CrossRef]
  26. Zhao, F. Study on Characteristics of the Groundwater and Soil and their Impacts on Typical Plants along the Banks of Aqikesu River. Ph.D. Thesis, Xinjiang Normal University, Urumqi, China, 2008. [Google Scholar]
  27. Zhao, F.J.; Liu, H.Y.; Yin, Y.; Hu, G.Z. Vegetation succession prevents dry lake beds from becoming dust sources in the semi-arid steppe region of China. Earth Surf. Processes Landf. 2011, 36, 864–871. [Google Scholar] [CrossRef]
  28. Xia, J.B.; Zhao, X.M.; Liu, J.H.; Zhao, Z.G.; Liu, Q.; Chen, Y.P. Environmental factors influencing the distribution of Tamarix chinensis Lour in the Laizhou Bay wetland of the Yellow River Delta. Acta Ecol. Sin. 2016, 36, 4801–4808. [Google Scholar] [CrossRef]
  29. Cheng, G.S.; Liu, D.W.; Wen, L.; Liu, H.M.; Dong, S.G.; Wang, L.X. Effects of Groundwater and Soil Chemical Properties on Distribution of Natural Vegetation around Playa. Arid Zone Res. 2019, 36, 85–94. [Google Scholar] [CrossRef]
  30. Li, X.; Xie, Y.H.; Huang, J.S.; Chen, X.S. Research Progresses on the Formation Mechanism of Vegetation Distribution Pattern in Wetlands. Wetl. Sci. 2009, 7, 280–288. [Google Scholar] [CrossRef]
  31. Ma, Y.L. Study Shallow Groundwater Table Dynamics and its Relationships with Vegetation based on Visual Modflow in the Yellow River Delta. Master’s Thesis, Northwest A&F University, Xi’an, China, 2014. [Google Scholar]
  32. Huang, F.; Zhang, D.R.; Chen, X. Vegetation Response to Groundwater Variation in Arid Environments: Visualization of Research Evolution, Synthesis of Response Types, and Estimation of Groundwater Threshold. Int. J. Environ. Res. Public Health 2019, 16, 1849. [Google Scholar] [CrossRef]
  33. Pebesma, E.J. Mapping Groundwater Quality in the Netherlands. In Nederlandse Geografische Studies; Koninklijk Nederlands Aardrijkskundig Genootschap: Utrecht, The Netherlands; Volume 199.
  34. Junk, G.A.; Spalding, R.F.; Richard, J.J. Areal, Vertical, and Temporal Differences in Ground Water Chemistry: II. Organic Constituents1. J. Environ. Qual. 1980, 9, 479–483. [Google Scholar] [CrossRef]
  35. Schot, P.P.; Pieber, S.M. Spatial and temporal variations in shallow wetland groundwater quality. J. Hydrol. 2012, 422, 43–52. [Google Scholar] [CrossRef]
Figure 1. Location of study area and sampling sites.
Sustainability 11 05022 g001
Figure 2. Concentration of the groundwater chemical parameters at different sampling sites.
Sustainability 11 05022 g002
Figure 3. Piper diagrams of groundwater in different buried depths (Figure (a) is divided into three types according to the depth of groundwater: 0–1 m, 1–2 m, and >2 m; Figure (b) is divided into three regions according to the location of the sampling site in the study area: eastern, northwestern, southwestern).
Sustainability 11 05022 g003
Figure 4. Vegetation distribution in the Sugan Lake Wetland.
Sustainability 11 05022 g004
Figure 5. Percentage of vegetation and cover types at different scales (SAL: Saline-alkali land; W: Water; PC: Phragmites communis; AFW: Artemisia frigida Willd; PL: Poa annua L.; TML: Triglochin maritimum L; TP: Triglochin palustre; SE: Salicornia europaea; MT: Mulgedium tataricum; TL: Thermopsis lanceolata; CT: Carex tristachya; AS: Achnatherum splendens; AC: Agropyron cristatum; P: Polygonum; BS: Blysmus sinocompressus; TV: Tripolium vulgare).
Sustainability 11 05022 g005
Figure 6. Species diversity of plant at different scales.
Sustainability 11 05022 g006
Figure 7. Redundancy analysis of plant types and major parameters in groundwater (PC: Phragmites communis; AFW: Artemisia frigida Willd; PL: Poa annua L.; TML: Triglochin maritimum L; TP: Triglochin palustre; SE: Salicornia europaea; MT: Mulgedium tataricum; TL: Thermopsis lanceolata; CT: Carex tristachya; AS: Achnatherum splendens; AC: Agropyron cristatum; P: Polygonum; BS: Blysmus sinocompressus; TV: Tripolium vulgare).
Sustainability 11 05022 g007aSustainability 11 05022 g007b
Figure 8. The relationship between groundwater quality types and plant distribution (in the figure, the percentage of plants gradually decreases from left to right and from top to bottom).
Sustainability 11 05022 g008
Table 1. The major physical and chemical parameters in the groundwater (CV: Coefficient of variation; SD: Standard Deviation; CV and pH without unit, unit of other parameters: mg/L).
Ca2+Mg2+Na+K+HCO3ClSO42−NO3pHTDSTHTA
Mean110.75 124.82366.0842.67220.48576.08588.8719.527.861940.42790.52181.87
Max320.60367.001348.00318.00713.902677.001625.0079.398.806346.002312.00585.50
Min18.808.0019.901.6019.5018.4073.000.787.05257.50108.1032.00
SD91.07104.32424.9980.81151.85721.85516.1228.2811.391763.17571.56117.29
CV0.820.841.16 1.89 0.69 1.25 0.881.451.45 0.91 0.72 0.64
Table 2. Principal component analysis of major parameters (TDS: total dissolved solids; TH: total hardness; TA: total alkalinity).
Component 1Component 2Component 3
Ca2+0.613−0.373−0.601
Mg2+0.9490.123−0.057
Na+0.9360.0130.245
K+0.6690.0370.597
HCO30.1860.931−0.171
Cl0.9370.0520.250
SO42−0.827−0.270−0.240
NO30.019−0.5850.158
TDS0.992−0.0340.079
pH−0.0130.0770.905
TH0.936−0.048−0.268
TA0.1800.931−0.159
Table 3. Cumulative contribution rate.
ComponentVariance Contribution Rate %Total Cumulative Contribution Rate %
150.7450.74
219.3170.05
315.6585.70

