Article

Optimizing Nitrogen and Residue Management to Reduce GHG Emissions while Maintaining Crop Yield: A Case Study in a Mono-Cropping System of Northeast China

1
Key Laboratory of Agri-information Service Technology, Ministry of Agriculture / Agricultural Information Institute, Chinese Academy of Agricultural Sciences, Beijing 100081, China
2
CAAS-UNH Joint Laboratory for Sustainable Agro-Ecosystem / Institute of Agricultural Resources and Regional Planning, Chinese Academy of Agricultural Sciences, Beijing 100081, China
3
College of Environmental and Resource Sciences, Zhejiang University, Hangzhou 310058, China
4
NSW Department of Primary Industries, Wagga Wagga Agricultural Institute, Wagga Wagga, NSW 2650, Australia
5
CSIRO Agriculture and Food, GPO Box 17000, Canberra, ACT 2601, Australia
6
Institute of Applied Ecology, Chinese Academy of Sciences, Shenyang 110016, China
7
Chinese Academy of Agricultural Sciences, Beijing 100081, China
*
Authors to whom correspondence should be addressed.
Sustainability 2019, 11(18), 5015; https://doi.org/10.3390/su11185015
Submission received: 16 August 2019 / Revised: 5 September 2019 / Accepted: 8 September 2019 / Published: 13 September 2019

Abstract

:
Reducing the use of nitrogen fertilizers and returning straw to field are being promoted in northeast China (NEC). In this paper, the agricultural production system model (APSIM) was applied to assess the long-term variations of crop yield and soil GHG emissions in a maize mono-cropping system of NEC, and the simulation results were combined with lifecycle assessment to estimate annual GHG emissions (GHGL) and GHG emission intensity (GHGI, GHG emissions per unit yield) of different agricultural practices. Under current farmers’ practice, emissions due to machinery input (including production, transportation, repair, and maintenance) and soil organic carbon (SOC) decline accounted for 15% of GHGL, while emissions from nitrogen fertilizer input (production and transportation) and direct N2O emissions from soil accounted for the majority (~60% of GHGL). Current farmers’ practice in terms of N application and residue management are nearly optimal for crop production but not for climate change mitigation. Reducing N input by 13% and increasing straw retention by 20% can maintain crop yield and SOC, and also reduce GHGL and GHGI by 13% and 11%, respectively. However, it is not feasible to incorporate the straw used as household fuel into soil, which could incur substantial fossil CO2 emissions of 3.98 Mg CO2-eq ha−1 resulting from the substitution of coal for straw. APSIM was successful in simulating crop yield, N2O emissions, and SOC change in NEC, and our results highlight opportunities to further optimize management strategies (especially for the nitrogen and straw management) to reduce GHG emissions while maintaining crop yield.

1. Introduction

Agricultural production has a significant impact on global climate change. About 65% of global nitrous oxide (N2O) emissions derive from agricultural soils, mainly attributed to nitrogen (N) fertilizer application [1]. China is the largest N2O emitter, accounting for 31% of global emissions [2]. Agricultural soils may be a significant sink or source of atmospheric CO2 depending on agricultural practices. For example, some management practices, such as residue removal or burning, can lead to soil C decline and exacerbate gaseous emissions [3,4], while other management practices (e.g., returning residue, adding manures) can reduce C losses or enhance C sequestration in agricultural soils [5,6]. Increasing SOC stocks of agricultural soils (top 1 m of soil) by 0.4% can offset about 30% of global greenhouse gas emissions [7]. However, SOC change is tended to be ignored when estimating GHG emissions of different management in the short term [8,9,10,11]. In addition to the soil CO2 and N2O emissions, CO2 emissions from agricultural inputs (e.g., fuel combustion, production, transportation, and application of fertilizers, pesticides, etc.) are also a significant component of the carbon footprint [12,13].
In China, cropping systems for grain production are a net source of GHG emissions from a lifecycle perspective [14], and it is of significance to assess the mitigation potential of different management practices in agriculture. N fertilizer is being overused at a national scale, and thus optimizing N management is a priority for sustainable agriculture [15]. Incorporating crop straw into soil could mitigate GHG emissions; however, when the straw used as household fuel is returned to the field, farmers may have to use fossil fuels instead and emit fossil CO2 to the atmosphere, which is rarely considered when promoting straw retention [7,14,16,17]. Additionally, previous studies have included CO2 emissions from fossil fuel consumed by machines on cropland in China [9,14,18,19], and a detailed accounting of machinery emissions from manufacture, transportation, and repair and maintenance is still lacking because of the complexity of farmers’ practices and limited data availability.
Maize (Zea mays L.) is one of the most widely grown cereal crops in the world. Improving the management of maize systems will have a significant effect on global food security and the environment. In Northeast China (NEC), rainfed mono-cropping maize is widely grown. About 65% of croplands are cultivated for maize, accounting for 33% of the total maize-growing areas and 36% of the total maize yield in China [20]. The Chinese government is trying to control nitrogen fertilizer usage and promote straw retention for sustainable development of agriculture in NEC [21]. Thus, understanding how GHG emissions and maize yield respond to management practices in NEC will provide useful information to assess the potential of maize systems to maintain or increase yield and mitigate GHG emissions and climate change.
A systems approach is required to assess the crop yield variation impacted by long-term climate variability and management interventions, and to account for GHG emissions from the production system. Simulation modelling combined with a lifecycle analysis provides an effective means for such an assessment. The APSIM (agricultural production system model) simulates the responses of both productivity and environmental impacts (e.g., soil carbon change, GHG emissions, N leaching) of cropping systems to environmental changes and management interventions [22]. APSIM has been successfully used in NEC to evaluate the impact of climate and management variations on crop productivity and SOC change [23,24,25]. However, it has not been tested to evaluate the influence of management practices on N2O emissions and to account for the whole GHG budget in the maize mono-cropping system of NEC.
In this study, we conducted an interview survey to obtain current farmers’ agricultural practices (CFP), including farm machinery, fertilizer application, pesticide, and tillage. We used the APSIM model to simulate the long-term dynamics of crop growth, N2O emissions, and SOC change under different management conditions using representative soil and climate data of the studied area. Then, a lifecycle assessment (LCA) was conducted to provide a full assessment of GHG emissions by taking into account the soil N2O and CO2 emissions, and CO2 emissions associated with agricultural inputs and farm machinery. The objectives are to: (1) Further test the APSIM model to simulate crop yield, soil water, and N dynamics, and N2O emission under different managements at the Gongzhuling site in NEC; (2) assess the GHG emissions and GHG intensity under current farmers’ practices using the LCA approach combined with APSIM modelling; and (3) identify strategies to reduce GHG emissions while maintaining crop productivity in NEC.

2. Materials and Methods

2.1. LCA Assessment of GHG Emissions

2.1.1. Life-Cycle Inventory Analysis

The goal of the LCA was to compare GHG emissions from a maize mono-cropping system under current farmers’ practices (CFP) with that under alternative managements in northeast China. The functional unit that determines the scope and system boundary of this LCA was: (1) One hectare of cropped land; and (2) the production of one megagram (Mg) of maize.
A lifecycle inventory (LCI) was developed consisting GHG emissions from three stages: pre-farm, on-farm, and post-farm. Pre-farm emissions included those that resulted from the production and transportation of inputs to the field, such as N fertilizer, herbicides, diesel fuel, and machinery. The on-farm emissions included those that resulted from farm machinery operations (e.g., sowing and harvesting), soil N2O, and CO2 emissions that occurred in the field. The post-farm emissions included GHG emissions from the transportation of maize to home.
Information about CFP was collected by interviewing 104 local farmers and 26 agricultural machine operators at Changtu County, adjacent to Jilin province, in 2013 (Table 1), where the spring maize mono-cropping system and farm management are representative of most agricultural areas in NEC. The surveyed average N rate (199 kg N ha−1) of Changtu County is comparable with the surveyed N rate (202 kg N ha−1) of 110 farmers in Gongzhuling and Yushu Counties of Jilin Province from Liu et al. [26], and the surveyed N rate (207 kg N ha−1) of 443 farmers in the same cropping system in northeast China from Gao et al. [27].
In spring, after ridge tillage with a rotary tiller to a 0.16-m depth, seeds were sown at ~6 plants m−2 by mechanical seeders between 20 April and 5 May. Thereafter, soil was slightly compacted using a roller on the ridge. Maize was harvested before 1 October each year. N, P, and K were applied as basal fertilizers using a mechanical seeder. The herbicides were sprayed once by a tractor sprayer. The insecticides were replaced with Trichogramma wasps to control insects. No irrigation was applied. In Jilin and Liaoning provinces of northeast China. In total, 50% and 18% of the maize straw was used as energy fuel for livelihood and feed for livestock, respectively, 20% was directly burned or abandoned, and only 10% was returned to the field according to the survey results [30,31]. Because the average straw-to-grain ratio is nearly 1 for spring maize in northeast China [32], we assumed the diesel fuel consumption in the transportation of straw (50% of the total straw) from the field to farmers’ homes was half of that of grain yield transportation. In this paper, the GHG emissions relating to livestock feeding of the 18% of maize straw were not considered.

2.1.2. Calculation of Greenhouse Gas Emission

Based on above lifecycle inventory analysis, we calculated the total annual greenhouse gas emissions (GHGL) and GHG emission intensity (GHGI):
GHGL = GHG-soil + GHG-input,
where,
GHG-soil = (N2Od + N2Oi) × 298 − dSOC × 44/12,
and,
GHGI = GHGL/YA,
where GHGL is the average total GHG emissions per unit area per year calculated using lifecycle methods and YA is the average yield per unit area per year. N2Od is the direct emission of N2O from soil, which was simulated by APSIM (see details below). N2Oi is the indirect emissions of N2O from N fertilizer, produced subsequently from N leaching and runoff, and deposition of volatilized NH3 and NOx, which was estimated using the IPCC approach [33]. In brief, the fraction of total N inputs that is volatilized as NH3-N was estimated based on the correlation between the fraction of volatilized NH3-N and the applied N (see Supplementary Materials Figure S1), and the amount of N leaching/runoff was estimated by the APSIM model. The number 298 is the 100-year global warming potentials of N2O compared with CO2 [34]. dSOC is the SOC change in the 0 to 30 cm soil depth (positive value indicates carbon sequestration and negative value for carbon loss) predicted by the APSIM model (see details below). The value of 44/12 is the conversion factor from carbon to carbon dioxide. The CO2 from straw burning is considered neutral in the calculation of lifecycle GHG emissions, because it is originally from the atmosphere in the short term. GHG-input is CO2-eq emissions from agricultural inputs (mainly production and transportation) based on the above lifecycle inventory, including CO2 emissions from the combustion and production of diesel fuel used in agricultural machinery operations (tillage, sowing, base fertilizer application, harvesting, pesticide application, and grain transportation), and from production and transportation of machinery, fertilizers, pesticides, and seeds. These emissions were calculated using the CO2-eq emission factors (see Supplementary Materials Table S1) except for machinery, because machinery are not one-time consumable items. The emissions of machinery from manufacture, transportation, and repair and maintenance can be estimated from Supplementary Materials Formulas S1 and S2.

2.2. APSIM Model and Simulations

APSIM contains a suite of modules that simulate biological and physical processes in farming systems, including crop growth, soil water, and carbon and nitrogen dynamics, as impacted by climate variation and management intervention and their interactions [22]. APSIM version 7.5 was used in this study. It runs at a daily time step, and requires daily meteorological data as input, i.e., daily maximum and minimum temperature, rainfall, and solar radiation. Maize crop development is simulated as a function of thermal time modified by photoperiod effect. Biomass growth is determined by either radiation use efficiency (RUE) multiplied by light interception or transpiration efficiency multiplied by available water supply, whichever is smaller. Grain yield is simulated using a grain number and grain size approach.
Soil organic matter in the model is divided into four conceptual pools, including fresh organic matter (FOM) pool, a more active microbial biomass (BIOM) pool, a humic (HUM) pool, and an inert pool [35,36]. Decomposition of each pool is calculated as a first-order process with the rate constant being modified by soil temperature, moisture and C:N ratio. In the APSIM model, the fraction of inert organic carbon is one of the most important parameters affecting long-term SOC dynamics [37]. It is difficult to calibrate the parameters for simulating SOC dynamics without long-term data on SOC, crop biomass, and management. Fortunately, Wang et al. [24] performed the calibration and validation for SOC simulation using 15-year data of three treatments at the same site. Thus, we used the same parameters for SOC simulation as in Wang et al. [24].
APSIM simulates N2O emissions from both nitrification and denitrification processes. N2O emissions during denitrification is predicted by combining the rate of denitrification with the ratio of N2 to N2O emitted during denitrification [38,39], and N2O emission during nitrification is calculated as a proportion (0.002) of nitrified N [40,41]. Further details are described by Thorburn et al. [39]. Based on N2O emissions measurements from a two-year field experiment conducted in Huantai County of North China Plain, APSIM was directly validated for N2O simulation with the parameters mentioned in [40,41], and the results showed that it was successful in simulating N2O emissions [42]. Thus, we used the same parameters for N2O simulation in this study.

2.2.1. Field Site and Experimental Data

A two-year (10/2009-4/2012) field experiment was conducted at a site on black soil in Gongzhuling County (43°30′ N, 124°48′ E), where it has a similar climate and agricultural management to the Changtu County. The annual mean air temperature and precipitation were 5.6 °C and 568.8 mm, respectively. The soil was sampled on 28 October 2009, and the soil properties are given in Table 2.
The experiment consisted of five treatments in 2010: N0MN0, N230MN0, N270MN67, N230MN84, and N320MN101, where Nx and MNy denote x kg of total chemical fertilizer nitrogen (N) and y kg of manure nitrogen (MN) per hectare. In 2011, the total amount of chemical fertilizer nitrogen (N) applied in N0MN0 and N230MN0 remained unchanged, while that of N270MN67, N230MN84, and N320MN101 in 2010 were reduced to 200, 200, and 280 kg N ha−1, respectively. Four replicates (6 m × 24 m) for each treatment were laid out in a randomized block design. The applied chemical N fertilizer was urea, and the manure, with a carbon content of 32% and C/N ratio of 24 for dry matter, was obtained from a nearby dairy farm. Details on the fertilizer applications in each treatment are listed in Table 3. The crop was sown on 22 April in 2010, 6 May in 2011, and 24 April in 2012. After harvest, all residues were removed, and the dry yield was determined. Details on the measurements of soil NH4-N (10 April–27 November, 2010), NO3-N (10 April–27 November, 2010), and soil water (7 April–28 August, 2010) in the 0 to 0.2 m soil profile, nitrous oxide emissions (12 April, 2010–28 April, 2012), and grain yield (2010–2011) are described in Guo et al. [43].

2.2.2. Meteorological Data

Climate data from 1971 to 2015, including daily maximum and minimum temperature, rainfall, and sunshine hours, were obtained from the nearest weather station in Changchun and were used for long-term simulation of a continuous maize system. Daily sunshine duration was converted into daily solar radiation for APSIM simulations using the Ångström formula [44,45]. The climate data (daily rainfall, and daily maximum and minimum temperature) from 2009 to 2012 at Gongzhuling were used for calibration and validation of the APSIM model for simulation of soil inorganic nitrogen (NH4+ and NO3-), soil water, N2O emissions, and grain yield.

2.2.3. Model Calibration and Validation

In our experiment, phenological stages of maize were not recorded. However, the average flowering and maturity dates (day of year) of maize at farmers’ fields were separately observed at Siping (43°10′ N, 124°20′ E, 1981–2007), Changling (44°15′ N, 123°58′ E, 1988–1993), Qianguoerluosi (45°05′ N, 124°52′ E, 2001–2006), and Huadian (42°59′ N, 126°45′ E, 1995–2004) [23,46], and the four study sites are close to the Gongzhuling experimental site (43°30′ N, 124°48′ E). For calibrating the phenological parameters of maize, the sowing date was determined as the day that the rainfall was greater than or equal to 10 mm within five successive days during the sowing period (20 April–5 May). Then, we set the model using the soil properties in our field experiment and the surveyed current farmers’ practices, and ran the model continuously from the beginning (1981) to the end (2007) of the above phenological observations. Compared to the flowering and maturity dates from the farmers, we adjusted the phenological parameters of maize using a trial-and-error approach (Table 4).
On the basis of the adjusted phenological parameters, we reset the model under the management of N0MN0 and N230MN0 at the Gongzhuling experimental site and re-ran the model from the beginning (October 2009) to the end (April 2012) of the field experiment, and adjusted the grain growth parameters (Table 4) by the trial-and-error method based on the observed yield and previous work of Chen et al. [47] and Li et al. [42]

2.3. Scenarios to Assess the Effect of Alternative Management

The government of China is trying to control nitrogen fertilizer supply and return straw to fields in NEC [21], so the design of the scenarios was associated with nitrogen and straw management. For the following scenarios, we used the same crop parameters and soil parameters that were used in the model calibration and validation, and ran the model continuously for 45 years (1971–2015) to obtain the impact of different residue management on yield, N2O, and SOC. Nitrogen fertilizer was assumed as urea for simplicity. We assumed no change in GHG emissions due to P, K, and seed among different scenarios. To highlight the difference between different years of simulation, we presented the average annual maize yield, SOC change (dSOC), direct and indirect N2O emissions (N2Od and N2Oi), and total soil GHG emissions in the first 5, 10, and 20 years and the 45 years of simulation.
Scenario 1: To determine an optimal N rate under 10% maize straw retention in the surveyed current farmers’ practice (CFP), 7 levels of N application rates (100–250 kg N ha−1 in 25 kg N ha−1 increments) were used. All other management practices were kept the same as CFP.
Scenario 2: Combined with the optimized N rate for maize yield obtained from scenario 1, 20% of the maize straw burned or abandoned in CFP was returned to the field as well. Based on consultation with farmers and machine operators, to retain these residues, an additional rotary tillage with a diesel fuel consumption of 22.8 (±4.2) kg ha−1 would be required. All the other management practices were kept the same as CFP.
Scenario 3: Combined with the optimized N rate for maize yield obtained from scenario 1, 20% of the maize straw burnt or abandoned and 50% used as fuel for livelihood in CFP were both returned to the field. Based on consultation with farmers and machine operators, a 4-furrow reversible plough before ridge tillage and additional insecticides of about 1.02 kg ha−1 (active ingredient) is needed to incorporate the residue and to control pests, respectively. Diesel fuel used in ploughing is about 45.6 (±6.5) kg ha−1, and the diesel fuel consumed by the rotary tiller, conducted after ploughing, is reduced by 6.4 (±2.1) kg ha−1. The annual operating area of the 4-furrow plough was assumed to be the same as the rotary tillage from the survey. All the other management practices were kept the same as CFP. If the straw used as fuel for livelihood was returned to field, farmers had to use wood and coal (mainly anthracite). In Jilin and Liaoning Provinces of NEC, the proportion (16.4%) of wood in rural energy consumption is nearly equal to that of coal (18.4%) [48], so we assumed half of the straw was replaced by wood and the other half by coal. The CO2 from wood combustion is considered neutral in the calculation of lifecycle GHG emissions, because it is originally from the atmosphere. Furthermore, 1 kg of dry maize straw with a calorific value of 17 MJ kg−1 [49] is equal to ~0.7 kg of coal (mainly anthracite), with a calorific value of 24 MJ kg−1 [50].

3. Results

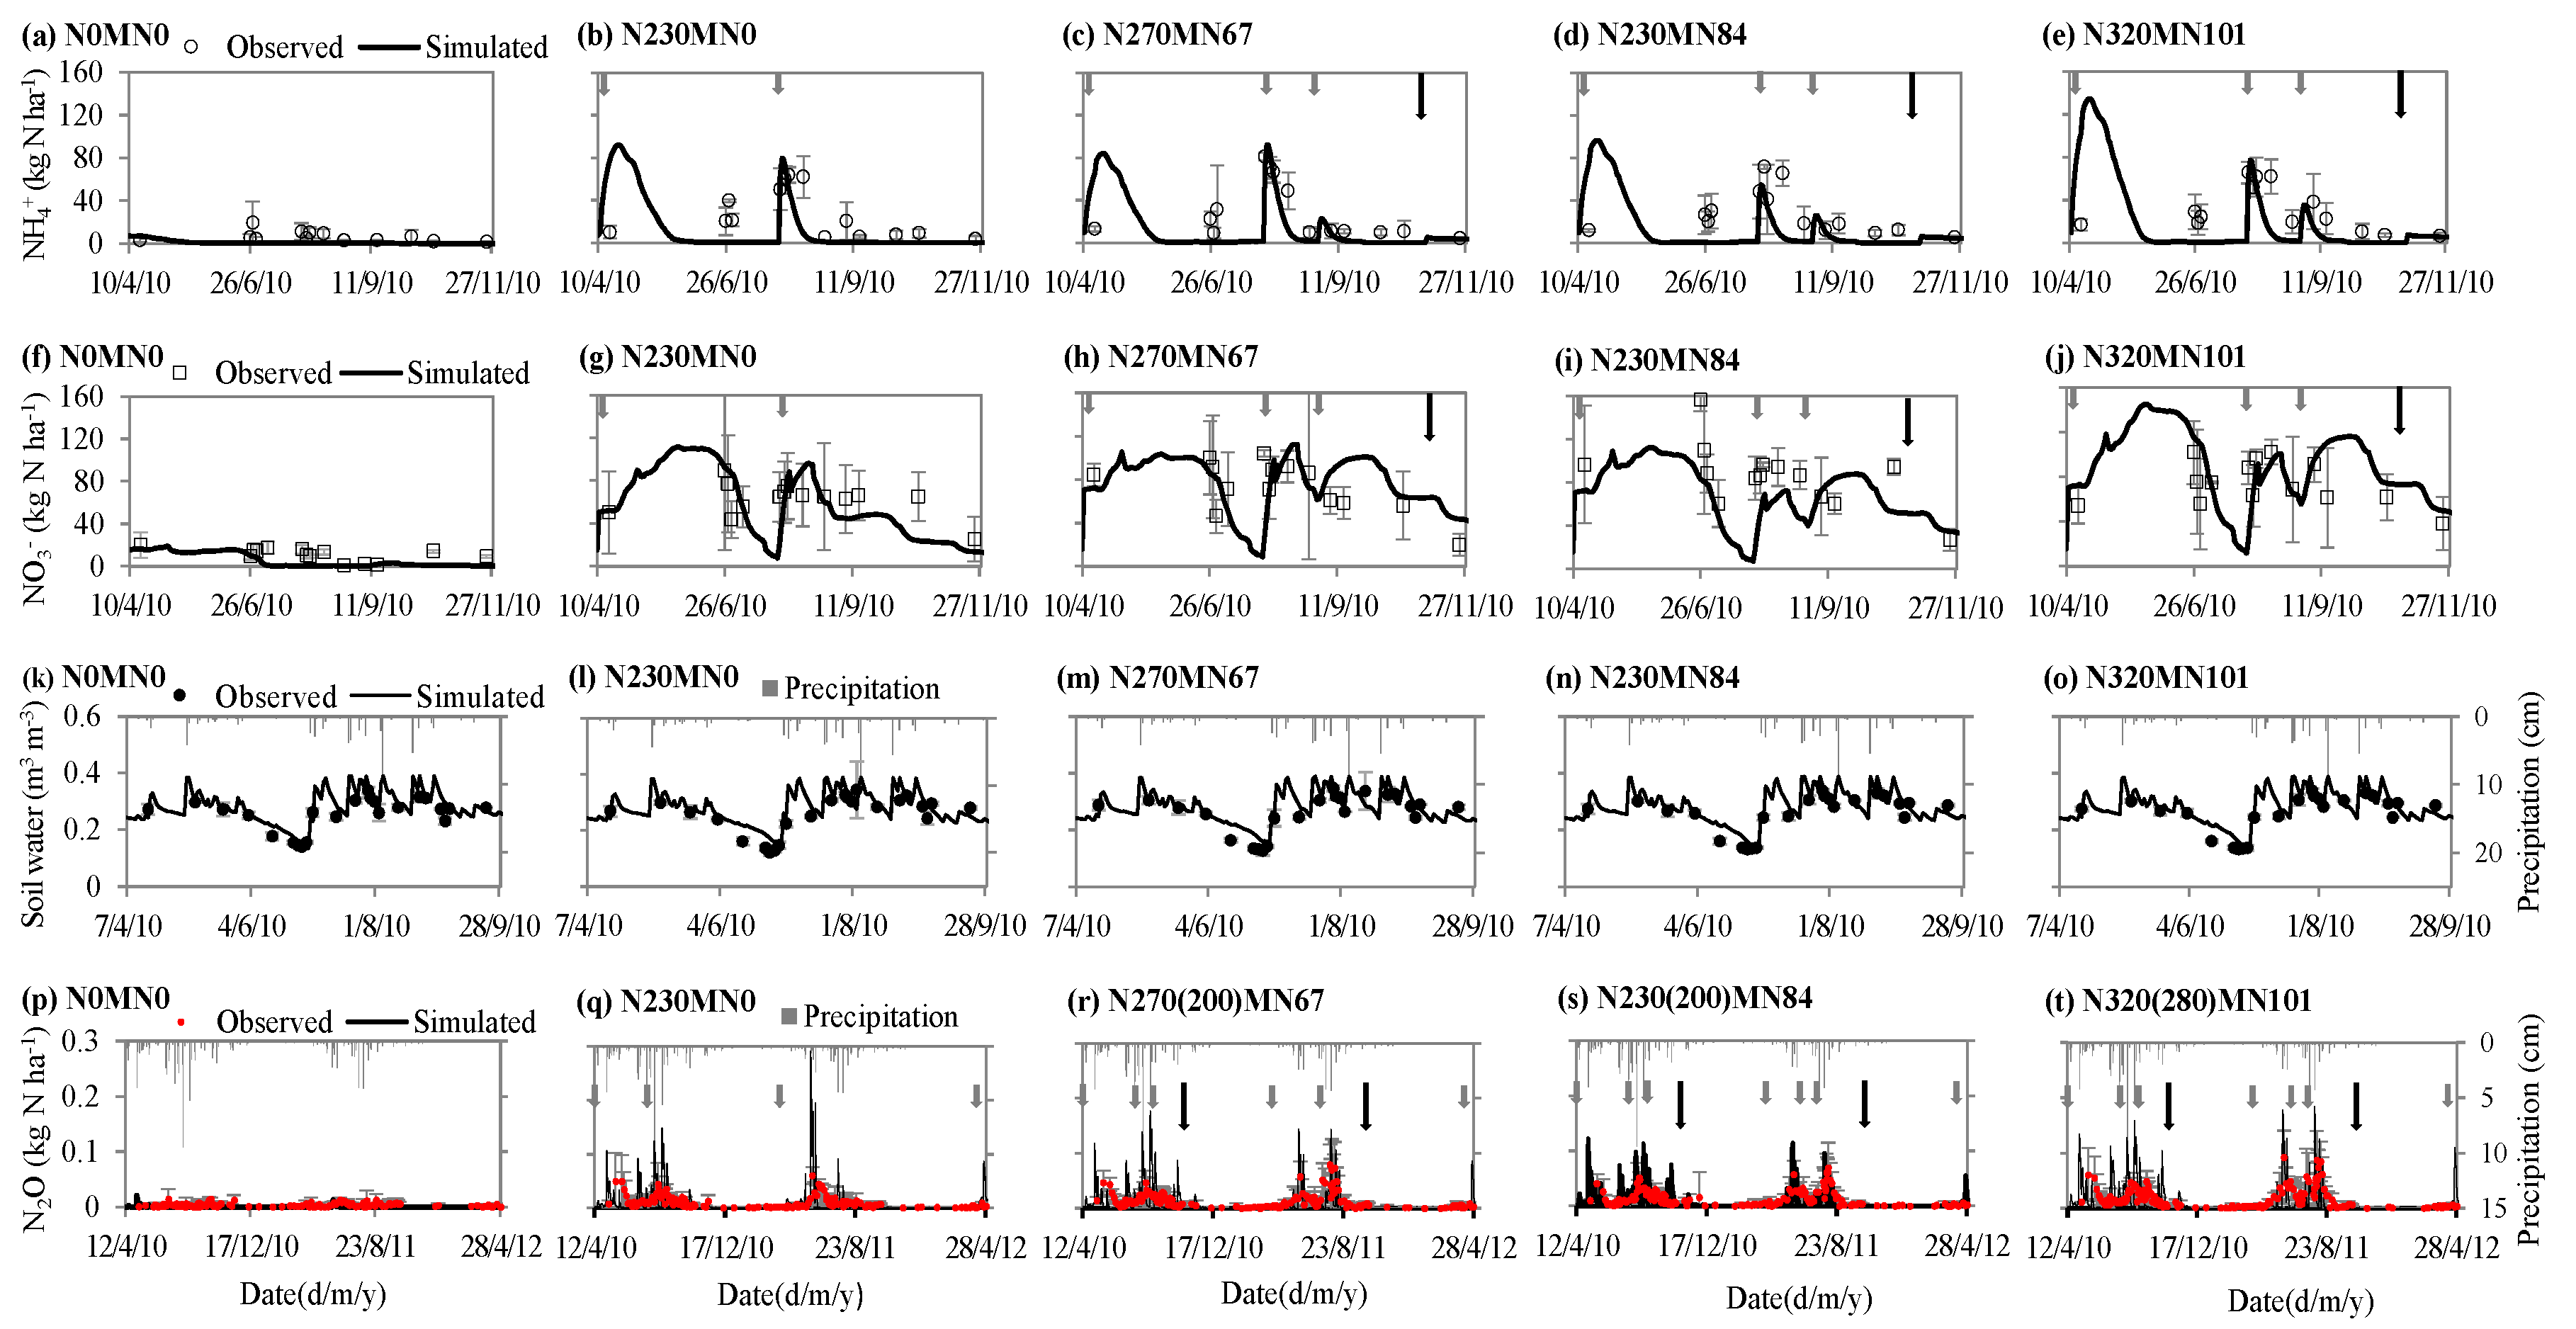
3.1. Model Performance

The performance of the calibrated APSIM model in terms of simulating maize yield, N dynamics, soil water, and direct N2O emissions from soil is shown in Figure 1 and Figure 2. APSIM was able to capture the crop phenological stage, i.e., flowering date and maturity data (Figure 1a), by using the adjusted cultivar parameters in Table 4. The model also correctly simulated the maize yield change (Figure 1b). Using the calibrated model parameters based on the N0MN0 and N230MN0 treatments, the model was validated using the observed grain yield from the other three treatments (N270(200)MN67, N230(200)MN84, and N320(280)MN101), with an R2 (coefficient of determination) of 0.96 and RMSE (root mean square error) of 0.33 Mg ha−1 (Figure 1c).
In general, the dynamics of soil NH4-N and NO3-N in the surface 0.2 m of soil across the different nitrogen treatments were reasonably predicted by APSIM (Figure 2a–e, 2f–j), with an R2 of 0.32 and 0.56, and an RMSE of 25 and 27 kg N ha−1, respectively. In addition, APSIM captured the changes in soil water content in the surface 0.2 m of soil (Figure 2k–o), and it explained 80% of the variation in soil water content, with an RMSE of 0.03 m3 m−3.
For N2O emissions from soil, most simulated peak fluxes coincided with chemical fertilizer application or rainfall events, which was not always consistent with the observations, reflecting potential issues in the modelling dynamics of N2O at a daily time step (Figure 2p–t). However, the model captured the overall trend of N2O emissions and explained 79% of the variation in the total emissions, with an RMSE of 0.70 kg ha−1 (Figure 1d).

3.2. Scenario Analysis

3.2.1. Optimized N Rate

Based on the simulated yield response to varying N rates and 10% straw retention, the average grain yield (dry) across multiple years of simulation show no significant difference when the N rate is higher than 175 kg N ha−1 (Figure 3a). Although the average yield under N rates of 175 kg N ha−1 (45 years) is slightly lower than that under 200 kg N ha−1, it is not statistically significant (p = 0.73). The leached N (at 1-m depth) increases exponentially with increasing N rates (Figure 3b), particularly when N rates are >175 kg N ha−1. Direct N2O emissions (N2Od) increase with N rates, which is also shown as an exponential curve (Figure 3c). These results reflect the fact that when the N application rate exceeds crop N demand, N leaching and N2O emissions will rapidly increase [2,51]. Therefore, the optimized N rate is identified as 175 kg N ha−1, with a similar yield to the N rate of 200 kg N ha−1 (the farmers’ N rate), less direct N2O emissions, and only 1 kg ha−1 of N leaching.

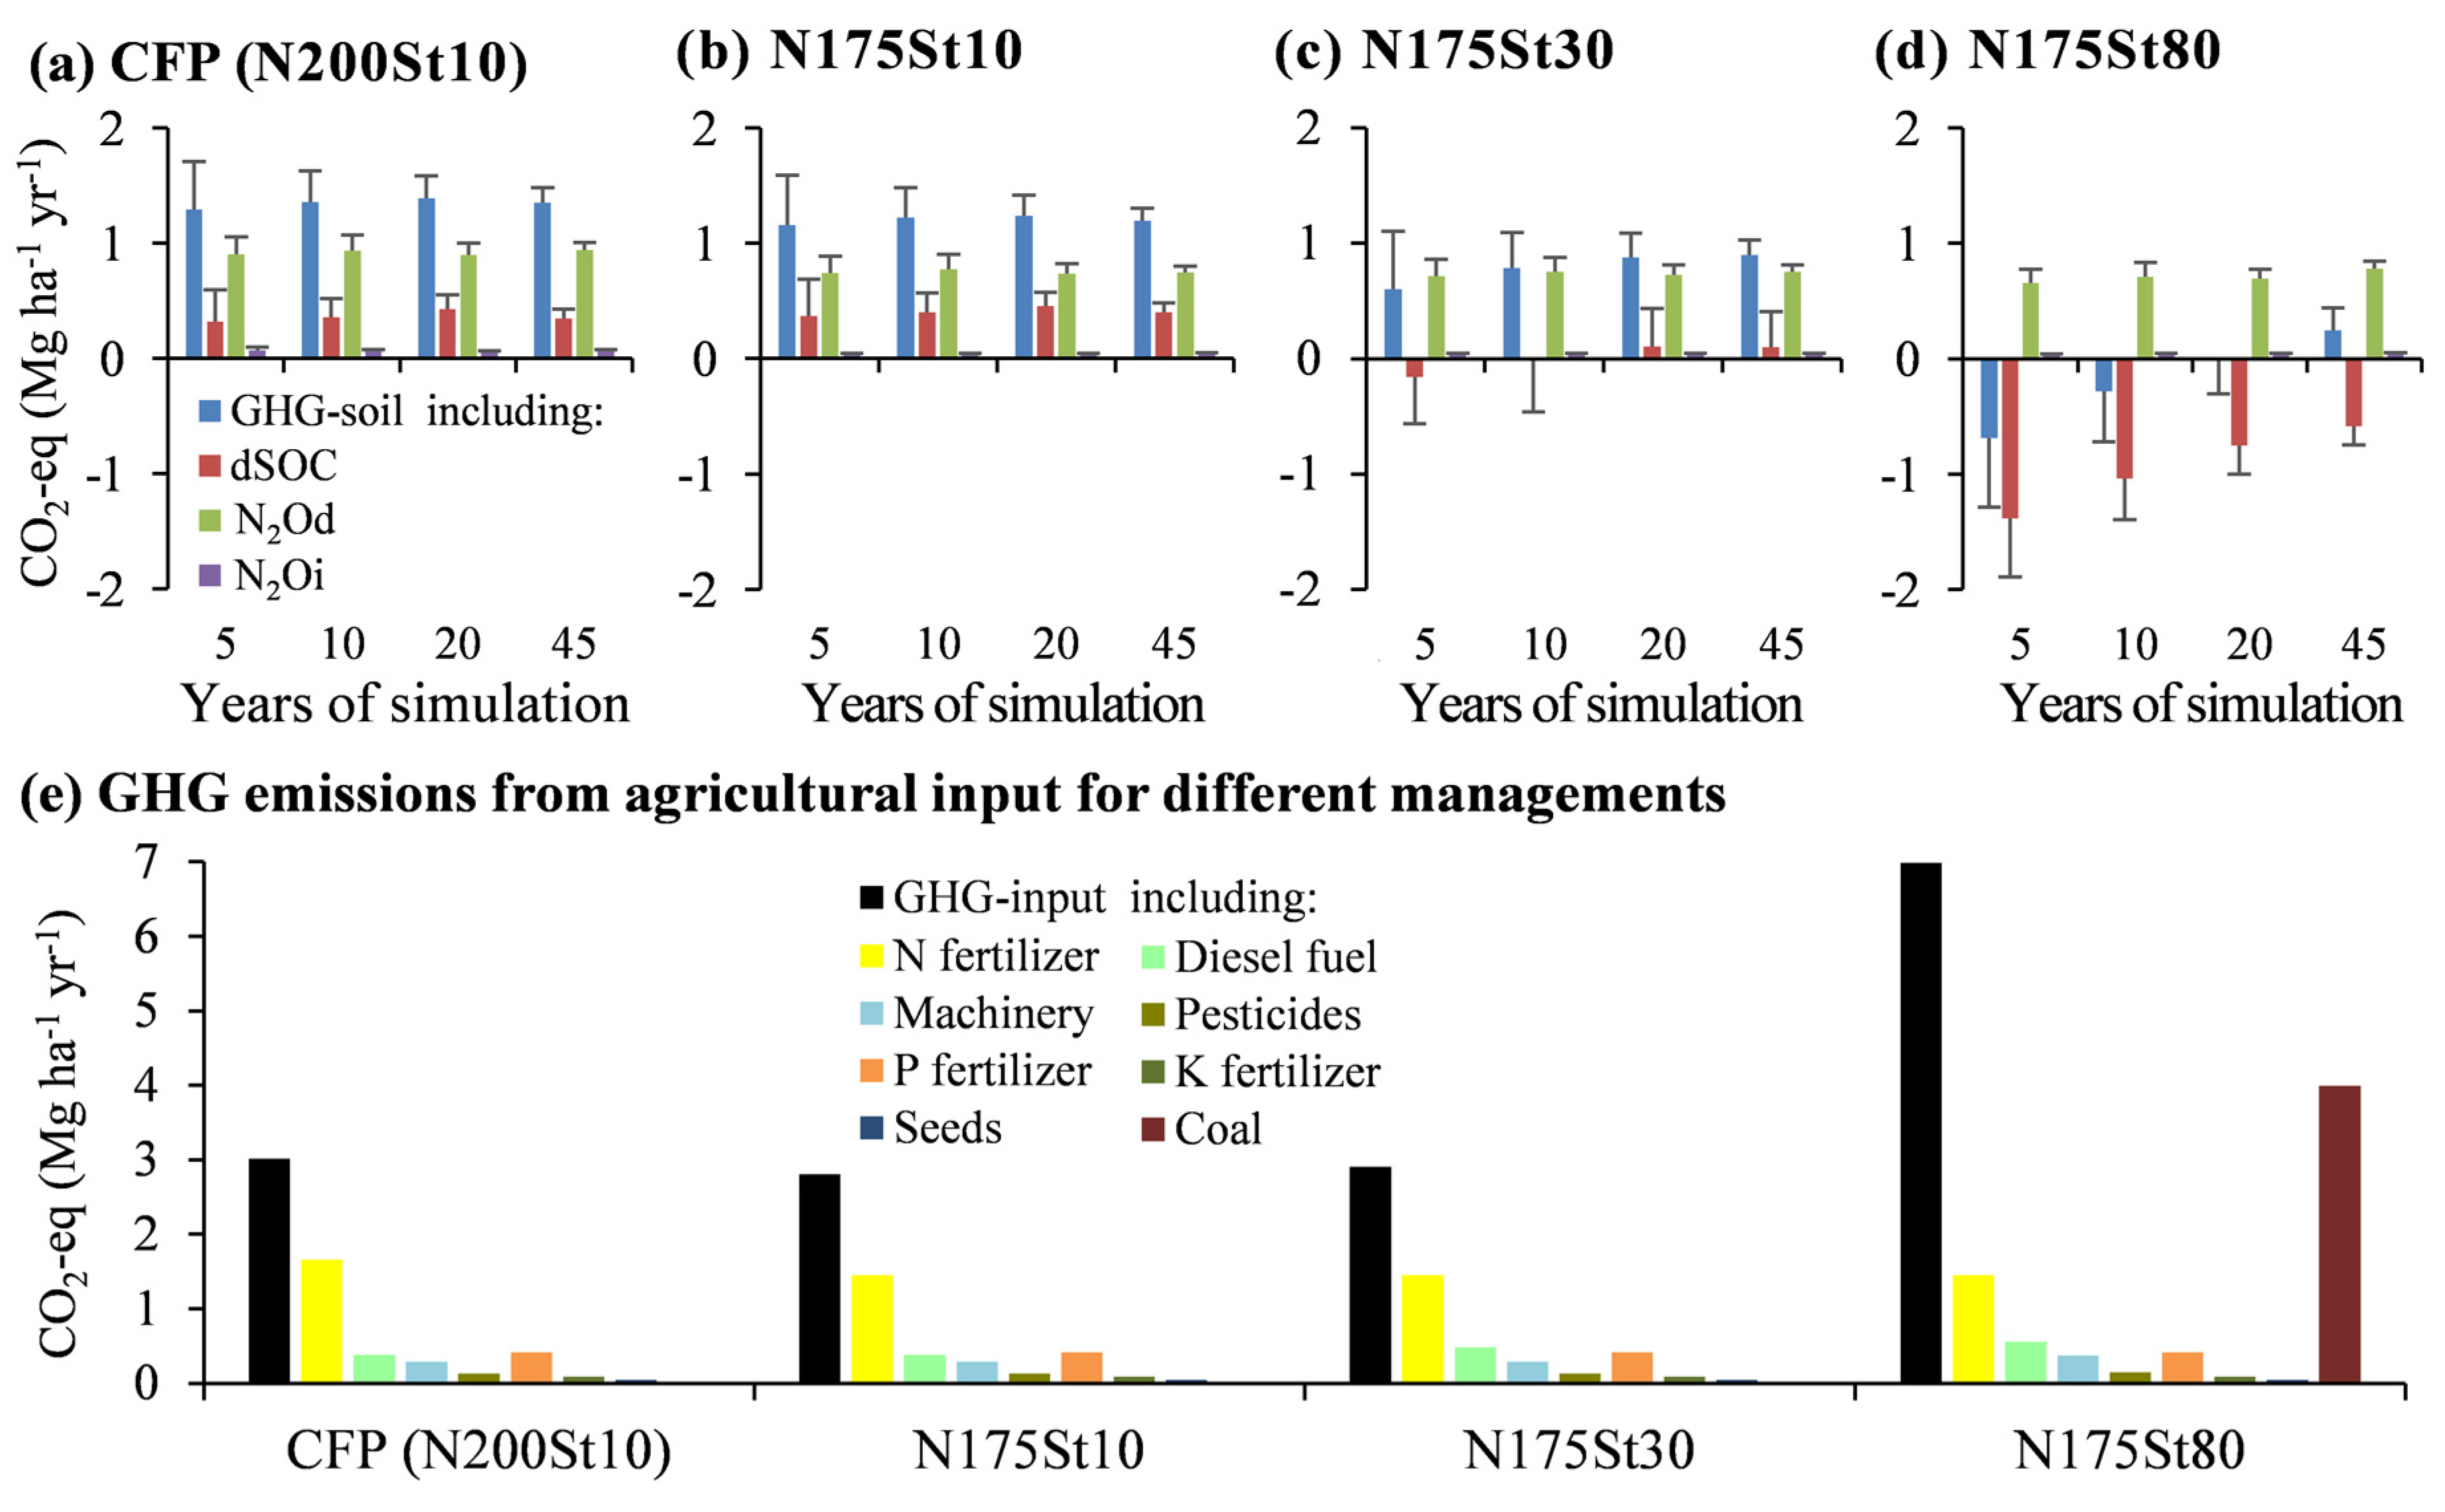
3.2.2. GHG Emissions and GHG Intensity

Under current farmers’ practice (CFP, N200St10), total soil GHG emissions (GHG-soil), SOC change (dSOC), and direct and indirect N2O emissions (N2Od and N2Oi) across multiple years of simulation do not show large changes (Figure 4a). The dSOC in the 45-year simulation is slightly lower than that in the 20-year simulation, suggesting that SOC was reaching an equilibrium. In the 45-year simulation, the total soil GHG emissions are 1355 kg CO2-eq ha−1 yr−1 (Figure 4a), with direct N2O emissions as the main source, accounting for 69% of this total emission; the total GHG emissions from agricultural inputs (GHG-input) are 3016 kg CO2-eq ha−1 yr−1 (Figure 4e), with N fertilizer input as the main contributor (55%). The GHG intensity of CFP is 0.49 Mg CO2-eq Mg−1 yield.
In the lifecycle GHG emissions (GHGL) of CFP (N200St10) in the 45-year simulation, emissions from N fertilizer input and direct N2O emissions are dominant, accounting for 38.0% and 21.5%, respectively, followed by emissions from P fertilizer input (9.5%), diesel fuel input (8.8%), dSOC (7.9%), and machinery input (6.7%). The total emissions from pesticides input, indirect N2O emissions, K fertilizer input, and seeds input only account for 7.6% of GHGL.
Under 10% straw retention with an optimized N rate (N175St10), dSOC, N2Od, and N2Oi show the same trend as CFP (N200St10) in the simulation (Figure 4b). In the 45-year simulation, the total soil GHG emissions under the N175St10 scenario are 160 kg CO2-eq ha−1 yr−1 lower than CFP, mainly resulting from the reduction of N2Od from soil, and the total GHG emissions from agricultural inputs is 208 kg CO2-eq ha−1 yr−1 less than CFP (Figure 4e), due to the reduction of N fertilizer consumption. The emissions reduced from fertilizer production and transportation is nearly equal to that reduced from direct N2O emissions when the N rate decreased by 24 kg N ha−1. GHG intensity under the N175St10 scenario decreases to 0.46 Mg CO2-eq Mg−1 yield.
Under 30% straw retention with an optimized N rate (N175St30), there is little change in SOC across multiple years of simulation (Figure 4c), which means that the soil is nearly in balance for SOC. In the 45-year simulation, total soil GHG emissions (GHG-soil) are reduced by 294 kg CO2-eq ha−1 yr−1 when compared with N175St10. The total GHG emissions from agricultural inputs (GHG-input) under N175St30 are increased by 100 kg CO2-eq ha−1 yr−1 compared to N175St10 (Figure 4e), and the emissions of diesel oil consumed in the additional rotary tillage offset about one third of the sequestrated CO2 as a result of returning 20% of the maize straw burned or abandoned in CFP to the field. The yield difference between CFP and N175St30 is smaller than that between CFP and N175St10, and GHG intensity under N175St30 falls to 0.43 Mg CO2-eq Mg−1 yield.
Under 80% straw retention with an optimized N rate (N175St80), soil is always a carbon sink during the simulated period, but the carbon sequestration rate decreases over time (Figure 4d). After 45 years, total soil GHG emissions (GHG-soil) are reduced by 658 kg CO2-eq ha−1 yr−1 compared with N175St30. However, when half of the straw used as household fuel was replaced with coal, the carbon sequestration rate is negligible compared with emissions from coal (3.98 Mg CO2-eq ha−1) (Figure 4e), and GHG intensity under N175St80 reaches up to 0.83 Mg CO2-eq Mg−1 yield. Thus, it is impractical to mitigate GHG emissions without considering the subsequent emissions linked to the change of residue management in the scenario analysis.

4. Discussion

4.1. Nearly Optimal for Crop Production in Terms of N and Residue Management

The optimized N rate of 175 kg N ha−1 is comparable to the upper value of the optimum N rate (159 ± 19 kg N ha−1) of spring maize in four-year experiments (2010–2013) at the Fujiajie site [52], ~40 km from the Gongzhuling site, but is higher than the recommended average N rate of 161 kg N ha−1 for spring maize of northeast China in X, et al. [53]. The lower optimized N rate in the experiments could be attributed to the short-term impact of residual soil N from preceding N fertilization [54].
The current farmers’ N application rate in our study is only 24 kg N ha−1 higher than the optimized N rate, while the surveyed farmers’ N input in the south part of NEC, southwest China, and east part of northwest China was 62, 73, and 61 kg N ha−1 higher than the recommended N rate of the corresponding region, respectively [55]. Additionally, when the straw retention rate changed from 10% to 30% for CFP, there was no significant increase for crop yield in our simulation (p = 0.89). Therefore, N and residue management in the surveyed region of NEC are nearly optimal for crop production.

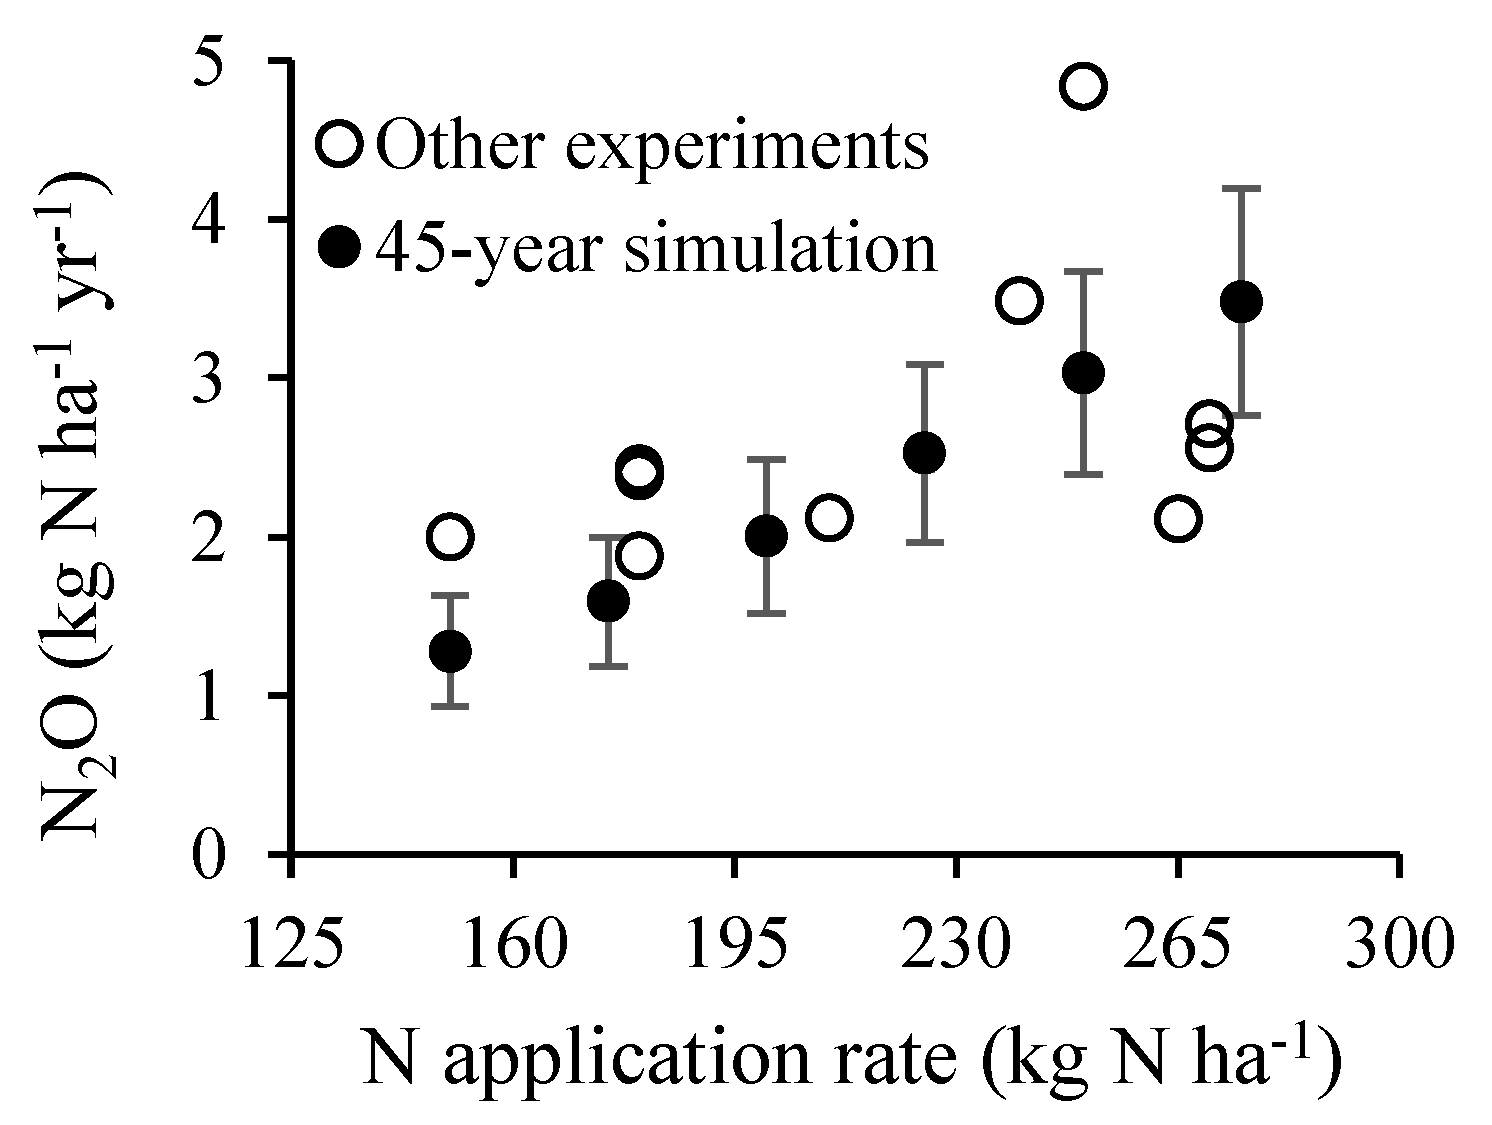
4.2. Model Performance for Simulating N2O Emissions and SOC Change

Besides the comparison between simulated and observed N2O emissions in our experiment (Figure 1d), there is also general agreement between the average annual N2O emission simulated by APSIM and values measured in previous experimental studies in response to N application rates in NEC (Figure 5). Considering the potential errors in N2O measurements and the consistent response of simulated N2O emissions to the drivers (NH4+, NO3, and rainfall), we believe that the model offers an acceptable option, at least in relative terms, to explore the impact of management change on N2O emissions from soil. In addition, our simulation results in Figure 3c indicated that the direct emission factor of N2O from soil was not the same under different N input rates, and it positively correlated with N application rates.
For SOC under current farmers’ practice, soil carbon (0–20 cm) was simulated to decline at a slow rate of 0.09 Mg C ha−1 yr−1 in the first 20 years, which is consistent with the average SOC change rate of −0.08 Mg C ha−1 yr−1, estimated from the comparison between six soil sample points in 1980 and that in 2002 at the same locations of Gongzhuling County by assuming the soil bulk density of the six sample points are the same as that in our experiment [61]. An average SOC change rate of −0.10 Mg C ha−1 yr−1 has been estimated from 51 soil sample points in 1980 and 70 soil sample points in 2000 at Gongzhuling County [62]. This confirms that APSIM could accurately simulate SOC change.

4.3. GHG Emissions and Emission Factor of Agricultural Inputs

The total GHG emissions of 4.37 kg CO2-eq ha−1 under current farmers’ practice in this study is comparable to the corresponding values in Liaoning and Jilin Province, which are 4.11 and 4.47 kg CO2-eq ha−1 respectively [63]. GHG intensity under the optimized N rate with 10% straw retention (N175St10, 45 years) in Gongzhuling (0.46 Mg CO2-eq Mg−1 yield) is higher than the average value (0.33 Mg CO2-eq Mg−1 yield) for spring maize in Shannxi, Shanxi, and Beijing of China [18], where the average yield level (8.7 Mg ha−1), average optimal N rate (181 kg N ha−1), and straw management are similar to that of N175St10. This can be explained by the inclusion of the impacts of SOC change (7.9%) and machinery input (6.7%) in the calculation of the lifecycle GHG emissions and the slightly higher emission factors of agricultural inputs other than N fertilizer (see Supplementary Materials Table S1).
In our study, we estimated the CO2-eq emission factors for diesel fuel, P2O5, and K2O in China from a lifecycle perspective. The emission factors for production and transportation of N, P, and K fertilizer in this paper are all higher than that used in He et al. [19], Zhang et al. [63], and Grassini and Cassman [8]. We attributed the differences to the calculation boundary and energy consumption of fertilizer production. In addition, we calculated the emissions of machinery input on cropland in Tieling. It is higher than the values used in the USA [64], which can be attributed to the reduced operating area per year and lower energy efficiency of machinery in China.

4.4. Limitations and Suggestions

Process-based modelling can extend the results from a short-term field experiment to predict the long-term effect of management practices and climate variability on grain yield and soil GHG emissions, especially for SOC change, which is tended to be ignored when estimating GHG emissions of different management in the short term [8,9,10,11]. The limitation of this method is that the model needs to be calibrated and validated against the experimental data before its application in other regions. However, more than 13 thousand site years of field trials for main crop (maize, wheat and rice) were conducted in last ten years in China [15], which could be used to improve models’ performance on the simulation of crop growth and soil GHG emissions. When combining with LCA, we can further explore GHG mitigation potential by optimizing management while still maintaining crop yield in different agroecological zones of China.
It is not feasible to incorporate the straw used as household fuel into soil in terms of lifecycle GHG emissions. The straw is commonly used for heating and cooking in rural houses of NEC. It could substitute fossil fuel and off-set CO2 emissions, but it also generates indoor air pollution and jeopardizes people’s health [65]. Thus, it is important to develop more efficient utilization ways with less air pollution, such as improving the heat efficiency of biomass combustion systems in rural households, utilizing straw as raw material for power generation, etc. In addition, the SOC balance in agricultural soil could benefit agricultural sustainability [4]. Our results show that SOC is nearly in balance under 30% of straw retention. In future, it would be necessary to mitigate GHG emissions by optimizing management while still maintaining crop yield and SOC balance, which could determine the amount of straw retention without impacting soil quality.
A great mitigation potential exists in technology innovation of N fertilizer production. If the emission factor of N fertilizer from production and transportation can be reduced from the current 8.3 kg CO2-eq kg−1 N to 5.8 kg CO2-eq kg−1 N with more advanced technologies in the future [66], the GHG intensity of 175 kg N ha−1 with 30% straw retention (N175St30) will be decreased from 0.43 to 0.39 Mg CO2-eq Mg−1 yield. Moreover, under the optimized management (N rate of 175 kg N ha−1 with 30% straw retention), additional rotary tillage will incur more costs to the farmer. Therefore, a comprehensive economic evaluation will be required for the adoption of mitigation strategies in the future.

5. Conclusions

A combination of modelling and lifecycle assessment in agricultural systems is required to develop sustainable management strategies to secure food supplies and reduce GHG emissions. Our results demonstrates that current farmers’ practice in terms of N application and residue management are nearly optimal for crop production but not for climate change mitigation. The N fertilizer rate could be reduced by 13% without sacrificing crop yield and the amount of straw retention could be increased by 20% to inhibit soil organic carbon loss. This in turn led to a reduction in GHGL and GHGI by 13% and 11%, respectively, mainly attributed to the SOC change, decrease in emissions from the production and transportation of N fertilizer, and direct N2O emissions from soil. However, it is not feasible to incorporate the straw used as household fuel into soil, which would incur substantial CO2 emissions due to the substitution of coal for straw.

Supplementary Materials

The following are available online at https://www.mdpi.com/2071-1050/11/18/5015/s1. The GHG emissions of machinery from manufacture, transportation, and repair and maintenance, Table S1: CO2-eq emission factors of different agricultural inputs, Table S2: Machinery weight and working life of machinery in Changtu County, Figure S1: Correlation between the fraction of volatilized NH3–N and the applied N in a maize mono-cropping system of northeast China.

Author Contributions

Conceptualization, J.L., Z.L., and Y.W.; formal analysis, E.W.; funding acquisition, L.W. and E.W.; methodology, J.L., H.L., H.X. (Hongtao Xing), and T.R.; resources, L.W., H.X. (Hui Xu), C.G., and T.R.; supervision, L.W. and E.W.; writing—original draft, J.L. and Z.L.; writing—review and editing, Z.L., Y.W., and E.W.

Funding

We gratefully acknowledge the National key research and development program (2016YFE0101100, 2017YFD0201801, 2016YFD0201204, 2017YFF0211701, 2017YFF0211702), funding support from the National Natural Science Foundation of China (31770486), the CAS-CSIRO joint project on advancing crop yield while reducing the use of water and nitrogen, the CSIRO-Chinese Ministry of Education (MoE) PhD Research Fellowship Research Program, and the Technology Innovation Project Fund of the Chinese Academy of Agricultural Sciences (CAAS-ASTIP-2017-AII-01).

Conflicts of Interest

The authors declare no conflict of interest.

References

  1. Winiwarter, W.; Höglund-Isaksson, L.; Klimont, Z.; Schöpp, W.; Amann, M. Technical opportunities to reduce global anthropogenic emissions of nitrous oxide. Environ. Res. Lett. 2018, 13, 014011. [Google Scholar] [CrossRef]
  2. Gerber, J.S.; Carlson, K.M.; Makowski, D.; Mueller, N.D.; de Cortazar-Atauri, I.G.; Havlik, P.; Herrero, M.; Launay, M.; O’Connell, C.S.; Smith, P.; et al. Spatially explicit estimates of N2O emissions from croplands suggest climate mitigation opportunities from improved fertilizer management. Glob. Chang. Biol. 2016, 22, 3383–3394. [Google Scholar] [CrossRef] [PubMed]
  3. Searchinger, T.; Heimlich, R.; Houghton, R.A.; Dong, F.; Elobeid, A.; Fabiosa, J.; Tokgoz, S.; Hayes, D.; Yu, T.H. Use of U.S. croplands for biofuels increases greenhouse gases through emissions from land-use change. Science 2008, 319, 1238–1240. [Google Scholar] [CrossRef] [PubMed]
  4. Lal, R. Sequestering carbon in soils of agro-ecosystems. Food Policy 2011, 36, S33–S39. [Google Scholar] [CrossRef]
  5. Adviento-Borbe, M.A.A.; Haddix, M.L.; Binder, D.L.; Walters, D.T.; Dobermann, A. Soil greenhouse gas fluxes and global warming potential in four high-yielding maize systems. Glob. Chang. Biol. 2007, 13, 1972–1988. [Google Scholar] [CrossRef]
  6. Huang, J.; Chen, Y.; Liu, W.; Zheng, H.; Sui, P.; LI, Y.; Shi, X.; Nei, S.; Gao, W. Effect on net greenhouse gases emission under different conservation tillages in Jilin Province. Sci. Agric. Sin. 2011, 44, 2935–2942. [Google Scholar]
  7. Minasny, B.; Malone, B.P.; McBratney, A.B.; Angers, D.A.; Arrouays, D.; Chambers, A.; Chaplot, V.; Chen, Z.-S.; Cheng, K.; Das, B.S.; et al. Soil carbon 4 per mille. Geoderma 2017, 292, 59–86. [Google Scholar] [CrossRef]
  8. Grassini, P.; Cassman, K.G. High-yield maize with large net energy yield and small global warming intensity. Proc. Natl. Acad. Sci. USA 2012, 109, 1074–1079. [Google Scholar] [CrossRef] [Green Version]
  9. Chen, X.; Cui, Z.; Fan, M.; Vitousek, P.; Zhao, M.; Ma, W.; Wang, Z.; Zhang, W.; Yan, X.; Yang, J.; et al. Producing more grain with lower environmental costs. Nature 2014, 514, 486–489. [Google Scholar] [CrossRef]
  10. Chu, Y.; Xie, L.; Yuan, Z. Composition and spatiotemporal distribution of the agro-ecosystem carbon footprint: A case study in Hebei Province, north China. J. Clean. Prod. 2018, 190, 838–846. [Google Scholar] [CrossRef]
  11. Hoffman, E.; Cavigelli, M.A.; Camargo, G.; Ryan, M.; Ackroyd, V.J.; Richard, T.L.; Mirsky, S. Energy use and greenhouse gas emissions in organic and conventional grain crop production: Accounting for nutrient inflows. Agric. Syst. 2018, 162, 89–96. [Google Scholar] [CrossRef]
  12. Qi, J.-Y.; Yang, S.-T.; Xue, J.-F.; Liu, C.-X.; Du, T.-Q.; Hao, J.-P.; Cui, F.-Z. Response of carbon footprint of spring maize production to cultivation patterns in the Loess Plateau, China. J. Clean. Prod. 2018, 187, 525–536. [Google Scholar] [CrossRef]
  13. Goglio, P.; Smith, W.N.; Grant, B.B.; Desjardins, R.L.; Gao, X.; Hanis, K.; Tenuta, M.; Campbell, C.A.; McConkey, B.G.; Nemecek, T.; et al. A comparison of methods to quantify greenhouse gas emissions of cropping systems in LCA. J. Clean. Prod. 2018, 172, 4010–4017. [Google Scholar] [CrossRef] [Green Version]
  14. Gao, B.; Huang, T.; Ju, X.; Gu, B.; Huang, W.; Xu, L.; Rees, R.M.; Powlson, D.S.; Smith, P.; Cui, S. Chinese cropping systems are a net source of greenhouse gases despite soil carbon sequestration. Glob. Chang. Biol. 2018, 24, 5590–5606. [Google Scholar] [CrossRef] [PubMed] [Green Version]
  15. Cui, Z.; Zhang, H.; Chen, X.; Zhang, C.; Ma, W.; Huang, C.; Zhang, W.; Mi, G.; Miao, Y.; Li, X.; et al. Pursuing sustainable productivity with millions of smallholder farmers. Nature 2018, 555, 363–366. [Google Scholar] [CrossRef] [PubMed]
  16. Zhang, G.; Wang, X.; Zhao, H.; Sun, B.; Lu, F.; Hu, L. Extension of residue retention increases net greenhouse gas mitigation in China’s croplands. J. Clean. Prod. 2017, 165, 1–12. [Google Scholar] [CrossRef]
  17. Zhang, D.; Shen, J.; Zhang, F.; Li, Y.; Zhang, W. Carbon footprint of grain production in China. Sci. Rep. 2017, 7, 4126. [Google Scholar] [CrossRef]
  18. Cui, Z.; Yue, S.; Wang, G.; Meng, Q.; Wu, L.; Yang, Z.; Zhang, Q.; Li, S.; Zhang, F.; Chen, X. Closing the yield gap could reduce projected greenhouse gas emissions: A case study of maize production in China. Glob. Chang. Biol. 2013, 19, 2467–2477. [Google Scholar] [CrossRef]
  19. He, L.; Zhang, A.; Wang, X.; Li, J.; Hussain, Q. Effects of different tillage practices on the carbon footprint of wheat and maize production in the Loess Plateau of China. J. Clean. Prod. 2019, 234, 297–305. [Google Scholar] [CrossRef]
  20. Li, J. Production, Breeding and Process of Maize in China; Springer: Berlin/Heidelberg, Germany, 2009; pp. 563–576. [Google Scholar]
  21. MOAC. The Action Plan for Zero Growth in Fertilizer Use by 2020 (in Chinese). Available online: http://www.moa.gov.cn/zwllm/tzgg/tz/201503/t20150318_4444765.htm (accessed on 18 March 2015).
  22. Holzworth, D.P.; Huth, N.I.; deVoil, P.G.; Zurcher, E.J.; Herrmann, N.I.; McLean, G.; Chenu, K.; van Oosterom, E.J.; Snow, V.; Murphy, C.; et al. APSIM—Evolution towards a new generation of agricultural systems simulation. Environ. Model. Softw. 2014, 62, 327–350. [Google Scholar] [CrossRef]
  23. Liu, Z.; Hubbard, K.G.; Lin, X.; Yang, X. Negative effects of climate warming on maize yield are reversed by the changing of sowing date and cultivar selection in Northeast China. Glob. Chan. Biol. 2013, 19, 3481–3492. [Google Scholar] [CrossRef] [PubMed]
  24. Wang, G.; Wang, E.; Huang, Y.; Xu, J. Soil Carbon Sequestration Potential as Affected by Management Practices in Northern China: A Simulation Study. Pedosphere 2014, 24, 529–543. [Google Scholar] [CrossRef]
  25. Zhao, J.; Yang, X. Distribution of high-yield and high-yield-stability zones for maize yield potential in the main growing regions in China. Agric. For. Meteorol. 2018, 248, 511–517. [Google Scholar] [CrossRef]
  26. Liu, Z.; Xie, J.; Zhang, K.; Wang, X.; Hou, Y.; Yin, C.; Li, S. Maize growth and nutrient uptake as influenced by nitrogen management in Jilin province. Plant Nutr. Fert. Sci. 2011, 17, 38–47. [Google Scholar]
  27. Gao, Q.; Feng, G.; Wang, Z. Present Situation of Fertilizer Application on Spring Maize in Northeast China. Chin. Agric. Sci. Bull. 2010, 26, 229–231. [Google Scholar]
  28. TAMB. Historical Breakthrough Happened in Tieling City for 1.91 Million Mu of Mechanical Harvesting of Maize (in Chinese). Available online: http://www.moa.gov.cn/fwllm/qgxxlb/ln/201311/t20131104_3665518.htm (accessed on 4 November 2013).
  29. MAPRC (Ministry of Agriculture of the People’s Republic of China). Harvest Level with Machine for Maize Increased by More Than 6% Consecutively Over 5 Years (in Chinese). Available online: http://www.gov.cn/gzdt/2013-12/04/content_2541831.htm (accessed on 4 December 2013).
  30. Yu, B. Study on Countermeasures of Straw Energy-oriented Utilization in Liaoning Province; Graduate School of Chinese Academy of Agricultural Sciences: Beijing, China, 2013. [Google Scholar]
  31. Na, W.; Zhao, X.; Huang, X. Evaluation on the utilizable resource of corn stalks in Jilin province. Chin. J. Agric. Res. Reg. Plan 2010, 6, 32–36. [Google Scholar]
  32. Hou, P.; Gao, Q.; Xie, R.; Li, S.; Meng, Q.; Kirkby, E.A.; Römheld, V.; Müller, T.; Zhang, F.; Cui, Z.; et al. Grain yields in relation to N requirement: Optimizing nitrogen management for spring maize grown in China. Field Crops Res. 2012, 129, 1–6. [Google Scholar] [CrossRef]
  33. IPCC(Intergovernmental Panel on Climate Change). 2006 IPCC Guidelines for National Greenhouse Gas Inventories, Prepared by the National Greenhouse Gas Inventories Programme; Eggelston, S., Buendia, L., Miwa, K., Ngara, T., Tanabe, K., Eds.; IGES: Hayama, Japan, 2006. [Google Scholar]
  34. IPCC(Intergovernmental Panel on Climate Change). Climate Change 2013: The Physical Science Basis. Contribution of Working Group I to the Fifth Assessment Report of the Intergovernmental Panel on Climate Change; Stocker, T.F., Dahe, Q., Gian-Kasper, P., Melinda, T., Simon, A.K., Judith, B., Alexander, N., Yu, X., Vincent, B., Pauline, M.M., Eds.; Cambridge University Press: Cambridge, UK, 2013. [Google Scholar]
  35. Probert, M.; Dimes, J.; Keating, B.; Dalal, R.; Strong, W. APSIM’s water and nitrogen modules and simulation of the dynamics of water and nitrogen in fallow systems. Agric. Syst. 1998, 56, 1–28. [Google Scholar] [CrossRef]
  36. Luo, Z.; Wang, E.; Sun, O.J.; Smith, C.J.; Probert, M.E. Modeling long-term soil carbon dynamics and sequestration potential in semi-arid agro-ecosystems. Agric. For. Meteorol. 2011, 151, 1529–1544. [Google Scholar] [CrossRef]
  37. Luo, Z.; Wang, E.; Zheng, H.; Baldock, J.A.; Sun, O.J.; Shao, Q. Convergent modelling of past soil organic carbon stocks but divergent projections. Biogeosciences 2015, 12, 4373–4383. [Google Scholar] [CrossRef] [Green Version]
  38. Del Grosso, S.J.; Ojima, D.S.; Parton, W.J.; Stehfest, E.; Heistemann, M.; DeAngelo, B.; Rose, S. Global scale DAYCENT model analysis of greenhouse gas emissions and mitigation strategies for cropped soils. Glob. Planet. Chang. 2009, 67, 44–50. [Google Scholar] [CrossRef]
  39. Thorburn, P.J.; Biggs, J.S.; Collins, K.; Probert, M.E. Using the APSIM model to estimate nitrous oxide emissions from diverse Australian sugarcane production systems. Agric. Ecosyst. Environ. 2010, 136, 343–350. [Google Scholar] [CrossRef]
  40. Parton, W.J.; Holland, E.A.; Del Grosso, S.J.; Hartman, M.D.; Martin, R.E.; Mosier, A.R.; Ojima, D.S.; Schimel, D.S. Generalized model for NOx and N2O emissions from soils (1984–2012). J. Geophys. Res. Atmos. 2001, 106, 17403–17419. [Google Scholar] [CrossRef]
  41. Li, Y.; White, R.; Chen, D.; Zhang, J.; Li, B.; Zhang, Y.; Huang, Y.; Edis, R. A spatially referenced water and nitrogen management model (WNMM) for (irrigated) intensive cropping systems in the North China Plain. Ecol. Model. 2007, 203, 395–423. [Google Scholar] [CrossRef]
  42. Li, J.; Wang, E.; Wang, Y.; Xing, H.; Wang, D.; Wang, L.; Gao, C. Reducing greenhouse gas emissions from a wheat-maize rotation system while still maintaining productivity. Agric. Syst. 2016, 145, 90–98. [Google Scholar] [CrossRef]
  43. Guo, Y.; Luo, L.; Chen, G.; Kou, Y.; Xu, H. Mitigating nitrous oxide emissions from a maize-cropping black soil in northeast China by a combination of reducing chemical N fertilizer application and applying manure in autumn. Soil Sci. Plant Nutr. 2013, 59, 392–402. [Google Scholar] [CrossRef] [Green Version]
  44. Black, J.N.; Bonython, C.W.; Prescott, J.A. Solar radiation and the duration of sunshine. Quart. J. R. Met. Soc. 1954, 80, 231–235. [Google Scholar] [CrossRef]
  45. Jones, H.G. Plant and Microclimate. A Quantitative Approach to Environ. Plant Physiology, 2nd ed.; Camberidge University Press: Cambridge, UK, 1992. [Google Scholar]
  46. Liu, Z.; Yang, X.; Hubbard, K.G.; Lin, X. Maize potential yields and yield gaps in the changing climate of northeast China. Glob. Chang. Biol. 2012, 18, 3441–3454. [Google Scholar] [CrossRef]
  47. Chen, C.; Wang, E.; Yu, Q. Modeling Wheat and Maize Productivity as Affected by Climate Variation and Irrigation Supply in North China Plain. Agron. J. 2010, 102, 1037. [Google Scholar] [CrossRef]
  48. Ning, Y.; Li, Y.; Ding, T.; Tonooka, Y. A Survey on Energy Consumption in Rural Households in North-East China. Sustain. Energy 2012, 2, 76–81. [Google Scholar]
  49. Yue, J.; Zhang, J.; Xu, G.; Yang, S.; Zhang, B. The measurement and analysis of main elements and calorific value of maize straw. J. Henan Agric. Sci. 2006, 9, 30–32. [Google Scholar]
  50. DCCNDRC. National Greenhouse Gas Inventory of China (2005); China Environmental Science Press: Beijing, China, 2014. [Google Scholar]
  51. Shcherbak, I.; Millar, N.; Robertson, G.P. Global metaanalysis of the nonlinear response of soil nitrous oxide (N2O) emissions to fertilizer nitrogen. Proc. Natl. Acad. Sci. USA 2014, 111, 9199–9204. [Google Scholar] [CrossRef] [PubMed]
  52. Chen, Y.; Xiao, C.; Wu, D.; Xia, T.; Chen, Q.; Chen, F.; Yuan, L.; Mi, G. Effects of nitrogen application rate on grain yield and grain nitrogen concentration in two maize hybrids with contrasting nitrogen remobilization efficiency. Eur. J. Agron. 2015, 62, 79–89. [Google Scholar] [CrossRef]
  53. Xu, X.; He, P.; Qiu, S.; Pampolino, M.F.; Zhao, S.; Johnston, A.M.; Zhou, W. Estimating a new approach of fertilizer recommendation across small-holder farms in China. Field Crops Res. 2014, 163, 10–17. [Google Scholar] [CrossRef]
  54. Cui, Z.; Zhang, F.; Chen, X.; Miao, Y.; Li, J.; Shi, L.; Xu, J.; Ye, Y.; Liu, C.; Yang, Z.; et al. On-farm evaluation of an in-season nitrogen management strategy based on soil Nmin test. Field Crops Res. 2008, 105, 48–55. [Google Scholar] [CrossRef]
  55. Hu, S.; Wu, L.; Chen, X.; Cui, Z.; Zhang, W.; Zhang, F. Establishing a Regional Nitrogen Management Approach to Mitigate Greenhouse Gas Emission Intensity from Intensive Smallholder Maize Production. PLoS ONE 2014, 9, e98481. [Google Scholar]
  56. Li, H.; Qiu, J.; Wang, L.; Xu, M.; Liu, Z.; Wang, W. Estimates of N2O Emissions and Mitigation Potential from a Spring Maize Field Based on DNDC Model. J. Integr. Agric. 2012, 11, 2067–2078. [Google Scholar] [CrossRef]
  57. Ni, K.; Ding, W.; Zaman, M.; Cai, Z.; Wang, Y.; Zhang, X.; Zhou, B. Nitrous oxide emissions from a rainfed-cultivated black soil in Northeast China: Effect of fertilization and maize crop. Biol. Fertil. Soils 2012, 48, 973–979. [Google Scholar] [CrossRef]
  58. Song, C.; Zhang, J. Effects of soil moisture, temperature, and nitrogen fertilization on soil respiration and nitrous oxide emission during maize growth period in northeast China. Acta Agric. Scand. Sect. B Soil Plant Sci. 2009, 59, 97–106. [Google Scholar] [CrossRef]
  59. Yang, L.; Wang, L.; Li, H.; Qiu, J.; Liu, H. Impacts of Fertilization Alternatives and Crop Straw Incorporation on N2O Emissions from a Spring Maize Field in Northeastern China. J. Integr. Agric. 2014, 13, 881–892. [Google Scholar] [CrossRef]
  60. Zheng, Y. Effect of Nitrogen Application Methods on N2O, CO2 Emissions and Nitrogen Balance in Typical Black Soil Farmland; Hainan University: Hainan, China, 2014. [Google Scholar]
  61. Yang, X.; Zhang, X.; Fang, H.; Liang, A. Changes in Organic Matter and Total Nitrogen of Black Soils in Jilin Province over the Past Two Decades. Sci. Geogr. Sin. 2004, 24, 710–714. [Google Scholar]
  62. Xu, Y. The Economic Explanation for the Change of Soil Organic Carbon Storage in Northern Agro-Ecological Zones of China; China Agricultural University: Beijing, China, 2005. [Google Scholar]
  63. Zhang, G.; Wang, X.; Zhang, L.; Xiong, K.; Zheng, C.; Lu, F.; Zhao, H.; Zheng, H.; Ouyang, Z. Carbon and water footprints of major cereal crops production in China. J. Clean. Prod. 2018, 194, 613–623. [Google Scholar] [CrossRef]
  64. West, T.O.; Marland, G. A synthesis of carbon sequestration, carbon emissions, and net carbon flux in agriculture: Comparing tillage practices in the United States. Agric. Ecosyst. Environ. 2002, 91, 217–232. [Google Scholar] [CrossRef]
  65. Zheng, G.; Bu, W. Review of Heating Methods for Rural Houses in China. Energies 2018, 11, 3402. [Google Scholar] [CrossRef]
  66. Zhang, W.; Dou, Z.; He, P.; Ju, X.; Powlson, D.; Chadwick, D.; Norse, D.; Lu, Y.; Zhang, Y.; Wu, L.; et al. New technologies reduce greenhouse gas emissions from nitrogenous fertilizer in China. Proc. Natl. Acad. Sci. USA 2013, 110, 8375–8380. [Google Scholar] [CrossRef] [PubMed] [Green Version]
Figure 1. Comparison of observed and APSIM-simulated phenological stage (a), maize yield for calibration (b), maize yield for validation (c), and total N2O emissions (d) at Gongzhuling. In (a), the observed values were from four study sites (Siping, Changling, Qianguoerluosi, and Huadian) close to Gongzhuling. In (b), the observed values were from treatments of N0MN0 and N230MN0 in 2010 and 2011; in (c), the observed values were from treatments of N270(200)MN67, N230(200)MN84, and N320(280)MN101 in 2010 and 2011; error bars indicate the standard deviation; solid lines in (b–d) are linear regression lines, dashed line indicates the 1:1 line; R2 represents the coefficient of determination and RMSE is the root mean square error.
Sustainability 11 05015 g001
Figure 2. Comparison of observed and APSIM-simulated soil NH4-N (ae), NO3-N (fj), and soil water (ko) in the 0 to 0.2 m soil profile and N2O emission from soil (pt) under five nitrogen treatments at Gongzhuling. Short grey arrow: time for chemical fertilizer; long black arrow: time for organic fertilizer; gray error bars are standard deviations of the four replicates.
Sustainability 11 05015 g002
Figure 3. The responses of maize yield (a), N leaching (b), and direct N2O emissions (c) to varying nitrogen rates with 10% straw retention using the APSIM model at Gongzhuling. The values are the simulated average across different years of simulation. Error bars show the 95% confidence intervals.
Sustainability 11 05015 g003
Figure 4. The contribution of different sources to the lifecycle GHG emissions under different management scenarios using the APSIM model at Gongzhuling. CFP—current farmers’ practice; N x St y: N and St denote nitrogen fertilizer and straw, respectively; x denotes N rate (kg ha−1), and y denotes the percentage of straw returned to field (%). Diesel fuel and coal represented the CO2-eq emissions from combustion, production, and transportation; N fertilizer, machinery, pesticides, P fertilizer, K fertilizer, and seeds represented the CO2-eq emissions from the production and transportation. Error bars show the 95% confidence intervals.
Sustainability 11 05015 g004
Figure 5. Comparison of APSIM-simulated and observed direct N2O emissions under similar straw management. Simulated values are from APSIM with an N rate from 150 to 275 kg N ha−1; observed data are from other experiments in spring maize cropping system of northeast China [56,57,58,59,60]; error bars show the standard deviation.
Sustainability 11 05015 g005
Table 1. Agricultural inputs of current farmers’ practice for maize production from an interview survey at Changtu County.
Maize seedNP2O5K2OHerbicidesInsecticidesFungicides
Application rate (kg ha-1)25 (9)199 (30)83 (15)80 (11)4 (1)00
Rotary tillageSowing and fertilizationSoil compaction Spraying herbicidesHarvestGrain transportation to home
Diesel fuel consumption (kg ha−1)27 (6)8 (2)4 (2)2 (1)34 (5)8 (3)
Mechanical power (kW)56 (14)18 (0.3)18 (0.3)1 (0.3)100 (19)/
Operating area (ha yr-1)60 (28)33 (12)31 (10)58 (20)61 a/
The values in parentheses represent the standard deviation. a Because of low fees and local government support for the use of combine harvesters, it will be widely adopted in the future [28] and was added for estimating GHG emissions in this study. Additionally, straw is also simultaneously chopped by harvesters when harvesting. In the whole country of China, since the combine harvester could conduct trans-regional operation, the average harvested area by machines for maize from MAPRC [29] was directly used as its annual operating area without considering regional differences.
Table 2. Soil properties of the experiment at Gongzhuling.
Depth (m)BD (g cm−3)LL (mm mm−1)DUL (mm mm−1)SAT (mm mm−1)SOC (%)pHIni NO3-N (kg ha−1)Ini NH4+-N (kg ha−1)
0–0.11.310.10.30.441.526.212.565.88
0.1–0.21.310.10.30.441.526.212.565.88
0.2–0.31.420.110.290.420.966.610.144.43
0.3–0.41.420.110.290.420.966.610.144.43
0.4–0.61.440.110.280.410.496.811.46.51
0.6–0.81.50.110.270.380.377.17.446.51
0.8–1.01.590.110.260.360.367.26.96.65
BD—bulky density, LL—lower limit of plant extractable water content, DUL—water content at drained upper limit, SAT—saturated water content, SOC—soil organic carbon, Ini—initial (28 October 2009).
Table 3. Amounts and dates of urea and manure applications under different fertilizer treatments at Gongzhuling.
Date of Fertilization (Day Month Year)Fertilizer TypeAmount of Fertilizer Application (kg N ha−1)
N0MN0N230MN0N270MN67N230MN84N320MN101
29 October 2009Manure006784101
12 April 2010Urea0957890130
31 July 2010Urea013515395130
31 August 2010Urea00394560
29 October 2010Manure006784101
N0MN0N230MN0N200MN67N200MN84N280MN101
11 April 2011Urea02308572100
24 June 2011Urea0004560
25 July 2011Urea0011583120
29 October 2011Manure006784101
16 April 2012Urea02308572100
NxMNy: N and MN denote chemical fertilizer nitrogen and manure nitrogen, respectively; x and y both denote the application rate of the corresponding fertilizer.
Table 4. Calibrated crop parameters for maize in the APSIM model at Gongzhuling.
ParametersValues
tt_emerg_to_endjuv (thermal time required from emergence to end of juvenile (°Cd))235
Photoperiod_slope (change in thermal time required to floral initiation per hour photoperiod increase) (°C/hour)19
tt_flower_to_maturity (thermal time required from flower to maturity (°Cd))750
Head_grain_no_max (maximum grain numbers per head)720
Grain_gth_rate (grain-filling rate (mg/grain/day))8.0
Radiation use efficiency2.0
With the above-derived crop parameters, we conducted model validation and tested the APSIM model to simulate grain yield against the observed values from treatments of N270MN67, N230MN84, and N320MN101 in 2010 and N200MN67, N200MN84, and N280MN101 in 2011, and soil inorganic N, soil water, and N2O emissions from soil against measurements made on all five treatments.

