An Analytic Approach to Understanding Process Dynamics in Geodesign Studies


1
Department of Civil and Environmental Engineering and Architecture, University of Cagliari, via Marengo 2, 09123 Cagliari, Italy
2
Geography Department, San Diego State University, 5500 Campanile Drive, San Diego, CA 92182-4493, USA
3
Institute of Geoecology and Geoinformation, Adam Mickiewicz University, ul. Bogumiła Krygowskiego 10, 61-680 Poznań, Poland
*
Author to whom correspondence should be addressed.
Sustainability 2019, 11(18), 4999; https://doi.org/10.3390/su11184999
Submission received: 12 August 2019
/
Revised: 2 September 2019
/
Accepted: 8 September 2019
/
Published: 13 September 2019
Abstract
:Recent advances in planning support technologies has enabled interactive collaboration in design processes by multiple stakeholder groups. The available technologies collect and store information on both the evolution of design alternatives and the interactions of participants involved in the design process. However, making sense of available process log-data is still a challenge. This study focuses on process analytics in geodesign studies, where iterative collaboration between stakeholders generates design alternatives and consensus by negotiation. Early findings demonstrate how geodesign process analytics makes it possible to gain insights both in recurrent patterns in participant behavior and in the evolution of the design. The approach, based on the enhanced adaptive structuration theory framework, has been tested using data collected by the Geodesignhub web-based collaborative planning support systems in the Cagliari (Italy) geodesign study.
1. Introduction
Despite claims that spatial planning is in the public interest, the idea that location-based decision problems can only be effectively addressed if approached from a “unitary public welfare” perspective should be rethought [1], if not downright rejected [2]. As the most recent theoretical approach to planning transitioned from the rational-comprehensive paradigm to advocacy and communicative planning [3], specific interests of individual social groups are given more attention. The pluralistic approach to planning has brought to the attention of technicians and decision makers a broader range of values and conflicting interests [4,5]. Problems currently facing communities cannot therefore be easily defined and are intrinsically complex [2,6]. The plurality of goals makes it difficult to identify a measurable set of objectives and consequently to pursue an approach purely based on goal optimization constrained by resource availability [7]. On these premises, Rittel [8] proposed what he termed the “second generation” of systems approach to deal with complexities in “wicked” problems. The approach emphasizes the need for planners and stakeholders to engage in a dialogic process whereby all participants can interactively share knowledge, while attempting to more clearly define the problem and propose alternative solutions. However, we “cannot understand and formulate the problem without having solved it” [8] (p. 393). The process, thus, involves several rounds of problem definition and solution generation.
The iterative planning process shaped by the geodesign framework (GDF), as presented by Steinitz in his book [9], fulfills the principles of the second generation systems’ approach advocated by Rittel [8]. Geodesign workflows are articulated in three iterations within which non-linear sequences of tasks alternate between analysis, design, and decision to finally reach a mutually agreed solution. The GDF can efficiently tackle the multiple dimensions of spatial decision problems through a collaborative and/or participatory process based on extensive dialogue among people representing diverse areas of competence, political agendas, and social interests. The increasingly extensive use of digital information technology can not only effectively support the analytic-deliberative planning workflow [10], but also facilitate the understanding of the collaborative geodesign process dynamics by offering the opportunity to collect information on the evolution of design and on participants’ actions [11].
In fact, after the transactive planning paradigm emerged in the 1970s, evaluation methods started focusing not only on the effectiveness of the results, but also on the quality of the process [3,12,13]. The necessary shift from “substantive” to “procedural” theory has been extensively examined by Faludi [7] according to whom one of the objectives of a planning theory is “meta-planning”. “Since planning, like learning, is an information process, it is observable and within limits, capable of manipulation and thus itself the object of planning” [7] (p. 51). Procedural planning theory is generally applicable and should help planners in understanding and managing the process. Decision problems always require some degree of process design to better orchestrate the workflow across sequential activities involving specific participants, methods, tools, and data. However, implementing the concept of meta-planning in current planning practices is still limited. The process is often perceived as a ‘black box’ with a non-transparent, unstructured, and unclear workflow, and several difficulties arise in describing and understanding design and decision dynamics [11].
In an effort to improve our understanding of design processes, this study proposes a methodology to analyze geodesign studies by exploiting the data automatically recorded by a web-based collaborative planning support system (PSS) and uncover patterns in participants’ behavior and design evolution. Despite the yet unresolved implementation gap in practice, PSS and underpinning technology are developing rapidly providing unparalleled opportunities for planning practitioners and researchers [14]. Information and communication technology (ICT) tools and geo-information technologies (e.g., data visualization, sketching tools, interactive web mapping and services) not only support key planning tasks [15], but also for the first time allow the automated collection of structured quantitative data about the cognitive acts of computer aid users. The acquired knowledge may provide useful guidelines for improving future planning processes and existing digital tools under a meta-planning perspective, and also be instrumental in developing new process-oriented supporting technology [16]. To date, research on urban and regional planning process dynamics has relied mainly on traditional data gathering techniques (i.e., video recording, direct observation, survey), time-consuming coding systems and, therefore, on interpreted data and a limited number of analyzed dimensions/variables [10].
Among recent digital information technologies, a novel collaborative PSS called Geodesignhub [17] stores information about the whole planning process in the form of log-data, documenting both the design versions and the actions of involved participants. This new type of data allows for design and decision dynamics to be quantitatively understood.
Borrowing from computational social science [18], the study is guided by the following research questions:
- (1)
- How does the analysis of log-data help us understand past and current (real-time) geodesign processes?
- (2)
- To what extent can the analysis of log-data guide future geodesign processes?
The analysis of information systems’ log-data in order to understand process dynamics and user behavior has been practiced in several disciplines including business management, computer science, human–computer interaction, manufacturing, and civil engineering. Process data mining techniques are increasingly applied to extract process-related information from log files recorded by enterprise information systems to improve workflows and business processes within different types of organizations [19]. Web mining algorithms are widely used to analyze web log files for discovering useful knowledge to efficiently organize multimedia content and enhance user experience [20,21]. Recent applications of log-data mining include detection and prediction of system failure and attack, and crime investigation [22]. In the domain of design, building information modeling (BIM) log-data have been used to capture designers’ interactions [23], and quantitative information about designers’ human–computer interaction behavior has been obtained by processing log files from an information system supporting collaborative design processes in packaging and products’ industrial design [24]. The approach similar to the one presented in this paper has been proven to be effective in previous studies that led to the construction of innovative analytical tools as well as targeted and effective process improvements. For instance, Zhang et al. [25] developed a systematic approach to monitor and measure the productivity of the design process and the recurrent design sequential patterns from BIM log-data. Carrera et al. [26] analyzed social networking log-data to understand dynamic information flow within social media platforms, which may be useful in various disciplines such as viral marketing and opinion mining. Campagna [27] highlighted the importance of citizens’ engagements in urban planning and proposed a set of innovative methods for extracting useful experiential knowledge, perceptions, interests, needs, and behaviors from social networking platform logs. Arguably, Social Media Geographic Information (SMGI) analytics integrated with more traditional data sources may potentially improve decision-making and planning processes. Identifying citizens’ needs was also the ultimate objective of the study proposed by Ghodousi et al. [28] to enhance dialogue between citizens and the government. Data collected through a municipal phone-based request/response system were analyzed to prioritize urban needs using different clustering algorithms and assessed for citizen satisfaction. A qualitative approach was adopted by Ashtari and de Lange [29] who used traditional data collection techniques. Their analytical framework investigates play dynamics and mechanics in digital games as a participatory urban planning tool capable of improving civic skills of citizens.
Despite recent studies, process data mining techniques remain largely unexploited in the design domain. Likewise, this current study aims to investigate the potential of log-data analytics in geodesign processes. The paper is structured as follows. In Section 2, the key aspects of the geodesign approach and a conceptual model for the analysis of the Geodesignhub log-data are described in detail. The enhanced adaptive structuration theory framework is presented in Section 3 as a means of studying process dynamics and organizing data from cases studies. Four hypotheses are derived from the theoretical framework and subsequently tested, in Section 4, with data from the Cagliari geodesign workshop. The results are presented and discussed in Section 5.
2. Geodesign
2.1. The Methodological Approach
Geodesign is an emerging approach to spatial planning and decision-making, which in the last decades has attracted the attention of a rapidly growing community of scholars and practitioners worldwide. The term was first established on the fertile ground set by multi-disciplinary discussions on the relationships between design and Geographic Information Science that took place during a few specialist meetings in California in the early 2000s [30]. Geodesign quickly became a subject of research and academic curricula and offered an opportunity for innovation in the planning practice. In 2018, the International Geodesign Collaboration was created as a (mostly) academic network involving scholars and researches worldwide, and in the first year of its activity produced 56 standardized geodesign studies addressing locally complex global challenges we face today in addressing sustainability issues [31].
While geodesign finds its roots in a long tradition of thought at the intersection of architecture, landscape architecture, and environmental planning [9,32] its innovation—in comparison to more traditional planning and design approaches—is the advanced use of information and communication technology. The use of digital methods eases the application of systems thinking and dynamically relates the creation of design proposals to a multi-scale computational representation of the environment, making the relationships between design and its geographical context more explicit. Thanks to the use of technology, real-time impact assessment is enabled, and the interactive collaboration and negotiation among the process participants facilitated. Hence, geodesign momentum is partially due to the current maturity of geo-information technologies, which after a few decades of evolution are now enabling the implementation of user-friendly, interactive, dynamic PSS [33]. In order to bridge the gap between PSS research and practice [34], Campagna [16] proposed that PSS design should derive from the design of planning process, or meta-planning. In the realm of geodesign, Steinitz [9] provided a robust and flexible framework, which can be used to organize planning and design processes. It entails the interactive creation of six models (i.e., representation, process, evaluation, change, impact, and decision models), the first three of which create the necessary information and knowledge to support the creation of design alternatives (i.e., change model), assessment of their impacts, and eventually decision-making. Among the recent PSS, Geodesignhub (GDH) system design was informed by the Steinitz framework [17], creating a novel way of supporting the planning and design process [35]. It is an open-source web-based collaborative platform, which supports geodesign workflows addressing the implementation of the last three models of the Steinitz framework (i.e., change, impact, and decision), while professional Geographic Information Systems (GIS) software can be used to provide the input data generated by the implementation of the first three models (i.e., representation, process, and evaluation). Thanks to its user-friendly interface, Geodesignhub supports multi-user input and dynamic output processing, facilitating real-time design interaction and collaboration.
2.2. The Geodesignhub Platform
Geodesignhub [36] is a web-based geodesign platform, where the users (i.e., participants involved in the process) access through individual accounts a shared and collaborative design virtual working space. While the actual workflow is flexible, the platform offers user-friendly mapping tools to iteratively: (i) propose and share projects and policies (i.e., diagrams); (ii) select diagrams to create integrated planning alternatives (i.e., syntheses); (iii) negotiate to elicit a final design based on consensus. In Geodesignhub, project and policies are arranged by systems (e.g., green, grey or blue infrastructures, housing, industry, commerce or the like, depending on the study area). For each system, an evaluation map, previously created with GIS, is mashed-up to the base maps of the geographic interface in order to inform location choices. After the first round of the diagram creation phase is completed, the users present their project and policy proposals, which can be selected to create syntheses (i.e., complex integrated design alternatives) in the following phase. Further diagrams can be added to the matrix at any stage of the process as needed. In the second phase, teams of stakeholders can select diagrams to create syntheses, and revise subsequent versions with the support of qualitative geographical impact assessment tools. After each team of stakeholders completes a synthesized version of their design, it can be compared with the syntheses created by other teams. Tools supporting negotiation are available to support the work of team coalitions, until a final version is agreed upon by all the teams. The diagram in Figure 1 presents the overall workflow.
While Geodesignhub may flexibly support a variety of planning and design processes, it has been widely used to support intensive geodesign workshops where groups of stakeholders with different views, needs, and objectives are guided to rapidly create design scenarios based on negotiation [11,37,38,39]. Users are guided through different steps of the workshop workflow by one or more facilitators responsible for effectively coordinating the process in order to keep the time required for each activity to a reasonable duration and promote cross-fertilization of ideas and consensus building. Diagrams and syntheses created along the process are automatically stored on the platform server and are accessible anytime for download or through the application programming interface (API). Thanks to the real-time storage of the design and process log-data, the possibility to analyze and monitor the geodesign process has emerged. Geodesignhub already offers a simple e-dashboard with process indicators to assess the workshop process during and/or after its implementation. It produces a detailed history for each design that helps understand how diagrams are used by the participants. This tool offers a basic set of metrics to analyze the process. However, there is a need to extend it with a more robust analytical framework in order to explain participants’ behavior and choices during the design process.
2.3. Geodesign Process Analytics
In geodesign, the availability of log-data about the design process recorded in real-time by PSS such as Geodesignhub, enables the project facilitator to analyze both the results of the design process, and the process itself. Looking at the data structure of a geodesign workshop’s log-data it is possible to identify the two main dimensions of analysis (Figure 2): the product (i.e., geodesign as a noun) and the process (i.e., geodesign as a verb) [9]. Hence, there is the potential to elicit explicit knowledge about how a design evolved from early proposals to the final plan, and why it evolved in a certain way, including insights on the influence of each participant. Our assumption is that from the design process’s log-data, we can not only calculate measures to better understand the individual process at hand, but also gain insight into more general process dynamics. In regard to process understanding, calculating process performance measures can help workshop facilitators to manage the workflow in a more effective manner, making their actions more responsive to the casual unfolding of behavioral dynamics. Indeed, such measures (indicators) could be used in post-workshop de-briefings, or even during a workshop to prevent possible behavioral bottleneck situations with the help of e-dashboards. In regard to process dynamics, by analyzing log-data it might be possible to better understand collaborative design process dynamics and use this insight to better prepare future processes following a meta-planning approach [16].
Data representing the product of a geodesign workshop are structured as a geographic dataset (e.g., a shape-file). This means that simple and advanced spatial analysis techniques can be used to study similarities and conflicts among different design versions (as in Freitas and Moura [40]) as well as variation in the design evolution dynamics. In addition, spatial and thematic attributes of individual diagrams and their syntheses relate to each other, as well as to the participants and teams who created, modified, and selected them along the steps of the process. The diagram in Figure 2 represents the data model of Geodesignhub log-data at a conceptual level.
In terms of conceptual data model, the product of design consists of several objects, or feature classes, including diagrams, syntheses, and systems priority weights. For each class one or more type of attributes are recorded, where S represents spatial attributes (e.g., location, geometry, area, etc.), T represents time attributes (e.g., project starting time, duration, time of creation), and Att represents thematic attributes (e.g., name of the project, type of system, cost, etc.). As such, spatial and temporal analyses as well as thematic queries can be performed with GIS software. To explore the spatial relationships among designs, Freitas and Moura [40] proposed a number of topology relationships and tested them with the use of extract transform load (ETL) tools to automatically analyze project diagrams in terms of geometrical or locational similarity.
Process data describe the participants in terms of authorship of design data objects, sequence (i.e., step), and their product. The latter makes the relations between process and product explicit, offering further ground for analysis. In an earlier study, Cocco and Campgna [41] started developing geodesign process analytics (GDPA), a framework for monitoring and analyzing geodesign processes, and used descriptive statistics to analyze the productivity of the workshop participants and the evolution of team syntheses along the geodesign workshop iterations, supplying real-time evidence of the workshop process dynamics. Nevertheless, a question of whether it is possible to elicit from geodesign workflow data more general and complete design rules is still an open issue. In the next section, a set of operational questions and statistical hypotheses is articulated by following the conceptual map of enhanced analytical structured framework [42] to guide an explanatory analysis of the log-data. This is followed by deploying standardized inferential statistical techniques to test the reliability of findings.
3. GDPA for Studying Process Dynamics
3.1. Enhanced Analytical Structured Framework
The assessment approach called enhanced adaptive structuration theory (EAST) [43] was formulated to guide and evaluate the use of geographic information systems by groups in complex decision situations involving conflicting objectives and solution trade-offs. The revised version of the framework (EAST2) offers 25 qualitative aspects of decision situation assessment that can help to understand the circumstances surrounding the use of geospatial methods and to assess their outcomes (Figure 3). EAST2 was initially formulated and tested in collaborative group decision-making in environmental planning [10,42], but the framework can be applied in various subject domains and at various levels of granularity. It offers an opportunity to choose the level of detail at which the assessment is to be made. The analytical framework includes aspects organized along the three main construct categories. The convening constructs describe the context of the decision situation comprised of social-institutional influence, participant influence, and technological influence. Process constructs describe how the convening aspects influence the technologically-supported process of decision-making and its emergent dynamics. Outcome constructs focus on task and social outcomes of the decision-making process. In this study, EAST2 is applied to assess collaborative planning and design intended as a spatially explicit decision-making process.
3.2. Decision Situation Assessment for a Geodesign Study
In this study, EAST2 is proposed as a conceptual framework for studying group participation and problem-solving dynamics of the design process in geodesign use cases. We analyzed a typical geodesign workshop using 25 aspects of EAST2. Yet, with the particular workshop workflow examined herein some of the aspects were not applicable or non-measurable. Thus, only 6 out of 25 aspects of EAST2 were used in the analysis. More aspects could have been be used if a mixed data (qualitative–quantitative) study design was adopted. This study, however, exclusively focused on the quantitative characteristics of the geodesign process in the Cagliari workshop. A different subset of 25 EAST2 aspects might have been found relevant in a different study situation. In this case, we found six constructs to be sufficient to test the reliability of the overall method.
In any event, the workflow of a geodesign study developed in a workshop format can be broken down into eight steps. Each step identifies a set of associated actions characterized by specific sub-objectives, group composition, and digital supporting tools. A geodesign process assessment can be performed at different levels of details. Some EAST2 aspects were examined for the entire geodesign process (i.e., social-institutional aspects), others at the level of a single geodesign step (i.e., geographic information aids).
The steps are presented in the columns of Table 1, individually or merged in cases where they are repeated, while the aspects are given in the rows. In this way we can effectively organize the available information and identify the process dynamics that should be investigated. We, therefore, performed the decision situation assessment for those aspects that could be measured (Table 1; aspects 5, 7, 11, 16) or calculated (aspect 14 “Appropriation of information aids influence”, aspect 19 “Emergence of group participant influence”) and we linked them together to “map” different relationships.
The first set of operational-level research questions underpinning the study of the geodesign process dynamics were then formulated. Each question asks about a relationship between a subject aspect and an object aspect:
- Do different participation strategies/group compositions (aspect 5) influence the number of times a diagram has been selected in the synthesis (aspect 16)?
- Does the background information (aspect 7) influence the appropriation of the “sketching and visualization tool” (aspects 11 and 14)?
- Does the appropriation of the “sketching and visualization tool” (aspects 11 and 14) change between the teams across the steps (aspect 16)?
- Do any group processes (aspect 16—e.g., public 3-min presentation) affect the emergence of new participants’ views (aspects 7 and 19)?
3.3. Hypotheses
Based on practical experiences gained from organizing and running geodesign workshops worldwide and on anticipated findings from preliminary analyses, we drew a series of hypotheses relating to the four questions formulated in the previous section.
- In regard to the first question, we hypothesized that the diagrams created by the expert groups in step 1 would have a greater chance of getting selected in the subsequent designs than those created by the non-expert stakeholders (step 3, 4, and 6). This hypothesis was based on the following observations: (i) the groups of experts created close to 100 diagrams at the very beginning of the process (system teams created at least 10 diagrams in their own system column), which constituted the first set of diagrams available to be selected in the syntheses; (ii) the experts enjoyed greater confidence than the non-expert stakeholders due to their technical knowledge and familiarity with geographical data representations and interfaces.
- The second question aims at gaining insight into the influence of participants’ background information (e.g., age, education level, previous experience with GDH/PSS, academic/working area of concentration, main activity within the area of concentration), on the use of the “sketching and visualization tool” in GDH. Age was expected to be negatively correlated with the propensity to use digital supporting tools, whereas participants who achieved higher education and have already experienced the use of planning and decision support systems would demonstrate greater ease of using the “sketching and visualization tool”. We also expected to find differences in the use of the tool associated with training and main professional activity (e.g., practice, research, student). Architects and planners are expected to have robust visual-spatial thinking skills and greater familiarity with tools for digital sketching and design. In this analysis, the appropriation of the tool was in fact associated with the perceived usefulness and measured by the use frequency, following the rational: if the tool is useful, they use it to create diagrams.
- In question three, we intended to analyze the actual appropriation of the “sketching and visualization tool” within the activities and thus determine whether there were any significant differences between the number of diagrams created across the steps by the stakeholder teams. We argue that, despite facilitators’ instructions, the diagrams creation trend can differ significantly between groups mainly due to the composition of group members and the role represented/played. In fact, the length of time allowed for each activity is defined by facilitator, which can thereby affect the appropriation of the tool. The creation of the first syntheses (step 3) is usually a quick task, in which each team is asked to select diagrams mainly from those created by the expert group in step 1. Whereas in the second and third round of syntheses (steps 4 and 6) they are encouraged to add additional diagrams to better accommodate their interests.
- The last question focuses on the priority weights assigned to the systems by each of the stakeholder teams at the beginning of the process (decision model, step 2) and reflects the values and worldviews of the participants. We hypothesized that the groups changed their views along the process and, specifically, that the mean of priority values associated with the diagrams selected before the three min presentation would be significantly higher than the mean of the priority values associated with the diagrams selected after the three min presentation. This could mean that the groups selected a greater number of diagrams from the systems, which they identified as medium or low priority prior to the diagram synthesis steps in the geodesign process. We posit that the three min presentation of the syntheses, although based on a group-specific set of priorities, may be complementary but important part of the learning process within each team and for all participants. We intended, therefore, to compare the groups’ designs to discover trends (if any) in diagram selection and relationships among systems with different priority weights. In carrying out this comparison, the groups’ values and views were measured for each design as the mean of the priority values (from 1 to 10) associated with the territorial systems, to which the selected diagrams relate.
4. Analysis
4.1. Cagliari Geodesign Workshop
To test the hypotheses and gain insight into geodesign process dynamics, we used the log-data from a geodesign workshop conducted in 2016 at the University of Cagliari, Italy, with 29 participants formed into six teams each representing a stakeholder group involved in a realistic land use planning process [35]. The objective of the workshop was to collaboratively develop future change alternatives for the Cagliari Metropolitan City, recently established by a regional law. The choice of the study area was motivated by real challenges facing the Metropolitan Government in coordinating the planning effort of a geographically wide area including 17 municipalities, each of which traditionally planned only within their own boundaries. The same area was the subject of a geodesign study held in 2009 at the University of Cagliari and involving 30 international students in an intensive planning workshop characterized by a mix of analog and digital techniques [44]. Despite its academic nature, the study involved a local coordination team (comprising 10 experts in architecture, planning, and environmental engineering) who spent three months part-time implementing the preparatory phase of the geodesign process (i.e., knowledge building, GDH project set-up). The workshop was developed following six interrelated models of the geodesign framework and using Geodesignhub, that proved to be useful in facilitating collaboration among public and administration representatives in other geodesign studies [11].
Some of the participants were invited because of their institutional or academic role while others decided to participate driven by interest in the planning problem at hand. They included academics, technical representatives of public authorities, local planning professionals, and students of architecture and civil engineering at the University of Cagliari, equally divided into six groups (one group had only four participants whereas the other five groups had five participants each) according to their expertise and knowledge. Even though the participating sample was not representative of all real decision-maker and stakeholder groups for the study area, the participants were all somehow related to the study area (they lived or worked in the area). The participants were guided through eight steps of a standard geodesign workshop that had the format of a two-day intensive planning session in a multimedia laboratory equipped with 30 PC stations (29 participants, 1 facilitator) and a public display screen. Specifically, the “Add diagrams and create a design version” step was repeated between three and four times to find an improved alternative within each stakeholder group (metropolitan government—METRO; regional government—RAS; green and non-governmental organization (NGO)—GREEN; cultural heritage conservation—CULTH; developers—DEV; tourism entrepreneurs—TOUR), and to reach a consensus on a final solution agreed upon after two consecutive rounds of negotiations within group coalitions in the “Create a negotiated Design version” step.
The quality of the preparation process and the group composition of participants led the authors to choose this specific case study from a small set of documented case studies to test the hypotheses.
4.2. Data Collection
Within this research setting, log-data about the product and the process were collected using both the API tool and the direct download function of Geodesignhub. In accordance with the logical data model in Figure 4, the shapefiles were processed using ETL software (GeoKettle) and organized in a geodatabase (PostgreSQL, Figure 4). In addition to the data storage functions of Geodesignhub, traditional data collection techniques (e.g., survey) were used.
A post-workshop survey was designed to gather feedback on the general experience of participants, but not to collect structured background data. Instead, information on the personal and professional characteristics (age group, background, etc.) of the participants was inferred from public sources (e.g., Chamber of Engineers online database, University of Cagliari website) and added to the study database. In total, 214 diagrams were created during the workshop by 29 participants resulting in a number of variables available for analysis and hypothesis testing.
The use of GDH log-data is proposed here as a complement to established data collection strategies (e.g., video recording, survey, interview), that have been widely used to analyze design processes. Study setting (e.g., laboratory, field) and envisaged data collection techniques have a direct effect on the whole research strategy. Traditional tools for data collection (i.e., audio and video recordings) combined with standard processing methods (i.e., protocol analysis) have proved to be highly time-consuming and resource-demanding, especially when applied to analyzing complex decision-making processes [24]. Nevertheless, this study should be considered as an early research effort whose findings will need to be corroborated by analyzing more extensive data sets from other geodesign workshops including mixed-data collection techniques.
4.3. Hypotheses Testing
Hypothesis testing with the Cagliari workshop sample data was carried out to evaluate the hypotheses formulated in the previous section. The analytical procedure sought to statistically demonstrate the effect, relationship, or difference between two or more groups as previously stated, thus disproving the null hypothesis according to which the observed or assumed dynamic was due to a chance factor. At first, each hypothesis was specified in terms of variables corresponding to the Cagliari workshop data model. An appropriate statistical test was then identified based on the specified variables and the sampling distribution. In order to decide which method was more appropriate to use, we verified the assumptions underlying the traditional (parametric) tests and concluded that in all cases those conditions were partially or fully violated. Therefore, non-parametric tests were used to analyze the Cagliari workshop log-data. The results of the tests performed with the statistical software R are presented and interpreted in the following two sections.
4.3.1. Hypothesis 1
In this study, we were interested in investigating different aspects of a geodesign process starting from the validation of the first hypothesis, according to which the success rate of a diagram was greater when it was created by an expert team rather than by a non-expert stakeholder group. The dependent variable was, therefore, the frequency of use of each diagram (discrete variable; greater than zero; attribute “frequency’’; table “diagram”, Figure 4). The explanatory variable in all group/coalition syntheses indicated whether the diagram was created by an expert or by a non-expert stakeholder (nominal variable; two possible values: yes/no; attribute “created_by_expert”; table “diagram”). Differences in the frequency means between the two sets of diagrams were assessed using the Wilcoxon rank-sum test [45]. The sampling distribution dictated a non-parametric alternative to the unpaired two-samples t-test to compare the two sets.
4.3.2. Hypothesis 2
The second hypothesis states that participants’ background information influenced the use of the “sketching and visualization tool” in Geodesignhub. The relationships between the frequency of diagrams created by each participant (discrete variable; equal or greater than zero; attribute “diagram_created’’; table “author”, Figure 4) and the personal and professional characteristics of the participants were assessed. Age group, education level, and previous experience with GDH/PSS were classified using four-level (education level, previous experience with GDH/PSS) and five-level (age group) Likert scales. Academic/working area of concentration and main activity within the area of concentration were the three-class nominal variables. The non-parametric Kendall’s tau test [46] was used to perform correlation analysis with the three ordinal explanatory variables, whereas the Kruskal–Wallis test was applied to test differences between the groups. The latter is a non-parametric alternative to a one-way ANOVA test for comparing means in a situation where there are more than two groups [47].
4.3.3. Hypothesis 3
We also analyzed the frequency of using the “sketching and visualization tool” in Geodesignhub over time in order to determine whether the hypothesis 3 (there were statistically significant differences between the mean frequencies of diagrams created across the steps by the six groups) is true. Diagrams were divided between each step, in accordance with temporal information, available in the column ‘’created_at’’ in the table “diagram” (Figure 4). The stakeholder groups that differed in the appropriation of the “sketching and visualization tool” were explored using the Kruskal–Wallis test. The analysis was first carried out at the group level and then repeated for teams grouped in coalitions. In fact, at the beginning of step 7 a sociogram was used with the aim of identifying compatibility or conflicts between the groups [38] (p. 22). The results obtained with this approach immediately identified the stakeholder teams of TOUR, CULTH, and RAS who joined in a coalition displaying strong affinity among them. A second, less robust alliance was formed between GREEN and METRO. The developers remained outside the coalition-building process obtaining negative assessments from all other teams.
4.3.4. Hypothesis 4
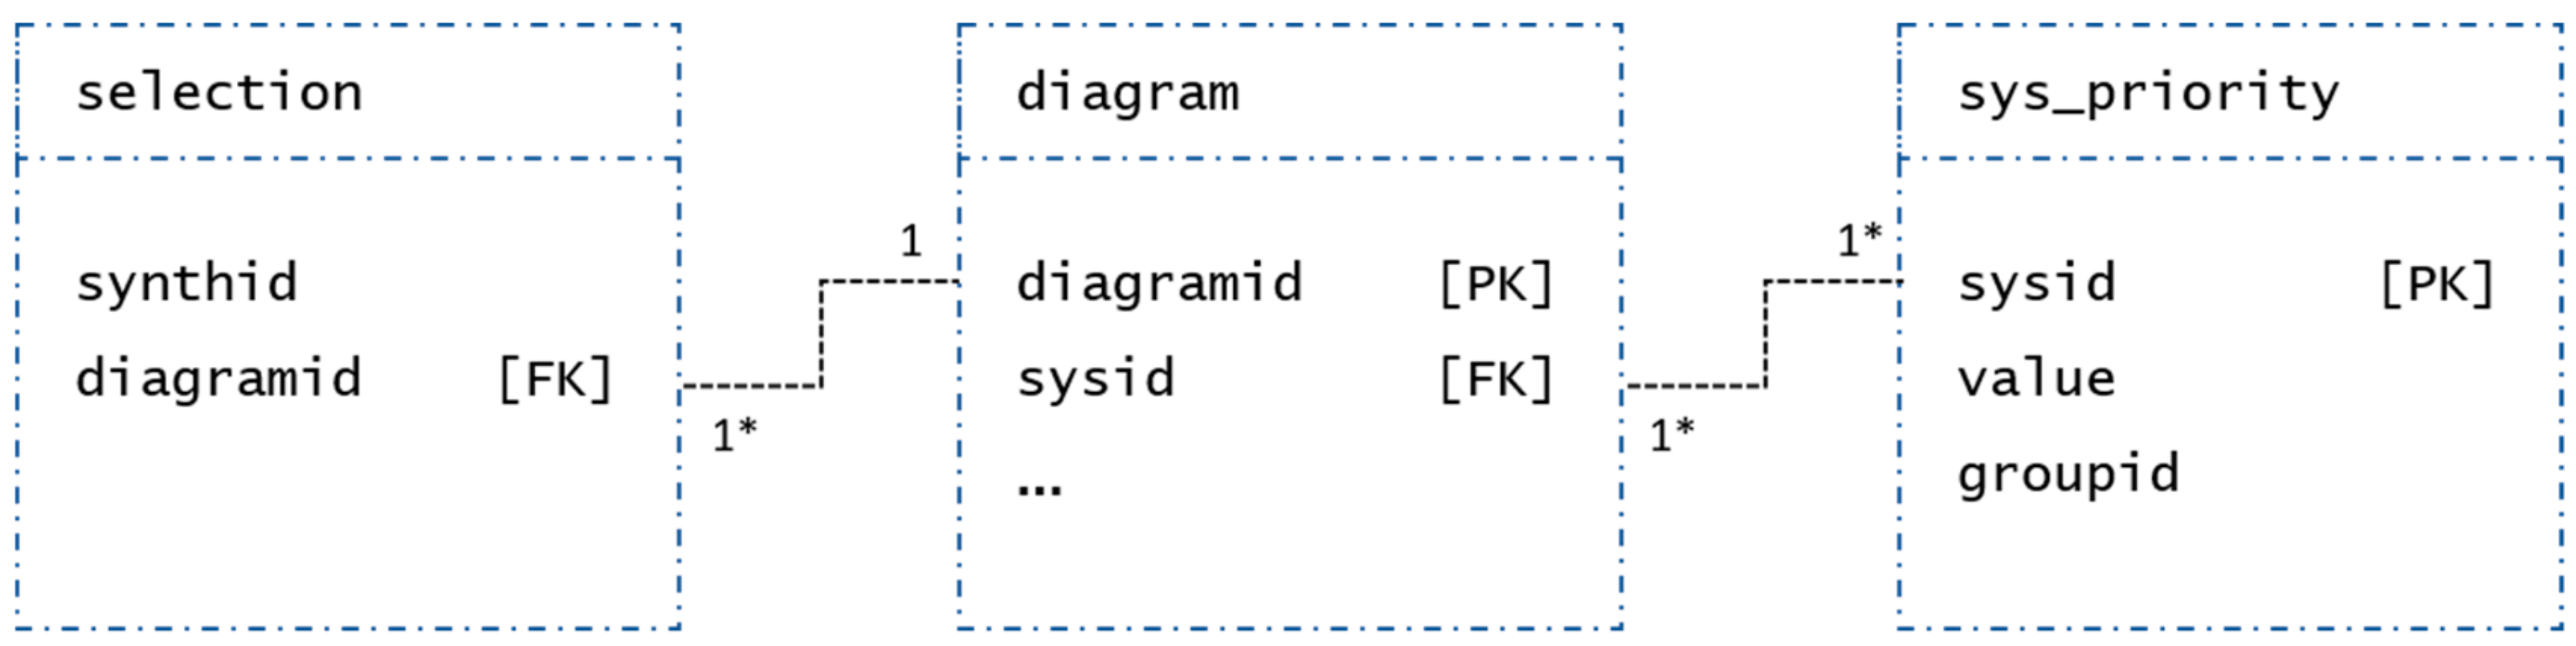
Finally, the hypothesis 4 envisages differences in groups’ views between design versions separated by the three min presentation. All groups’ versions (design 1, 2, 3 and, when present, design 4) were considered in the analysis. Using the database model, the relationship between the tables “selection”, “diagram”, and “system priority” was clearly expressed (Figure 5). Each “selection” relates to a single “diagram” while each “diagram” can be selected in many designs (“one-to-many” relationship). Likewise, each “system priority” relates to many “diagrams” and each “diagram” can be associated to different system priority weights—one for each stakeholder group (“many-to-many” relationship). The attributes of the three tables were joined to obtain an output table containing the identifier (ID) of the design version, in which the single diagram was selected, and the priority value associated with the system to which the diagram relates. Once again, the Kruskal–Wallis statistic was applied to test the alternative hypothesis.
5. Results
Following the analysis of variables organized in a geodatabase, it was possible to test the four research hypotheses using data collected during the Cagliari workshop. This section examines research findings and provides a detailed interpretation of the results reconnecting to the four operational-level research questions stated in Section 3.2.
5.1. Group Composition Influence
Figure 6 displays the density plot of all diagrams selected in all group/coalition syntheses (Figure 6a), and the box plot (Figure 6b) of the frequency of diagram selection divided in the two groups of the variable “created_byexpert” (Table 2). The data do not follow normal distribution (Figure 6a): many diagrams were selected only a few times (0–5), few diagrams were selected many times (15–22). Figure 6b shows that the diagrams created by experts had a mean value of 7 with a standard deviation of 5 due to three extreme outliers/diagrams selected more than 20 times. Conversely, the diagrams created by non-experts had a mean of 3 and standard deviation of 2.8. The results of the Wilcoxon rank-sum test confirmed our initial hypothesis: there was a significant difference between the two groups (p-value < 0.001).
The test result was instrumental in answering the first research question: “Do different participation strategies/group compositions (aspect 5) influence the number of times a diagram has been selected in the synthesis (aspect 16)?”. The success of a diagram is mainly linked to the step in which it was created. The diagrams created at the beginning of the workshop were selected more frequently than those designed in later stages. Other than the step duration time, the steps of the geodesign process differed due to group composition: experts (step 1) or non-expert stakeholders (steps 3, 4, and 6). Consequently, it is reasonable to conclude that both the duration time and group composition influenced the success of a diagram.
One possible reason for this might be the intensive and time-constrained workflow agenda of a geodesign workshop. The time available for creating additional diagrams after step 1 “Create diagrams” was very limited. Furthermore, the interface of Geodesignhub does not effectively help to identify newly-created diagrams. Diagrams are systematically organized in a matrix by the software and positioned in the column of the related system in a chronological order of creation. The new diagrams can be found only at the very bottom of the column.
Further analysis is needed to measure the confidence level in experts rather than in non-expert stakeholders. The test should be repeated with data samples from other case studies reporting on geodesign workshops. For example, Pettit et al. [11] observed the opposite trend in the Sidney geodesign workshop indicating the use of diagrams created in the latter steps of the workshop, which could be tested using the proposed methodology.
5.2. Background Information Influence
Regarding the second hypothesis, there was weak negative correlation between the number of diagrams created by each participant and their personal and professional characteristics: age (Figure 7a), education level (Figure 7b), and previous experience with GDH/PSS (Figure 7c). The Kendall’s rank correlation coefficients are respectively −0.089, −0.025, and −0.015. The correlation coefficients were statistically non-significant (p-value > 0.05 for all tests).
The other two nominal explanatory variables (academic/working area of concentration and main activity within the area of concentration) were analyzed with the one-way analysis of variance. The Kruskal–Wallis test found no significant difference in the median frequency of diagrams created between the three groups in both cases (i.e., p > 0.05).
Considering the results of the test, participants’ background did not influence the frequency of “sketching and visualization tool” use. Consequently, we have to reject our initial hypothesis for the second research question: “Does the background information (aspect 7) influence the appropriation of the “sketching and visualization tool” (aspects 11 and 14)?”. Due to the academic purpose of the Cagliari geodesign workshop and the homogeneity of participants—mainly between 26–35 years old (Table 3), postgraduate students (Table 4), and researchers (Table 5) in planning-related fields (6)—this result of the study might not hold in other cases with more diverse participant samples. It is, however, important to point out that given the participants’ previous experience with GDH/PSS (Table 5, Table 6 and Table 7), the group composition was quite diversified (none = 1, low = 11, medium = 6, high = 11). In this case study, the number of diagrams created by participants was not correlated with participants’ experience with planning and decision support systems. This early outcome seems to support a claim that the Geodesignhub platform is user-friendly and can be effectively used by users of various backgrounds. This last assertation and the corresponding hypothesis should be further verified with different cases studies, possibly providing larger and more diverse samples of participants working on realistic design and planning problems.
5.3. “Sketching and Visualization Tool” Appropriation
The number of diagrams created was also considered as a dependent variable in assessing the aspects related to the third research question: “Does the appropriation of the “sketching and visualization tool” (aspects 11 and 14) change between the teams across the steps (aspect 16)?”. Figure 8a displays a box plot of the diagrams created by each group in the five steps where the tool was used. The stakeholder groups TOUR (tourism entrepreneurs) and RAS (regional government) created, on average, more diagrams than the other groups. However, no significant differences emerged from the result of the Kruskal–Wallis test (p > 0.05). The same analysis was repeated for the teams grouped in three coalitions (Figure 8b). In this case too, the differences were non-significant (p > 0.05).
Given the results, we can conclude that the hypothesis formulated in Section 3.3 cannot be accepted: there is no statistically significant difference between the mean frequency of diagrams creation and the mean use of the “sketching and visualization tool” between the groups and across the steps. The same results can be observed when grouping the teams into coalitions. However, the statistical power of the data sample was low due to its small size and low diversity. We expect to see significant differences in larger and more diverse samples.
5.4. Group Processes Influence
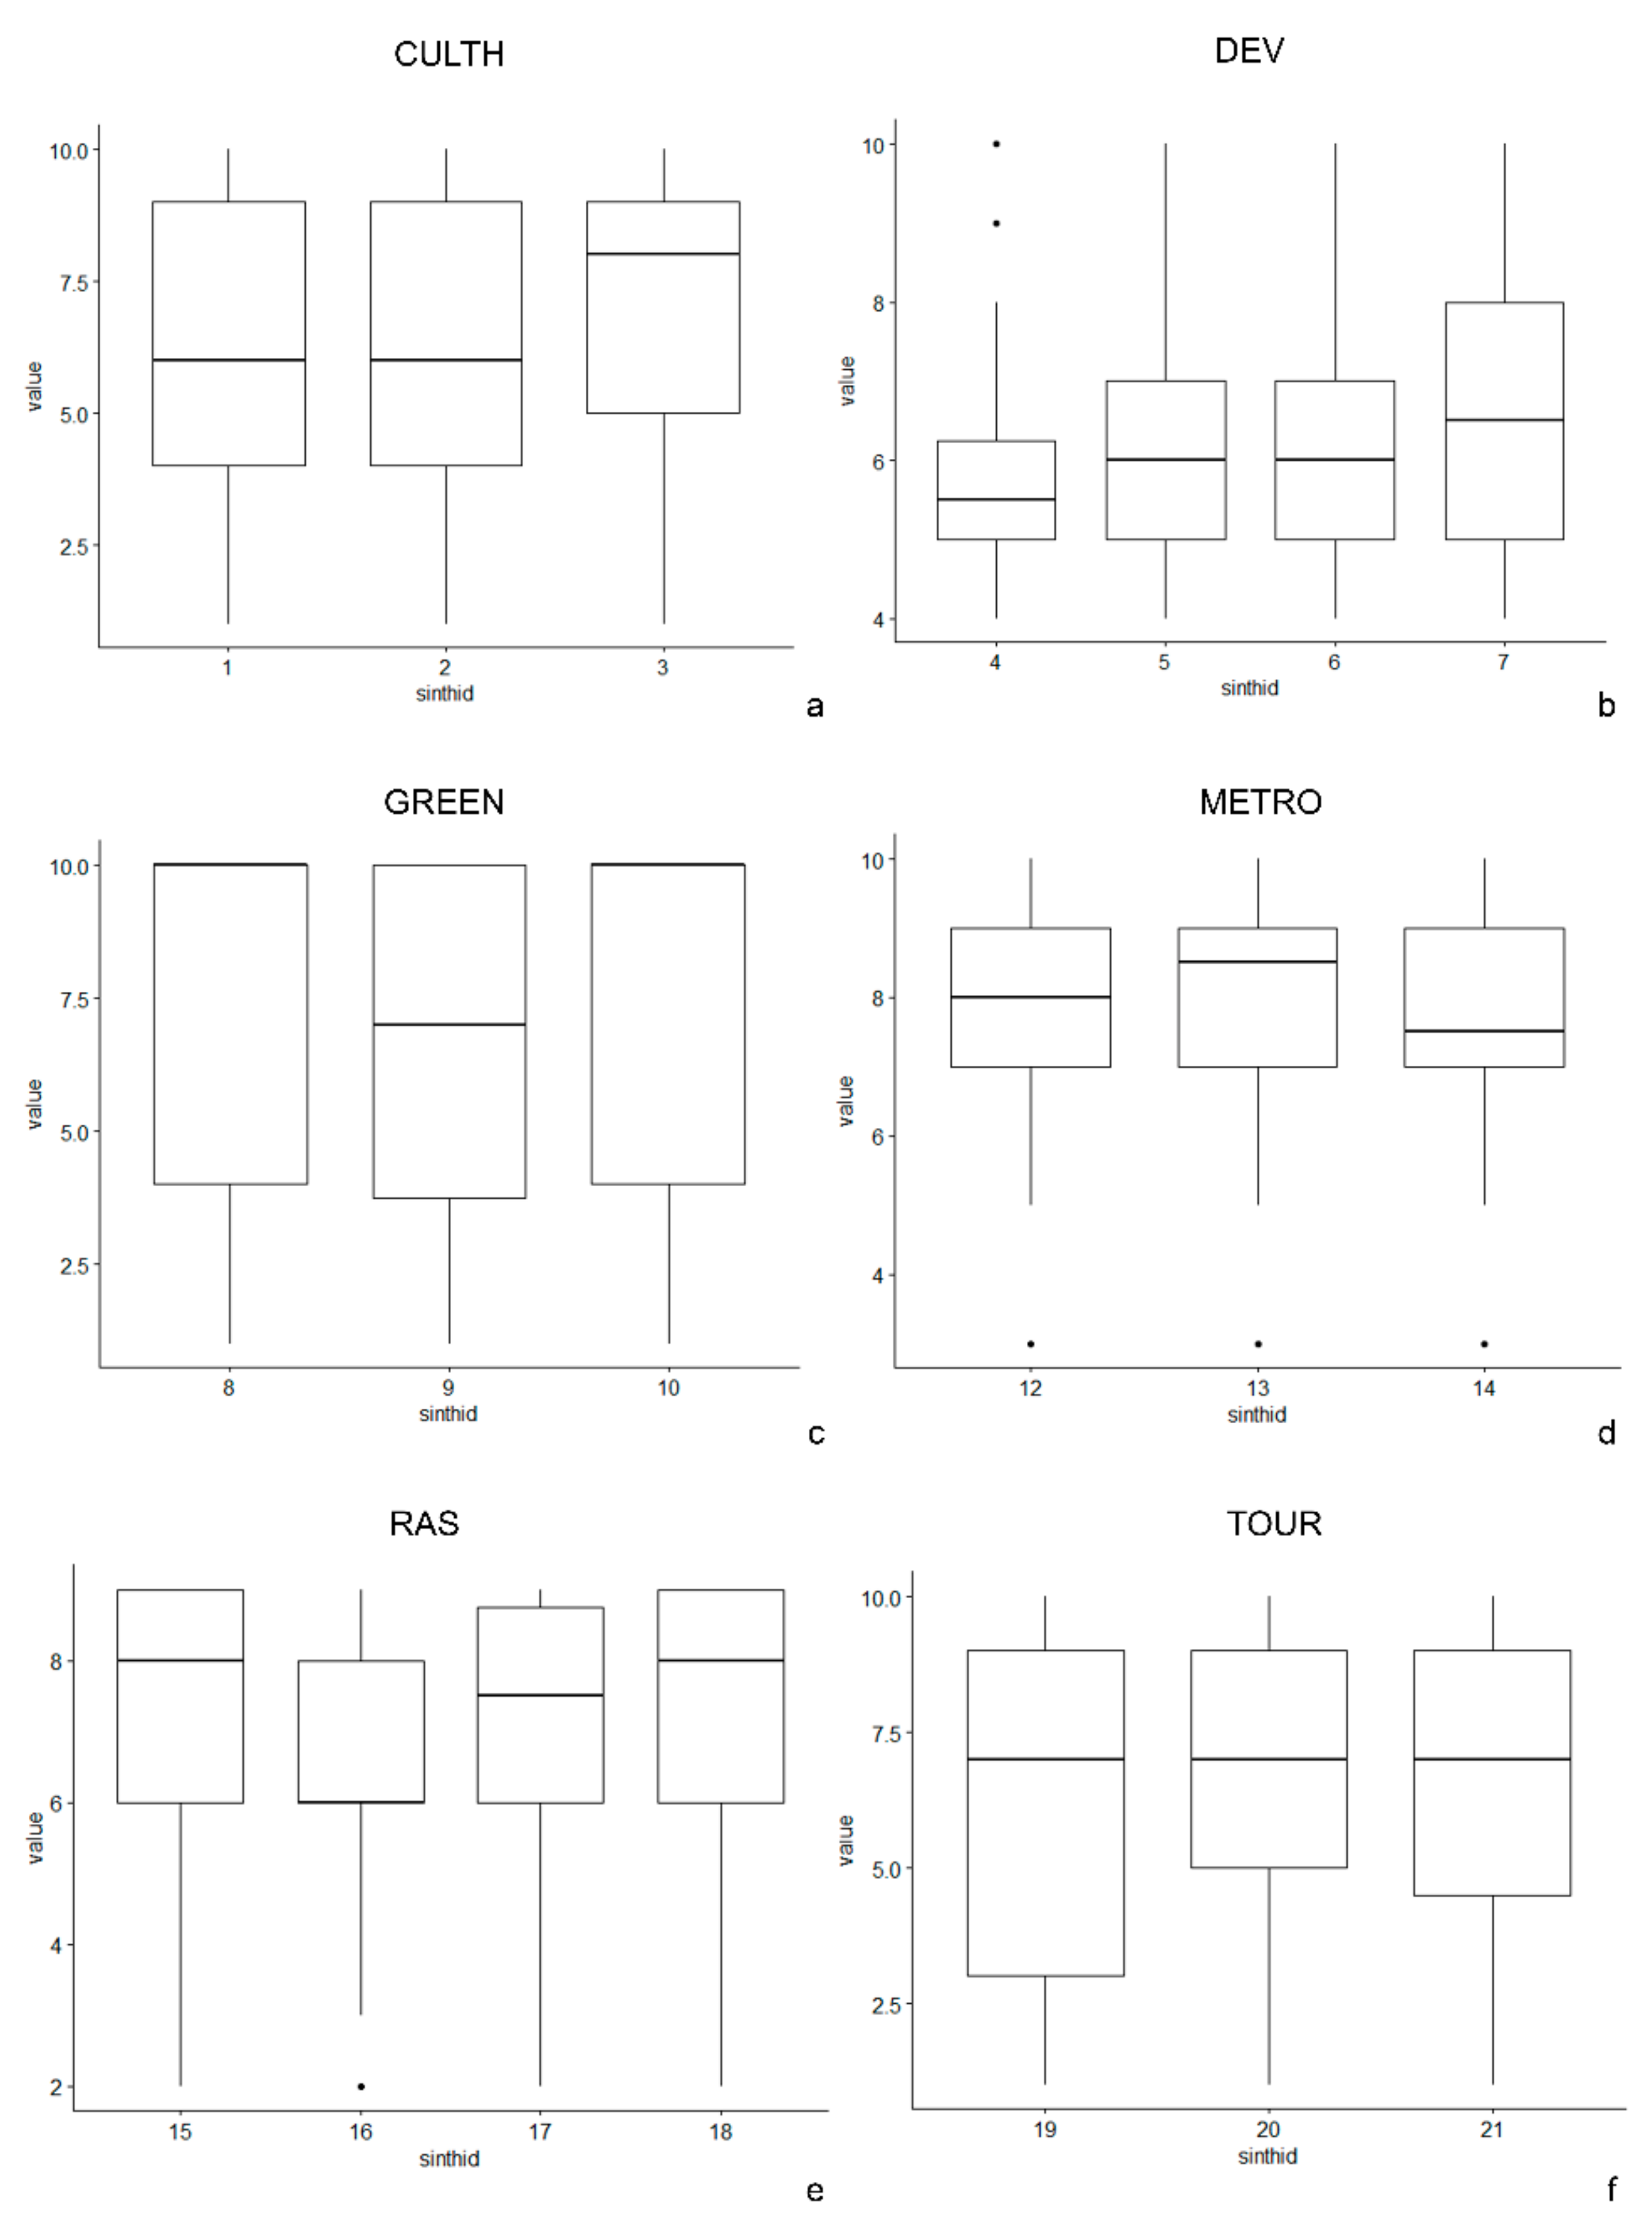
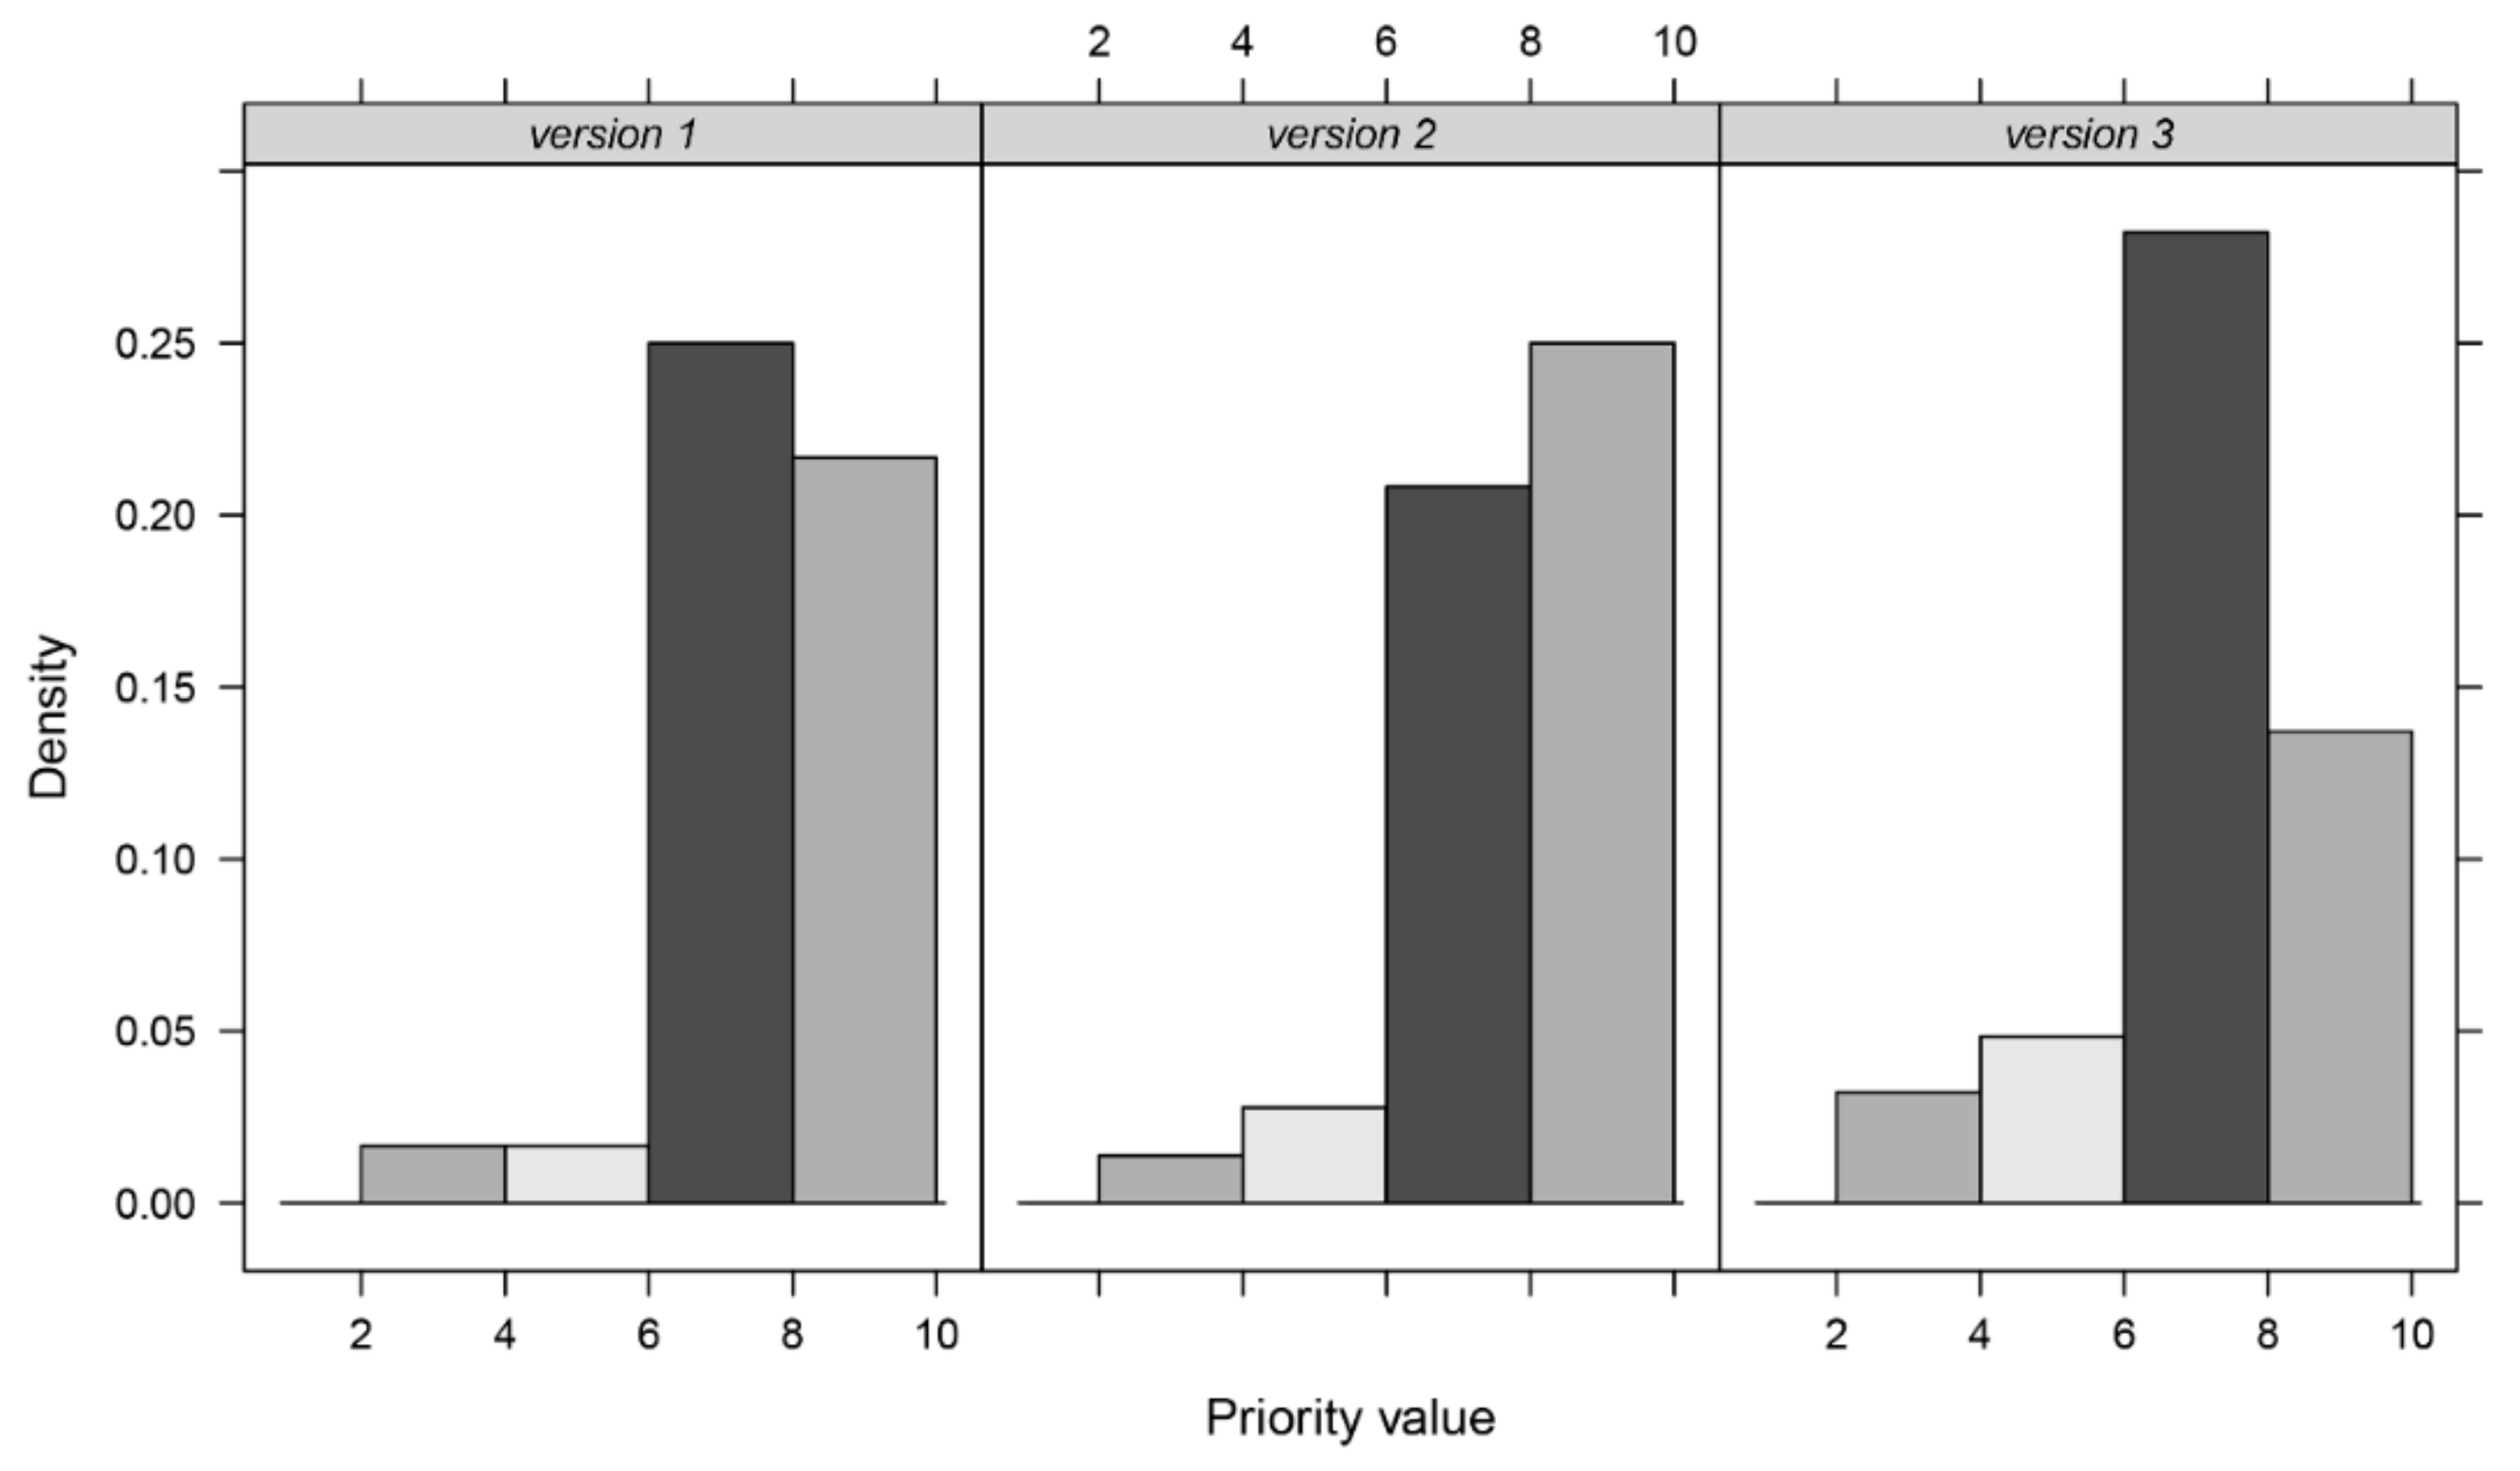
Finally, the box plots in Figure 9 show for each stakeholder team the priority values associated with the diagrams selected in the groups’ design versions produced during the workshop. The differences in the means of priority weights associated with group design versions, tested with the Kruskal–Wallis test, were statistically non-significant at the p = 0.05 level in all cases except the group METRO, which reached the significance at the p = 0.1 level. In this instance, the mean of the priority values associated with the selected diagrams differed significantly between the versions. In particular, Figure 10 shows an increase for systems of initially lower priority (value ≤6), especially between the second and the third synthesis, and a decrease in the diagram priority for systems of initially high priority (value ≥9).
The results of analytical procedure were particularly useful in responding to the fourth research question: “Do any group processes (aspect 16—e.g., public three min presentation) affect the emergence of new participants’ views (aspects 7 and 19)?” The observed trend, albeit in a single group, may justify the emergence of new groups’ views and should be further investigated. Our hypothesis can in fact be accepted only in the case of the METRO group. The Cagliari Metropolitan Government has proportionally a much greater number of professionals working in the areas of planning and design than their corresponding number among the Cagliari workshop participants. These professionals are likely experienced in participating in public meetings, delivering presentations, and thus potentially more sensitive to the cross-fertilization of ideas.
6. Discussion and Conclusions
The main goal of this research was to introduce a new set of metrics to study geodesign process dynamics and, consequently, contribute to developing an efficient analytics strategy within the GDPA framework. The employed log-data management workflow made it possible to obtain empirical and quantifiable feedback on the design process dynamics, while the analytical procedure of statistically testing the significance of possible causal effects and/or relationships between variables ensured the reliability and reproducibility of test results.
Limitations of the Cagliari workshop dataset (small and homogenous sample of participants) and of a single case study did not allow for testing of a more comprehensive set of hypotheses, than presented in this paper. However, the proposed methodology leverages log-data analytic capabilities to gain a meaningful and nuanced understanding of complex collaborative planning processes. The key actions (e.g., add a diagram, save a synthesis) of the participants involved in a Geodesignhub project, along with their main characteristics (e.g., background information, group composition), were recorded in structured log-data, processed and analyzed providing insights into diagram selection patterns (hypotheses 1 and 4) and technology-use dynamics (hypotheses 2 and 3). With reference to the analyzed case study, it was observed that (1) the success of a diagram seems to be influenced by the time when it was created during the process and the group composition at a given process step. Conversely, (2) the occupational, expertise, and skill characteristics of participants do not seem to influence the usage of “sketching and visualization tool”. The frequency of using the tool is measured by the number of diagrams created by the participant and (3) does not change significantly across the steps between the six groups. Furthermore, (4) new group views can be generated throughout the process of collaborative design development.
The overall results of hypothesis testing show the appropriateness of the metrics chosen to analyze the log-data made available for the first time by a PSS (i.e., Geodesignhub). The potential of this new type of data within the design domain is promising and has only been partially explored in this study. Preliminary results provide evidence that the analysis of log-data can help understand past geodesign processes. The insights into the process dynamics gained from this study can serve as a basis for comparison among different past case studies in a post-workshop analysis. The validity and applicability of the proposed methodology needs to be further assessed by applying the metrics to a wider number of sample datasets. This in turn, could help to generalize findings and possibly to identify recurrent patterns in participants’ behaviors and design evolution, which may eventually contribute to a more informed implementation of the concept of meta-planning. In this respect, describing and explaining the workflows of geodesign case studies can help improve future processes, enhance existing technologies as well as develop ad-hoc supporting digital tools. We argue, in fact, that the management of future planning processes could be significantly improved by better understanding of its internal dynamics and dependencies.
In a similar vein, the work presented here—as part of the comprehensive framework of GDPA—can be extended to ensure real-time information on workshop process dynamics, which in turn can lead to the development of automated and integrated real-time monitoring systems to support the workshop facilitators in effectively orchestrating the geodesign workflow.
In addition to the main research questions, we have been particularly interested in assessing the applicability of EAST2 as a planning framework to help understand geodesign processes. Projecting the conceptual framework of EAST2 theory onto the geodesign workshop workflow allowed us to identify significant aspects for understanding the process. The questions and hypothesis formulated in Section 3 act as the organizing framework for the log-data analysis. Although it is currently not possible to measure all the identified dynamics by merely exploiting the information collected in the log-data, the results achieved so far demonstrate the potential of EAST2 in guiding the analysis of past geodesign workshops. Ultimately, the study confirms the effectiveness of the framework in characterizing aspects and relations relevant for a broad class of collaborative decision-making processes including the geodesign process.
Author Contributions
This work is an outcome of joint efforts of the authors: Conceptualization, C.C., P.J. and M.C.; data curation, C.C.; formal analysis, C.C.; investigation, C.C.; methodology, C.C., P.J. and M.C.; software, C.C.; supervision, P.J. and M.C.; validation, C.C. and P.J.; visualization, C.C.; writing—original draft, C.C., P.J. and M.C.; writing—review and editing, C.C., P.J. and M.C.
Funding
Chiara Cocco gratefully acknowledges Sardinia Regional Government for the financial support of her PhD scholarship (P.O.R. Sardegna F.S.E. Operational Program of the Autonomous Region of Sardinia, European Social Fund 2014–2020—Axis III Education and training, Thematic goal 10, Priority of investment 10ii.). Piotr Jankowski was supported by a sabbatical from San Diego State University and a Fulbright Scholar fellowship from Polish-U.S. Fulbright Commission. The support of these institutions is gratefully acknowledged.
Conflicts of Interest
The authors declare no conflict of interest.
References
- Moroni, S. Towards a Reconstruction of the Public Interest Criterion. Plan. Theory 2004, 3, 151–171. [Google Scholar] [CrossRef]
- Rittel, H.W.J.; Webber, M.M. Dilemmas in a General Theory of Planning. Policy Sci. 1973, 4, 155–169. [Google Scholar] [CrossRef]
- Khakee, A. Evaluation and planning: Inseparable concepts. Town Plan. Rev. 1998, 69, 359–374. [Google Scholar] [CrossRef]
- Davidoff, P. Advocacy and pluralism in planning. J. Am. Inst. Plan. 1965, 31, 331–338. [Google Scholar] [CrossRef]
- Healey, P. Collaborative planning in a stakeholder society. Town Plan. Rev. 1998, 69. [Google Scholar] [CrossRef]
- Innes, J.E.; Booher, D.E. Planning with Complexity: An Introduction to Collaborative Rationality for Public Policy; Routledge: London, UK, 2010; ISBN 1-135-19427-0. [Google Scholar]
- Faludi, A. Planning Theory; Pergamon Press: Oxford, UK, 1973; ISBN 978-0-08-017741-0. [Google Scholar]
- Rittel, H.W.J. On the planning crisis: Systems analysis of the ‘first and second generations’. Bedriftsokonomen 1972, 8, 390–396. [Google Scholar]
- Steinitz, C. A Framework for Geodesign: Changing Geography by Design; Esri Press: Redlands, CA, USA, 2012. [Google Scholar]
- Jankowski, P.; Nyerges, T. Geographic Information Sistems for Group Decision Making; CRC Press: London, UK, 2001; ISBN 978-0-203-48490-6. [Google Scholar]
- Pettit, C.; Hawken, S.; Zarpelon, S.; Ticzon, C.; Afrooz, A.; Steinitz, C.; Ballal, H.; Canfield, T.; Lieske, S. Breaking Down the Silos Through Geodesign—Envisioning Sydney’s Urban future. Environ. Plan. B Urban Anal. City Sci. 2019, in press. [Google Scholar]
- Friedmann, J. Retracking America: A Theory of Transactive Planning; Anchor Press: Garden City, NY, USA, 1973. [Google Scholar]
- Healey, P. Planning through Debate: The Communicative Turn in Planning Theory. In The Argumentative Turn in Policy Analysis and Planning; Fischer, F., Forester, J., Eds.; Duke University Press: Durham, NC, USA, 1993; ISBN 978-0-8223-1354-0. [Google Scholar]
- Geertman, S. PSS: Beyond the implementation gap. Transp. Res. Part A Policy Pract. 2017, 104, 70–76. [Google Scholar] [CrossRef]
- Pettit, C.; Bakelmun, A.; Lieske, S.N.; Glackin, S.; Thomson, G.; Shearer, H.; Dia, H.; Newman, P. Planning support systems for smart cities. City Cult. Soc. 2018, 12, 13–24. [Google Scholar] [CrossRef]
- Campagna, M. Metaplanning: About designing the Geodesign process. Landsc. Urban Plan. 2016, 156, 118–128. [Google Scholar] [CrossRef]
- Ballal, H. Collaborative Planning with Digital Design Synthesis. Ph.D. Thesis, UCL (University College London), London, UK, 2015. [Google Scholar]
- Conte, R.; Gilbert, N.; Bonelli, G.; Cioffi-Revilla, C.; Deffuant, G.; Kertesz, J.; Loreto, V.; Moat, S.; Nadal, J.-P.; Sanchez, A.; et al. Manifesto of computational social science. Eur. Phys. J. Spec. Top. 2012, 214, 325–346. [Google Scholar] [CrossRef] [Green Version]
- Van Der Aalst, W. Process Mining: Discovery, Conformance and Enhancement of Business Processes; Springer: Berlin, Germany, 2011; Volume 2. [Google Scholar]
- Cooley, R.; Mobasher, B.; Srivastava, J. Web mining: Information and pattern discovery on the World Wide Web. In Proceedings of the Ninth IEEE International Conference on Tools with Artificial Intelligence, Newport Beach, CA, USA, 3–8 November 1997; pp. 558–567. [Google Scholar]
- Nasraoui, O.; Soliman, M.; Saka, E.; Badia, A.; Germain, R. A Web usage mining framework for mining evolving user profiles in dynamic Web sites. IEEE Trans. Knowl. Data Eng. 2008, 20, 202–215. [Google Scholar] [CrossRef]
- Iqbal, F.; Fung, B.C.M.; Debbabi, M.; Batool, R.; Marrington, A. Wordnet-Based Criminal Networks Mining for Cybercrime Investigation. IEEE Access 2019, 7, 22740–22755. [Google Scholar] [CrossRef]
- Zhang, L.; Ashuri, B. BIM log mining: Discovering social networks. Autom. Constr. 2018, 91, 31–43. [Google Scholar] [CrossRef]
- Becattini, N.; Cascini, G.; O’Hare, J.A.; Morosi, F.; Boujut, J.-F. Extracting and Analysing Design Process Data from Log Files of ICT Supported Co-Creative Sessions. In Proceedings of the Design Society: International Conference on Engineering Design, Delft, The Netherlands, 5–8 August 2019; Volume 1, pp. 129–138. [Google Scholar] [CrossRef]
- Zhang, L.; Wen, M.; Ashuri, B. BIM Log Mining: Measuring Design Productivity. J. Comput. Civ. Eng. 2018, 32, 04017071. [Google Scholar] [CrossRef]
- Carrera, B.; Lee, J.; Jung, J.-Y. Discovering Information Diffusion Processes Based on Hidden Markov Models for Social Network Services. In Proceedings of the Asia Pacific Business Process Management, Busan, Korea, 24–26 June 2015; pp. 170–182. [Google Scholar]
- Campagna, M. Social Media Geographic Information: Why social is special when it goes spatial. In European Handbook Crowdsourced Geographic Information; Ubiquity Press: London, UK, 2016; pp. 45–54. [Google Scholar]
- Ghodousi, M.; Alesheikh, A.A.; Saeidian, B. Analyzing public participant data to evaluate citizen satisfaction and to prioritize their needs via K-means, FCM and ICA. Cities 2016, 55, 70–81. [Google Scholar] [CrossRef]
- Ashtari, D.; de Lange, M. Playful civic skills: A transdisciplinary approach to analyse participatory civic games. Cities 2019, 89, 70–79. [Google Scholar] [CrossRef]
- Wilson, M.W. On the criticality of mapping practices: Geodesign as critical GIS? Landsc. Urban Plan. 2015, 142, 226–234. [Google Scholar] [CrossRef]
- Orland, B.; Steinitz, C. Improving our Global Infrastructure: The International Geodesign Collaboration. In Proceedings of the Journal of Digital Landscape Architecture, Dessau, Germany, 22–25 May 2019; Volume 4, pp. 213–219. [Google Scholar]
- Miller, W.R. Introducing Geodesign: The Concept; Esri Press: Redlands, CA, USA, 2012. [Google Scholar]
- Geertman, S.; Stillwell, J. Planning support systems: An inventory of current practice. Comput. Environ. Urban Syst. 2004, 28, 291–310. [Google Scholar] [CrossRef]
- Vonk, G.; Geertman, S.; Schot, P. Bottlenecks blocking widespread usage of planning support systems. Environ. Plan. A 2005, 37, 909–924. [Google Scholar] [CrossRef]
- Campagna, M.; Carl, S.; Di Cesare, E.A.; Cocco, C.; Hrishikesh, B.; Tess, C. Collaboration in planning: The Geodesign approach. Rozwój Regionalny i Polityka Regionalna 2016, 35, 55–72. [Google Scholar]
- Geodesignhub. Available online: https://www.geodesignhub.com (accessed on 11 September 2019).
- Araújo, R.P.; Moura, A.C.M.; Nogueira, T. Creating Collaborative Environments for the Development of Slum Upgrading and Illegal Settlement Regularization Plans in Brazil: The Maria Tereza Neighborhood Case in Belo Horizonte. Int. J. E-Plan. Res. 2018, 7, 25–43. [Google Scholar]
- Nyerges, T.; Ballal, H.; Steinitz, C.; Canfield, T.; Roderick, M.; Ritzman, J.; Thanatemaneerat, W. Geodesign dynamics for sustainable urban watershed development. Sustain. Cities Soc. 2016, 25, 13–24. [Google Scholar] [CrossRef] [Green Version]
- Rivero, R.; Smith, A.; Ballal, H.; Steinitz, C. Promoting collaborative Geodesign in a multidisciplinary and multiscale environment: Coastal Georgia 2050, USA. Digit. Landsc. Archit. 2015, 1, 42–58. [Google Scholar]
- Freitas, C.R.; Moura, A.C.M. ETL Tools to Analyze Diagrams’ Performance: Favoring Negotiations in Geodesign Workshops. Disegnarecon 2018, 11, 15.1–15.23. [Google Scholar]
- Cocco, C.; Campagna, M. Toward a Geodesign Process Analytics. DISEGNARECON 2018, 11, 3.1–3.8. [Google Scholar]
- Nyerges, T.L.; Jankowski, P. Regional and Urban GIS: A Decision Support Approach; Guilford Press: New York, NY, USA, 2009; ISBN 1-60623-906-6. [Google Scholar]
- Nyerges, T.L.; Jankowski, P. Enhanced adaptive structuration theory: A theory of gis-supported collaborative decision making. Geogr. Syst. 1997, 4, 225–259. [Google Scholar]
- Albert, C.; Von Haaren, C.; Vargas-Moreno, J.C.; Steinitz, C. Teaching Scenario-Based Planning for Sustainable Landscape Development: An Evaluation of Learning Effects in the Cagliari Studio Workshop. Sustainability 2015, 7, 6872–6892. [Google Scholar] [CrossRef] [Green Version]
- Wilcoxon, F. Individual comparisons by ranking methods. Biom. Bull. 1945, 1, 80–83. [Google Scholar] [CrossRef]
- Kendall, M.G. Rank Correlation Methods, 2nd ed.; Hafner Publishing Co.: Oxford, UK, 1955. [Google Scholar]
- Kruskal, W.H.; Wallis, W.A. Use of ranks in one-criterion variance analysis. J. Am. Stat. Assoc. 1952, 47, 583–621. [Google Scholar] [CrossRef]
Figure 1.
The workflow of a typical geodesign workshop supported by Geodesignhub (GDH) platform and represented in standard Business Process Model and Notation (BPMN).
Figure 1.
The workflow of a typical geodesign workshop supported by Geodesignhub (GDH) platform and represented in standard Business Process Model and Notation (BPMN).

Figure 2.
Conceptual data model of Geodesignhub log-data.
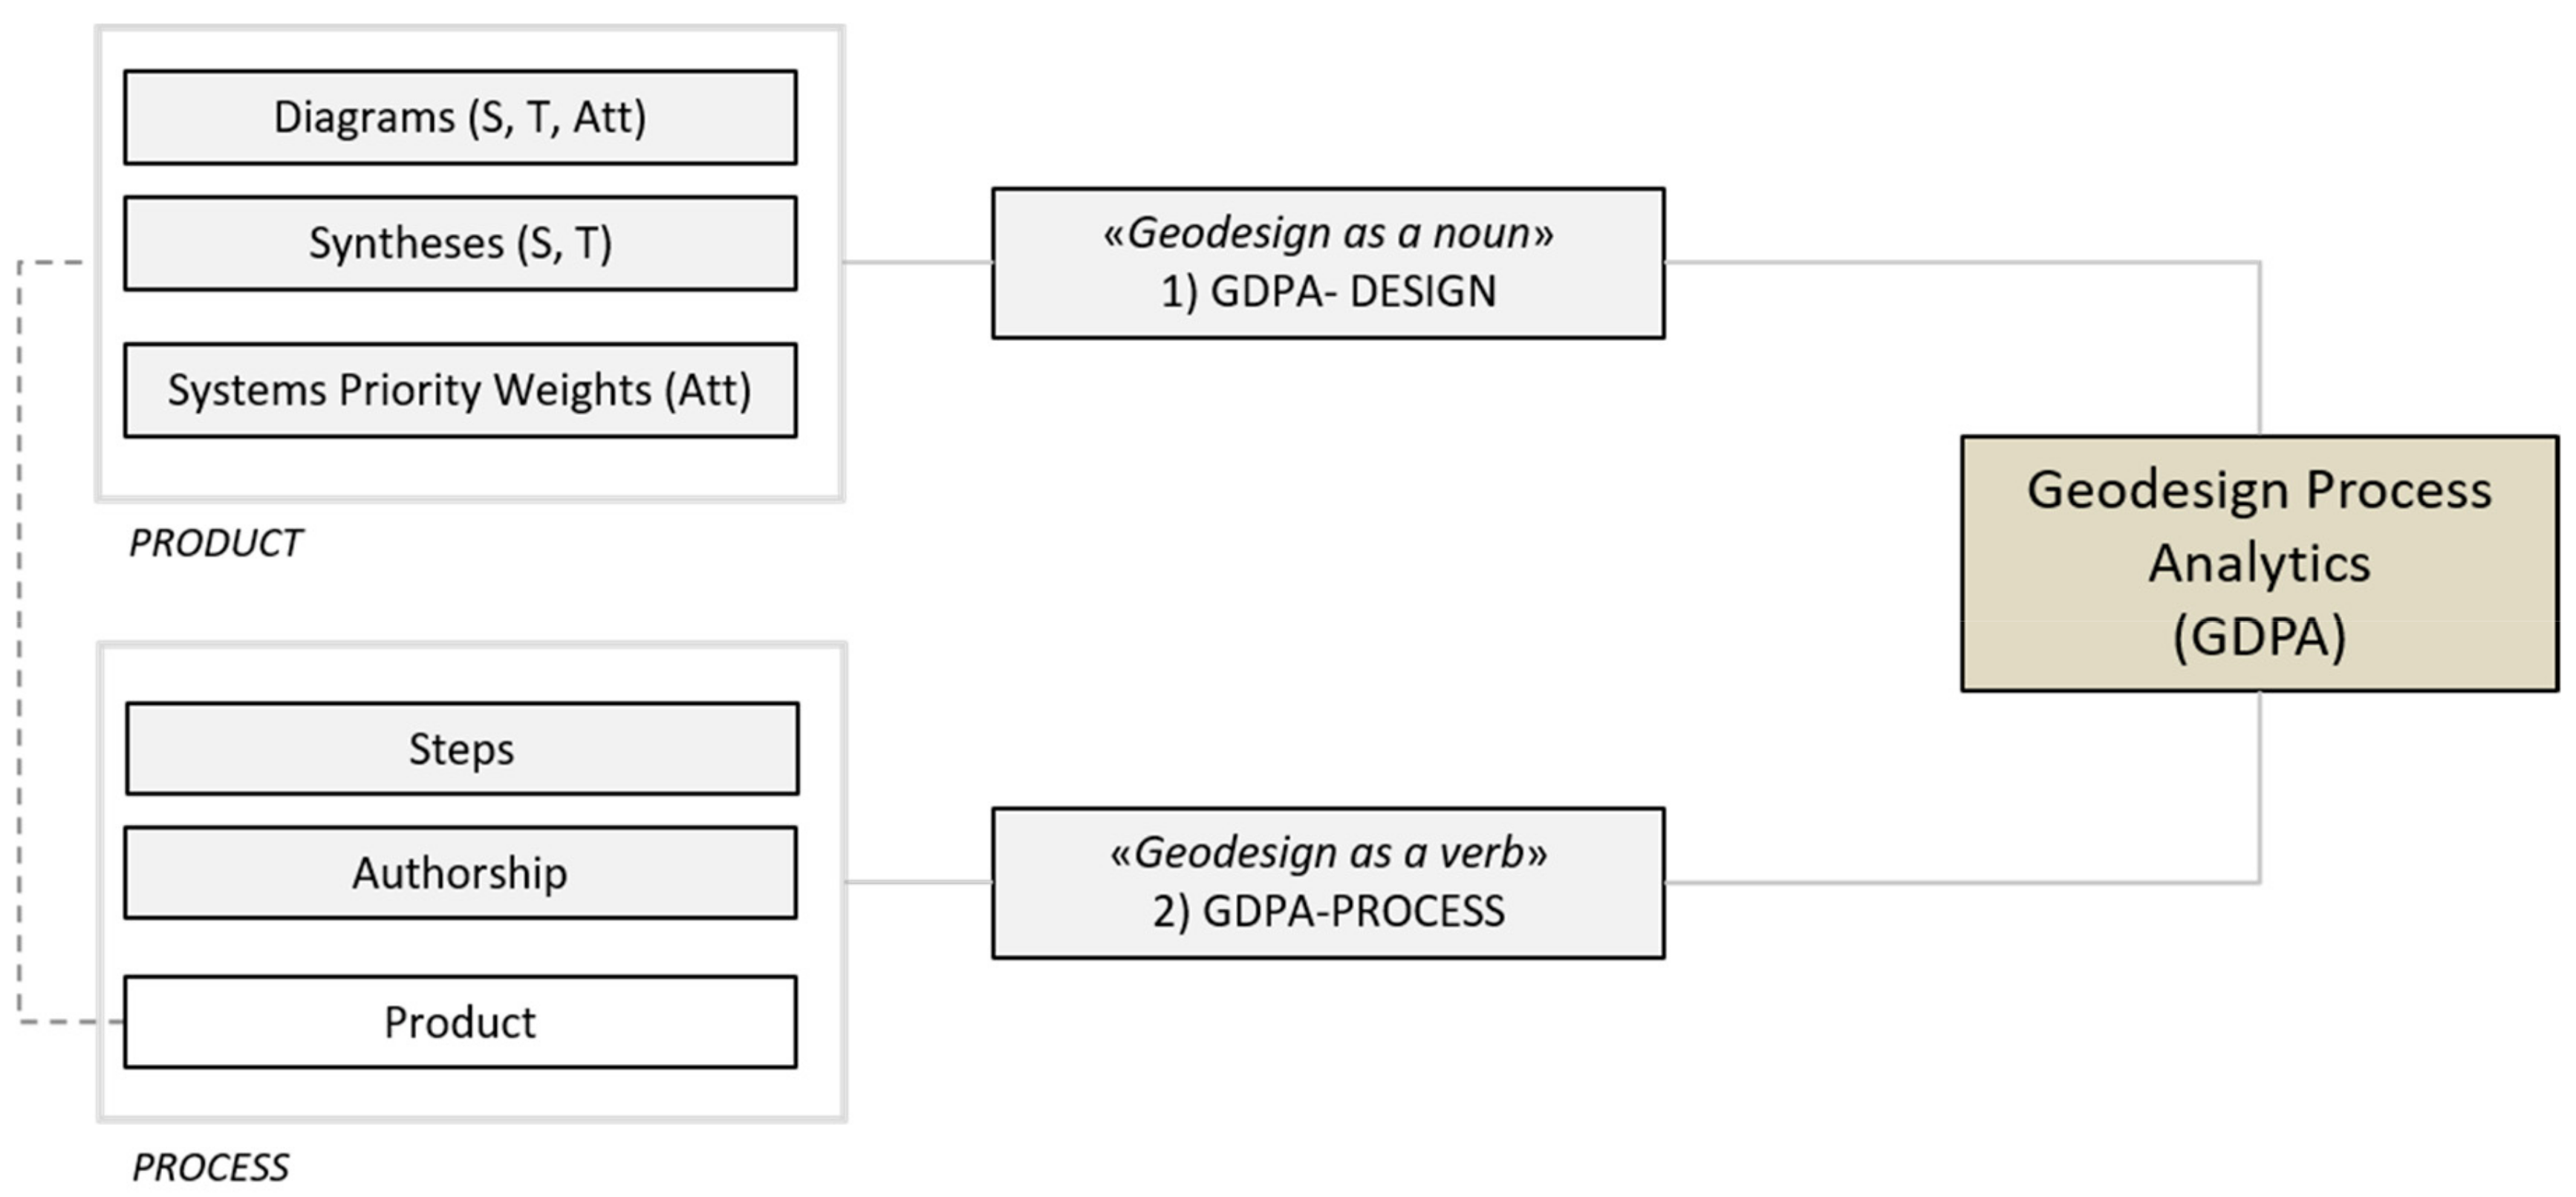
Figure 3.
Conceptual map of the enhanced adaptive structuration theory (EAST2).

Figure 4.
Logical data model of the Cagliari geodesign workshop log-data geodatabase.
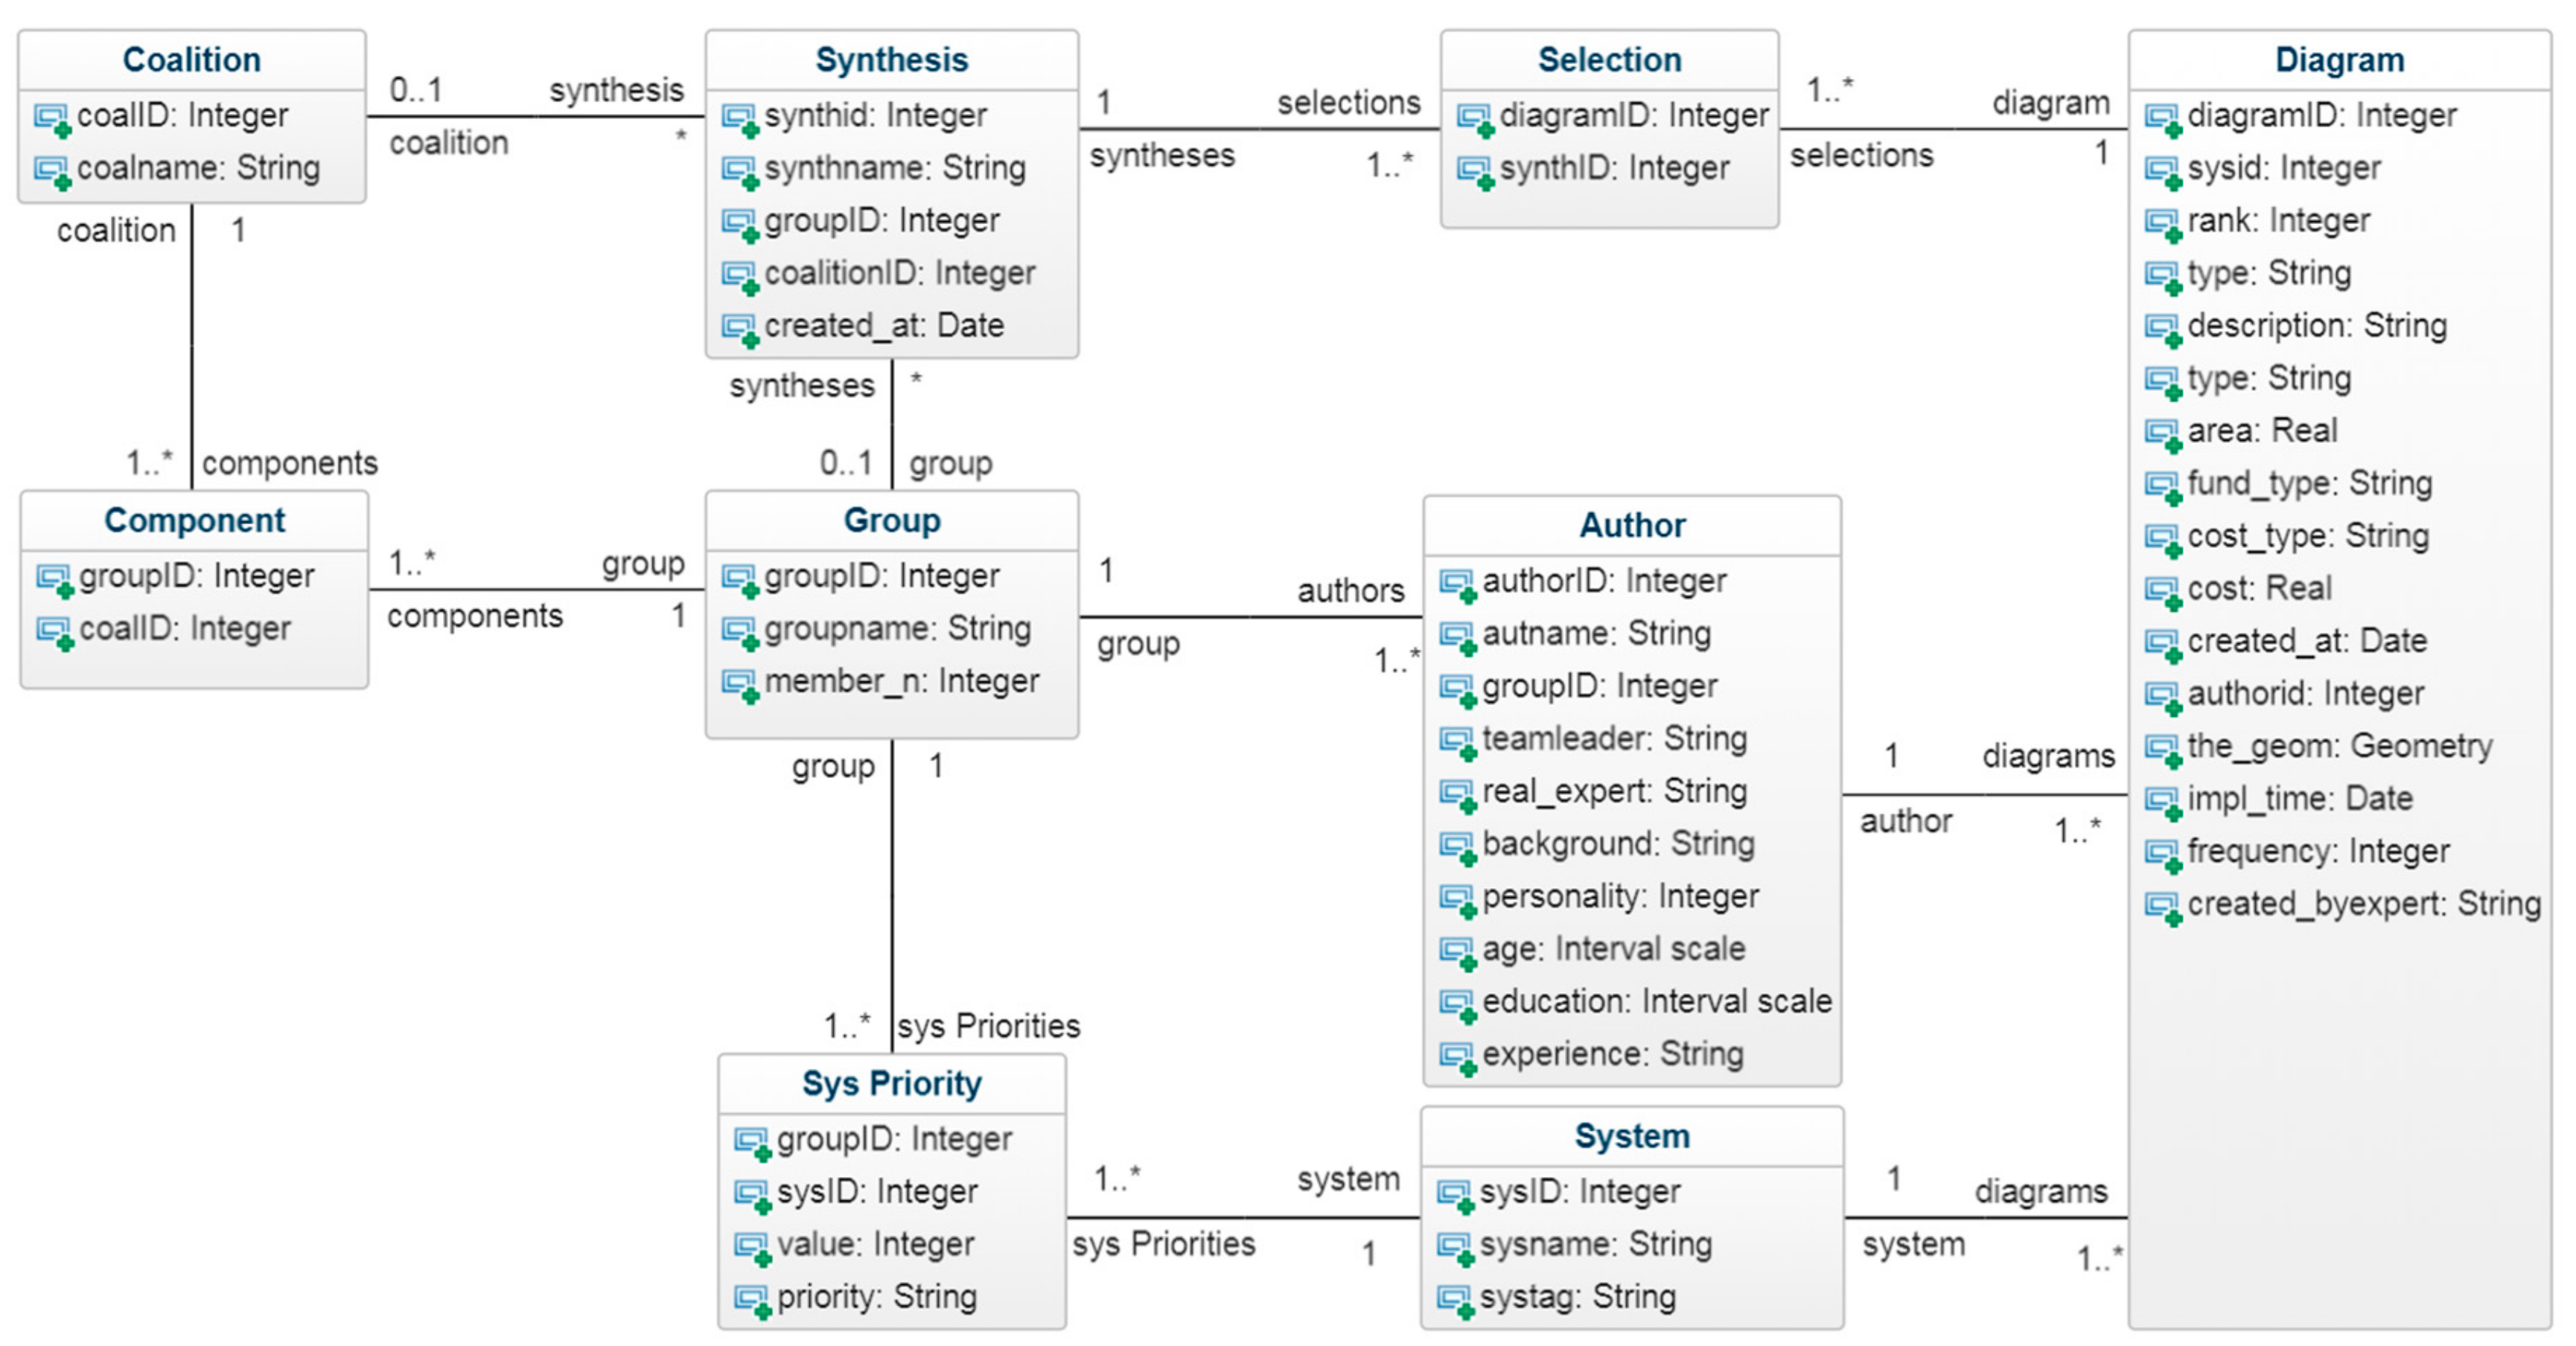
Figure 5.
Excerpt of the Cagliari workshop data model showing in detail the relationship between the tables “selection”, “diagram”, and “system priority”. A “one-to-many” (1*–1) relationship connects the “selection” and “diagram” tables. A “many-to-many” (1*–1*) relationship connects “diagram” and “sys_priority” tables.

Figure 6.
(a) Density plot of all diagrams selected in the group/coalition syntheses; (b) box plot of the frequency of diagrams selection in the groups of the variable “created_byexpert”.
Figure 6.
(a) Density plot of all diagrams selected in the group/coalition syntheses; (b) box plot of the frequency of diagrams selection in the groups of the variable “created_byexpert”.

Figure 7.
Scatter plots of diagrams created by age group (a), education level (b), and previous experience with GDH/PSS (c).
Figure 7.
Scatter plots of diagrams created by age group (a), education level (b), and previous experience with GDH/PSS (c).
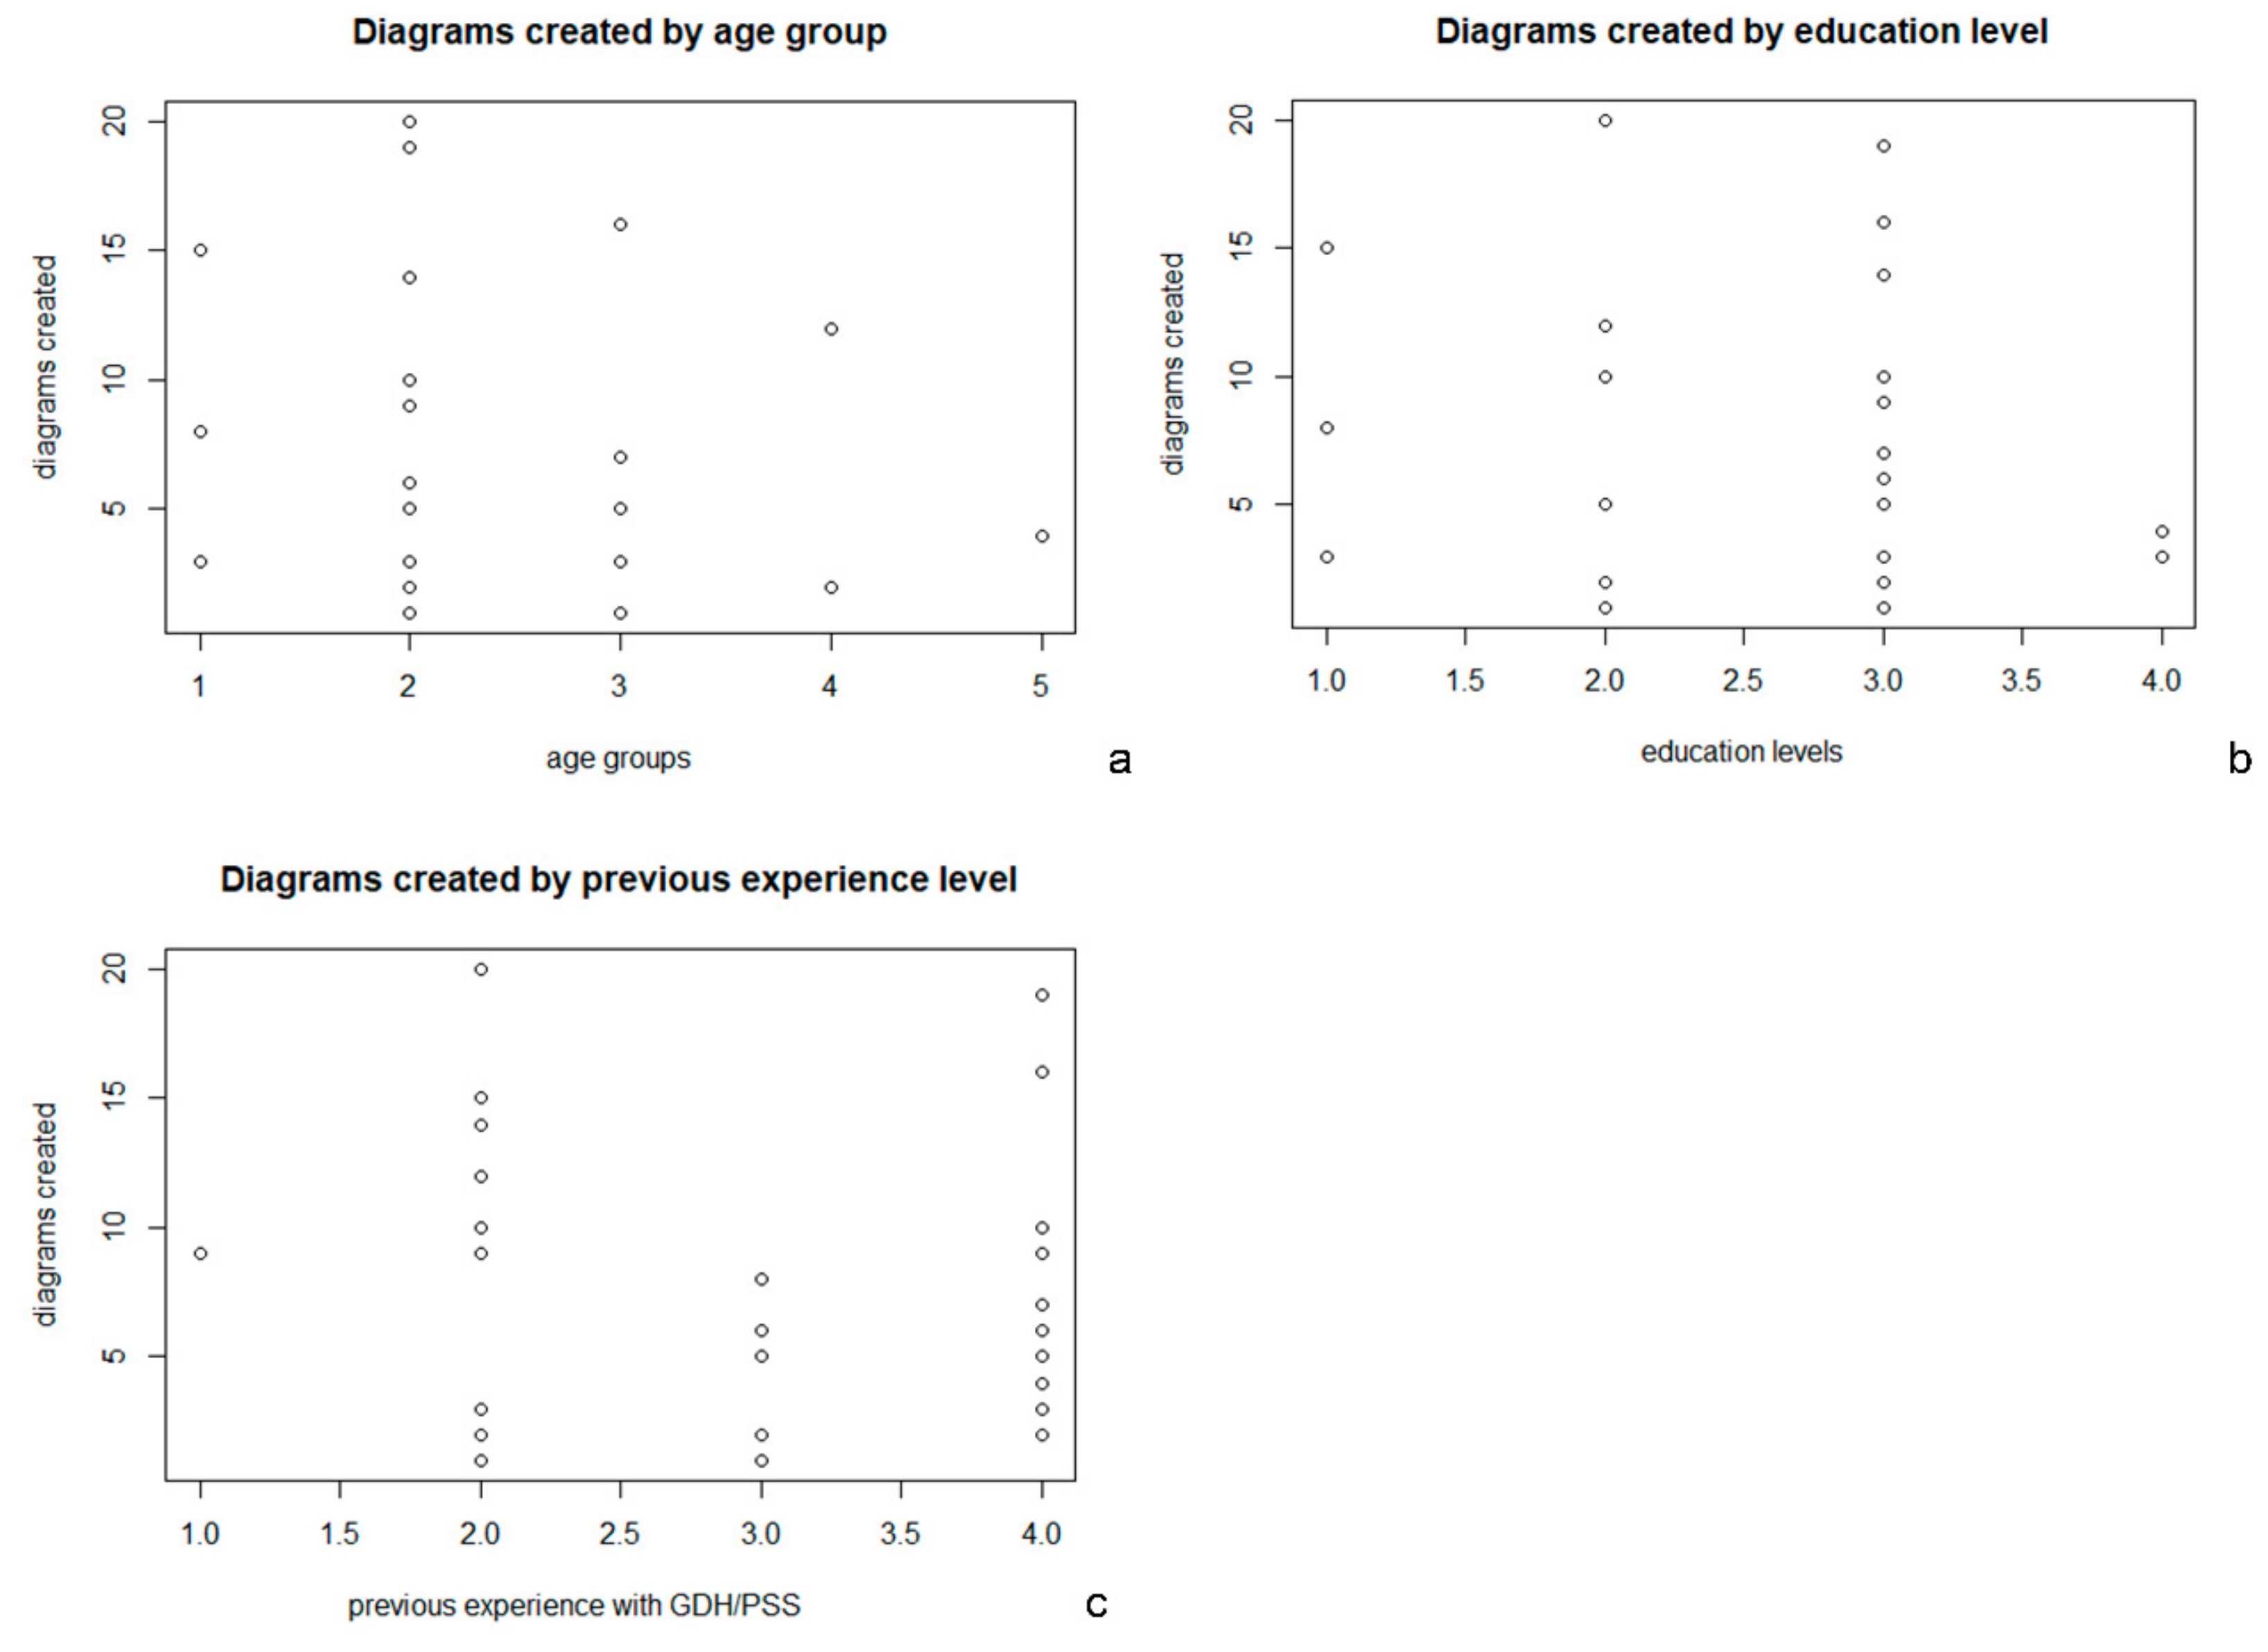
Figure 8.
Box plots of the frequency of diagrams created by group (a) and by coalition (b). Abbreviations: metropolitan government—METRO; regional government—RAS; green and non-governmental organization (NGO)—GREEN; cultural heritage conservation—CULTH; developers—DEV; tourism entrepreneurs—TOUR.
Figure 8.
Box plots of the frequency of diagrams created by group (a) and by coalition (b). Abbreviations: metropolitan government—METRO; regional government—RAS; green and non-governmental organization (NGO)—GREEN; cultural heritage conservation—CULTH; developers—DEV; tourism entrepreneurs—TOUR.
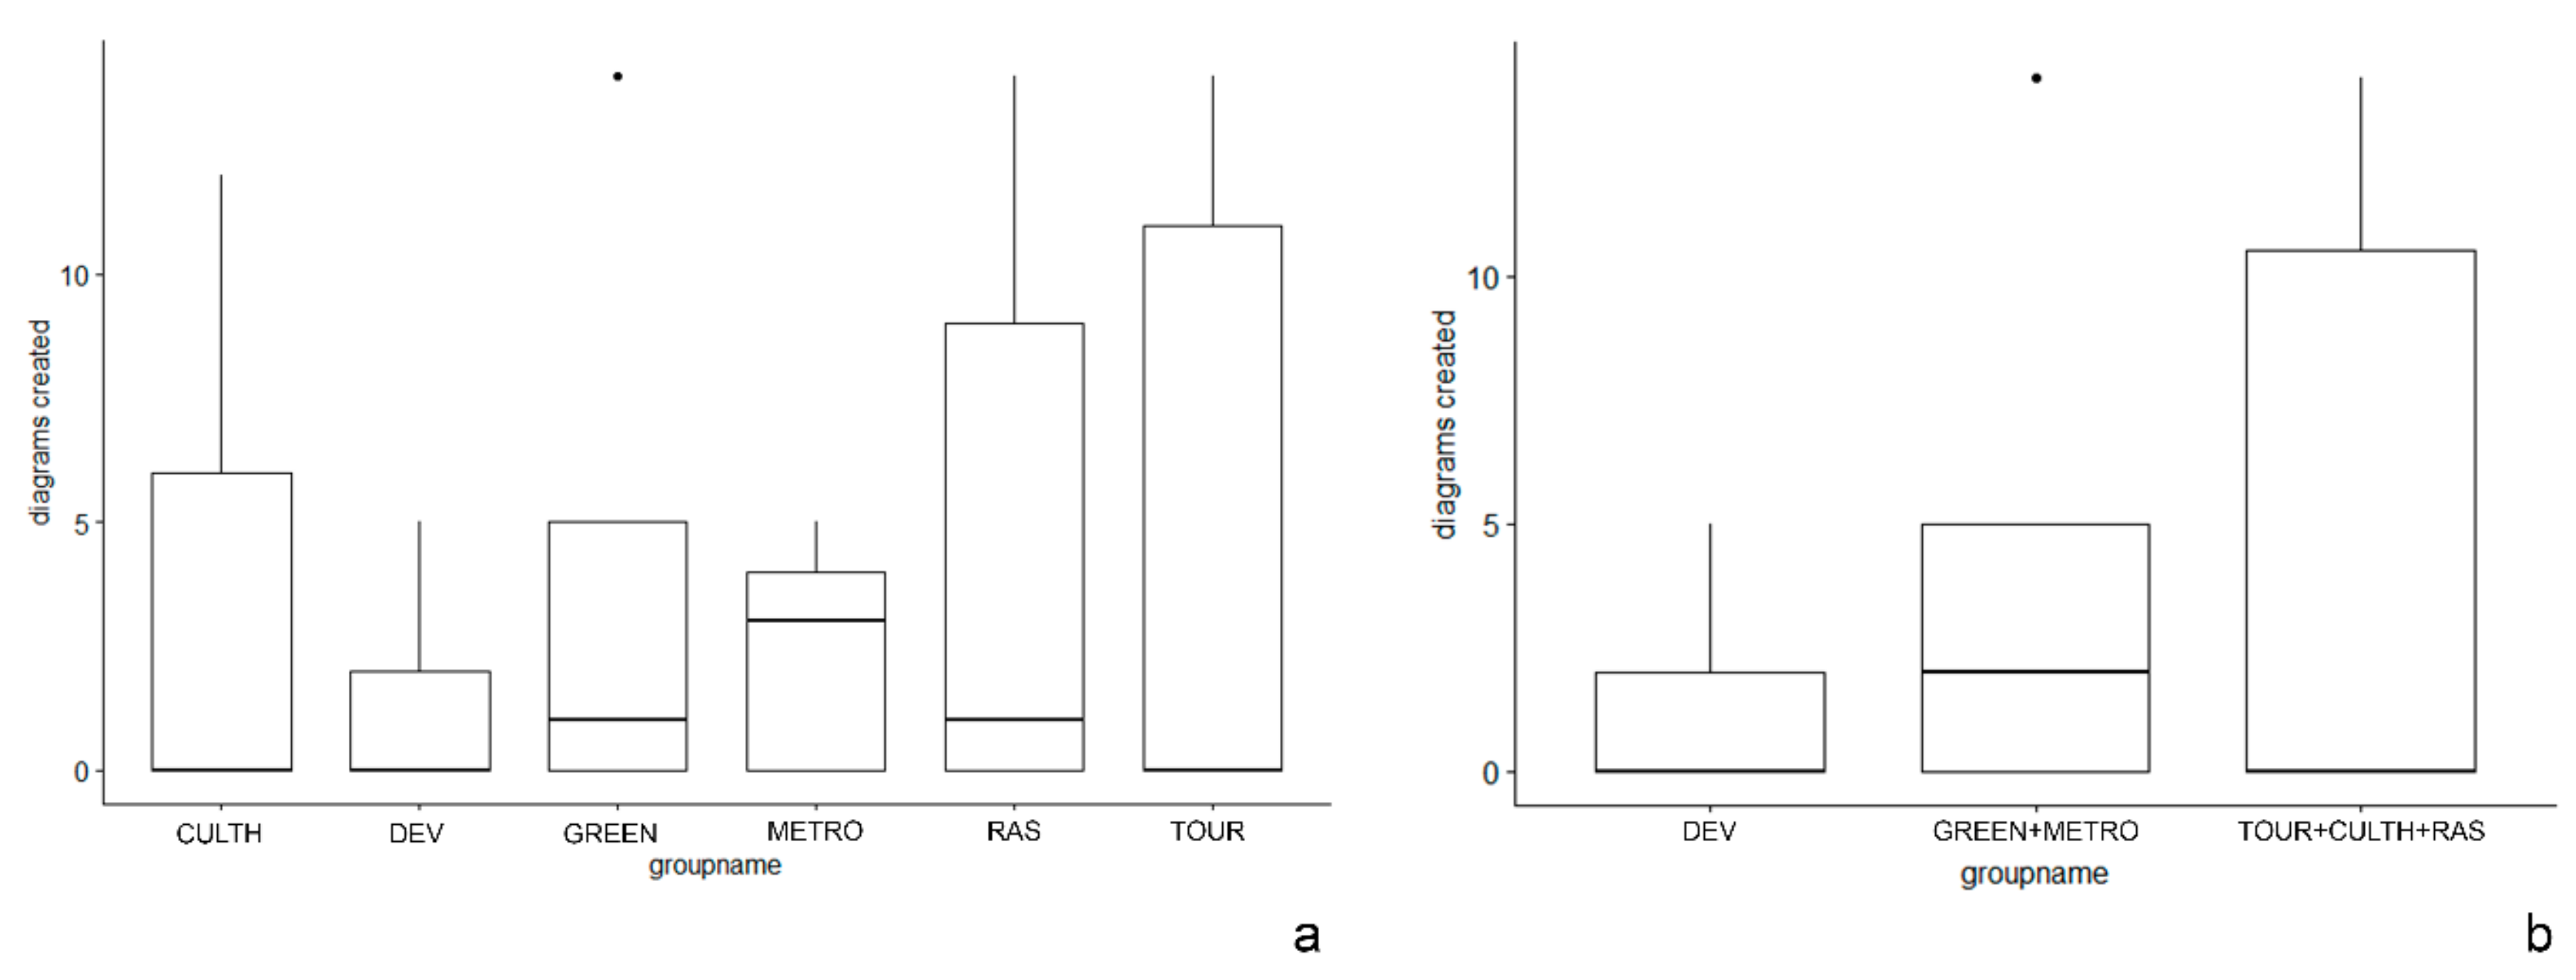
Figure 9.
Box plots of the priority values associated to the diagrams selected in the three/four design versions created by each stakeholder group.
Figure 9.
Box plots of the priority values associated to the diagrams selected in the three/four design versions created by each stakeholder group.

Figure 10.
Density histograms of the priority values associated with the diagrams selected in the three versions created by the group METRO.
Figure 10.
Density histograms of the priority values associated with the diagrams selected in the three versions created by the group METRO.


Table 1.
Decision situation assessment: geodesign workshop steps by EAST2 aspects.
| Step/Group of Steps | ||||||
|---|---|---|---|---|---|---|
| 1 | 2 | 3, 4 | 5 | 6 | 7, 8 | |
| Create Diagrams | Define System Priority Weights | Add Diagrams and Create Design v1, v2 | Make Three Min Presentation | Add Diagrams and Create Design v3 | Create Negotiated Design v1, v2 | |
| Aspect 5 Rules and norm of participation | participants are grouped in system expert teams | participants are grouped in stakeholder teams | teams are grouped into coalitions | |||
| Aspect 7 Participants’ views/knowledge | background information (age, education level, academic/working area of concentration, previous experience with Geodesignhub (GDH)planning support system (PSS) | |||||
| systems’ priority weights stand for stakeholders’ values and their worldviews | selection of diagrams mirror stakeholders’ values and their worldviews | selection of diagrams mirror stakeholders’ values and their worldviews | ||||
| Aspect 11 Geographic information aids | “sketching and visualization tool” | “set priority weights tool” | “sketching and visualization tool”; “design creation tool” | “comparison tool” | “sketching and visualization tool”; “design creation tool” | “sketching and visualization tool”; “comparison tools”; “negotiation tools” |
| Aspect 16 Task management | system teams create diagrams | stakeholder teams assign priority weights (from 1 to 10) | stakeholder teams create additional diagrams and save a collection of diagrams in a design alternative | stakeholder teams shortly present their designs in a large screen | stakeholder teams create additional diagrams and save a selection of diagrams in a design alternative | group coalitions compare their design and strive to reach a consensus through negotiation |
Table 2.
Summary statistics by groups of the explanatory variable “created_byexpert”.
| Attribute “Created_Byexpert” | Count | Mean (Frequency of Selection) | SD |
|---|---|---|---|
| yes | 113 | 3.02 | 2.80 |
| no | 101 | 7.62 | 5.07 |
Table 3.
Summary statistics by groups of the explanatory variable “age_group”.
| Attribute “Age_Group” | Count | Mean (Diagrams Created) | SD |
|---|---|---|---|
| ≤25 | 4 | 7.25 | 5.68 |
| 26–35 | 17 | 7.94 | 5.55 |
| 37–45 | 5 | 6.4 | 5.81 |
| 46–60 | 2 | 7 | 7.07 |
| >60 | 1 | 4 | NaN |
Table 4.
Summary statistics by groups of the explanatory variable “education”.
| Attribute “Education” | Count | Mean (Diagrams Created) | SD |
|---|---|---|---|
| undergraduate | 4 | 7.25 | 5.68 |
| graduate | 7 | 7.43 | 6.97 |
| postgraduate | 16 | 7.88 | 4.99 |
| PhD | 2 | 3.5 | 0.707 |
Table 5.
Summary statistics by groups of the explanatory variable “main_activity”.
| Attribute “Main_Activity” | Count | Mean (Diagrams Created) | SD |
|---|---|---|---|
| practice | 5 | 9.4 | 7.33 |
| research | 18 | 7.33 | 4.96 |
| student | 6 | 5.83 | 5.08 |
Table 6.
Summary statistics by groups of the explanatory variable “background”.
| Attribute “Background” | Count | Mean (Diagrams Created) | SD |
|---|---|---|---|
| architecture, engineering | 9 | 8.44 | 6.64 |
| other | 3 | 7.33 | 3.79 |
| planning | 17 | 6.82 | 5.00 |
Table 7.
Summary statistics by groups of the explanatory variable “previous_experience”.
| Attribute “Previous_Experience” | Count | Mean (Diagrams Created) | SD |
|---|---|---|---|
| none | 1 | 9 | NaN |
| low | 11 | 8.36 | 6.39 |
| medium | 6 | 4.5 | 2.59 |
| high | 11 | 7.82 | 5.38 |
© 2019 by the authors. Licensee MDPI, Basel, Switzerland. This article is an open access article distributed under the terms and conditions of the Creative Commons Attribution (CC BY) license (http://creativecommons.org/licenses/by/4.0/).
Share and Cite
MDPI and ACS Style
Cocco, C.; Jankowski, P.; Campagna, M. An Analytic Approach to Understanding Process Dynamics in Geodesign Studies. Sustainability 2019, 11, 4999. https://doi.org/10.3390/su11184999
AMA Style
Cocco C, Jankowski P, Campagna M. An Analytic Approach to Understanding Process Dynamics in Geodesign Studies. Sustainability. 2019; 11(18):4999. https://doi.org/10.3390/su11184999
Chicago/Turabian StyleCocco, Chiara, Piotr Jankowski, and Michele Campagna. 2019. "An Analytic Approach to Understanding Process Dynamics in Geodesign Studies" Sustainability 11, no. 18: 4999. https://doi.org/10.3390/su11184999
Note that from the first issue of 2016, this journal uses article numbers instead of page numbers. See further details here.