Improving the Sustainability of Dairy Slurry by A Commercial Additive Treatment
by
 , , and
Federica Borgonovo
1, 
Cecilia Conti
1,*,
Daniela Lovarelli
2,
Valentina Ferrante
1 and
Marcella Guarino
1 1
Department of Environmental Science and Policy (ESP), Università degli Studi di Milano, Via G. Celoria 10, 20133 Milan, Italy
2
Department of Agricultural and Environmental Science (DISAA), Università degli Studi di Milano, Via G. Celoria 2, 20133 Milan, Italy
*
Author to whom correspondence should be addressed.
Sustainability 2019, 11(18), 4998; https://doi.org/10.3390/su11184998
Submission received: 11 June 2019
/
Revised: 12 August 2019
/
Accepted: 9 September 2019
/
Published: 12 September 2019
(This article belongs to the Special Issue Economic and Environmental Impact Assessment of Renewable Energy from Biomass)
Abstract
:Ammonia (NH3), methane (CH4), nitrous oxide (N2O), and carbon dioxide (CO2) emissions from livestock farms contribute to negative environmental impacts such as acidification and climate change. A significant part of these emissions is produced from the decomposition of slurry in livestock facilities, during storage and treatment phases. This research aimed at evaluating the effectiveness of the additive “SOP LAGOON” (made of agricultural gypsum processed with proprietary technology) on (i) NH3 and Greenhouse Gas (GHG) emissions, (ii) slurry properties and N loss. Moreover, the Life Cycle Assessment (LCA) method was applied to assess the potential environmental impact associated with stored slurry treated with the additive. Six barrels were filled with 65 L of cattle slurry, of which three were used as a control while the additive was used in the other three. The results indicated that the use of the additive led to a reduction of total nitrogen, nitrates, and GHG emissions. LCA confirmed the higher environmental sustainability of the scenario with the additive for some environmental impact categories among which climate change. In conclusion, the additive has beneficial effects on both emissions and the environment, and the nitrogen present in the treated slurry could partially displace a mineral fertilizer, which can be considered an environmental credit.
1. Introduction
In recent decades, farming systems have evolved considerably. The intensification of livestock activity has significantly increased production levels. Moreover, intensification of livestock production (as the increased use of external inputs and services to increase the output quantity and/or value per unit input) has led to a considerable increase in the volumes of manure. To manage such an amount of manure, treatments, such as solid-liquid separation, anaerobic digestion, etc., is necessary. However, manure treatments could have a negative impact on the environment including ecosystem acidification, mainly due to ammonia (NH3) volatilization, and climate change, as a result of the contribution of greenhouse gas (GHG) emissions, the most important of which are nitrous oxide (N2O), carbon dioxide (CO2), and methane (CH4) [1,2]. In addition, the management of large volumes of excreta produced from livestock farms can cause malodorous emissions.
According to IPCC [3], agriculture globally contributes 10% to 12% of anthropogenic CO2, 40% of CH4, and 60% of N2O emissions. Over a 100 year time period, CH4 and N2O have a Global Warming Potential of 28 and 265 CO2-equivalent, respectively, and N2O is also implicated in the reduction of stratospheric ozone [4,5].
GHG emissions are biogenic and affected by manure characteristics; therefore, emissions can be regulated by manure management, treatment and storage conditions.
CH4 and CO2 are produced by the degradation of organic matter in manure, while the emission of N2O is influenced by the nitrogen (N) and carbon content of manure, duration of storage and type of treatment. N2O is principally produced by the nitrification-denitrification process subsequent to manure application [4,6].
Although NH3 is not a GHG, it is considered a secondary source of N2O due to its re-deposition on the land [3], and is mainly released from agriculture (94% of the total European NH3 emissions [7]). Ammonia can also cause eutrophication, acidification, and disturbance of natural ecosystems after its deposition and is also a precursor of fine particulate matter (PM2.5) formation. A recent study [8] highlighted that increased emissions of ammonia lead to an increased health risk with a nonlinear ratio (e.g., 20% agricultural output increase results in 24% increase in excess mortality in European Union).
Both the European Union (EU) and the United Nations (UN) have introduced policies, over the years, in order to improve the use of nutrients present in the manure and to decrease N emissions into the environment [9]. Among these policies, the EU National Emission Ceiling Directive [10] and the Gothenburg protocol of the UNECE Convention on Long-range Transboundary Air Pollution [11] were introduced specifically to decrease the emissions of NH3 and NOX; the UN-FCCC Kyoto protocol has been adopted worldwide to decrease N2O emission [12], while the EU Nitrates Directive is aimed at decreasing N leaching into ground and surface waters [13]. Countries that are party to the Kyoto Protocol are moving towards reducing global warming potential by reducing GHG concentrations in the atmosphere to “a level that would prevent dangerous anthropogenic interference with the climate system” [12]. Therefore, livestock farms and industries are developing mitigation strategies to reduce these emissions. In the development of appropriate mitigation technologies, it is fundamental to consider several aspects of manure management, such as manure excretion, storage, treatments and land application [14], as ell as evaluating GHG emissions on the basis of a whole system approach, since the effects of mitigation methods used at one stage may affect emissions in downstream phases [15].
Various strategies for manure management practices and types of treatment can be adopted in order to exploit the nutrients from livestock manure whilst, at the same time, minimizing the environmental impact of NH3 and GHG emissions [16,17]. In Europe, these strategies are listed in the horizontal BAT (Best Available Techniques) Reference Document (BREF), entitled “Emissions from Storage”. In this section, BAT aim at reducing NH3 emissions into the air and nitrate leakage into the water from manure storage and spreading techniques [18]. Among the most common treatments are solid-liquid separation, anaerobic digestion, manure storage covers and slurry acidification.
Solid-liquid separation reduces NH3 volatilization into the atmosphere thanks to the reduced solid content of the manure that facilitates slurry infiltration, consequently reducing its exposure time on the soil surface [17]. This technique is useful for various applications, such as animal bedding, compost and commercial fertilizer.
The anaerobic digestion of manure converts the organic N (undigested feed protein) in the manure into ammonium (NH4+), which can be more rapidly utilized by the crops [19]. The manure effluent produced, ensures enough soil fertility, if applied in an adequate amount, and the availability of the nitrogen necessary for crop and forage production. However, the increased ratio of ammoniacal N to total N after anaerobic digestion may cause an increase in NH3 loss after land application.
Covering stored manure provides a physical barrier to help reduce NH3, particulate matter (PM) formation and odorous emissions [9]. The main solutions adopted involve reducing the free surface of the slurry by either constructing rooftops or covering the surface with different materials [20].
Slurry acidification enhances the fertilizing value of slurry and is used in some countries (e.g., Denmark) to reduce NH3 emissions. The efficiency of acidification is dependent on the additive used (chemical formula, dosage, and application method), the target pH, the slurry type, and the position along the slurry management chain in which the additive is used. Usually sulfuric acid (H2SO4) is added to the slurry to lower the pH, consequently reducing NH3 emissions, while it has no effect on GHG emissions [16,21,22].
Some of these manure management practices require a large amount of capital and high maintenance costs and necessitate specific knowledge for correct operation. Therefore, an alternative approach is the use of additives during slurry storage since they are able to affect the slurry properties by inhibiting or stimulating a particular microbiological process [14]. There are different types of additives that work on several processes simultaneously, some of which modify both the chemical composition and the biological process of the slurry, by acting on the N content. The potential of these additives (biochar, chemical additives, and gypsum) to mitigate NH3 and GHG emissions from stored slurry are documented in recent literature. In particular the effectiveness of chemical additives (such as More Than Manure and Pro-Act Biotech) and biochar on manure NH3 and GHG emissions were studied, showing no significant effects on NH3 and GHG fluxes [17,23]. Instead, regarding gypsum, which is a sulfate mineral composed of calcium sulfate dihydrate (CaSO4·2H2O), diverse and inconsistent results have been reported in literature about its effects [24,25,26]. However, the addition of gypsum has a great capacity to prevent N loss from manure and reduce odor since it reduces NH3 volatilization during the composting process [27]. NH3 volatilization reduction has also been confirmed by other authors such as Febrisiantosa et al., Li et al., and Yang et al. [24,25,28]. Yang, et al. [25] found that phosphogypsum reduced CH4 and NH3 emissions from poultry manure composting whilst, on the other hand, tended to increase emissions of N2O. The weak aspect of these studies’ findings, however, is that large amounts of material are required to achieve the desired results (approximately 10% in weight).
The aim of this study was to test the ability of a commercial additive made of 100% calcium sulfate dihydrate (agricultural gypsum based on calcium sulfate dihydrate processed with proprietary technology; SOP LAGOON www.sopfarm.com) processed with a proprietary technology to reduce NH3 and GHG (CO2, CH4, and N2O) emissions from the slurry.
2. Materials and Methods
To evaluate the impact of the additive on gas emissions from slurry storage, a pilot study was conducted. The study investigated both gas emissions (NH3 and GHG) and the slurry chemical composition.
Furthermore, the Life Cycle Assessment (LCA) approach was used to evaluate the potential environmental impact and benefits associated to the adoption of this additive in slurry storage systems compared to traditional techniques.
2.1. Experimental Setup
Fresh slurry was collected from a dairy farm situated in Northern Italy, housing approximately 100 milking cows (Az. Menozzi, Landriano, PV; 45°18′41″ N and 9°15′46″ E). Six 220 L barrels were filled with 65 L of fresh slurry each. Three of these barrels (1, 2, and 3) were left as a control, the remaining three (4, 5, and 6) were destined to receive the treatment.
The slurry treatment was carried out by adding the additive at a dosage of 4 g/m3, according to the manufacturer’s specifications provided on the Technical Data Sheet of the product, i.e., 0.260 g/barrel in barrels 4, 5, and 6, and then mixed. The product was added once a week at day 0 (T0), 7 (T7), and 14 (T14) and then stirred to ensure the dispersion of the additive in the barrel as recommended by the manufacturer.
2.2. Emission Measurements
The measurements of the emissions (NH3, N2O, CH4, and CO2) were carried out on day 0, day 4, day 7, and day 26 (T0, T4, T7 and T26 respectively). Prior to measurement, the slurry was mixed in order to break up any crusts that could affect the emission stream, while the additive’s application on day 0 and 7 was done after the measurements.
The measurement protocol was designed to investigate the short-term performance of the additive (T4 and T7) and whether potential washout effects occurred after two weeks when no further additive was applied (T26). The time interval for this study is in line with other works on emissions from manure [25,28].
The emissive fluxes from the barrels were measured by means of a static or closed chamber according to the “non-steady-state chamber-method”. This method is widely reported in literature and used to measure NH3 and GHG emissions from different emitting surfaces [6,20,26,29,30].
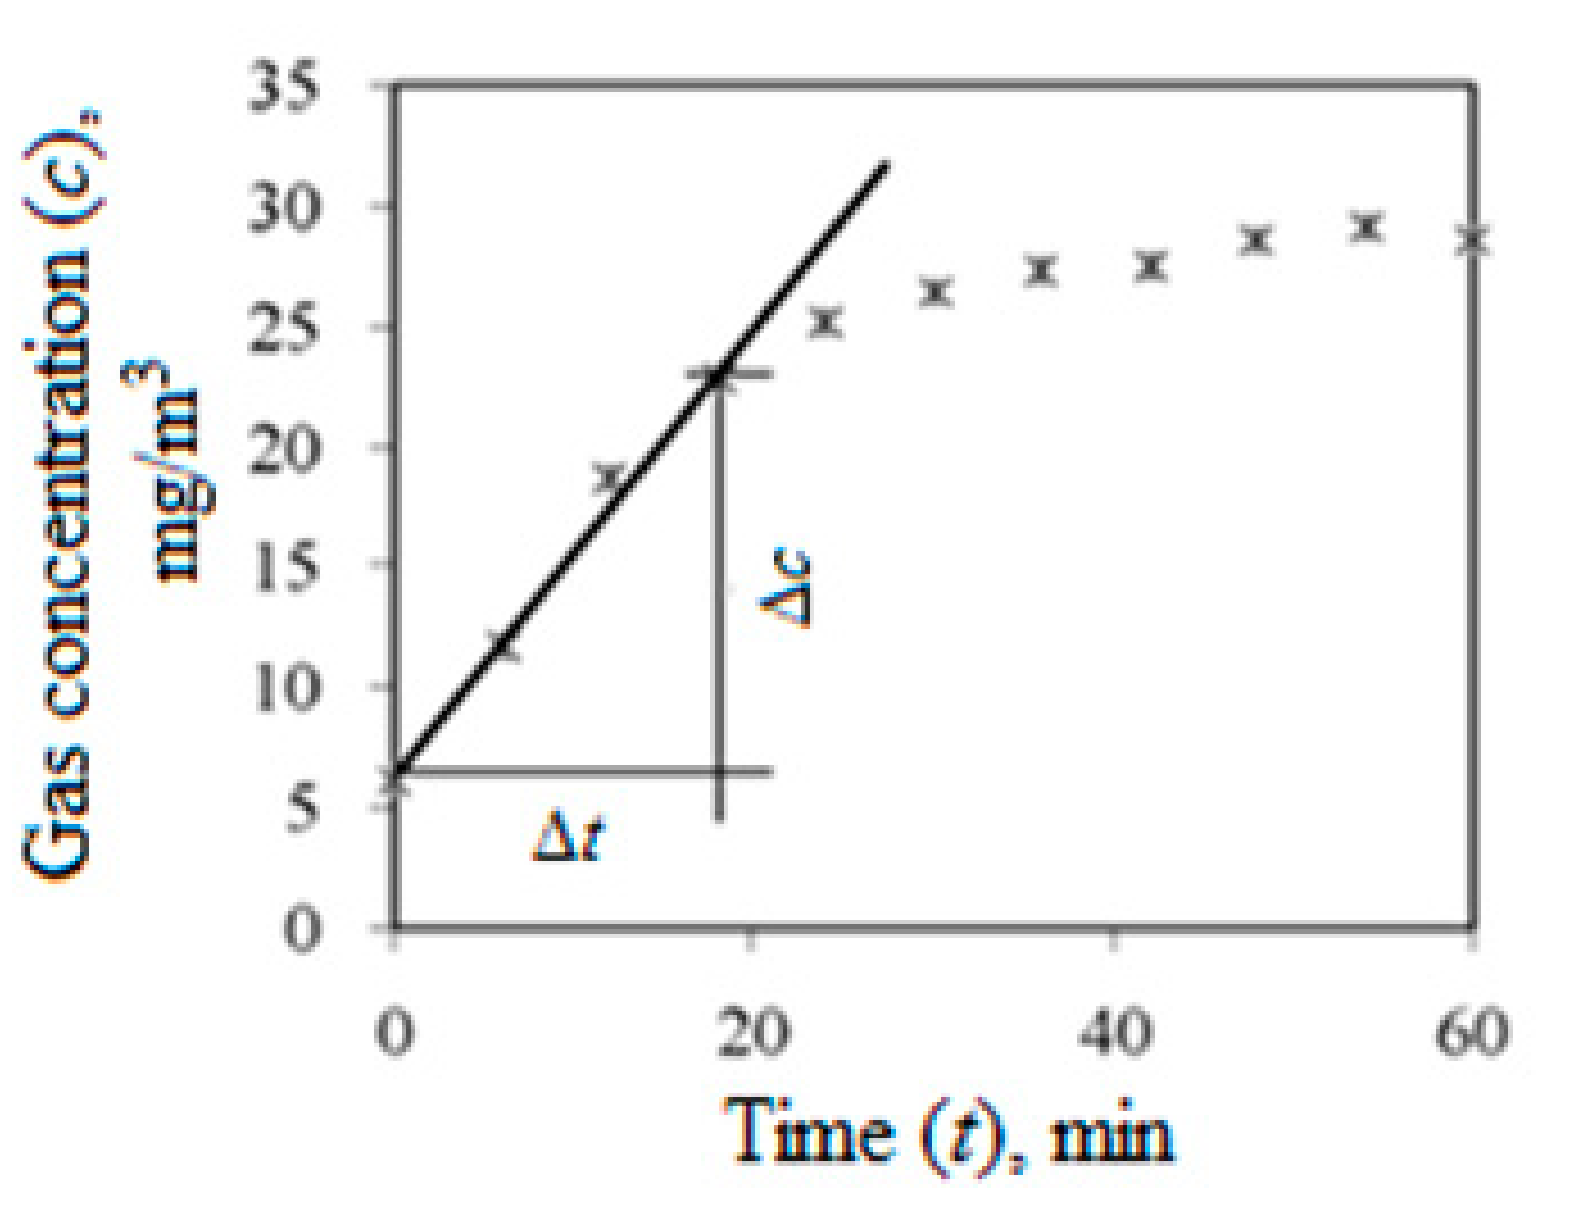
The closed chamber method is based on the determination of the increasing rate of gas concentration within the internal volume of the closed chamber, positioned on the emitting surface, avoiding any air replacement. The gas concentration detected typically shows a linear increasing trend followed by a saturation phase as represented in Figure 1. The slope of the regression line, calculated within the linear part of the saturation curve, multiplied by the chamber volume to area ratio, represents the emission potential of the surface, expressed in mg/m2·h.
The emission factors (mg/m2·h) were calculated according to Equation (1):
where δC/δt is the angular coefficient of the regression line of the linear branch of the gas saturation function, while Vch and Ach are the volumes and the area of the chamber.
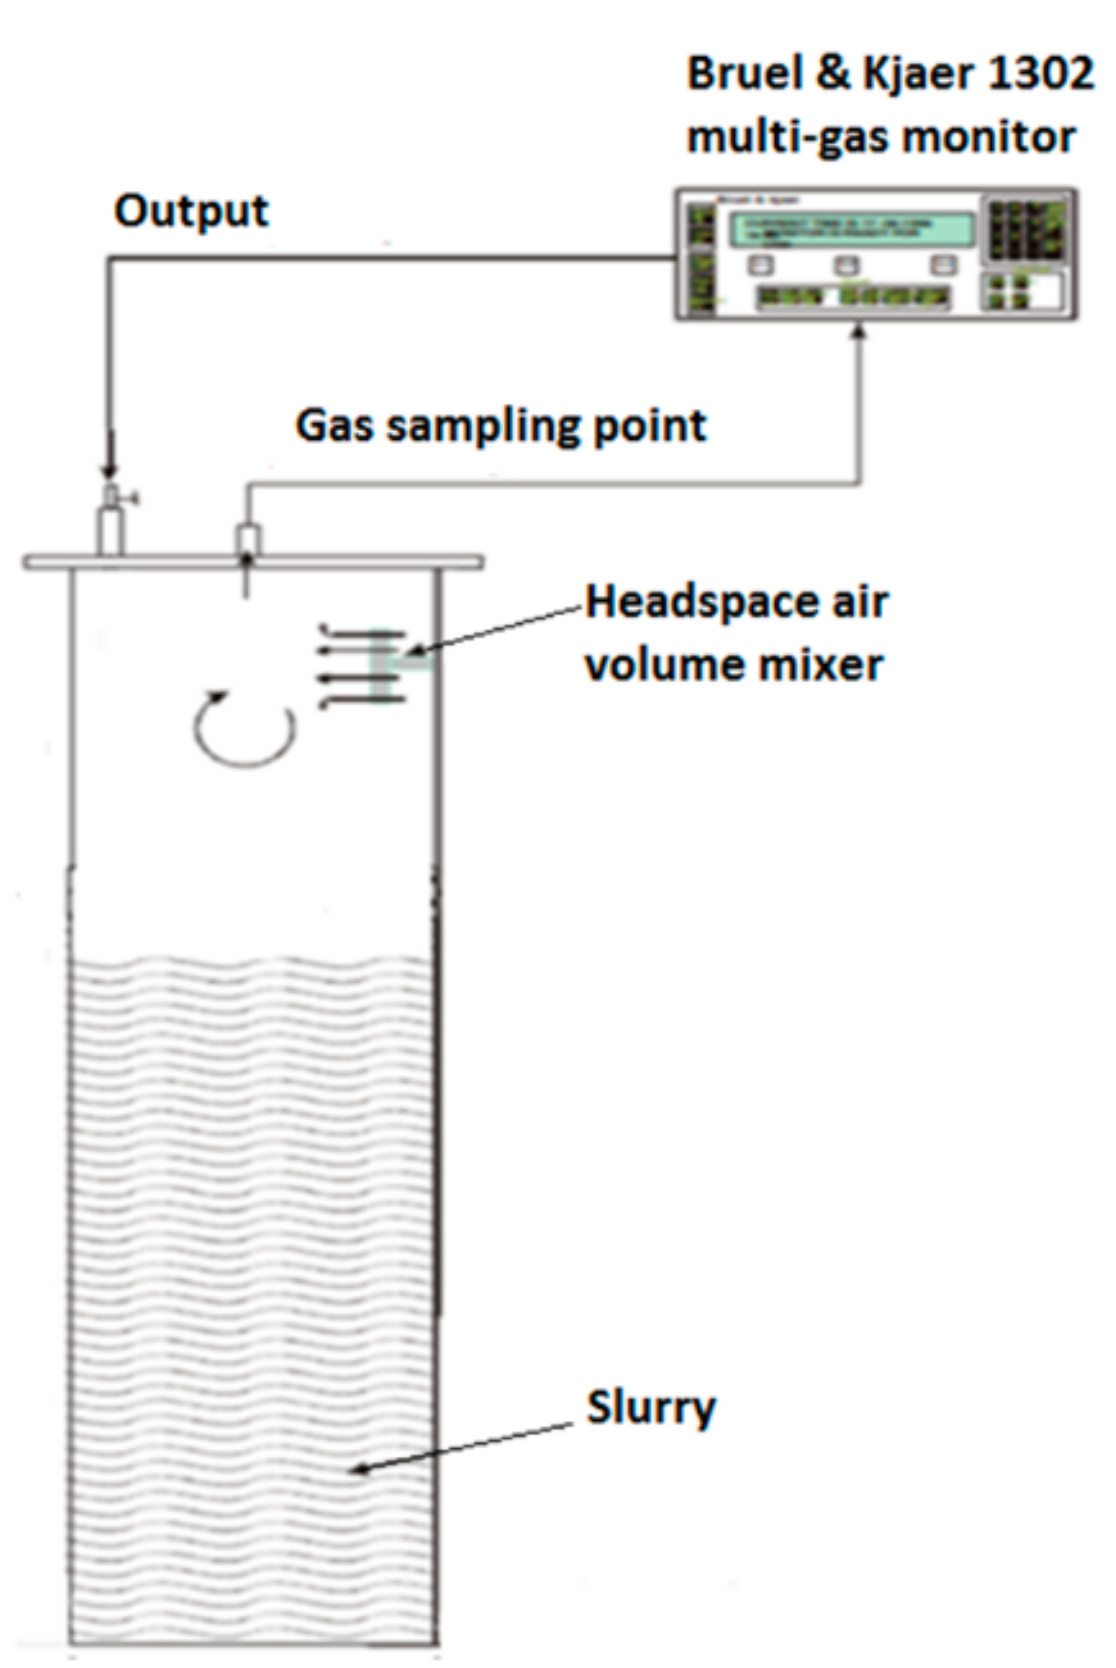
The concentration of NH3, N2O, CH4 and CO2 (mg/m3) were measured by means of an Infrared Photoacoustic Detector (Bruel&Kjaer, Nærum, Denmark, multi-gas monitor type 1302). The instrument automatically collects and analyzes air samples at regular time intervals (every 2 min until saturation values), and then the air analyzed is redirected into the barrel. During measurement, the barrels were sealed with a suitable lid, equipped with two holes, one for the inlet and one for the outlet of the gases, and a small fan, to allow the uniform distribution of the air within the top space of the sealed chamber (Figure 2) [31,32].
2.3. Chemical Analyses
The composition of the slurry was studied to evaluate the effects of the additive on the slurry’s characteristics. Slurry was collected from each barrel and samples were analyzed for total solids (TS), volatile solids (VS), total nitrogen (TN), ammonium nitrogen (NH4-N), nitrites (NO2-N), and nitrates (NO3-N), in order to verify that a reduction in emissions would not result in an increased concentration of noxious nitrogen compounds (i.e., nitrates).
Immediately after measurement of the emissions, each barrel was mixed again, in order to make it as homogeneous as possible, and 1 L of the material was sampled for lab analyses. The samples were stored at 4 °C until the day of analyses, maximum two days after sampling.
The analytical methods used were:
- Total solids (TS): drying in the stove to 105 °C for 48 h (APHA, 2012)
- Volatile solids (VS): incineration in muffle furnace 550 °C for 2 h (APHA, 2012)
- Total nitrogen (TN): Koroleff digestion (peroxydisulfate) and photometric detection with 2,6-dimethylphenol (EN ISO 11905-1)
- Ammonium nitrogen (NH4-N): indophenol blue (ISO 7150-1)
- Nitrites (NO2-N): diazotization (EN ISO 26777)
- Nitrates (NO3-N): 2,6-dimethylphenol (ISO 7890-1-2-1986).
The pH was determined using a pH meter at the beginning (T0) and at the end of the trial (T26).
2.4. Statistical Analyses
Statistical analysis was carried out using SAS software (SAS version 9.3; SAS Institute, Cary, NC, USA, 2012).
The emission factors of each gas were calculated, in each barrel, with linear regression (PROC REG), using, as input data, the concentrations measured in the chamber at regular time intervals (every 2 min). The calculated emission factors were then used to evaluate if there was a difference among emission factors originating from treated and control samples.
The mean and standard error of the three replicates were reported in Tables.
2.5. Life Cycle Assessment
The goal of this LCA study is to evaluate the environmental performance of the additive during slurry storage. To this purpose, LCA was applied to the slurry storage with (Alternative Scenario, AS) and without (Baseline Scenario, BS) the additive and, finally, the environmental impact of these two solutions was compared in order to identify the most sustainable system for managing slurry from an environmental point of view.
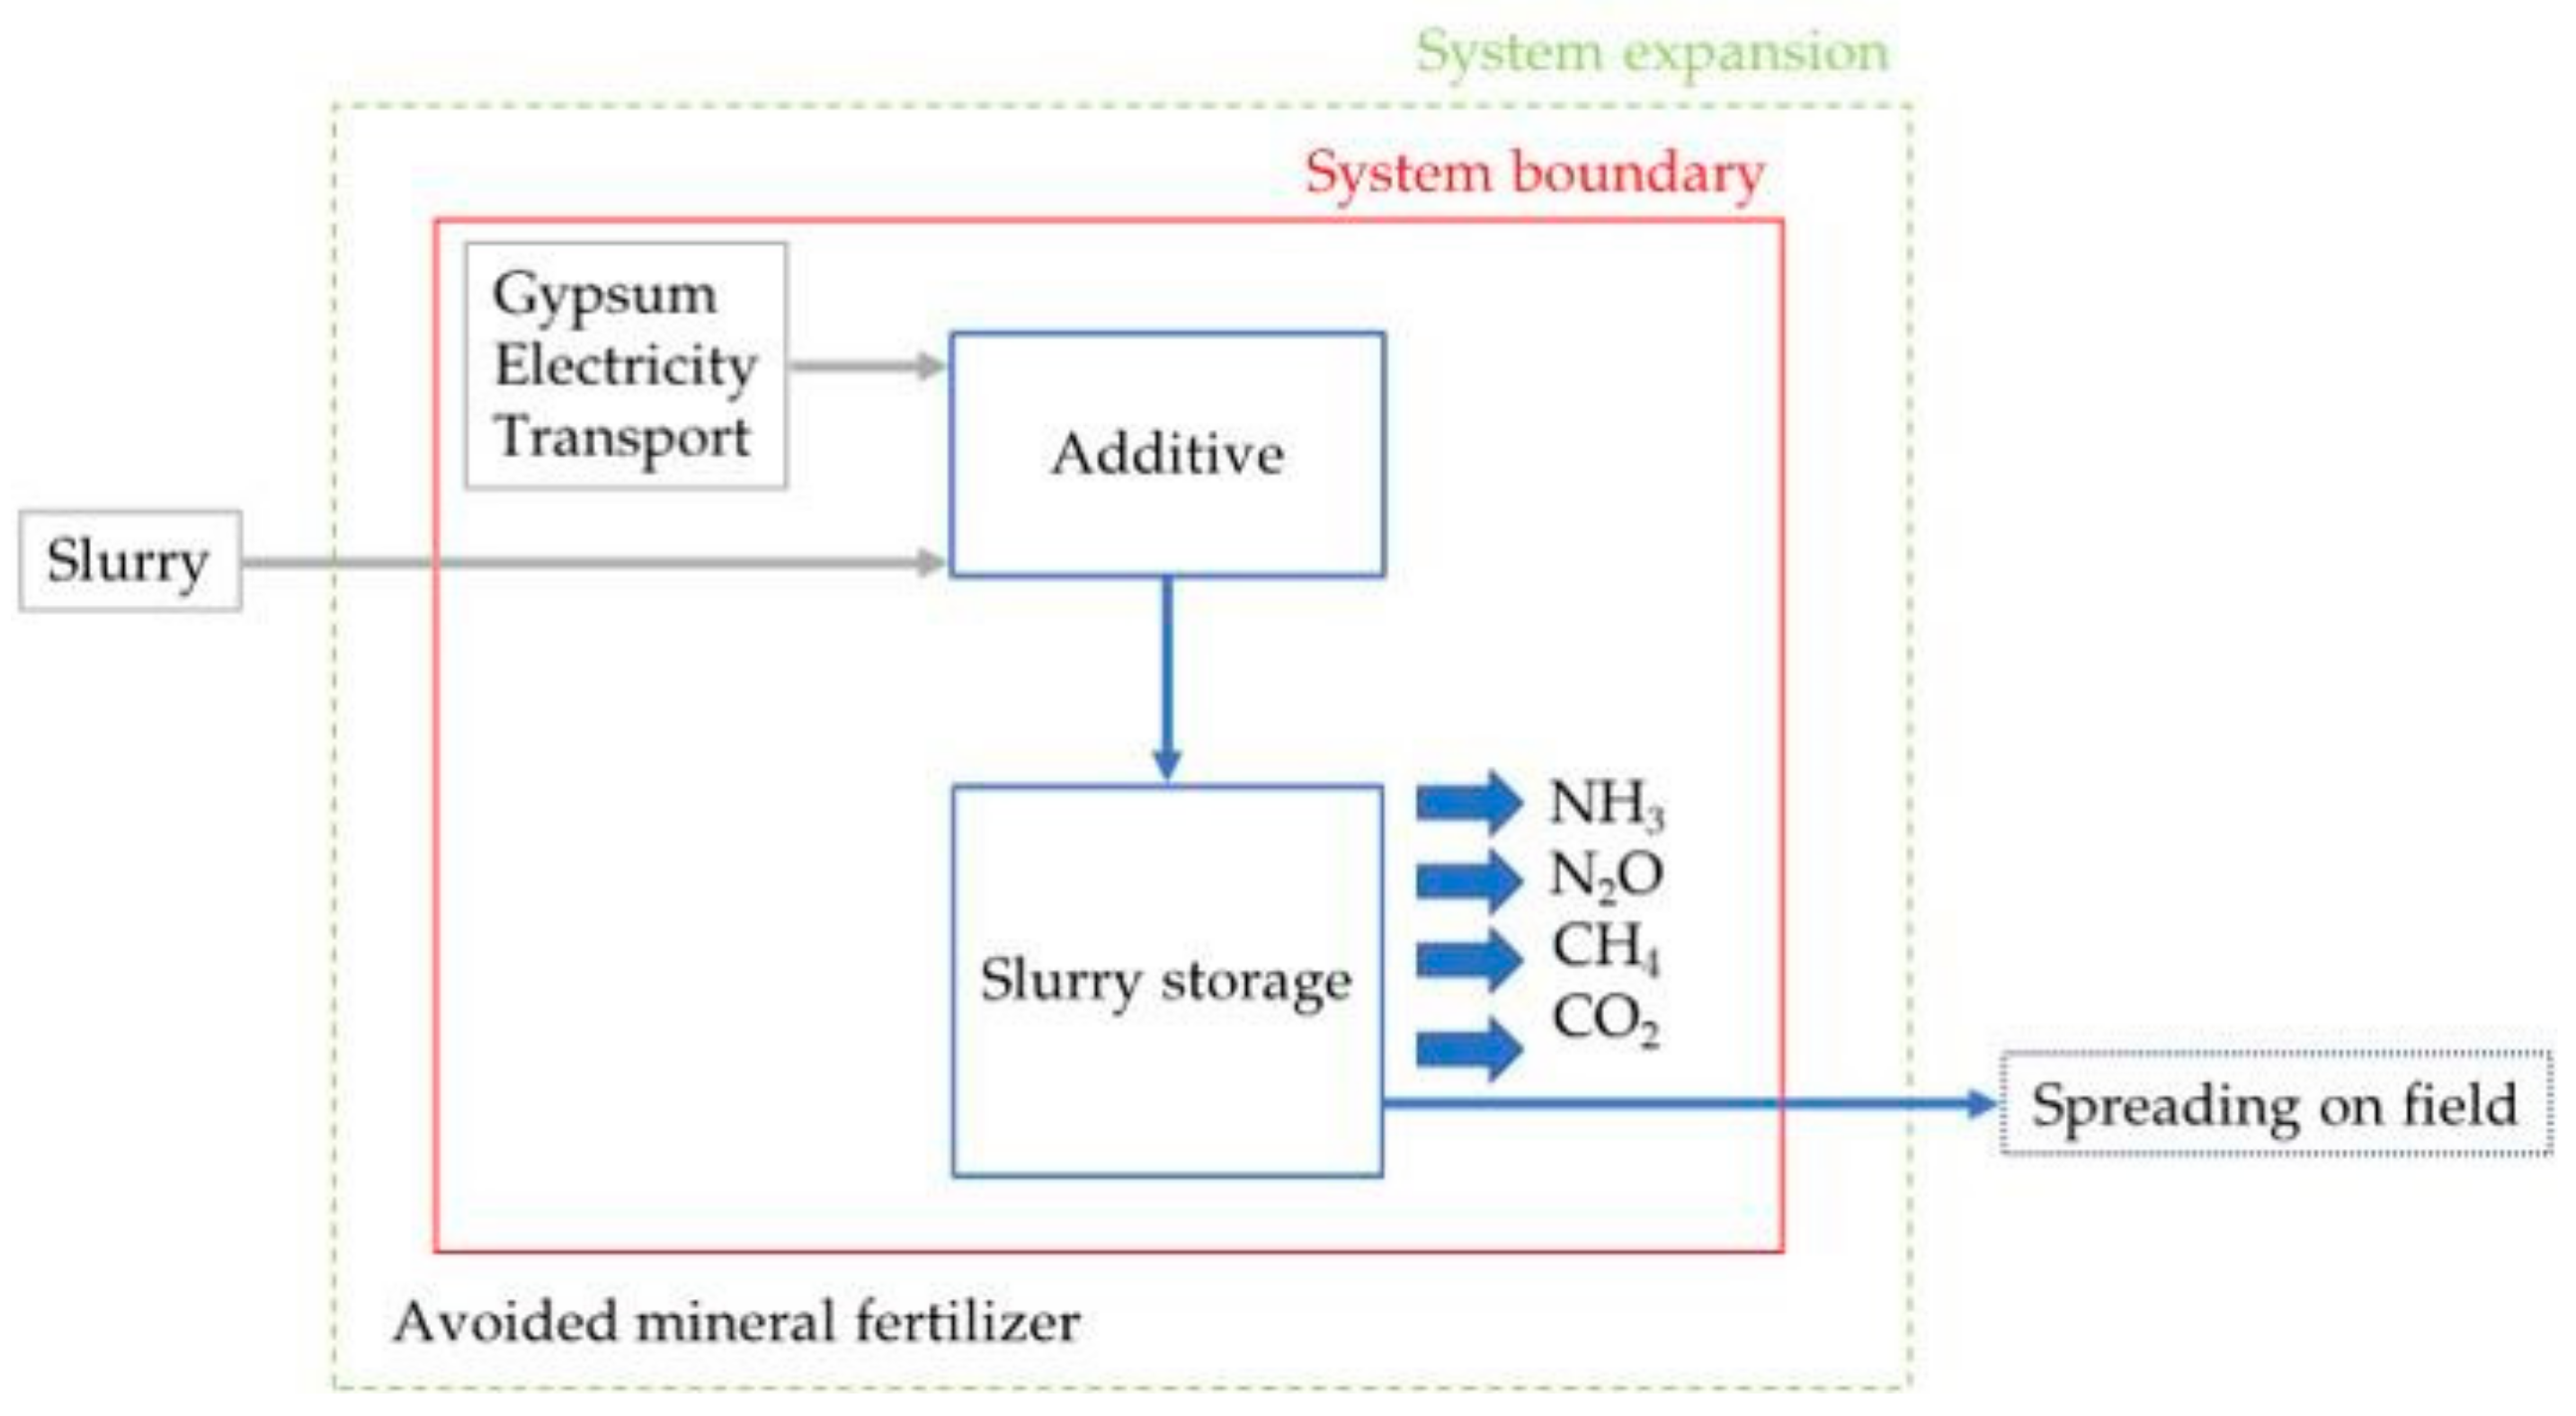
The functional unit (FU) is the unit to which all inventory data refers, in accordance with the description of the function of the product to be analyzed. In this study, the selected FU is 1 ton of stored dairy cattle slurry. The system boundary is from cradle to gate and includes all the processes from the extraction of the raw materials included in the study to the end of the slurry storage as shown in Figure 3.
Capital goods (e.g., slurry storage facility) were excluded from the system due to their long life span [33] and because their use is the same in the two scenarios (BS and AS). A “zero burden” approach was considered for the slurry; as in previous LCA studies [34,35,36], the slurry was considered a waste product deriving from the livestock production process. The distribution of the stored dairy cattle slurry was excluded from the system boundary; however, considering that by the end of storage the two slurries have different nitrogen contents, a system expansion approach was also applied, and the substitution of the mineral fertilizer was considered. More specifically, this means that the avoided use of a mineral fertilizer was quantified for highlighting the possible additional beneficial environmental effect of the additive. The amount of avoided fertilizer produced was calculated depending on the mineral fertilizer equivalence (MFE: is a measure of the fertilizer’s ability to supply nitrogen to crops compared with a mineral fertilizer). MFE equal to 100% was considered for the N-NH3 in the slurry [37] and the substitution of nitrogen by ammonium nitrate was taken into account.
Inventory data regarding the emissions of NH3, N2O, and CH4 for BS were taken from Baldini et al. [38], while for AS they were collected during the experimental measurements previously described. The recommended storage period varies in different geographical areas, ranging from a few days in some areas of the United States to several months in other countries. For example, in Italy, the recommended storage period, before land application, is 120–150 days in zones vulnerable to nitrate pollution and 90 days in non-vulnerable zones. A period of 180 days was taken into account for the modeling of emissions in the LCA study to be more comprehensive of the different storage recommendations.
Emissions of NH3, N2O and CH4 from slurry storage were estimated after 180 days from the relative reduction achieved by the addition of the additive. Once quantified, these values were also attributed to the amount of slurry produced per cattle per year and referred to the FU.
Inventory data regarding the additive were collected directly from the producer and the amounts adopted per FU are reported in Table 1.
Secondary data regarding the production of electricity, diesel fuel, and gypsum were obtained from Ecoinvent databases v 3.5 [39].
For the Life Cycle Impact Assessment (LCIA) step, in which the inventory data are transformed into indicators of its environmental impact, the ILCD 2011 Midpoint characterization method was selected. This method was widely adopted in recent LCA studies as it was recommended and endorsed by the European Commission, Joint Research Centre in 2012 [40]. In particular, it is characterized by the currently most reliable characterization factors and, being widely adopted, allows improvement in the standardization of the method and the comparability of results with other studies.
Twelve impact categories (namely environmental effects) were considered: climate change (CC), ozone depletion (OD), particulate matter formation (PM), human toxicity-no cancer effect (HTnoc), human toxicity with-cancer effect (HTc), photochemical ozone formation (POF), terrestrial acidification (TA), eutrophication of terrestrial ecosystems (TE), freshwater eutrophication (FE), marine water eutrophication (ME), freshwater ecotoxicity (FEx), and mineral and fossil resource depletion (MFRD).
3. Results
Table 2 summarizes the coefficients determination (R2), that is a goodness-of-fit measure for linear regression models, and p-values for each emission factor that was calculated with the regression analysis. For all the samplings conducted, R2 values amounted within a range of 67% e 99% and p-values showed high levels of significance. The high R2 values are characteristic of a model that explains all the variation in the response variable around its mean, and p-values below the level of significance highlight how changes in the independent variable are associated with changes in the response at the population level.
3.1. The Effect on NH3 and GHG Emissions
The emission factors per each gas (NH3, and GHG) are shown in Table 3.
Regarding NH3 emissions, the additive had a strong effect in the first week (T4 and T7). The measurements carried out at T4 showed an efficacy of 100%. A mitigation effect was also visible at T26, approximately two weeks after the last application of the additive (Table 3).
Also, as regards the GHG emissions, from the PROC REG, the treatment with the additive showed a strong reduction of emissions on day 4, where the control samples had the highest peaks of emissions for all gases. N2O, CO2, and CH4 emissions, from the treated slurry, were respectively 100%, 22.9%, and 21.5% lower than the control at T4 when the emission peaks were recorded.
On day 7, the emission factors were much lower with respect to T4. At T7 the slurry treated with the additive had slightly lower emissions of CO2 than the control (Table 3).
3.2. The Effect on Slurry Chemical Characteristics
Table 4 represents the slurry’s chemical properties. The TS increased until T7 and then decreased at the end of the experiment (T26) for both the control and the treatment.
A VS reduction occurred throughout the duration of the study with more evident VS losses at the end of the experiment, both for the treated slurry and the control.
Subtle fluctuations were observed for NH4+-N and NO2-N.
Instead, regarding TN and NO3-N contents, the treatment’s effect on the slurry was evident, in fact, the slurry with the additive showed lower values of these elements at the end of the experiment. In particular, the average TN content of the trial period was 2.20 and 2.16 g/kg for the control and treated, respectively.
The most interesting aspect regards the lower NO3-N content observed in the treated samples.
3.3. Environmental Impact
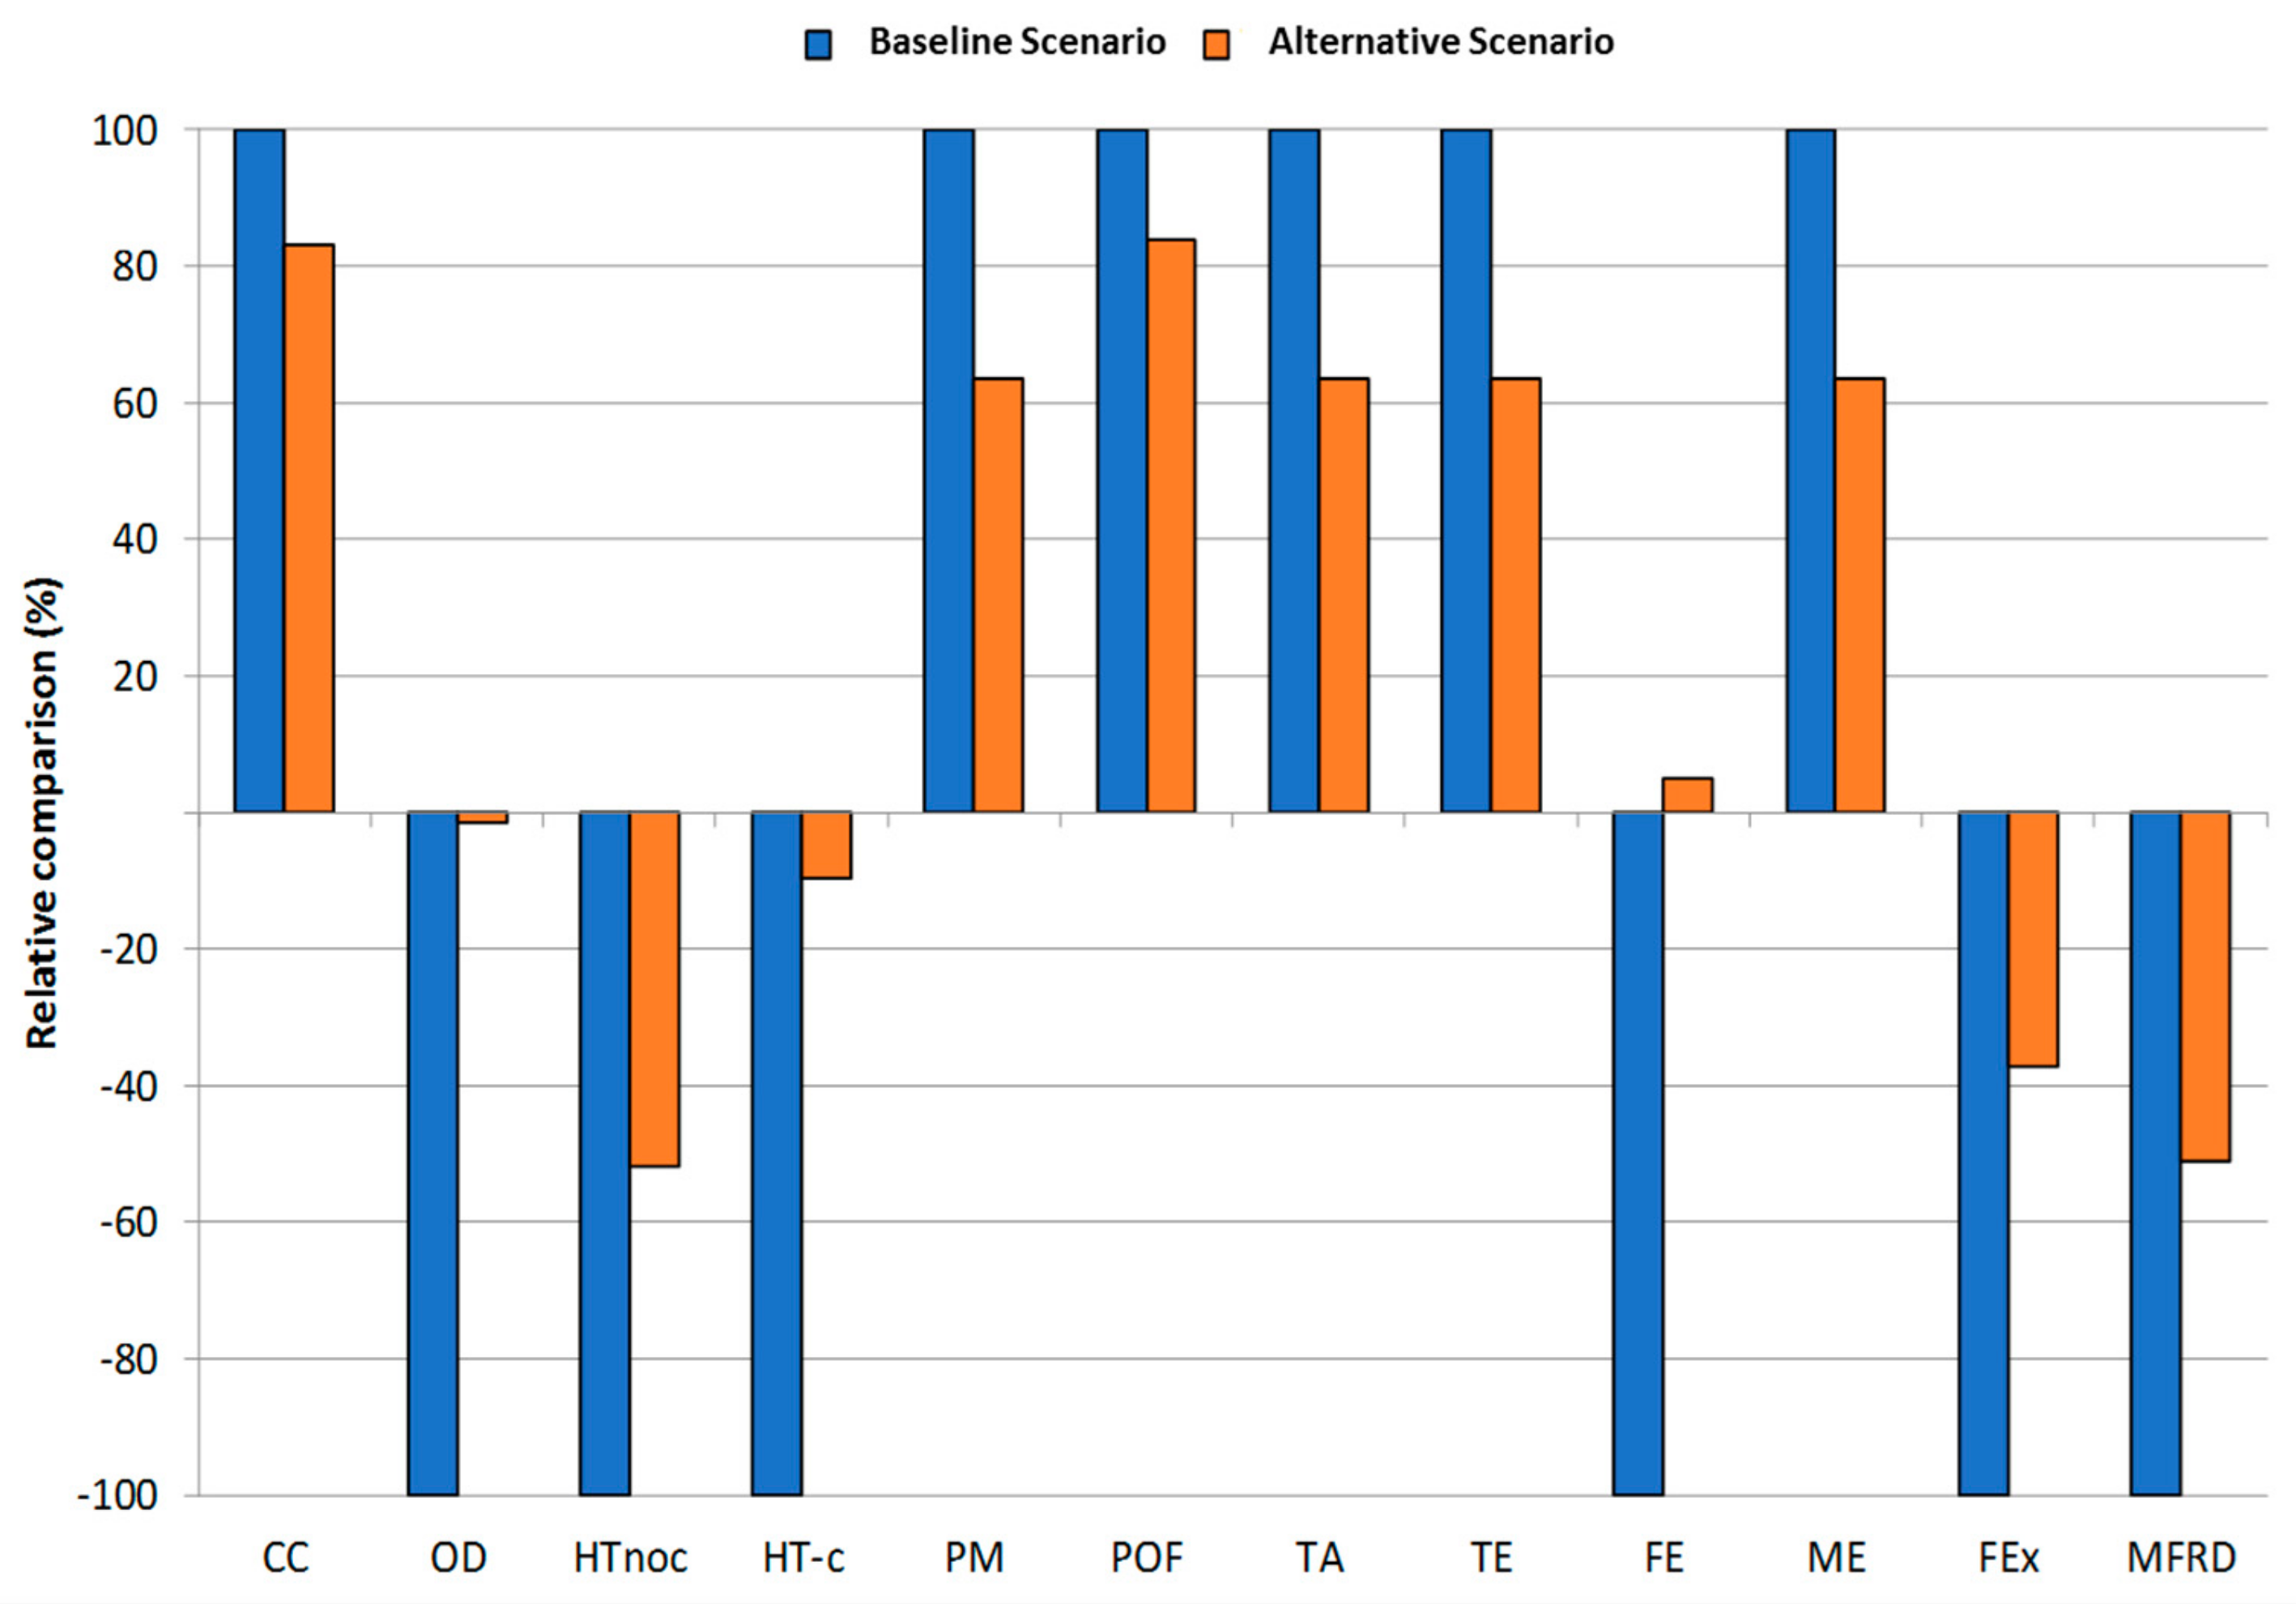
Table 5 reports the comparison between the environmental impacts of the two scenarios while the relative comparison is reported in Figure 4.
The results are reported as a percentage with the worst-performing scenario set at 100%.
The emissions of gases during storage are the main contributors to CC, PM, POF, TA, TE, and ME; regarding these impact categories, the contribution resulting from the production of the additive is negligible (<1% of the total impact). CH4 and N2O deeply affect CC, while NH3 is the main gas responsible for PM, TA, TE and ME.
The AS is the best for the CC impact category, since the use of the additive results in a reduction of CH4 and N2O emissions. Since NH3 emissions are the main contributor to TA, TE, ME, and PM categories, the solution with the use of the additive can be considered the most appropriate. The impact of the production of the 12 g of additive required for the FU considered (gypsum extraction, processing, and transport, as well as energy consumption) is enough to affect the other six categories, whilst the BS scenario is not influenced by external factors.
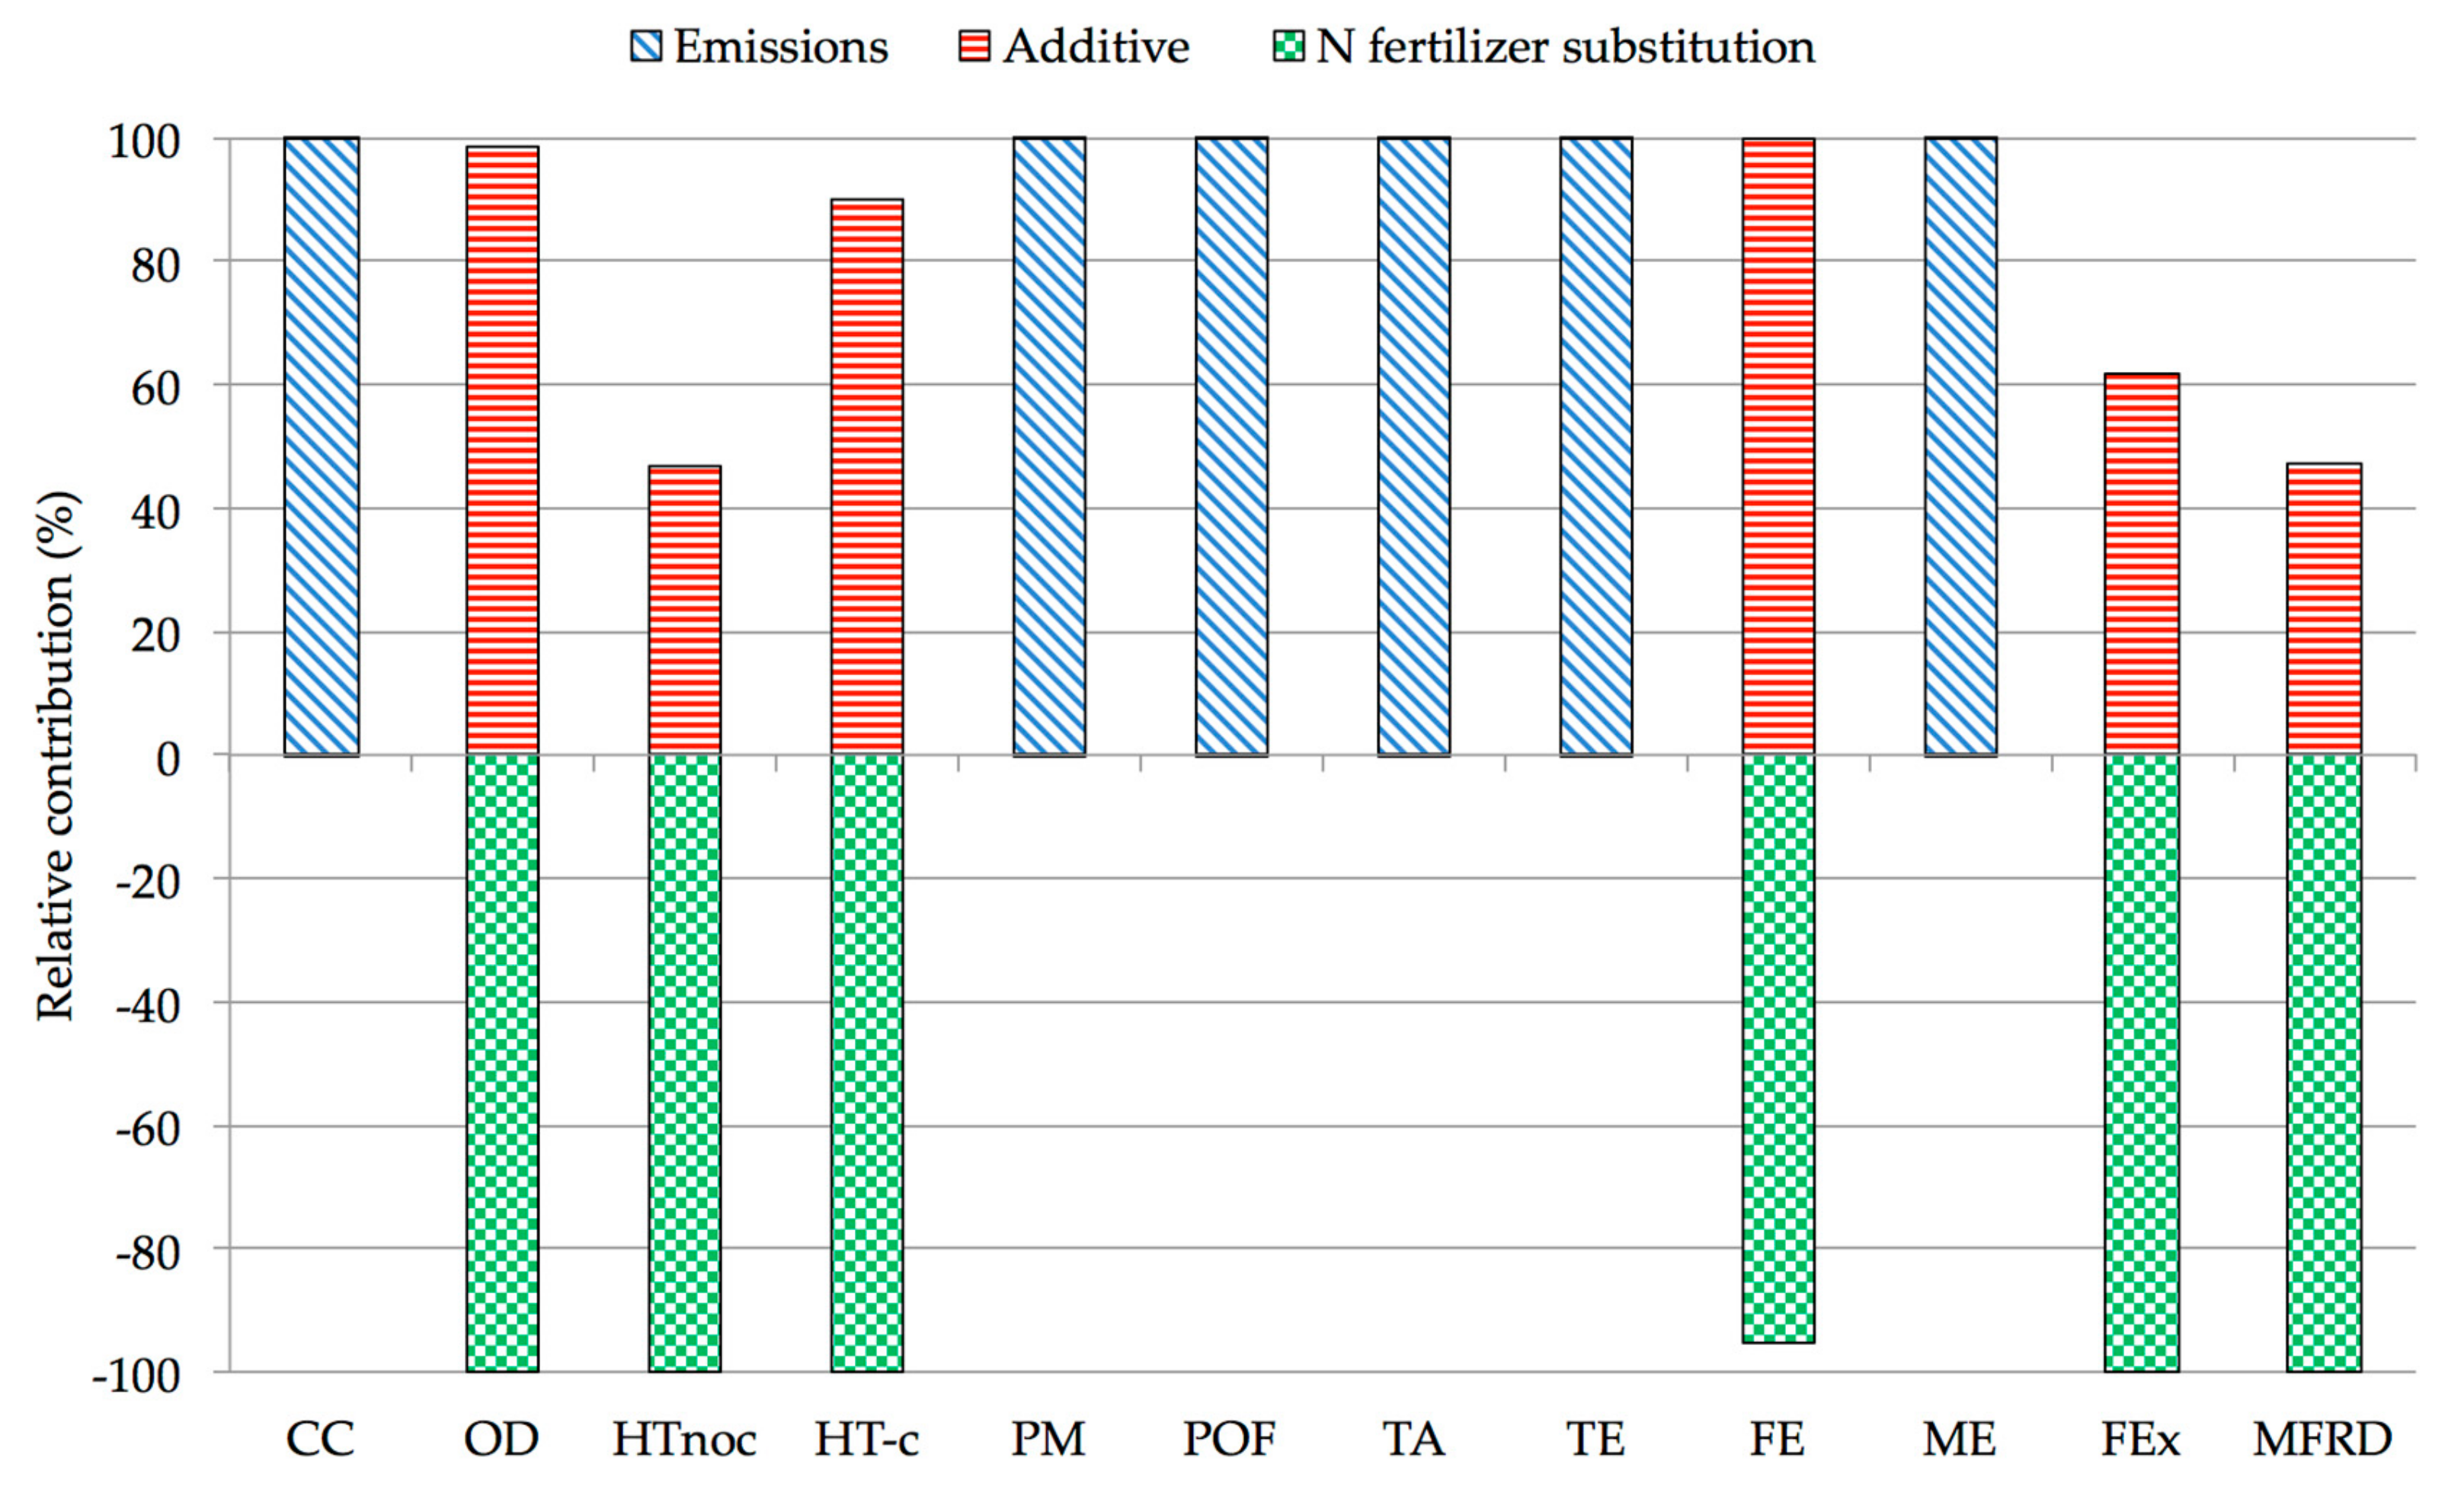
Figure 5 reports the relative contribution of the additive, the emissions and the avoided production of mineral fertilizer for AS (the scenario in which the additive is used).
The avoided production of mineral fertilizer, considered as a credit in both scenarios, has considerable environmental benefits. For OD, toxicity-related impact categories and MFRD, this credit is higher than the impact and, consequently, the whole process has environmental benefits. For the other six evaluated impact categories, the avoided production of ammonium nitrate is not a key driver of the environmental results.
Considering the N-NH3 content of the treated slurry a valid substitute for the nitrogen coming from mineral fertilizers, the avoided production of synthetic fertilizer results in considerable mitigation effects in terms of OD, HTnoc, HT-c, FEx, and MFRD, which globally offsets the impact that the production of the additive had on the mentioned categories.
4. Discussion
Sources of emissions of NH3 and GHG in dairy farms are represented by manure on the barn floor, manure treatment, and storage. This study focused on the possible contribution of a commercial additive to reduce the emissions of NH3 and GHG from slurry, checking also the slurry properties with particular attention to microbial N transformations.
4.1. Effects on NH3 and GHG Emissions
Since slurry storage is a source of NH3 and GHG emissions, it is important to take into account their global warming potential. Our data showed that the gypsum additive applied to the stored slurry decreased emissions of NH3 and GHG and reduced the pH value of the slurry.
The reduction in NH3 emissions may be attributed to the formation of ammonium sulfate and calcium nitrate. Indeed, in an acidic environment, NH4+ and NO3− ions, normally present in the slurry, react with SO42− and Ca2+ deriving from gypsum.
Concerning GHG emissions, the additive has good reduction effects on CH4, which is the predominant greenhouse gas emitted from slurry storage, and N2O that play a role when surfaces become encrusted. This reduction could be attributed to several factors such as the increase in the SO42- content of the slurry that has a toxic effect on methanogens, thus inhibiting CH4 production. During the trial, there was a fluctuation of the emission factors, probably due to the increase of microbial activity in the slurry; nevertheless, the addition of the product led to a reduction of GHG emissions. The ability to reduce GHG emissions after 4 days and the rise of fluxes at the end of the trial period seem to indicate that more than three applications of the additive may be required to achieve maximum results.
With regard to the reduction of NH3 emissions, the results were in line with Lim, et al. [41] that found that the addition of phosphogypsum led to an NH3 volatilization reduction of 56–69% after 25 days. Febrisiantosa et al. [28] found that the supplementation of flue gas desulphurization (FGD) gypsum resulted in a reduction of NH3 volatilization (26–59%). These reductions could be attributed to a lower pH and to NH3 absorption affected by the addition of these types of gypsum. In fact, the NH3 volatilization is favored by an alkaline pH and a high concentration of NH4+ in the slurry. However, on the contrary to that found in this work, Febrisiantosa’s study showed also an increase in the NO3-N accumulation in the manure by 6.7–7.9 fold, compared to the initial value using FGD gypsum.
The acidification of the slurry obtained and the inhibition of the denitrification process, indicated by the lower accumulation of NO3-N, seem to have favored the reduction of CH4 and N2O emissions in our study. Similar results were found by Berg, et al. [42], with the addition of lactic acid and Luo et al. [43], Hao et al. [44] and Yang et al. [25] with phosphogypsum. Regarding the reduction of N2O emissions, some authors have found opposite results to ours, in fact they found a slight increment of the release of that gas after treatment [24,25,44].
4.2. Effects on Nitrogen Management
It is well known that nitrogen is essential for the development of field crops, but excessive nitrates deriving from manure and slurry represent a serious threat to the environment. Hence, best practices for slurry and manure management are widely recommended and known [20,45]. In general, slurry acidification, obtained by the use of gypsum, modifies the slurry characteristics and its subsequent application, as well as increases the fertilization value of slurry, without negative impacts on other gaseous emissions. The fertilization value may increase due to the lowered ammonia emission, and the increased inorganic dissolution [46,47]. The results of this study showed that the use of the tested additive could actually modify slurry characteristics, increasing the TS and reducing NO3-N. These properties can improve the amendment features of the slurry, avoiding excessive leaching of the nitrates into groundwater and providing the right quantity of nutrients to the crops, safeguarding the environment.
4.3. Environmental Benefits
LCA shows that the environmental benefits achieved by reducing the use and production of synthetic fertilizers, together with the benefits related to the reduction of air emissions, make this treatment an interesting option for reducing the consumption of fossil resources for the production of synthetic fertilizers and to mitigate NH3 emission into the air and the related Particulate Matter formation, Acidification and Eutrophication.
The results of this LCA study showed that, by making a projection of the values at 180 days, the treated sample would give off 1.6 times lower emissions than the raw slurry, as confirmed by the reduction of the CC impact when the AS is considered. The AS resulted as having higher environmental sustainability than the BS (unprocessed slurry) on most impact categories.
5. Conclusions
Compared to other additives studied, such as lactic acid or phosphogypsum, the additive studied here proved to be able to simultaneously mitigate NH3, N2O, CH4, and CO2 emissions from slurry storage.
It is also important to notice that these results were obtained with a much lower amount of product than that proposed in other studies for the other amendments: the additive under examination here was applied 3 times at 4 g/m3 while other materials were used at a minimum of 3-10% of manure wet weight, proving, thus, to be a scalable solution.
The additive was able to control NH3 and N2O emissions, without accumulating nitrates. The use of slurry treated with this additive as organic fertilizer could be beneficial for the environment since its NO3-N content appears to be lower. In addition, the use of treated slurry avoids the use and the purchase of mineral fertilizers, thus resulting in an economic advantage for the farmer.
The LCA study also confirms the environmental sustainability of this solution with the additive with respect to the environmental impact categories of Climate Change, Particulate Matter formation, Photochemical Oxidant Formation, Acidification and Terrestrial and Marine Eutrophication.
This study shows the alignment of this treatment with some of the UN Sustainable Development Goals (SDG), among which SDG number 13—Climate Action and 6—Clean Water and Sanitation.
For all these results, the application of the studied slurry additive can be considered an effective method to improve the sustainability of dairy slurry management.
Since the results of this study are promising, pilot and large-scale tests will be necessary to investigate the effectiveness and economic feasibility of this method also in other types of slurry management systems.
Author Contributions
All authors have contributed equally to this work. All authors have read and approved the final manuscript.
Funding
This research received no external funding.
Conflicts of Interest
The authors declare no conflict of interest.
References
- Gerber, P.J.; Steinfeld, H.; Henderson, B.; Mottet, A.; Opio, C.; Dijkman, J.; Falcucci, A.; Tempio, G. Tackling Climate Change through Livestock: A Global Assessment of Emissions and Mitigation Opportunities; Food and Agriculture Organization of the United Nations (FAO): Rome, Italy, 2013. [Google Scholar]
- Owen, J.J.; Silver, W.L. Greenhouse gas emissions from dairy manure management: A review of field-based studies. Glob. Chang. Biol. 2015, 21, 550–565. [Google Scholar] [CrossRef] [PubMed]
- IPCC. IPCC Emissions from Livestock and Manure Management; Eggleston, H.S., Buendia, L., Miwa, K., Ngara, T., Tanabe, K., Eds.; IGES: Kanagawa, Japan, 2006; Volume 4, Chapter 10. [Google Scholar]
- Baldini, C.; Borgonovo, F.; Gardoni, D.; Guarino, M. Comparison among NH3 and GHGs emissive patterns from different housing solutions of dairy farms. Atmos. Environ. 2016, 141, 60–66. [Google Scholar] [CrossRef]
- IPCC. Climate Change 2013: The Physical Science Basis; Stocker, T.F., Qin, D., Plattner, G.-K., Tignor, M., Allen, S.K., Boschung, J., Nauels, A., Xia, Y., Bex, V., Midgley, P.M., Eds.; Cambridge University Press: Cambridge, UK; New York, NY, USA, 2013. [Google Scholar]
- Adviento-Borbe, M.A.A.; Wheeler, E.F.; Brown, N.E.; Topper, P.A.; Graves, R.E.; Ishler, V.A.; Varga, G.A. Ammonia and Greenhouse Gas Flux from Manure in Freestall Barn with Dairy Cows on Precision Fed Rations. Trans. ASABE 2010, 53, 1251–1266. [Google Scholar] [CrossRef]
- Brinkmann, T.; Both, R.; Scalet, B.M.; Roudier, S.; Sancho, L.D. JRC Reference Report on Monitoring of Emissions to Air and Water from IED Installations; European IPPC Bureau, European Commission, Joint Research Centre: Ispra, Italy, 2018; p. 155. [Google Scholar]
- Giannakis, E.; Kushta, J.; Giannadaki, D.; Georgiou, G.K.; Bruggeman, A.; Lelieveld, J. Exploring the economy-wide effects of agriculture on air quality and health: Evidence from Europe. Sci. Total Environ. 2019, 663, 889–900. [Google Scholar] [CrossRef]
- Oenema, O.; Velthof, G.; Klimont, Z.; Winiwarter, W. Emissions from Agriculture and Their Control Potentials; TSAP Report No. 3; version 2.1; IIASA: Laxenburg, Austria, 2012; p. 47. [Google Scholar]
- European Commission. Directive 2001/81/EC of the European Parliament and of the Council of 23 October 2001 on National Emission Ceilings for Certain Atmospheric Pollutants; European Commission: Brussels, Belgium, 2001. [Google Scholar]
- UNECE. Gothenburg Protocol, Protocol to the 1979 Convention on Long-Range Transboundary Air Pollution to Abate Acidification, Eutrophication and Ground-Level Ozone 1999; UNECE: Geneva, Switzerland, 1999. [Google Scholar]
- Protocol, K. United Nations Framework Convention on Climate Change; Kyoto Protocol: Kyoto, Japan, 1997; p. 19. [Google Scholar]
- European Commission. Council Directive 91/676/EEC of 12 December 1991 Concerning the Protection of Waters Against Pollution Caused by Nitrates from Agricultural Sources; European Commission: Brussels, Belgium, 1991. [Google Scholar]
- Sommer, S.G.; Clough, T.J.; Chadwick, D.; Petersen, S.O. Greenhouse Gas Emissions from Animal Manures and Technologies for Their Reduction. In Animal Manure Recycling: Treatment and Management; John Wiley & Sons, Inc.: Hoboken, NJ, USA, 2013. [Google Scholar]
- Chadwick, D.; Sommer, S.; Thorman, R.; Fangueiro, D.; Cardenas, L.; Amon, B.; Misselbrook, T. Manure management: Implications for greenhouse gas emissions. Anim. Feed Sci. Technol. 2011, 166, 514–531. [Google Scholar] [CrossRef]
- Provolo, G.; Finzi, A.; Perazzolo, F.; Mattachini, G.; Riva, E. Effect of a biological additive on nitrogen losses from pig slurry during storage. J. Environ. Qual. 2016, 45, 1460–1465. [Google Scholar] [CrossRef] [PubMed]
- Sun, F.; Harrison, J.; Ndegwa, P.; Johnson, K. Effect of manure treatment on ammonia and greenhouse gases emissions following surface application. Water Air Soil Pollut. 2014, 225, 1923. [Google Scholar] [CrossRef]
- European Commission. Integrated Pollution Prevention and Control Reference Document on Best Available Techniques on Emissions from Storage; European Commission: Brussels, Belgium, 2006. [Google Scholar]
- Michel, J.; Weiske, A.; Möller, K. The effect of biogas digestion on the environmental impact and energy balances in organic cropping systems using the life-cycle assessment methodology. Renew. Agric. Food Syst. 2010, 25, 204–218. [Google Scholar] [CrossRef]
- Guarino, M.; Fabbri, C.; Brambilla, M.; Valli, L.; Navarotto, P. Evaluation of simplified covering systems to reduce gaseous emissions from livestock manure storage. Trans. ASABE 2006, 49, 737–747. [Google Scholar] [CrossRef]
- Owusu-Twum, M.Y.; Polastre, A.; Subedi, R.; Santos, A.S.; Ferreira, L.M.M.; Coutinho, J.; Trindade, H. Gaseous emissions and modification of slurry composition during storage and after field application: Effect of slurry additives and mechanical separation. J. Environ. Manag. 2017, 200, 416–422. [Google Scholar] [CrossRef] [PubMed]
- Regueiro, I.; Coutinho, J.; Fangueiro, D. Alternatives to sulfuric acid for slurry acidification: Impact on slurry composition and ammonia emissions during storage. J. Clean. Prod. 2016, 131, 296–307. [Google Scholar] [CrossRef]
- Holly, M.A.; Larson, R.A. Effects of Manure Storage Additives on Manure Composition and Greenhouse Gas and Ammonia Emissions. Trans. ASABE 2017, 60, 449–456. [Google Scholar] [CrossRef]
- Li, Y.; Luo, W.; Li, G.; Wang, K.; Gong, X. Performance of phosphogypsum and calcium magnesium phosphate fertilizer for nitrogen conservation in pig manure composting. Bioresour. Technol. 2018, 250, 53–59. [Google Scholar] [CrossRef]
- Yang, F.; Li, G.; Shi, H.; Wang, Y. Effects of phosphogypsum and superphosphate on compost maturity and gaseous emissions during kitchen waste composting. Waste Manag. 2015, 36, 70–76. [Google Scholar] [CrossRef] [PubMed]
- Chiumenti, A.; Da Borso, F.; Pezzuolo, A.; Sartori, L.; Chiumenti, R. Ammonia and greenhouse gas emissions from slatted dairy barn floors cleaned by robotic scrapers. Res. Agric. Eng. 2018, 64, 23–66. [Google Scholar] [CrossRef]
- Tubail, K.; Chen, L.; Michel, F.C., Jr.; Keener, H.M.; Rigot, J.F.; Klingman, M.; Kost, D.; Dick, W.A. Gypsum additions reduce ammonia nitrogen losses during composting of dairy manure and biosolids. Compost Sci. Util. 2008, 16, 285–293. [Google Scholar] [CrossRef]
- Febrisiantosa, A.; Ravindran, B.; Choi, H.L. The Effect of Co-Additives (Biochar and FGD Gypsum) on Ammonia Volatilization during the Composting of Livestock Waste. Sustainability 2018, 10, 795. [Google Scholar] [CrossRef]
- Webber, M.E.; MacDonald, T.; Pushkarsky, M.B.; Patel, C.K.N.; Zhao, Y.; Marcillac, N.; Mitloehner, F.M. Agricultural ammonia sensor using diode lasers and photoacoustic spectroscopy. Meas. Sci. Technol. 2005, 16, 1547–1553. [Google Scholar] [CrossRef] [Green Version]
- Huszár, H.; Pogány, A.; Bozóki, Z.; Mohácsi, Á.; Horváth, L.; Szabó, G. Ammonia monitoring at ppb level using photoacoustic spectroscopy for environmental application. Sens. Actuators B Chem. 2008, 134, 1027–1033. [Google Scholar] [CrossRef]
- Dinuccio, E.; Balsari, P.; Berg, W. GHG emissions during the storage of rough pig slurry and the fractions obtained by mechanical separation. Aust. J. Exp. Agric. 2008, 48, 93–95. [Google Scholar] [CrossRef]
- Ogink, N.W.; Mosquera, J.; Calvet, S.; Zhang, G. Methods for measuring gas emissions from naturally ventilated livestock buildings: Developments over the last decade and perspectives for improvement. Biosyst. Eng. 2013, 116, 297–308. [Google Scholar] [CrossRef]
- Heijungs, R. Ten easy lessons for good communication of LCA. Int. J. Life Cycle Assess. 2013, 19, 473–476. [Google Scholar] [CrossRef] [Green Version]
- Laurent, A.; Bakas, I.; Clavreul, J.; Bernstad, A.; Niero, M.; Gentil, E.; Hauschild, M.Z.; Christensen, T.H. Review of LCA studies of solid waste management systems–Part I: Lessons learned and perspectives. Waste Manag. 2014, 34, 573–588. [Google Scholar] [CrossRef] [PubMed]
- Lijó, L.; Lorenzo-Toja, Y.; González-García, S.; Bacenetti, J.; Negri, M.; Moreira, M.T. Eco-efficiency assessment of farm-scaled biogas plants. Bioresour. Technol. 2017, 237, 146–155. [Google Scholar] [CrossRef]
- Bacenetti, J.; Fusi, A.; Azapagic, A. Environmental sustainability of integrating the organic Rankin cycle with anaerobic digestion and combined heat and power generation. Sci. Total Environ. 2019, 658, 684–696. [Google Scholar] [CrossRef] [PubMed]
- Bacenetti, J.; Lovarelli, D.; Fiala, M. Mechanisation of organic fertiliser spreading, choice of fertiliser and crop residue management as solutions for maize environmental impact mitigation. Eur. J. Agron. 2016, 79, 107–118. [Google Scholar] [CrossRef]
- Baldini, C.; Bava, L.; Zucali, M.; Guarino, M. Milk production Life Cycle Assessment: A comparison between estimated and measured emission inventory for manure handling. Sci. Total Environ. 2018, 625, 209–219. [Google Scholar] [CrossRef]
- Weidema, B.P.; Bauer, C.; Hischier, R.; Mutel, C.; Nemecek, T.; Reinhard, J.; Vadenbo, C.; Wernet, G. Overview and Methodology: Data Quality Guideline for the Ecoinvent Database Version 3; Swiss Centre for Life Cycle Inventories: Zurich, Switzerland, 2013. [Google Scholar]
- EC-JRC-European Commission, Institute for Environment and Sustainability. Characterisation factors of the ILCD Recommended Life Cycle Impact Assessment Methods, 1st ed.; Database and Supporting Information; Publications Office of the European Union: Brussels, Belgium, February 2012. [Google Scholar]
- Lim, S.-S.; Park, H.-J.; Hao, X.; Lee, S.-I.; Jeon, B.-J.; Kwak, J.-H.; Choi, W.-J. Nitrogen, carbon, and dry matter losses during composting of livestock manure with two bulking agents as affected by co-amendments of phosphogypsum and zeolite. Ecol. Eng. 2017, 102, 280–290. [Google Scholar] [CrossRef]
- Berg, W.; Brunsch, R.; Pazsiczki, I. Greenhouse gas emissions from covered slurry compared with uncovered during storage. Agric. Ecosyst. Environ. 2006, 112, 129–134. [Google Scholar] [CrossRef]
- Luo, Y.; Li, G.; Luo, W.; Schuchardt, F.; Jiang, T.; Xu, D. Effect of phosphogypsum and dicyandiamide as additives on NH3, N2O and CH4 emissions during composting. J. Environ. Sci. 2013, 25, 1338–1345. [Google Scholar] [CrossRef]
- Hao, X.; Larney, F.J.; Chang, C.; Travis, G.R.; Nichol, C.K.; Bremer, E. The effect of phosphogypsum on greenhouse gas emissions during cattle manure composting. J. Environ. Qual. 2005, 34, 774–781. [Google Scholar] [CrossRef] [PubMed]
- Kleinman, P.J.; Buda, A.R.; Sharpley, A.N.; Khosla, R. Elements of precision manure management. In Precision Conservation: Geospatial Techniques for Agricultural and Natural Resources Conservation; American Society of Agronomy and Crop Science Society of America, Inc.: Madison, MI, USA, 2017; pp. 165–192. [Google Scholar]
- Fangueiro, D.; Hjorth, M.; Gioelli, F. Acidification of animal slurry—A review. J. Environ. Manag. 2015, 149, 46–56. [Google Scholar] [CrossRef] [PubMed]
- Hjorth, M.; Cocolo, G.; Jonassen, K.; Abildgaard, L.; Sommer, S.G. Continuous in-house acidification affecting animal slurry composition. Biosyst. Eng. 2015, 132, 56–60. [Google Scholar] [CrossRef]
Figure 1.
Gas concentration in the measuring chamber over time.

Figure 2.
Schematic view of the sampling process.

Figure 3.
System boundaries.

Figure 4.
Relative comparison between Baseline Scenario and Alternative Scenario.

Figure 5.
Relative environmental contribution for Alternative Scenario.


Table 1.
Main inventory data for additive manufacturing.
| Production factors | Unit | Quantity |
|---|---|---|
| Electricity | kWh/kg | 0.899 |
| Gypsum | kg | 1 |
| Transport distance | kg/km | 45 |
Table 2.
R-squared value for each measure and its p-value.
| T0 | T4 | T7 | T26 | ||||||
|---|---|---|---|---|---|---|---|---|---|
| Control | Treated | Control | Treated | Control | Treated | Control | Treated | ||
| NH3 | R2 p-values | 0.91 <0.0001 | 0.93 <0.0001 | 0.67 0.013 | 0.72 0.011 | 0.8 0.003 | 0.79 0.006 | 0.92 <0.0001 | 0.96 <0.0001 |
| N2O | R2 p-values | 0.86 0.05 | 0.75 0.05 | 0.88 <0.0001 | 0.93 <0.0001 | 0.79 0.05 | 0.69 0.05 | 0.95 0.0004 | 0.9 0.0007 |
| CO2 | R2 p-values | 0.99 <0.0001 | 0.99 <0.0001 | 0.89 0.008 | 0.93 0.0005 | 0.99 <0.0001 | 0.99 <0.0001 | 0.97 <0.0001 | 0.99 <0.0001 |
| CH4 | R2 p-values | 0.99 <0.0001 | 0.99 <0.0001 | 0.86 <0.0001 | 0.89 <0.0001 | 0.97 <0.0001 | 0.99 <0.0001 | 0.96 <0.0001 | 0.98 <0.0001 |
Table 3.
Greenhouse Gas (GHG) emission factors (g/m2·h).
| T0 | T4 | T7 | T26 | |||||
|---|---|---|---|---|---|---|---|---|
| Control | Treated | Control | Treated | Control | Treated | Control | Treated | |
| NH3 | 1.109 (±0.047) | 1.109 (±0.118) | 0.091 (±0.065) | 0.000 (±0.001) | 0.408 (±0.032) | 0.136 (±0.026) | 1.654 (±0.034) | 0.646 (±0.049) |
| N2O | 0.003 (±0.002) | 0.003 (±0.002) | 0.018 (±0.010) | 0.000 (±0.001) | 0.000 (±0.001) | 0.001 (±0.001) | 0.015 (±0.004) | 0.018 (±0.002) |
| CO2 | 28.078 (±0.999) | 28.078 (±0.947) | 603.73 (±136.191) | 465.615 (±51.591) | 74.723 (±2.485) | 69.526 (±1.552) | 92.968 (±6.629) | 104.323 (±3.053) |
| CH4 | 0.632 (±0.027) | 0.632 (±0.031) | 109.827 (±39.258) | 86.184 (±12.185) | 8.943 (±0.537) | 9.318 (±0.212) | 10.389 (±0.871) | 12.699 (±0.693) |
Data represents mean ± Standard Error (n = 24).
Table 4.
Properties of slurry without additive (control) and with additive (treated) at T0, T4, T7, and T26.
Table 4.
Properties of slurry without additive (control) and with additive (treated) at T0, T4, T7, and T26.
| T0 | T4 | T7 | T26 | |||||
|---|---|---|---|---|---|---|---|---|
| Control | Treated | Control | Treated | Control | Treated | Control | Treated | |
| TS (g kg−1 DM) | 78.41 (±1.22) | 78.41 (±1.37) | 97.48 (± 1.63) | 99.91 (±2.11) | 99.36 (±1.62) | 103.88 (±1.11) | 91.37 (±3.28) | 93.21 (±2.81) |
| VS (%TS DM) | 83.86 (±0.76) | 83.86 (±0.41) | 84.45 (± 0.42) | 83.96 (±0.93) | 83.85 (±0.47) | 83.83 (±0.59) | 81.76 (±0.35) | 81.90 (±0.86) |
| TN (g kg−1 WW) | 1.86 (±0.10) | 1.86 (±0.11) | 1.88 (± 0.03) | 2.02 (±0.04) | 2.75 (±0.21) | 2.61 (±0.24) | 2.30 (±0.36) | 2.14 (±0.02) |
| NH4+-N (g kg−1 WW) | 0.88 (±0.06) | 0.88 (±0.03) | 0.99 (± 0.03) | 1.00 (±0.03) | 1.00 (±0.01) | 0.99 (±0.01) | 1.03 (±0.04) | 1.00 (±0.09) |
| NO2-N (mg kg−1 WW) | 12.80 (±0.1) | 12.80 (±0.2) | 14.29 (± 0.3) | 14.20 (±0.8) | 16.77 (±0.4) | 17.20 (±0.6) | 17.07 (±0.8) | 17.00 (±0.3) |
| NO3-N (mg kg−1 WW) | 89.60 (±4.5) | 89.60 (±2.8) | 158.40 (± 18.0) | 154.0 (±3.5) | 152.88 (±5.3) | 163.60 (±4.6) | 736.12 (±54.1) | 727.50 (±38.4) |
TS: Total Solids; VS: Volatile solids; TN: Total Nitrogen; NH4+-N: Ammonium-nitrogen; NO2-N: nitrites; NO3-N: nitrates. DM: dry matter; WW: wet weight. Data represents mean ± Standard Error.
Table 5.
Potential environmental impact for Baseline Scenario and Alternative Scenario.
| Impact Category | Acronym | Baseline Scenario | Alternative Scenario |
|---|---|---|---|
| Climate change | CC | 132.6 kg CO2 eq | 110.1 kg CO2 eq |
| Ozone depletion | OD | −5∙10−10 kg CFC-11 eq | −7.3∙10−12 kg CFC-11 eq |
| Human toxicity, non-cancer effects | HTnoc | −1.6∙10−9 CTUh | −8.3∙10−10 CTUh |
| Human toxicity, cancer effects | HT-c | −1.8∙10−10 CTUh | −1.7∙10−11 CTUh |
| Particulate matter | PM | 0.062 kg PM2.5 eq | 0.039 kg PM2.5 eq |
| Photochemical ozone formation | POF | 0.052 kg NMVOC eq | 0.043 kg NMVOC eq |
| Terrestrial acidification | TA | 2.785 molc H+ eq | 1.769 molc H+ eq |
| Terrestrial eutrophication | TE | 12.452 molc N eq | 7.911 molc N eq |
| Freshwater eutrophication | FE | −1∙10−6 kg P eq | 4.95∙10−8 kg P eq |
| Marine eutrophication | ME | 0.085 kg N eq | 0.054 kg N eq |
| Freshwater ecotoxicity | FEx | −0.039 CTUe | −0.014 CTUe |
| Mineral, fossil & ren resource depletion | MFRD | −3.3∙10−7 kg Sb eq | −1.7∙10−7 kg Sb eq |
© 2019 by the authors. Licensee MDPI, Basel, Switzerland. This article is an open access article distributed under the terms and conditions of the Creative Commons Attribution (CC BY) license (http://creativecommons.org/licenses/by/4.0/).
Share and Cite
MDPI and ACS Style
Borgonovo, F.; Conti, C.; Lovarelli, D.; Ferrante, V.; Guarino, M. Improving the Sustainability of Dairy Slurry by A Commercial Additive Treatment. Sustainability 2019, 11, 4998. https://doi.org/10.3390/su11184998
AMA Style
Borgonovo F, Conti C, Lovarelli D, Ferrante V, Guarino M. Improving the Sustainability of Dairy Slurry by A Commercial Additive Treatment. Sustainability. 2019; 11(18):4998. https://doi.org/10.3390/su11184998
Chicago/Turabian StyleBorgonovo, Federica, Cecilia Conti, Daniela Lovarelli, Valentina Ferrante, and Marcella Guarino. 2019. "Improving the Sustainability of Dairy Slurry by A Commercial Additive Treatment" Sustainability 11, no. 18: 4998. https://doi.org/10.3390/su11184998
Note that from the first issue of 2016, this journal uses article numbers instead of page numbers. See further details here.