Remote Sensing-Based Analysis of Landscape Pattern Evolution in Industrial Rural Areas: A Case of Southern Jiangsu, China

Abstract
:1. Introduction
2. Materials and Methods
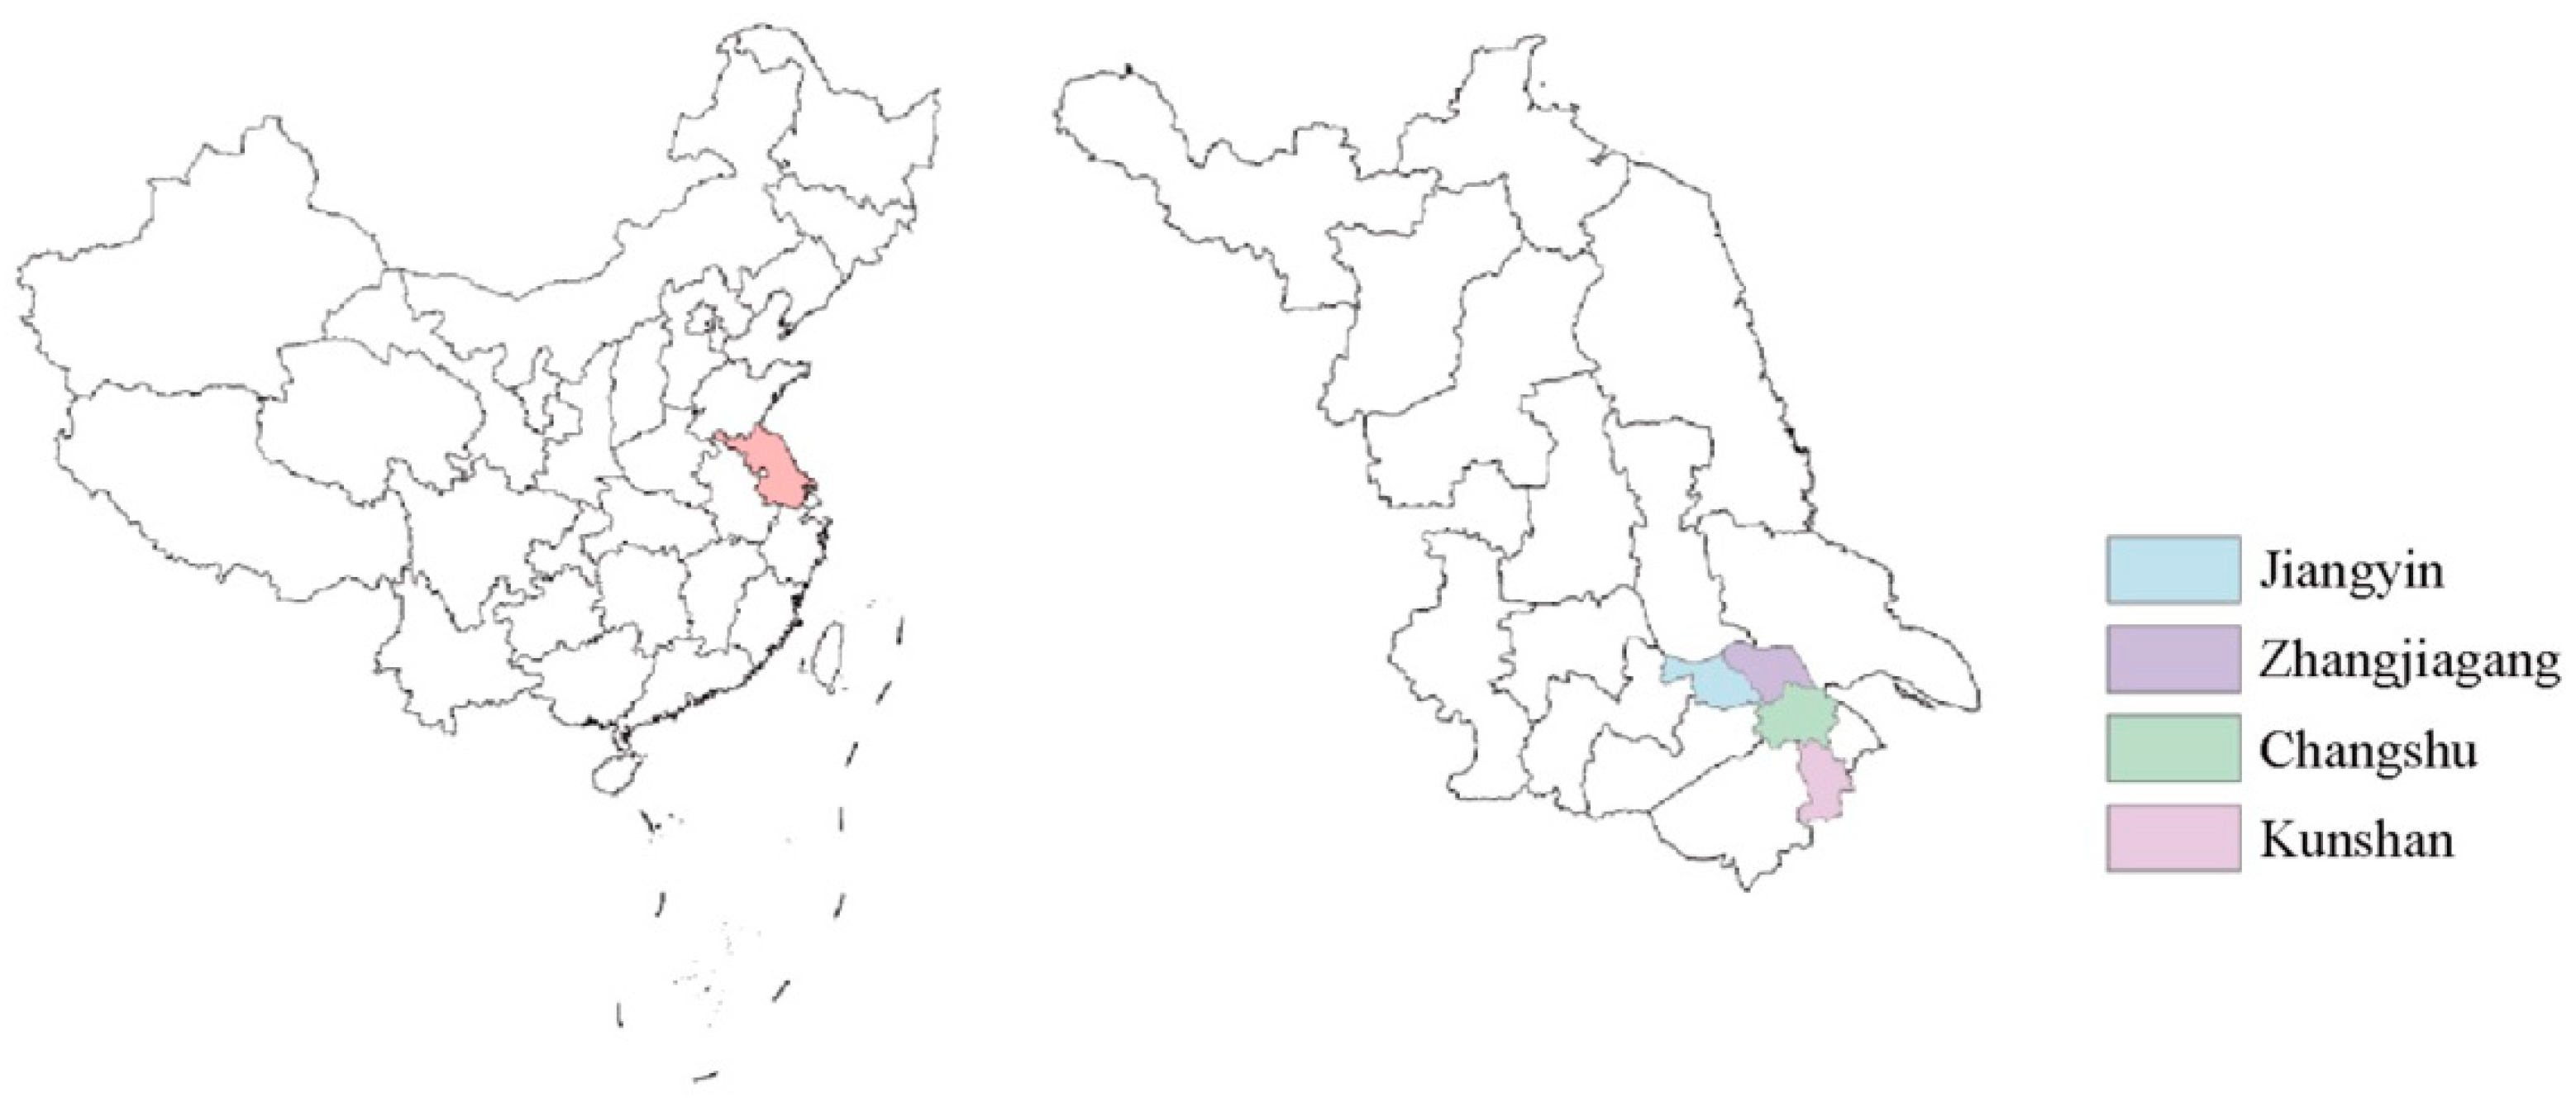
2.1. Study Area
2.2. Data Collection and Pre-Processing
2.3. Landscape Pattern Indexes
3. Results
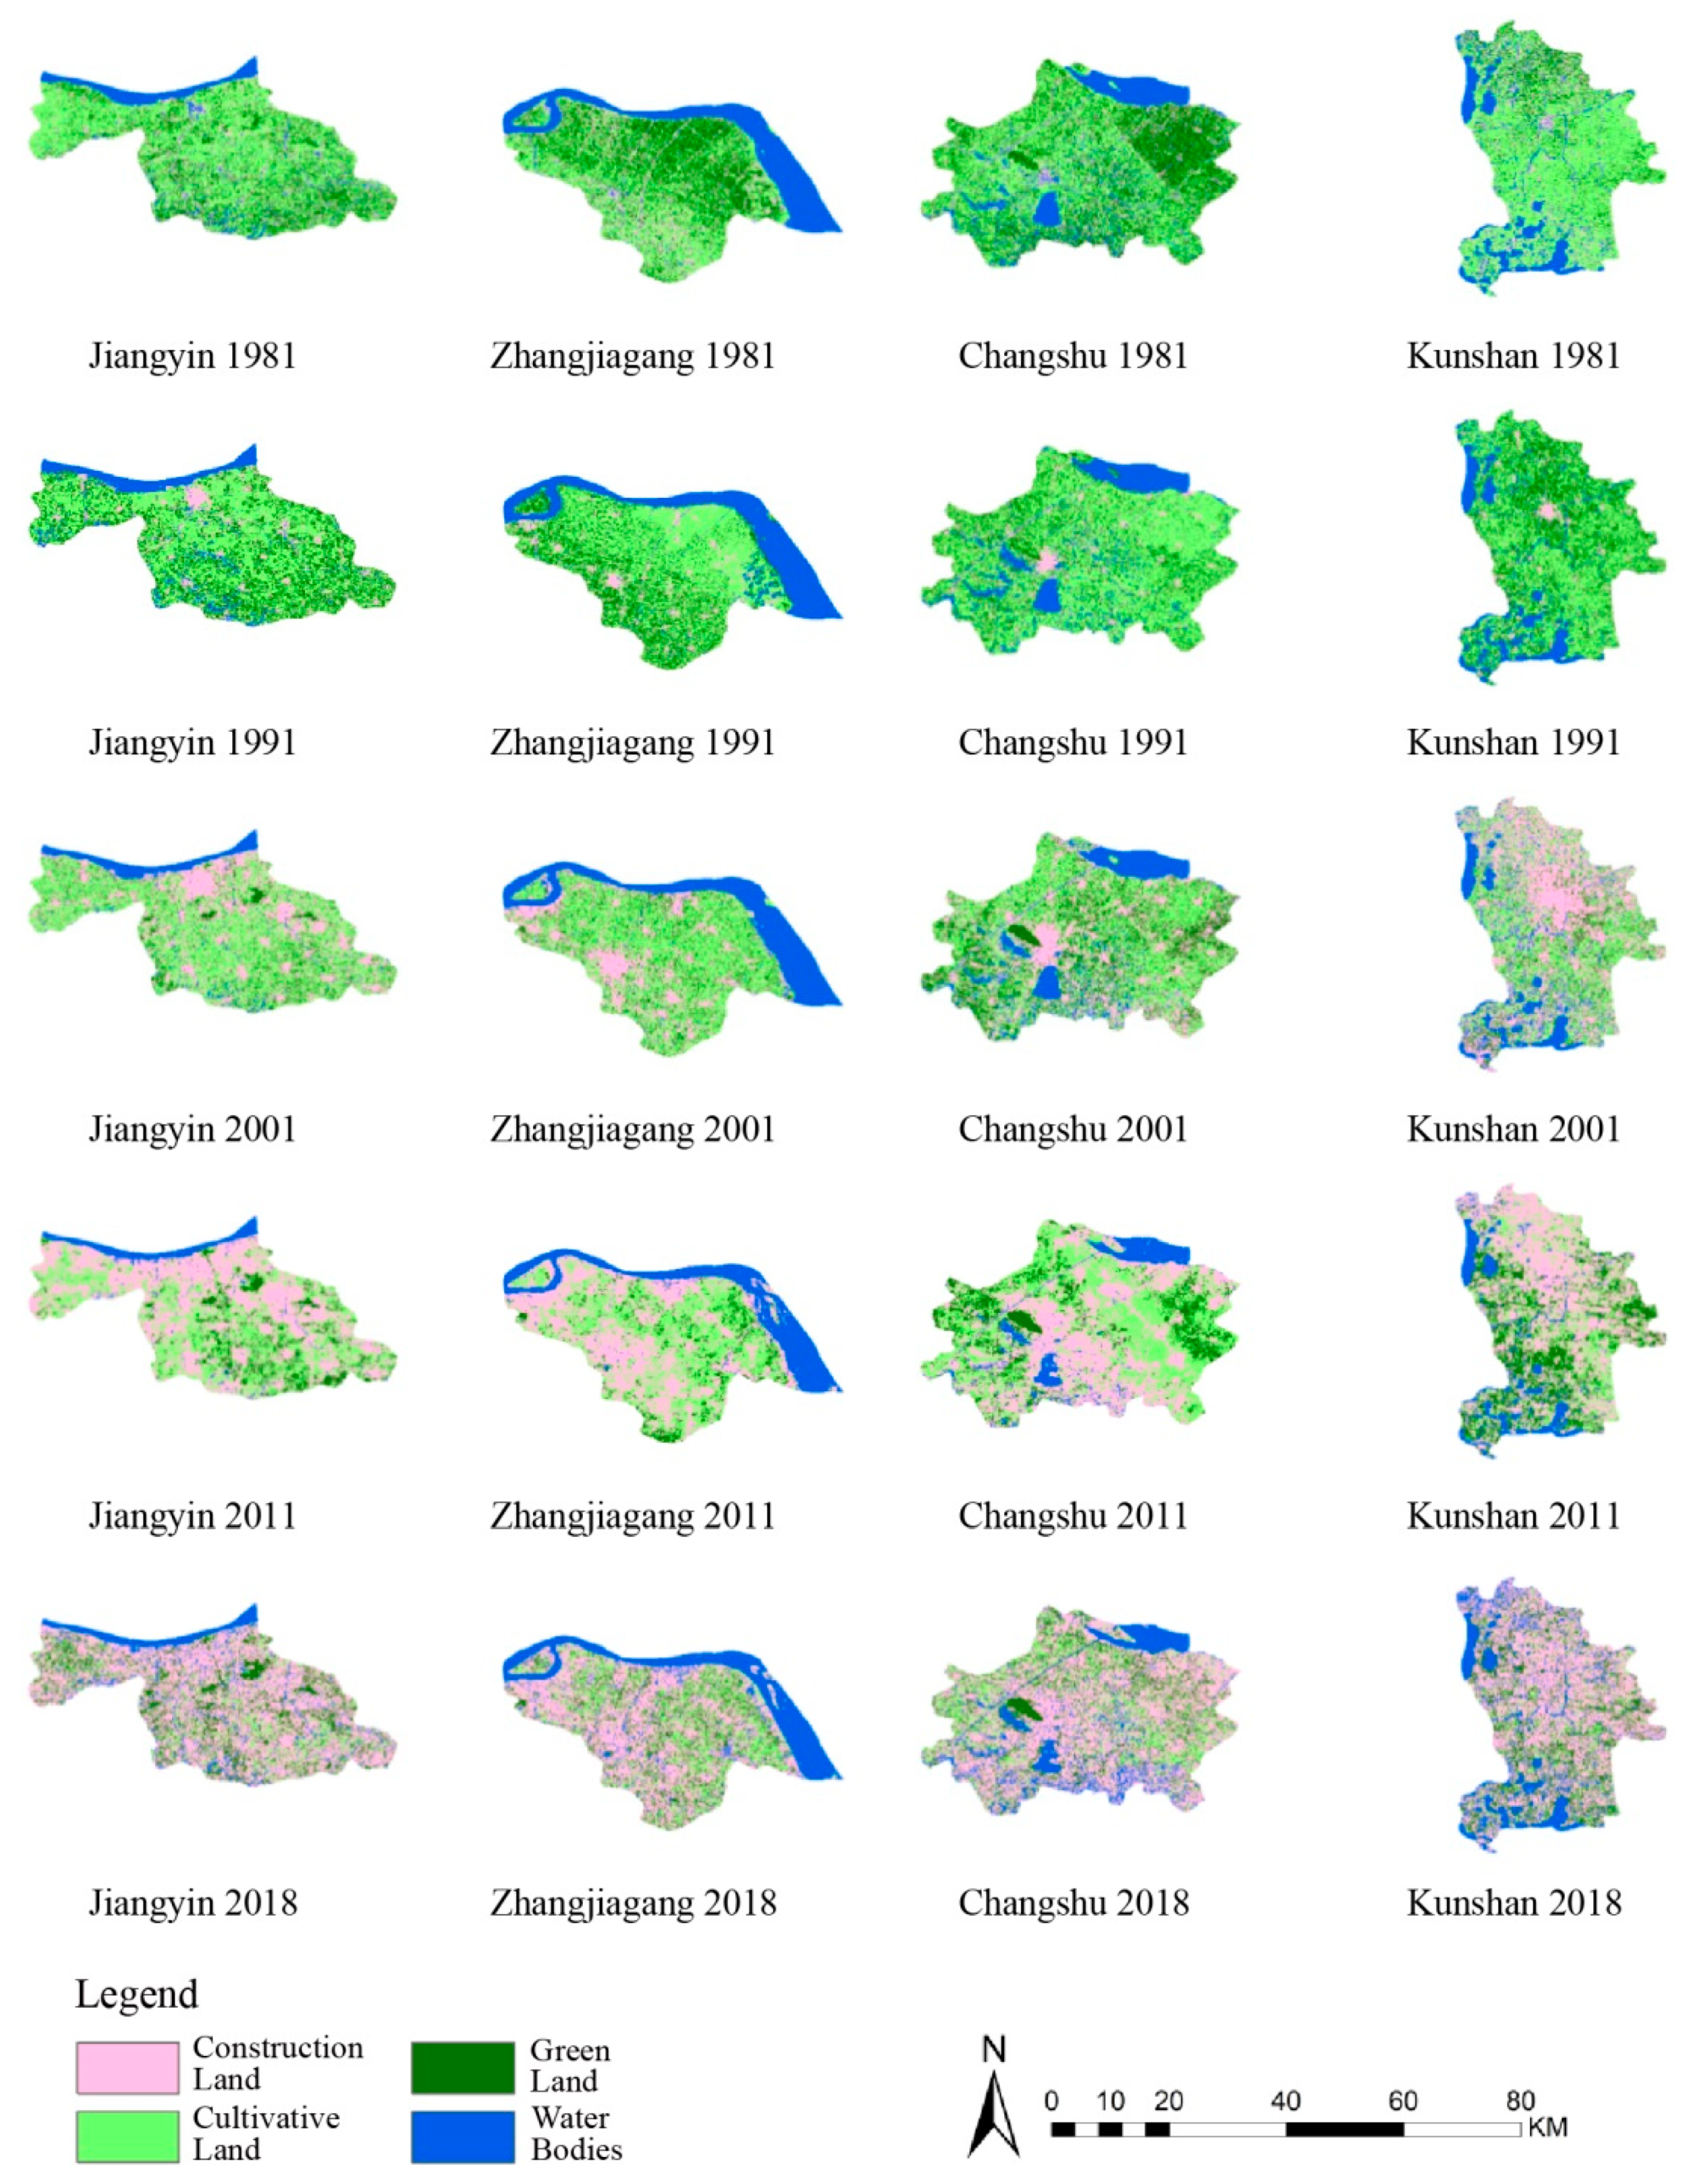
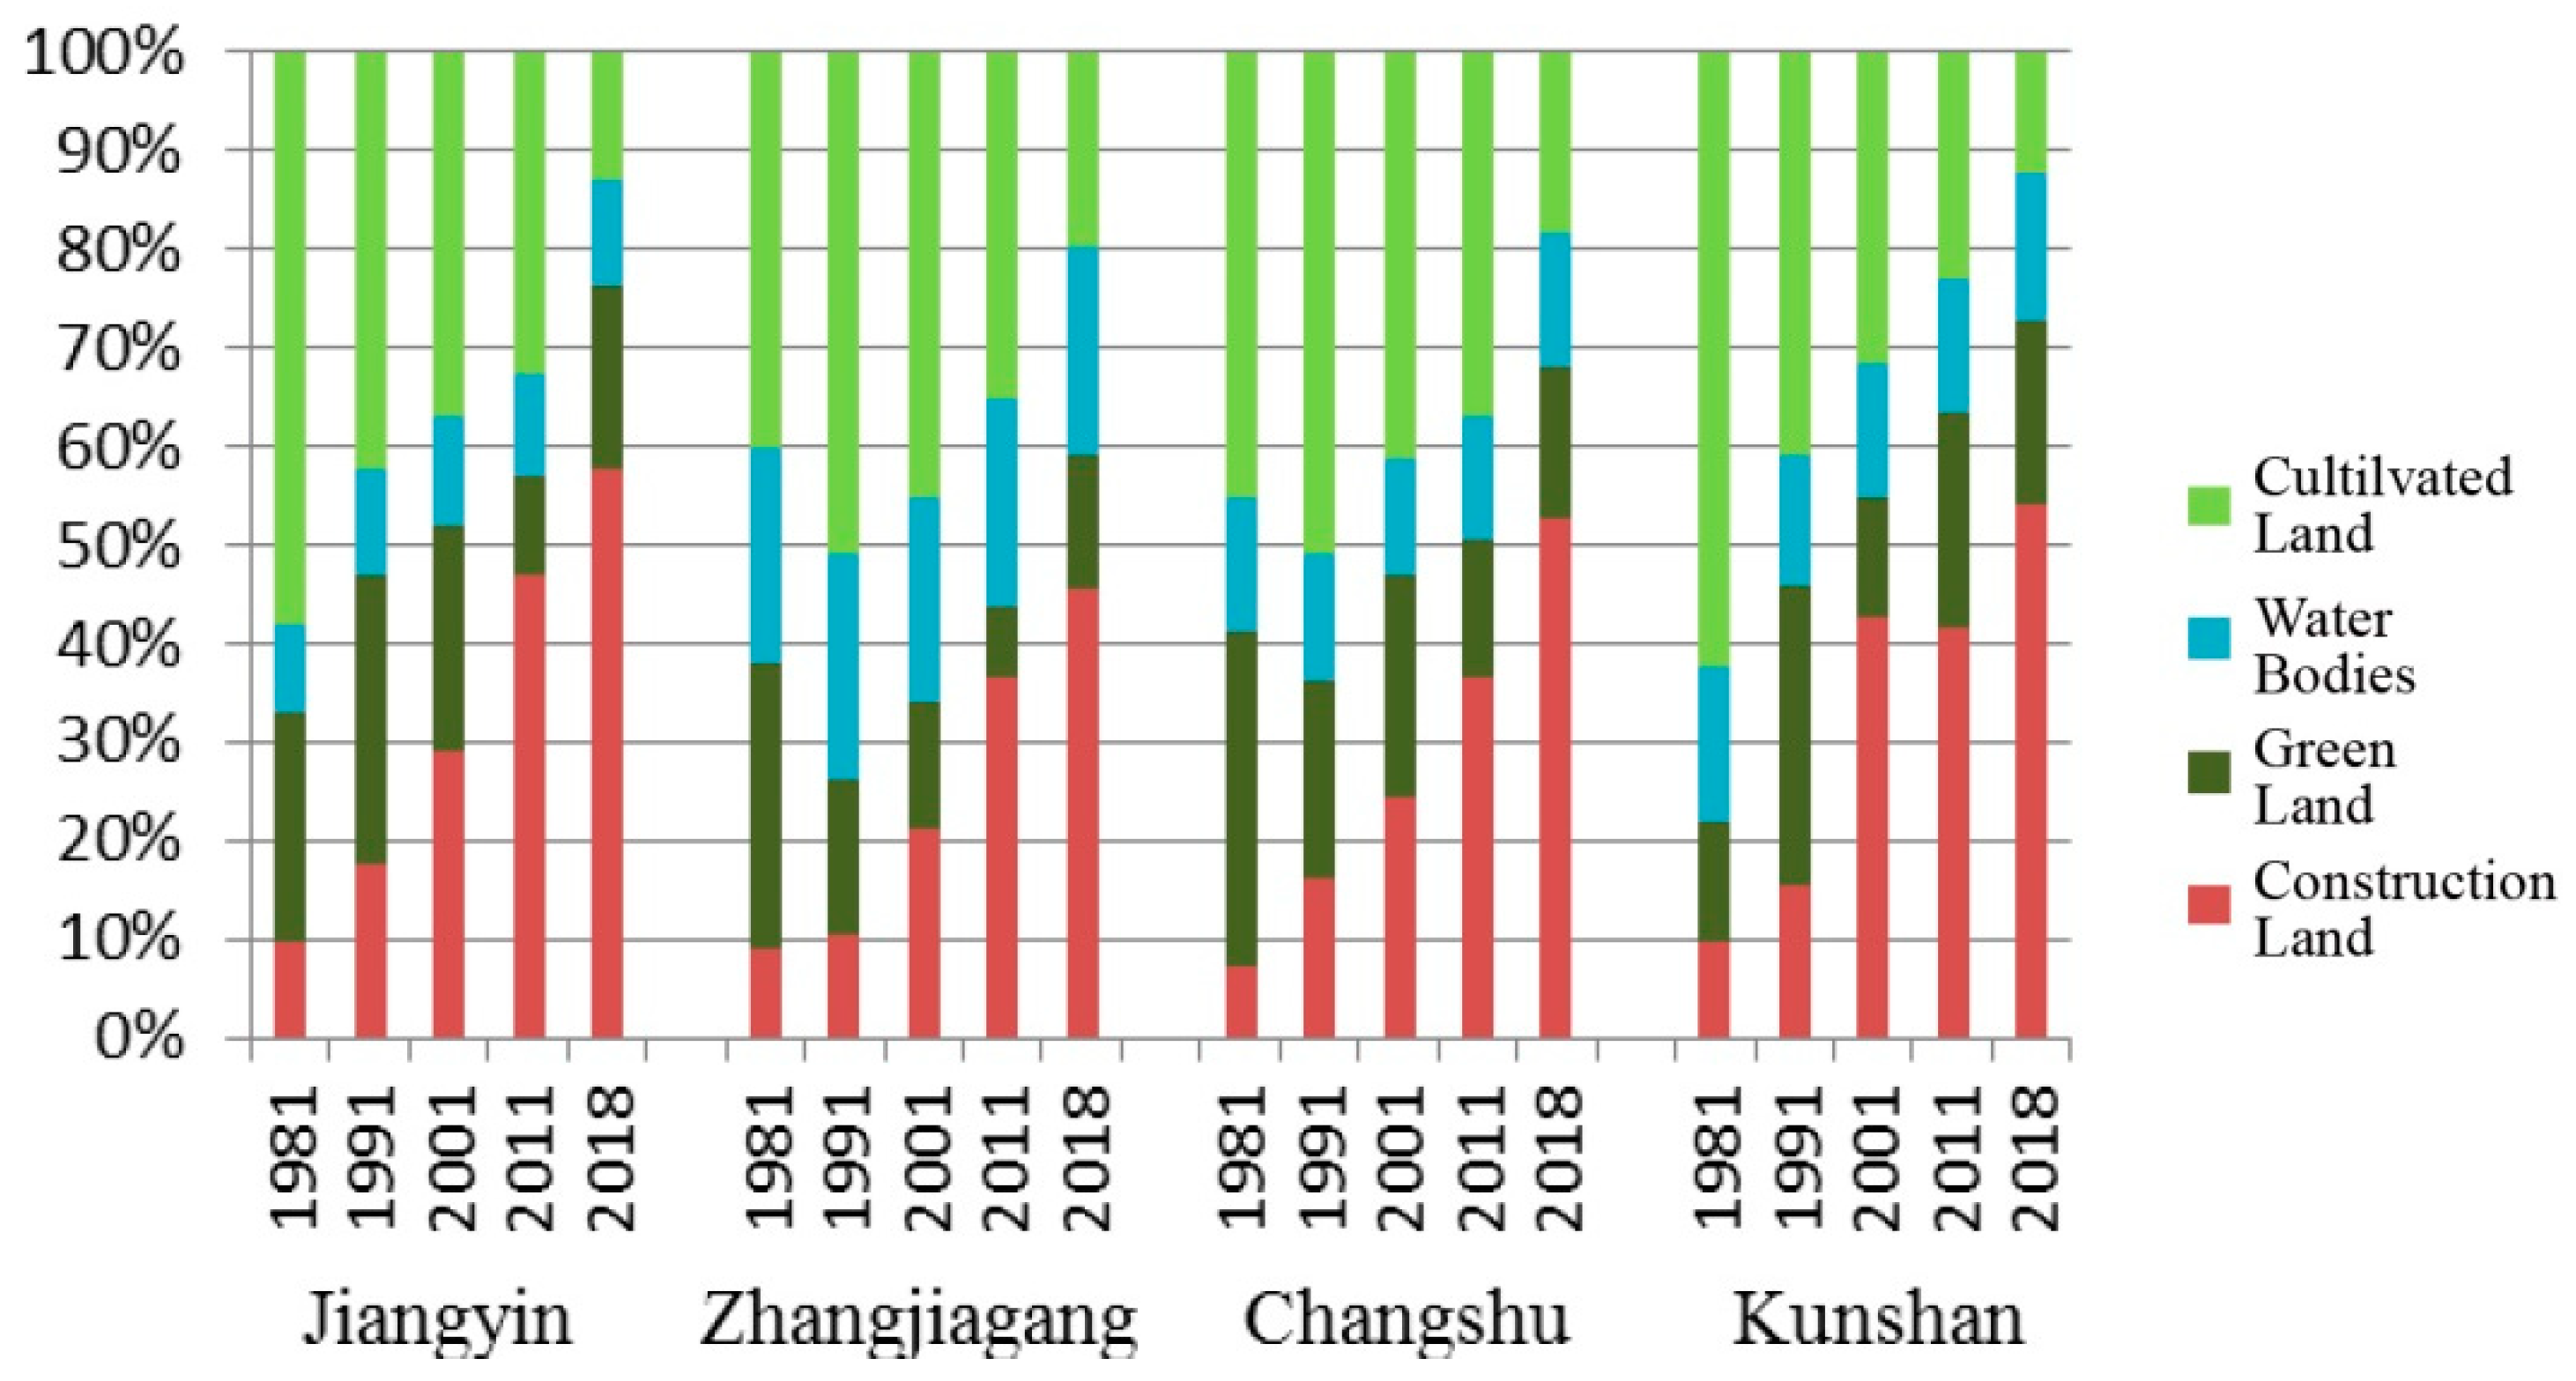
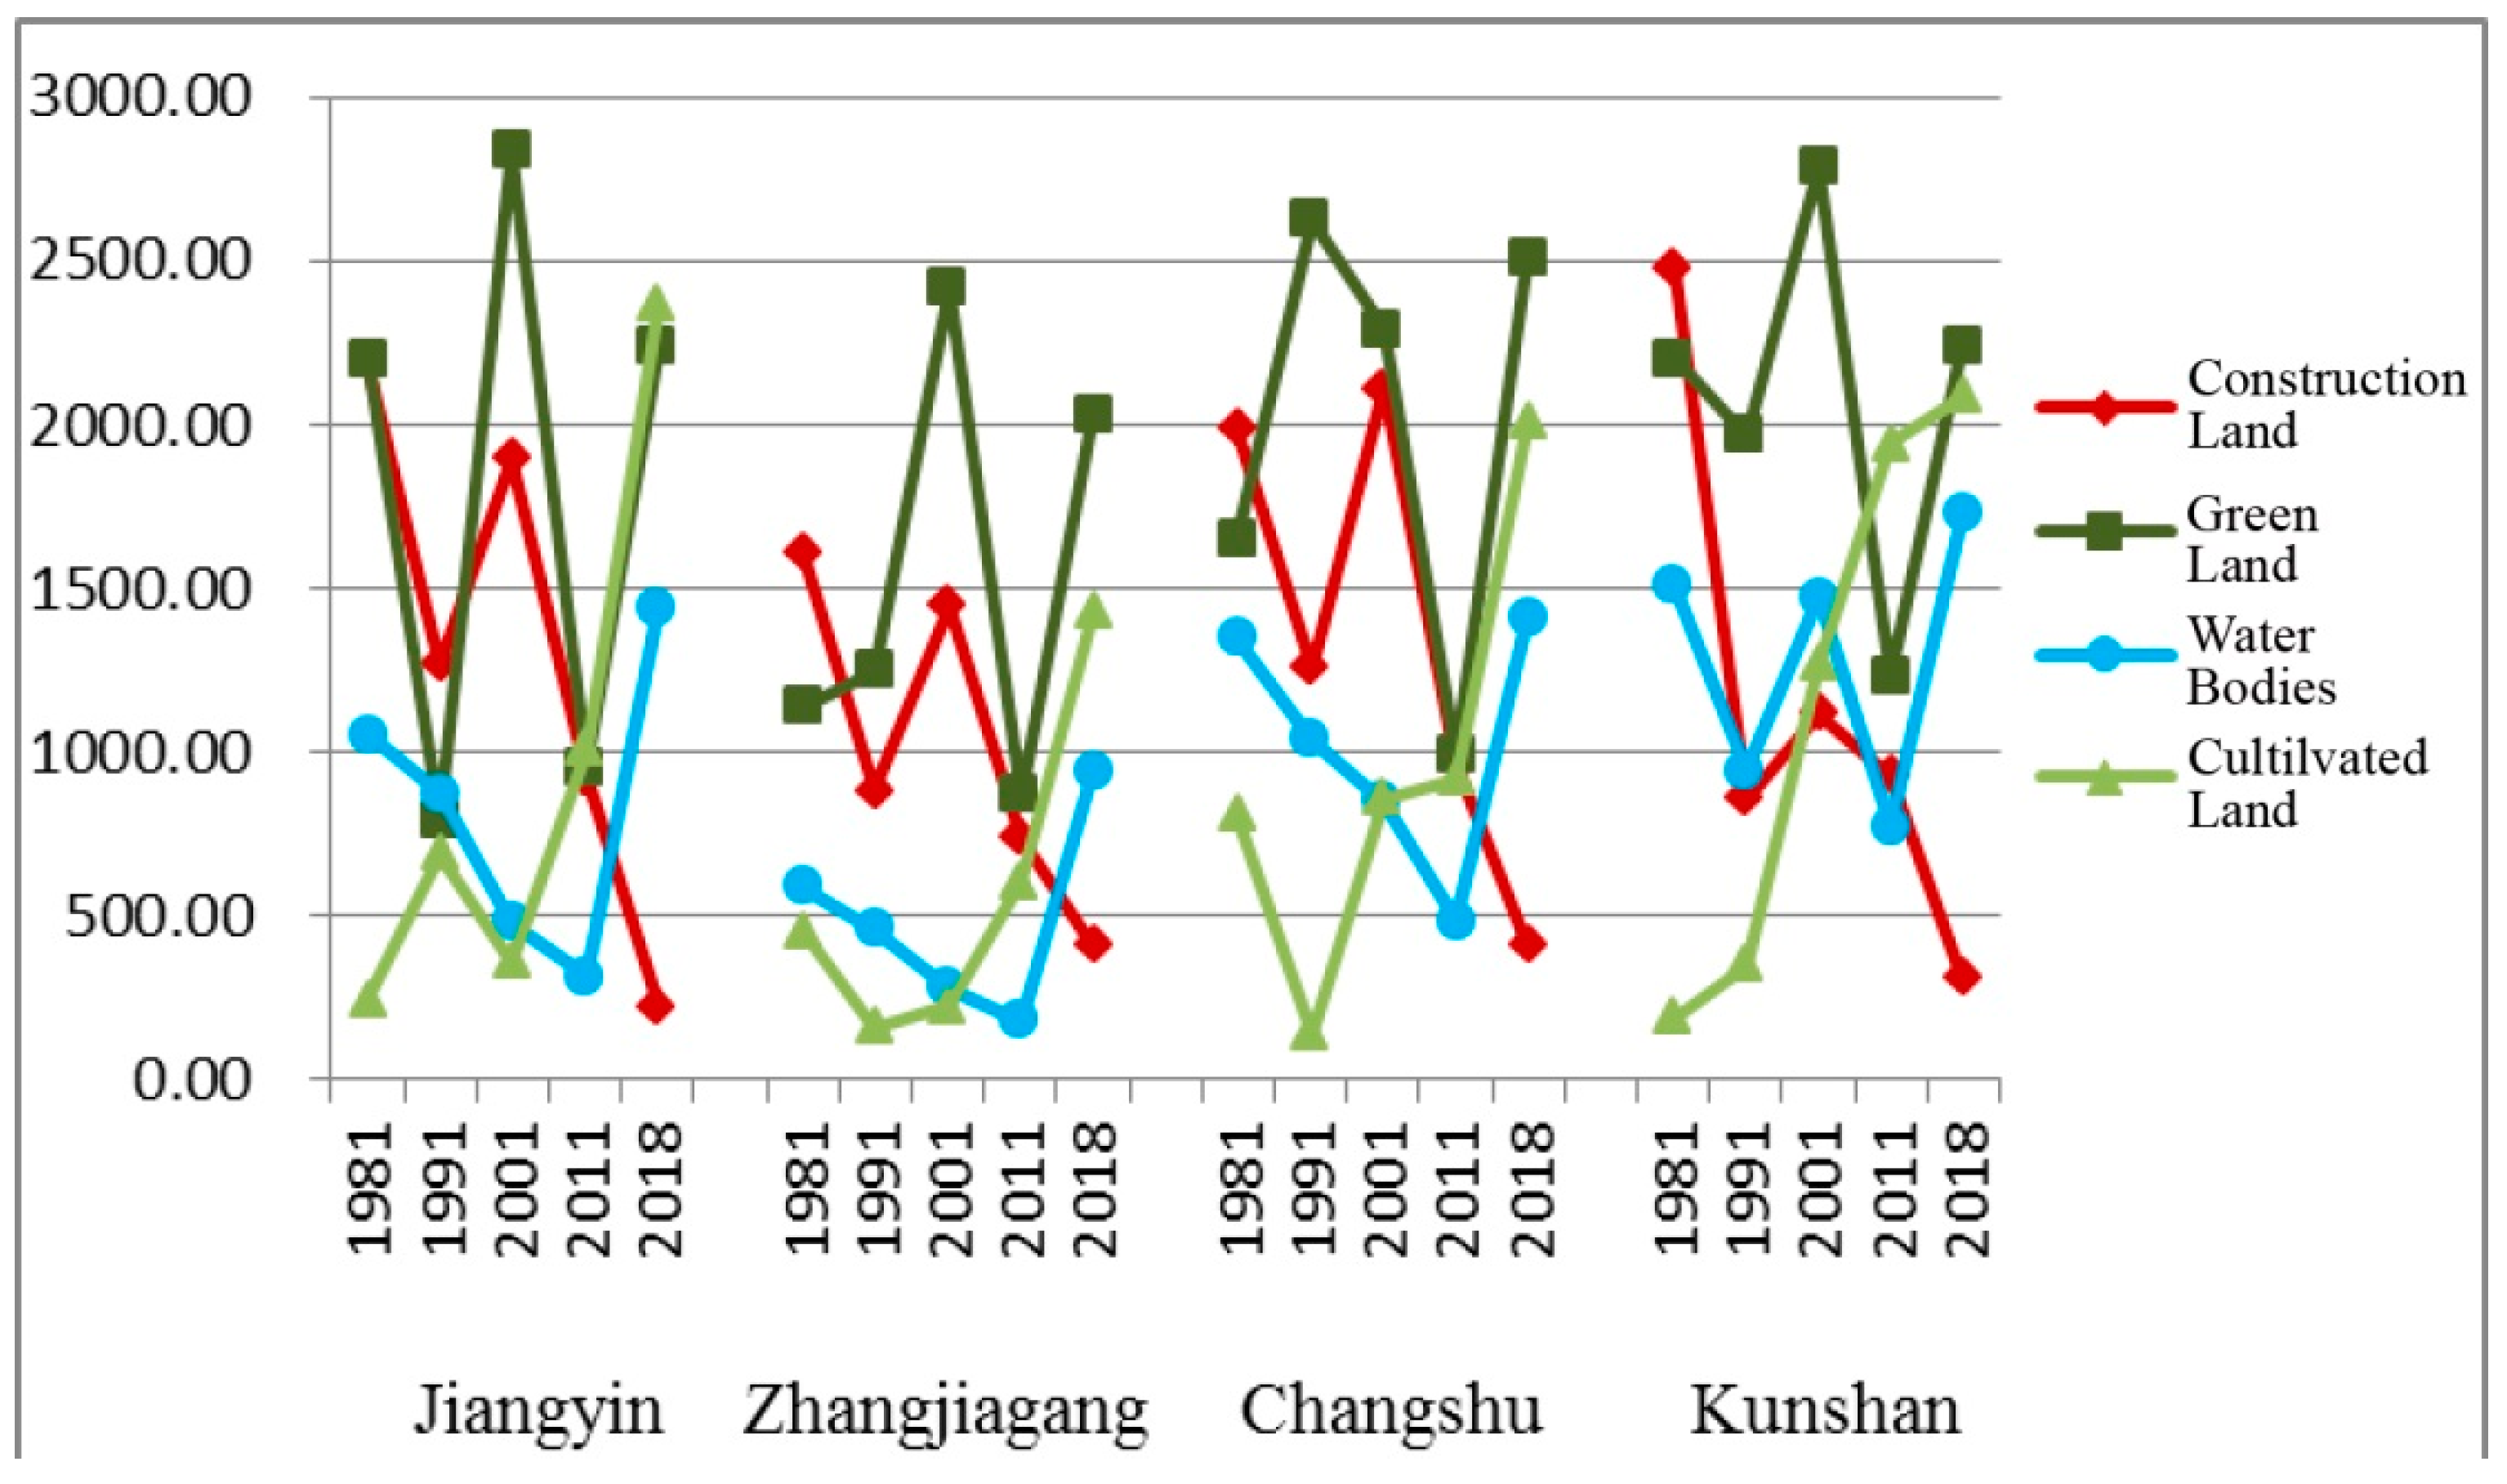
3.1. Land Classification Results
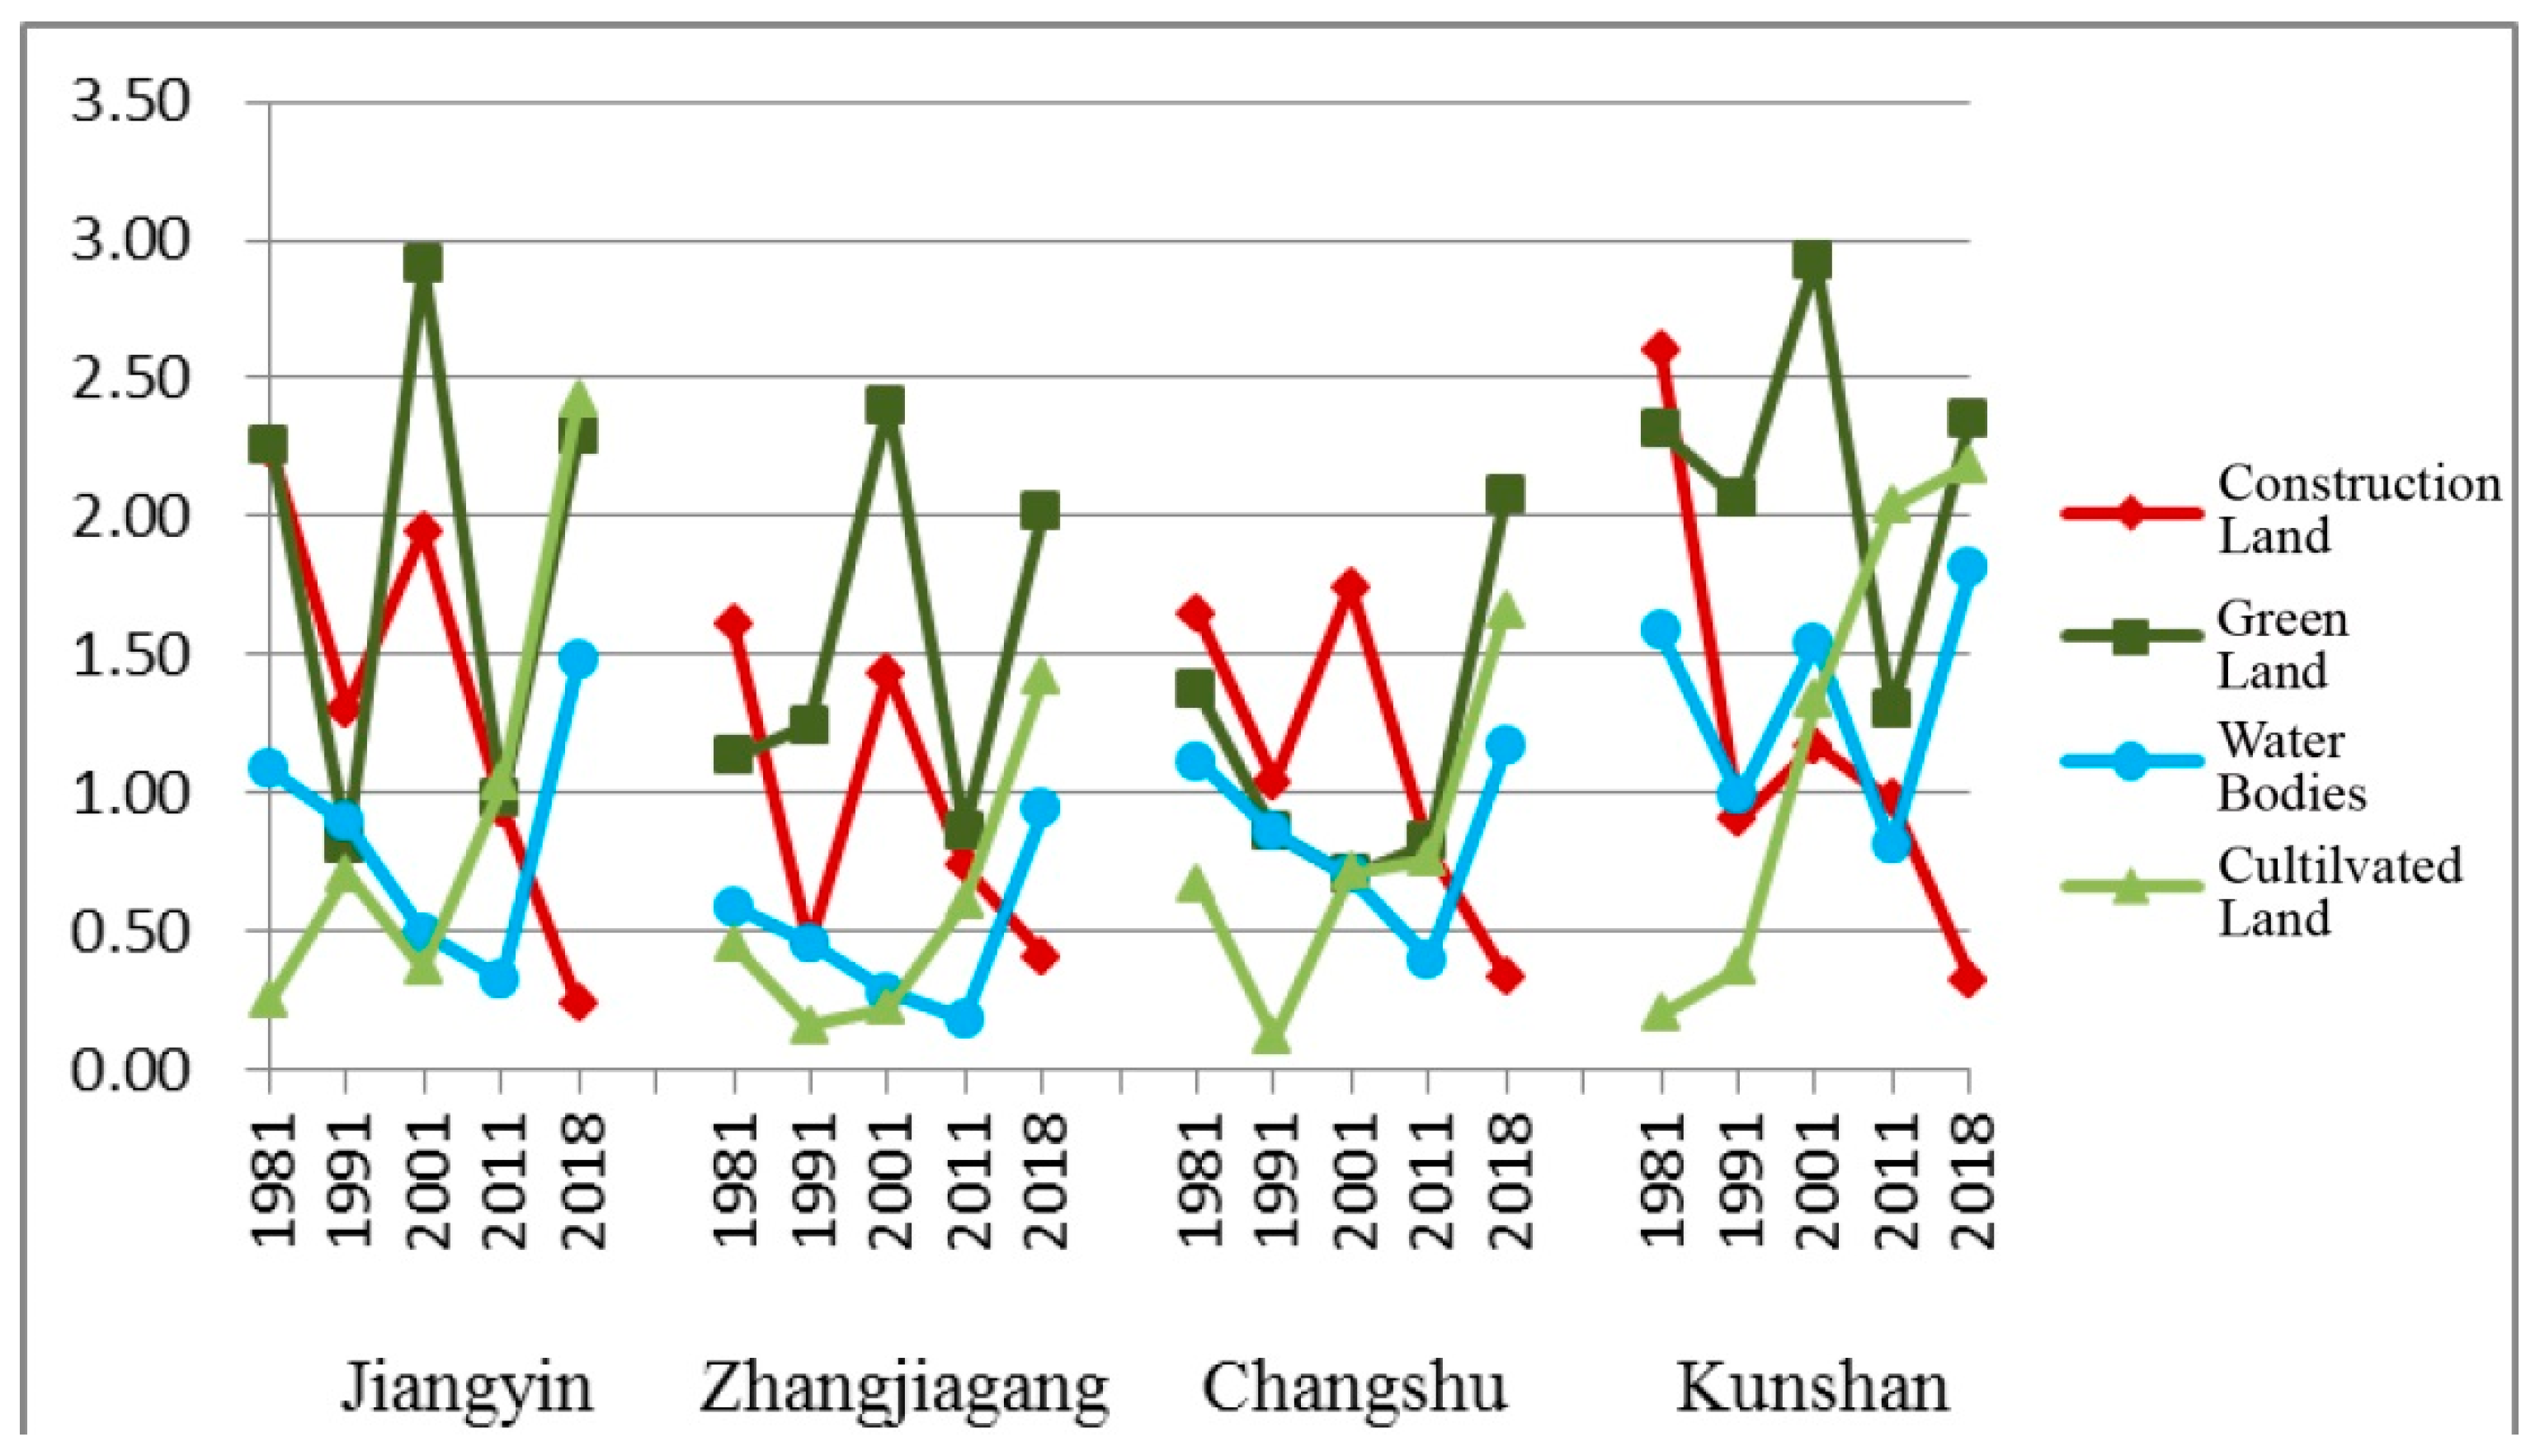
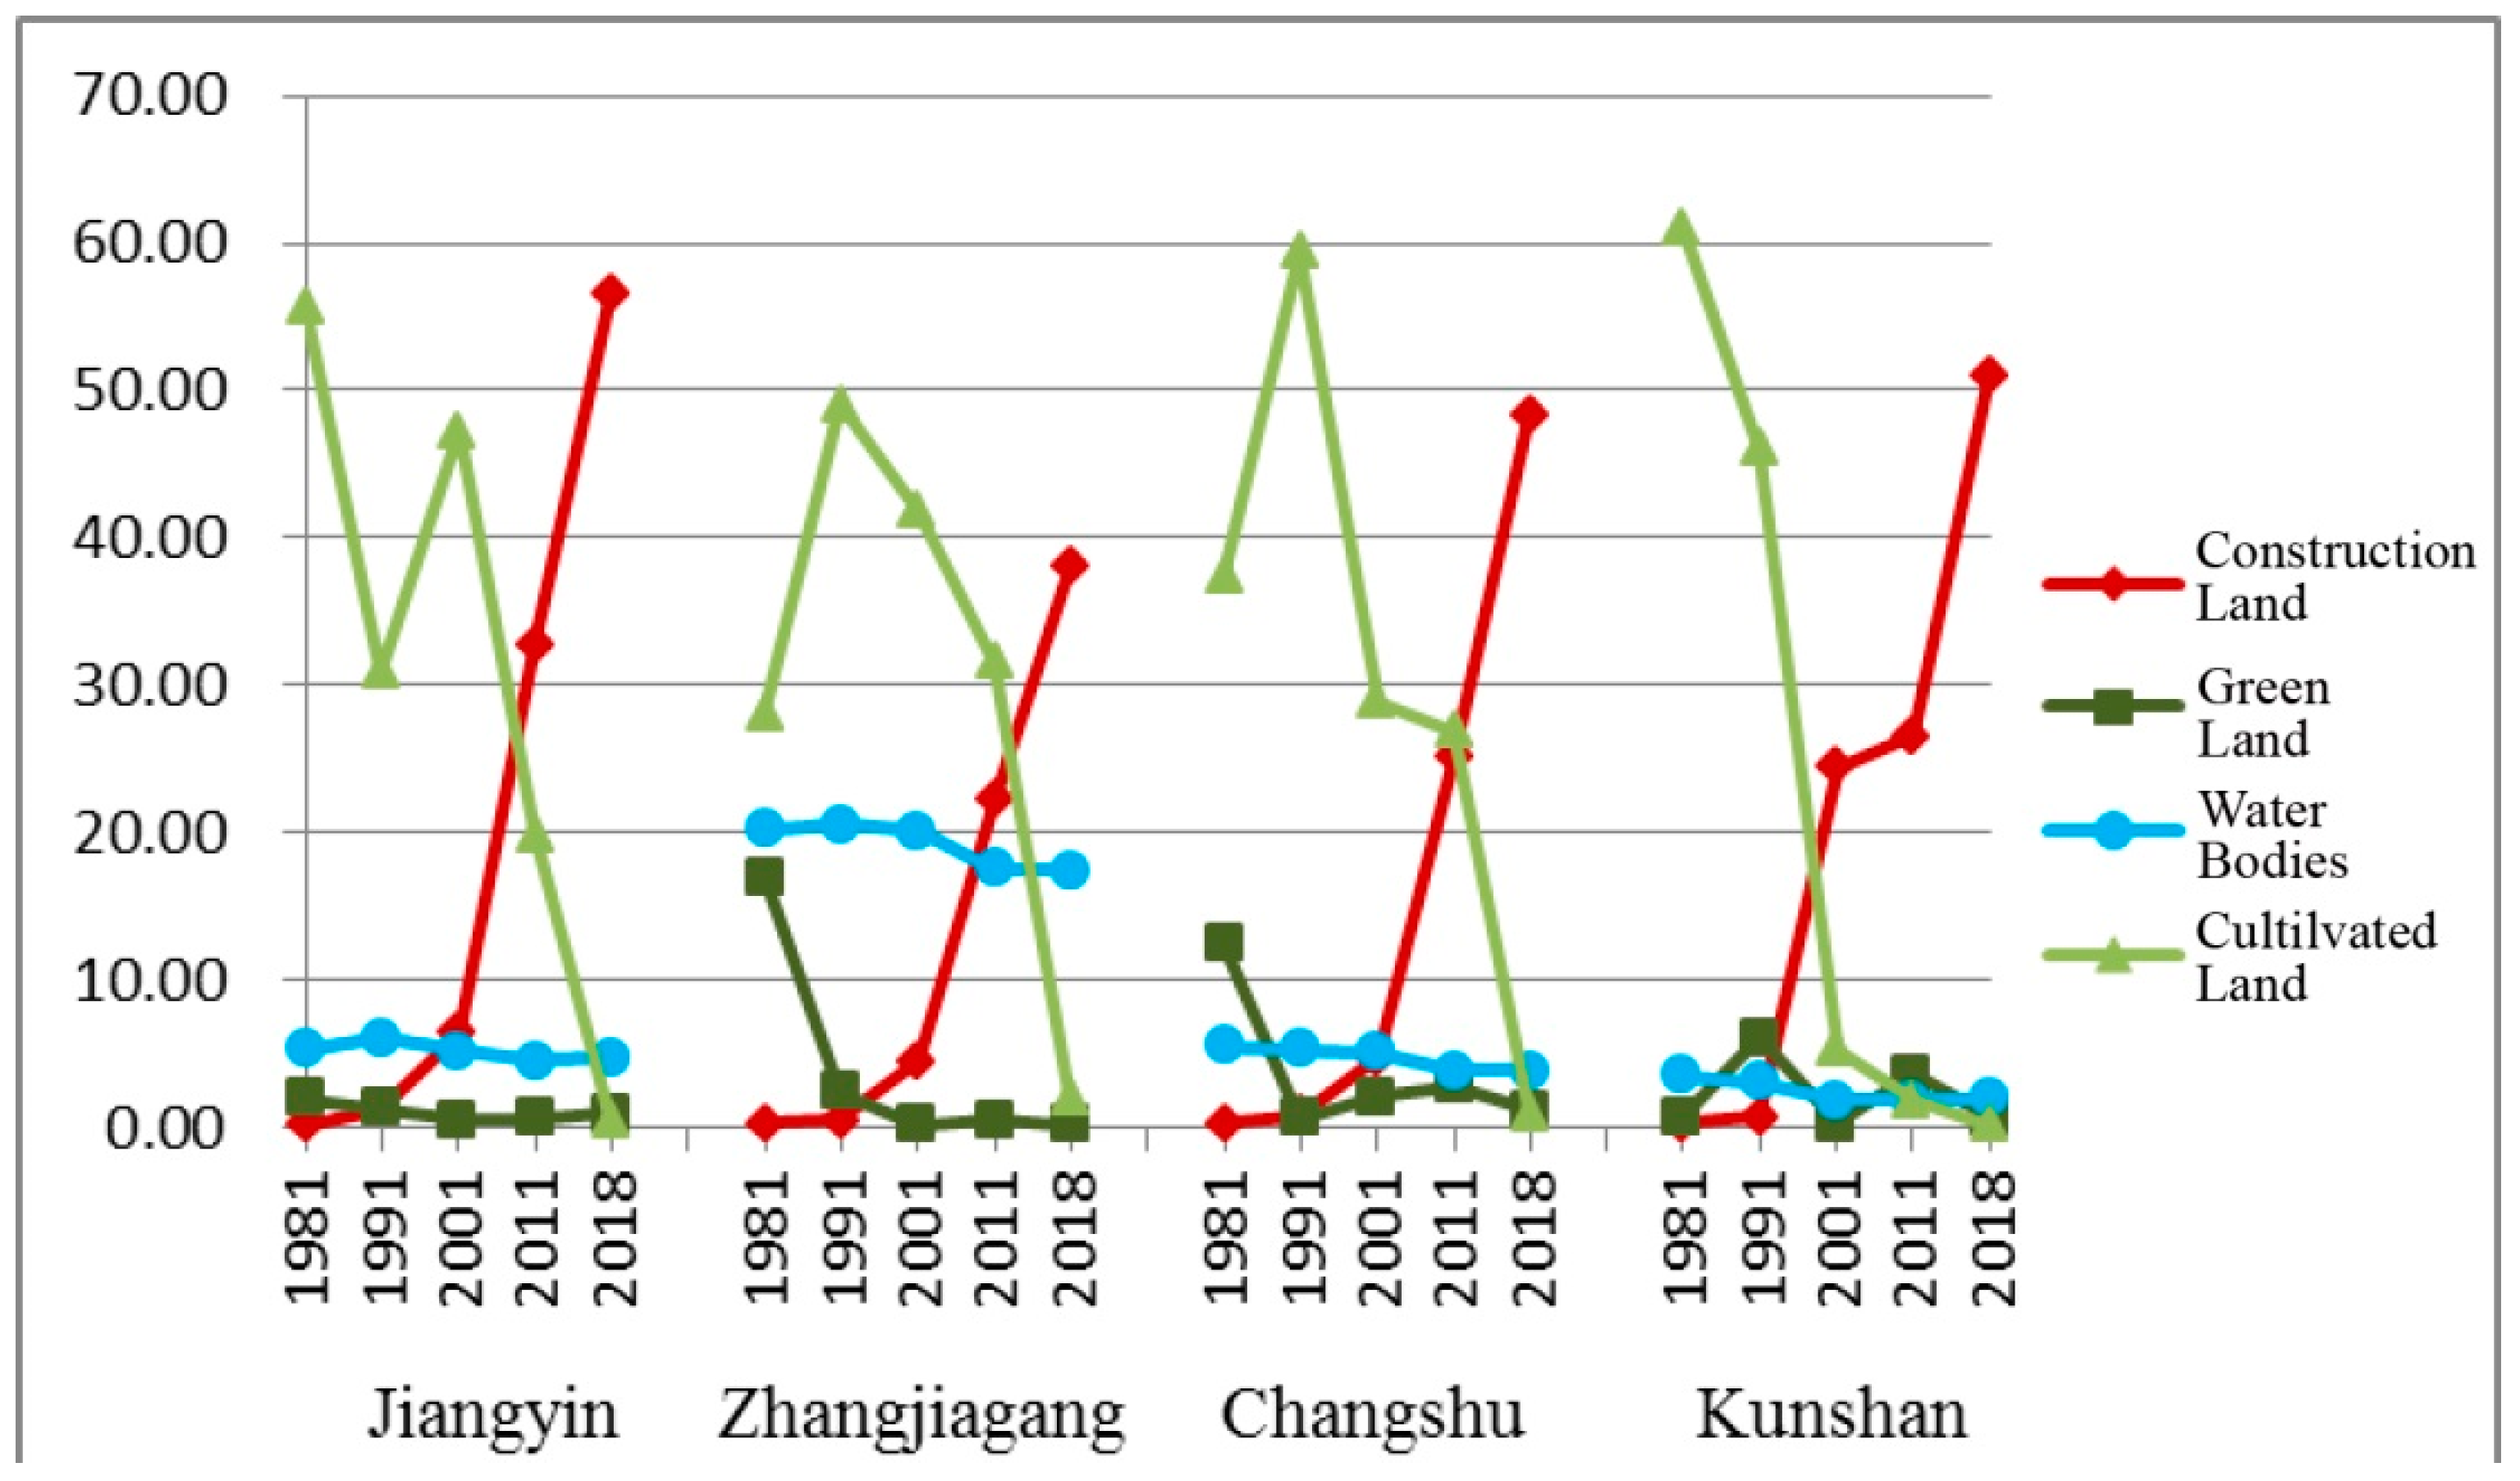
3.2. Patch-Class-Level Landscape Pattern Results
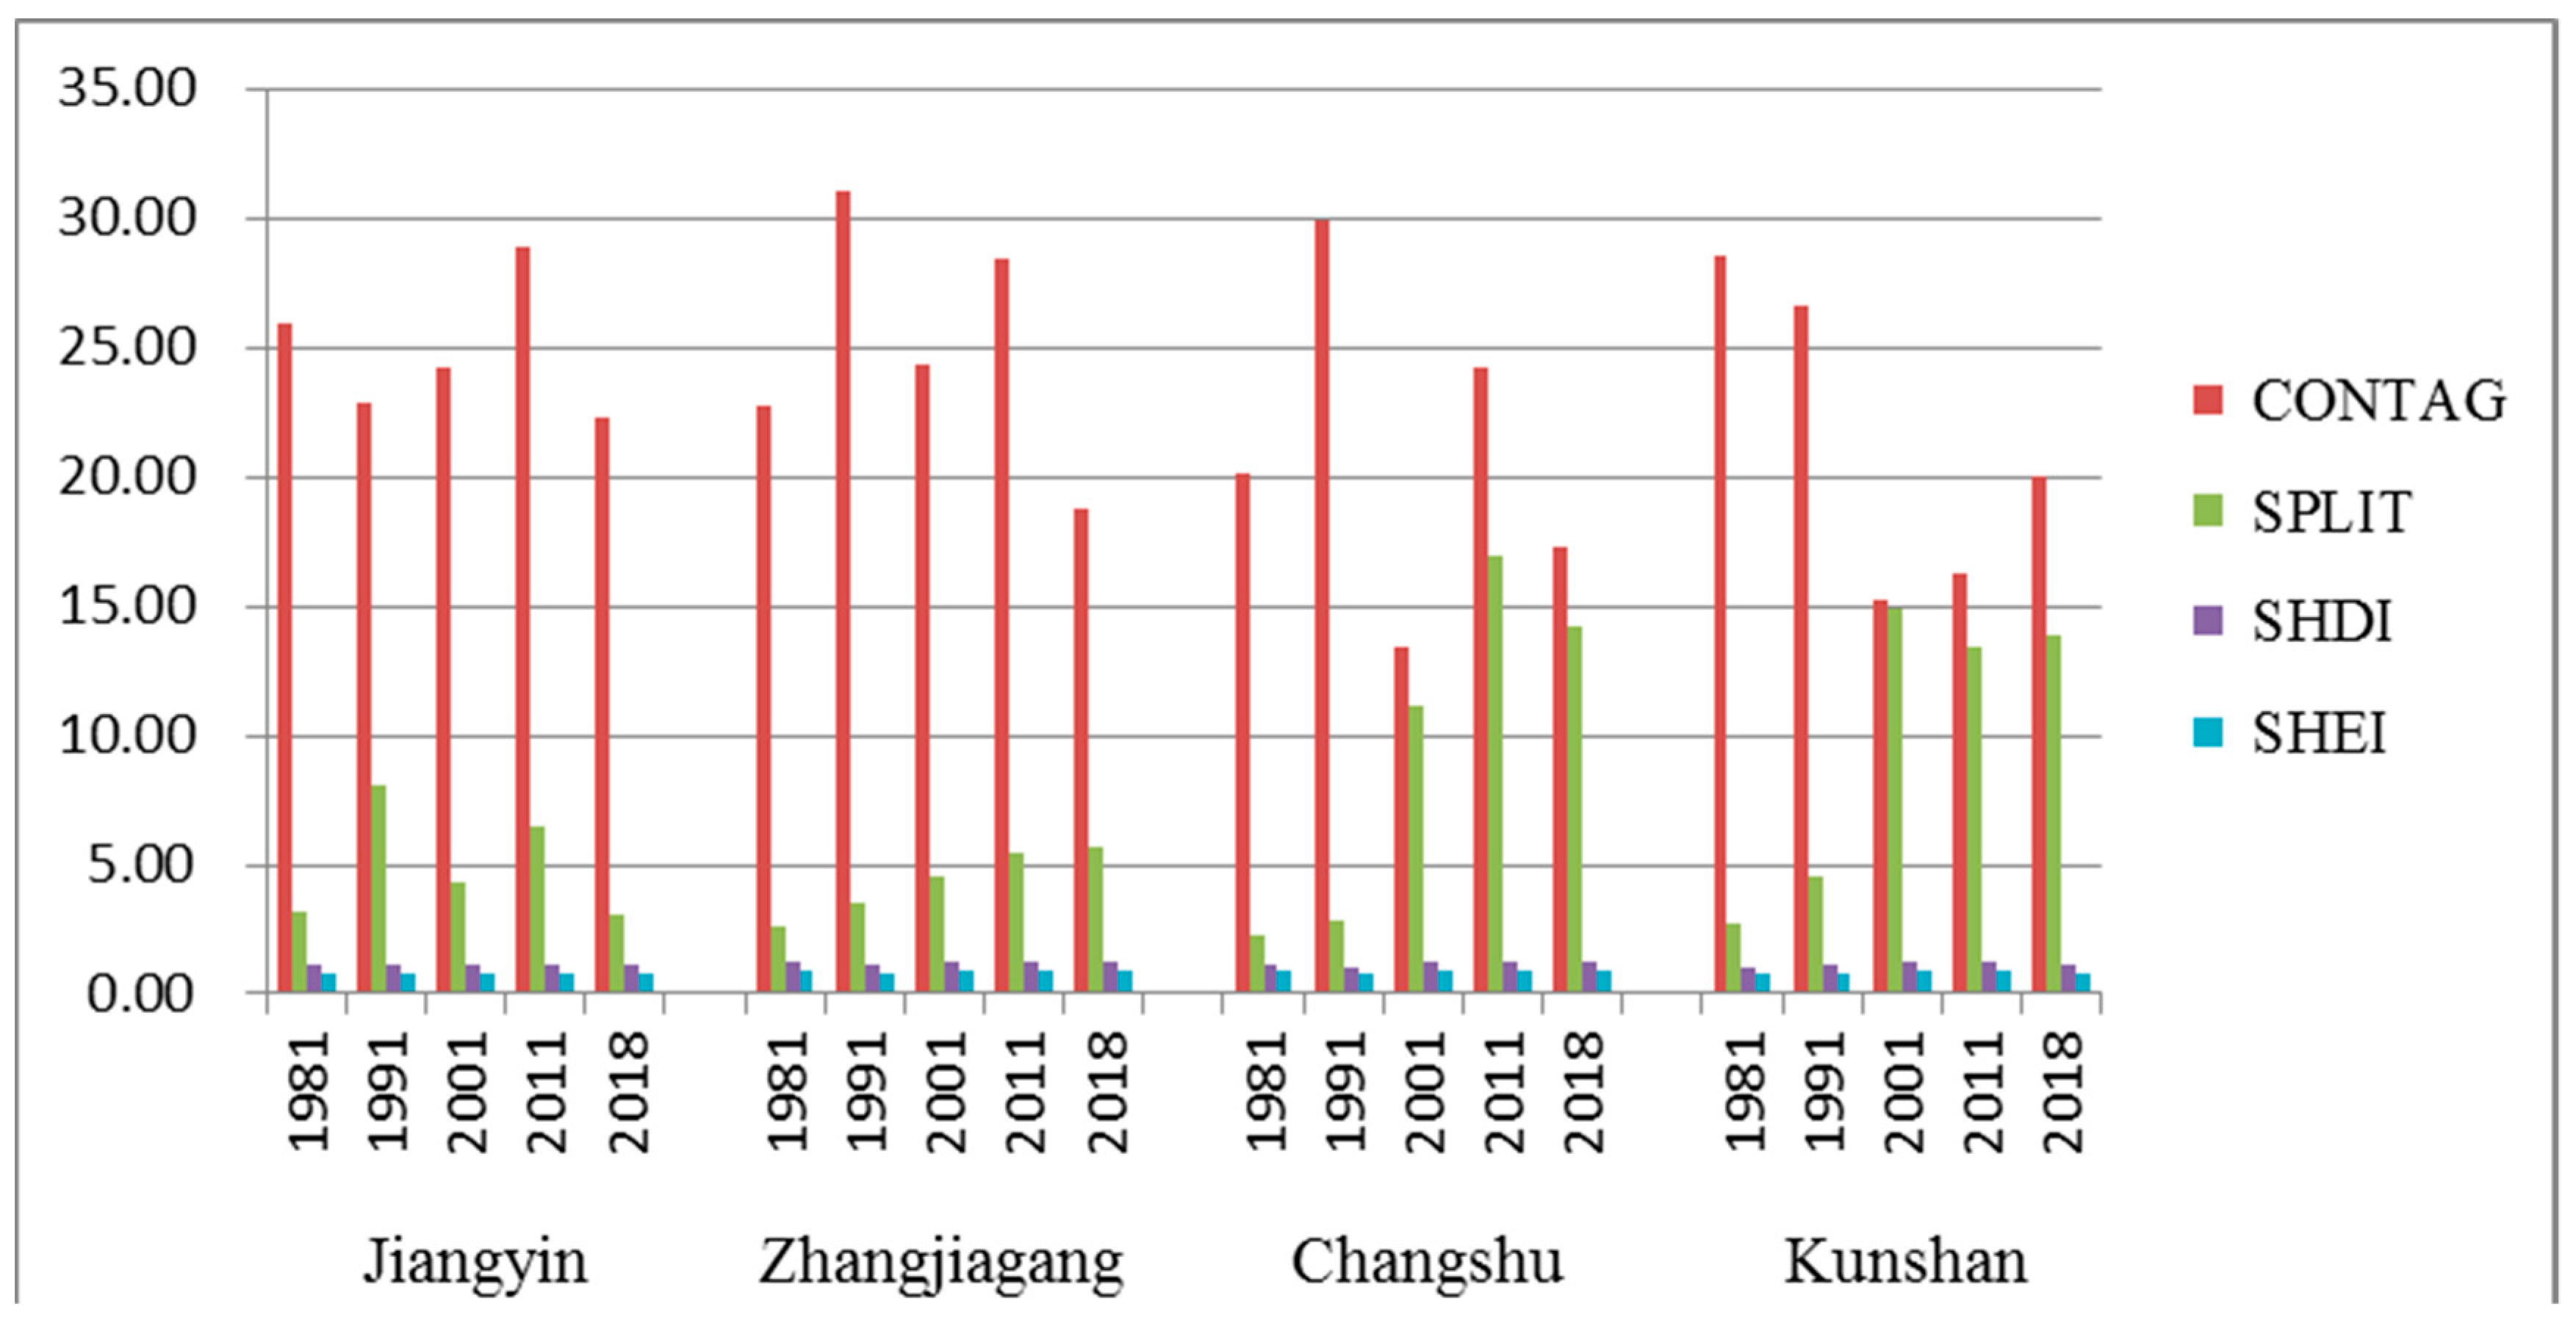
3.3. Landscape-Level Landscape Pattern Results
4. Discussion
- (1)
- At the patch-class level, the landscape pattern evolution characteristics of industrial rural areas in Southern Jiangsu were that construction land had continuously encroached on green and cultivated land in all four study areas, exhibiting trends of expansion, centralization and the continuous consolidation of small patches into large patches during evolution and ultimately replacing cultivated land as the dominant landscape category. The result was in accordance with those in the studies of Yang, Sun et al., Ma et al., Xu et al. and Chuai et al. [31,32,33,34,35]. The reasons might be as follows: (1) Relevant studies showed that under the background of rapid socio-economic development, urban master planning is constantly updated, and relevant policies and regulations constantly promote human beings to expand the scope of urban built-up areas through deforestation, farmland reclamation and civil construction. Therefore, this study inferred that these human activities were likely to be the main reason for the changes of the area with urban landscape patches and the PLAND index [31]; and (2) in recent years, the process of urbanization development had been observed to show a strong aggregation (that is, all kinds of land shrink to the city center), and all kinds of land in the urban area were forced to “squeeze” out of the core area of the city. This phenomenon reflected in the landscape pattern in that the number of urban land patches had been reduced and the complexity increased [32].
- (2)
- At the landscape-class level, the landscape patches were evenly distributed, and the landscape patterns exhibited increased fragmentation and uniformity during evolution. The evolution of landscape patterns in the four study areas was most intense during 1981–2001. Among the four study areas, Kunshan exhibited the most significant landscape pattern evolution characteristics. This result was also in accordance with the results of the studies by Yang, Sun et al., Ma et al., Xu et al. and Chuai et al. [31,32,33,34,35]. The reason for the results might be as follows: (1) The gradual improvement of a traffic network would cause disorderly cutting of the original patch landscape, which seriously affects the circulation of the ecological function of the regional landscape. From the perspective of landscape pattern, it is embodied in the increase of the SPILT index and the decrease of the CONTAG index [33,34]; and (2) for the rapid urbanization in China, the area of urban construction land had increased sharply, and the landscape tends to be homogeneous and fragmented. These might mainly explain the decline of the SHDI index and the SHEI index [35].
- (1)
- Conserve existing cultivated land patches, appropriately expand grassland and forest land patches
- (2)
- Respect the four decades of historical progress, reasonably modify industrial landscapes
- (3)
- Capitalize on the economic and positional advantage, optimize urban–rural landscape spaces
5. Conclusions
- (1)
- At the patch-class level, construction land had continuously encroached on green and cultivated land in all four study areas, exhibiting trends of expansion, centralization and the continuous consolidation of small patches into large patches during evolution and ultimately replacing cultivated land as the dominant landscape category. Concurrently, green and cultivated land patches, which are high-quality landscape resources, were continuously segmented into a large number of small patches, which led to fragmentation during the evolution of green and cultivated land. The effects of human disturbance on water bodies should receive attention, even though they are less severe than those experienced by green and cultivated land. Urban master planning was being constantly updated, and relevant policies and regulations were constantly promoting human beings to expand the scope of urban built-up areas through deforestation, farmland reclamation and civil construction. The processes of urbanization development had been observed to show strong aggregation. And all kinds of lands in the urban area were forced to “squeeze” out of the core area of the city.
- (2)
- At the landscape level, the number of small patches and degree of landscape fragmentation generally increased in all four study areas. The landscape patches were evenly distributed and the landscape patterns exhibited increased fragmentation and uniformity during evolution. The evolution of landscape patterns in the four study areas was most intense during 1981–2001. Among the four study areas, Kunshan exhibited the most significant landscape pattern evolution characteristics. The gradual improvement of traffic network would cause disorderly cutting of the original patch landscape, which seriously affected the circulation of the ecological function of the regional landscape. For rapid urbanization in China, the areas of urban construction land had increased sharply, and the landscape tends to be homogeneous and fragmented.
- (3)
- The direct cause of landscape pattern evolution in the industrial rural areas of Southern Jiangsu was the encroachment and segmentation of green and cultivated land patches by construction land patches, and the dominant factors driving the changes in construction land patches in the industrial rural areas of Southern Jiangsu were the effects of land and population aggregation exerted by the development of township enterprises and rural industries.
- (4)
- This study concluded the landscape pattern and evolution dynamic of industrial rural areas, providing relevant fields with methods to investigate the evolution dynamic of urban–rural industry during urbanization and propose strategies for improving the landscape pattern and promoting the development of the ecological environment and tourism. It would also serve as a reference for other developing countries in Asia for sustainability of urban and rural development during industrialization, which is helpful to achieve sustainability for this region.
Author Contributions
Funding
Acknowledgments
Conflicts of Interest
References
- Rongtian, Z.; Huafu, J.; Xiaolin, Z. Rural Development Types and Rurality in the Yangtze River Delta. J. Nanjing Norm. Univ. 2014, 37, 132–136. [Google Scholar]
- Zhu, J.; Zhan, Y.; Han, C. The Way to Urbanization in Southern Jiangsu: Change and Innovation of Hudai Town; China Social Sciences Press: Beijing, China, 2008. [Google Scholar]
- Zhou, X. Study on the Change of Rural Landscape in Urbanization Process: A Case Study of Southern Jiangsu Province. Ph.D. Thesis, Nanjing Normal University, Nanjing, China, 2006. [Google Scholar]
- Huo, G. Analysis on Planning and Design of Rural Landscape in Sunan Area. Master’s Thesis, Suzhou University, Suzhou, China, 2012. [Google Scholar]
- Zhao, Q.; Guo, X.; Li, G. The Transformation of the Rural Space in Southern Jiangsu under the Dominance of Development Zones: A Case study of Suzhou industrial park. Mod. Urban Res. 2014, 5, 9–14. [Google Scholar]
- Cucari, N.; Wankowicz, E.; De Falco, S.E. Rural tourism and Albergo Diffuso: A case study for sustainable land-use planning. Land Use Policy 2019, 82, 105–119. [Google Scholar] [CrossRef]
- Cattaneo, T.; Giorgi, E.; Ni, M. Landscape, Architecture and Environmental Regeneration: A Research by Design Approach for Inclusive Tourism in a Rural Village in China. Sustainability 2019, 11, 128. [Google Scholar] [CrossRef]
- Balan, M.; Burghelea, C. Rural tourism and its implication in the development of the Fundata Village. Procedia Soc. Behav. Sci. 2015, 188, 276–281. [Google Scholar] [CrossRef]
- Dolejs, M.; Nadvornik, J.; Raska, P.; Riezner, J. Frozen Histories or Narratives of Change? Contextualizing Land-Use Dynamics for Conservation of Historical Rural Landscapes. Environ. Manag. 2019, 63, 352–365. [Google Scholar] [CrossRef] [PubMed]
- Prestia, G.; Scavone, V. Enhancing the Endogenous Potential of Agricultural Landscapes: Strategies and Projects for a Inland Rural Region of Sicily. In Smart and Sustainable Planning for Cities and Regions, Sspcr 2017; Bisello, A., Vettorato, D., Laconte, P., Costa, S., Eds.; Springer: Cham, Switzerland, 2018; pp. 635–648. [Google Scholar]
- Gonzalez Alvarez, D. Rethinking tourism narratives on the cultural landscapes of Asturias (Northern Spain) from the perspective of Landscape Archaeology: Do archaeologists have anything to say? Landsc. Res. 2019, 44, 117–133. [Google Scholar] [CrossRef]
- Gonzalez Diaz, J.A.; Celaya, R.; Fernandez Garcia, F.; Osoro, K.; Rosa Garcia, R. Dynamics of rural landscapes in marginal areas of northern Spain: Past, present, and future. Land Degrad. Dev. 2019, 30, 141–150. [Google Scholar] [CrossRef]
- Qi, W.; Tang, C. Study on the Influencing Factors of Carbon Emission in Industrial Villages: A Case Study of Fenghuang Village, Xiaoshan City, Hangzhou. Archit. Cult. 2018, 42, 174–178. [Google Scholar]
- Li, H.; Wu, J.; Zhang, X.; Li, C. The Distribution Characteristics and Mechanism of the Rural Industrial Land with the “Southern Jiangsu Pattern”—A Case Study of Changshu. Econ. Geogr. 2018, 38, 152–159. [Google Scholar]
- Liu, L.; Tang, X.; Xiong, X.; Du, J.; Wang, J. Ecological sensitivity analysis of rural natural landscape in the south of Jiangsu Province based on GIS. J. Nanjing For. Univ. 2018, 42, 159–164. [Google Scholar]
- Zhao, Y.; Wu, X.; Huang, X. Research on the performance assessment of rural water landscape in South of Jiangsu. J. Nanjing For. Univ. 2018, 42, 174–178. [Google Scholar]
- Dadashpoor, H.; Azizi, P.; Moghadasi, M. Land use change, urbanization, and change in landscape pattern in a metropolitan area. Sci. Total Environ. 2019, 655, 707–719. [Google Scholar] [CrossRef] [PubMed]
- Guo, L.; Di, L.; Tian, Q. Detecting spatio-temporal changes of arable land and construction land in the Beijing-Tianjin corridor during 2000–2015. J. Geogr. Sci. 2019, 29, 702–718. [Google Scholar] [CrossRef]
- Jiang, G.; Ma, W.; Zhou, D.; Zhao, Q.; Zhang, R. Agglomeration or dispersion? Industrial land-use pattern and its impacts in rural areas from China’s township and village enterprises perspective. J. Clean. Prod. 2017, 159, 207–219. [Google Scholar] [CrossRef]
- Van der Sluis, T.; Pedroli, B.; Frederiksen, P.; Kristensen, S.B.; Busck, A.G.; Pavlis, V.; Cosor, G.L. The impact of European landscape transitions on the provision of landscape services: An explorative study using six cases of rural land change. Landsc. Ecol. 2019, 34, 307–323. [Google Scholar] [CrossRef]
- Stokes, E.C.; Seto, K.C. Characterizing and measuring urban landscapes for sustainability. Environ. Res. Lett. 2019, 14. [Google Scholar] [CrossRef]
- Xi, Y.; Nguyen Xuan, T.; Li, C. Spatio-Temporal Variation Analysis of Landscape Pattern Response to Land Use Change from 1985 to 2015 in Xuzhou City, China. Sustainability 2018, 10, 4287. [Google Scholar] [CrossRef]
- Wang, S.; Yang, K.; Yuan, D.; Yu, K.; Su, Y. Temporal-spatial changes about the landscape pattern of water system and their relationship with food and energy in a mega city in China. Ecol. Model. 2019, 401, 75–84. [Google Scholar] [CrossRef]
- Ma, L.; Bo, J.; Li, X.; Fang, F.; Cheng, W. Identifying key landscape pattern indexes influencing the ecological security of inland river basin: The middle and lower reaches of Shule River Basin as an example. Sci. Total Environ. 2019, 674, 424–438. [Google Scholar] [CrossRef]
- Li, Y.; Xue, C.; Shao, H.; Shi, G.; Jiang, N. Study of the Spatiotemporal Variation Characteristics of Forest Landscape Patterns in Shanghai from 2004 to 2014 Based on Multisource Remote Sensing Data. Sustainability 2018, 10, 4397. [Google Scholar] [CrossRef]
- Jiangsu Statistical Bureau. Statistical Yearbook of Jiangsu 1991; China Statistical Press: Beijing, China, 1991.
- Jiangsu Statistical Bureau. Statistical Yearbook of Jiangsu 2002; China Statistical Press: Beijing, China, 2002.
- Jiangsu Statistical Bureau. Statistical Yearbook of Jiangsu 2012; China Statistical Press: Beijing, China, 2012.
- Jiangsu Statistical Bureau. Statistical Yearbook of Jiangsu 2018; China Statistical Press: Beijing, China, 2018.
- O’neill, R.V.; Krummel, J.R.; Gardner, R.E.; Sugihara, G.; Jackson, B.; DeAngelis, D.L.; Milne, B.T.; Turner, M.G.; Zygmunt, B.; Christensen, S.W.; et al. Indices of Landscape Pattern. Landsc. Ecol. 1988, 1, 153–162. [Google Scholar] [CrossRef]
- Yang, W. Spatiotemporal change and driving forces of urban landscape in Beijing. Acta Ecol. Sin. 2015, 35, 4357–4366. [Google Scholar]
- Sun, K.; Yang, Y.; Zhao, P.; Zhang, Z. Spatial Temporal Evolution of Landscape Pattern in Xi’an Based on 3S Technology. J. Northwest For. Univ. 2015, 30, 180–185. [Google Scholar]
- Ma, S.; Zhang, Y.; Sun, C. Optimization and Application of Integrated Land Use and Transportation Model in Small- and Medium-Sized Cities in China. Sustainability 2019, 11, 2555. [Google Scholar] [CrossRef]
- Xu, L.; Chen, S.S.; Xu, Y.; Li, G.; Su, W. Impacts of Land-Use Change on Habitat Quality during 1985–2015 in the Taihu Lake Basin. Sustainability 2019, 11, 3513. [Google Scholar] [CrossRef]
- Chuai, X.; Wen, J.; Zhuang, D.; Guo, X.; Yuan, Y.; Lu, Y.; Zhang, M.; Li, J. Intersection of Physical and Anthropogenic Effects on Land-Use/Land-Cover Changes in Coastal China of Jiangsu Province. Sustainability 2019, 11, 2370. [Google Scholar] [CrossRef]
- Hu, M. Development Process and Enlightenment of Township Enterprises in China since Reform and Opening: The Case of Township Enterprises in Jiangsu from 1978 to 1992. Lit. Chin. Communist Party 2008, 4, 24–29. [Google Scholar]
- Yu, G.; Li, Y. Present Main Problems of Township Enterprises: Investigation and Research of Township Enterprises in Jiangsu Province from 1978–1992. Issues Agric. Econ. 1989, 10, 24–29. [Google Scholar]
- Sun, X. Research on the Development Model of Urbanization of Village Area in Suzhou. Master’s Thesis, Suzhou University of Science and Technology, Suzhou, China, 2017. [Google Scholar]
- Zhong, Z.; Chen, Z.; Xu, Y.; Ren, C.; Yang, G.; Han, X.; Ren, G.; Feng, Y. Relationship between Soil Organic Carbon Stocks and Clay Content under Different Climatic Conditions in Central China. Forests 2018, 9, 598. [Google Scholar] [CrossRef]
- Dax, T.; Zhang, D.; Chen, Y. Agritourism Initiatives in the Context of Continuous Out-Migration: Comparative Perspectives for the Alps and Chinese Mountain Regions. Sustainability 2019, 11, 4418. [Google Scholar] [CrossRef]


| Prefectural-Level | County-Level | Year | Population/Million | GDP/Billion | Area/km² |
|---|---|---|---|---|---|
| Wuxi | Jiangyin | 1990 | 1.10 | 3.67 | 987.53 |
| 2001 | 1.15 | 36.50 | |||
| 2011 | 1.21 | 233.59 | |||
| 2017 | 1.25 | 348.83 | |||
| Suzhou | Zhangjiagang | 1990 | 0.83 | 2.78 | 999.00 |
| 2001 | 0.85 | 30.68 | |||
| 2011 | 0.90 | 186.03 | |||
| 2017 | 0.92 | 260.61 | |||
| Changshu | 1990 | 1.03 | 3.63 | 1264.00 | |
| 2001 | 1.04 | 30.30 | |||
| 2011 | 1.06 | 171.05 | |||
| 2017 | 1.07 | 227.96 | |||
| Kunshan | 1990 | 0.56 | 2.01 | 927.68 | |
| 2001 | 0.60 | 23.08 | |||
| 2011 | 0.72 | 243.23 | |||
| 2017 | 0.86 | 352.03 |
| Name | Calculation Formula | Notes |
|---|---|---|
| Proportion of landscape types (PLAND) [30] | PLAND = = (100) | represents the area of patches numbered ij, and A represents the total area of all patches. |
| Number of patches (NP) [30] | NP = | represents the total number of patches contained in type I of the entire landscape. |
| Patch density (PD) [30] | PD = | A represents the total area of all patches M represents the total number of landscape element types at a spatial resolution within the scope of the study |
| Largest patch index (LPI) [30] | LPI = (100) | represents the area of patches numbered ij, and A represents the total area of all patches. |
| Contagion index (CONTAG) [30] | CONTAG = (100) | represents the percentage of area occupied by type I; represents the number of IK adjacent to the plaque type. M represents the total number of patch types in the landscape |
| Splitting Index (SPLIT) [30] | = | represents the number of patches. represents the total area of all patches. |
| Shannon’s diversity index (SHDI) [30] | SHDI = − | represents the probability of patch type K appearing in landscape. m represents the total number of patch types in the landscape. |
| Shannon’s evenness index (SHEI) [30] | SHEI = = | represents the probability of patch type K appearing in landscape. m represents the total number of patch types in the landscape. |
| City | Category | Year | PLAND | NP | PD | LPI |
|---|---|---|---|---|---|---|
| Jiangyin | Construction Land | 1981 | 9.59 | 2186.00 | 2.24 | 0.20 |
| 1991 | 17.56 | 1269.00 | 1.30 | 1.23 | ||
| 2001 | 28.90 | 1897.00 | 1.95 | 6.42 | ||
| 2011 | 46.76 | 923.00 | 0.95 | 32.83 | ||
| 2018 | 57.61 | 228.00 | 0.23 | 56.50 | ||
| Green Land | 1981 | 23.27 | 2201.00 | 2.26 | 1.97 | |
| 1991 | 29.23 | 797.00 | 0.82 | 1.23 | ||
| 2001 | 23.04 | 2836.00 | 2.91 | 0.44 | ||
| 2011 | 10.11 | 956.00 | 0.98 | 0.64 | ||
| 2018 | 18.71 | 2234.00 | 2.29 | 0.95 | ||
| Water Bodies | 1981 | 9.18 | 1056.00 | 1.08 | 5.31 | |
| 1991 | 10.75 | 873.00 | 0.90 | 6.09 | ||
| 2001 | 10.97 | 480.00 | 0.49 | 5.20 | ||
| 2011 | 10.60 | 315.00 | 0.32 | 4.45 | ||
| 2018 | 10.71 | 1441.00 | 1.48 | 4.71 | ||
| Cultivated Land | 1981 | 57.96 | 245.00 | 0.25 | 55.75 | |
| 1991 | 42.46 | 690.00 | 0.71 | 30.91 | ||
| 2001 | 37.09 | 359.00 | 0.37 | 47.25 | ||
| 2011 | 32.53 | 1010.00 | 1.04 | 19.91 | ||
| 2018 | 12.98 | 2365.00 | 2.42 | 0.52 |
| City | Category | Year | PLAND | NP | PD | LPI |
|---|---|---|---|---|---|---|
| Zhangjiagang | Construction Land | 1981 | 8.86 | 1615.00 | 1.61 | 0.31 |
| 1991 | 10.33 | 884.00 | 0.45 | 0.48 | ||
| 2001 | 21.24 | 1446.00 | 1.44 | 4.54 | ||
| 2011 | 36.69 | 739.00 | 0.73 | 22.18 | ||
| 2018 | 45.40 | 411.00 | 0.41 | 38.06 | ||
| Green Land | 1981 | 29.08 | 1140.00 | 1.13 | 16.94 | |
| 1991 | 15.98 | 1250.00 | 1.24 | 2.34 | ||
| 2001 | 12.71 | 2414.00 | 2.40 | 0.11 | ||
| 2011 | 6.98 | 869.00 | 0.86 | 0.54 | ||
| 2018 | 13.68 | 2033.00 | 2.02 | 0.17 | ||
| Water Bodies | 1981 | 21.80 | 592.00 | 0.59 | 20.16 | |
| 1991 | 22.69 | 459.00 | 0.46 | 20.55 | ||
| 2001 | 21.03 | 281.00 | 0.28 | 20.09 | ||
| 2011 | 21.22 | 182.00 | 0.18 | 17.53 | ||
| 2018 | 21.09 | 943.00 | 0.94 | 17.40 | ||
| Cultivated Land | 1981 | 40.25 | 456.00 | 0.45 | 28.14 | |
| 1991 | 51.01 | 161.00 | 0.16 | 49.08 | ||
| 2001 | 45.02 | 226.00 | 0.22 | 41.77 | ||
| 2011 | 35.11 | 608.00 | 0.60 | 31.55 | ||
| 2018 | 19.83 | 1430.00 | 1.42 | 1.92 |
| City | Category | Year | PLAND | NP | PD | LPI |
|---|---|---|---|---|---|---|
| Changshu | Construction Land | 1981 | 7.15 | 1987.00 | 1.64 | 0.28 |
| 1991 | 16.11 | 1258.00 | 1.04 | 0.83 | ||
| 2001 | 24.26 | 2110.00 | 1.74 | 4.72 | ||
| 2011 | 36.69 | 964.00 | 0.80 | 25.08 | ||
| 2018 | 52.70 | 412.00 | 0.34 | 48.41 | ||
| Green Land | 1981 | 34.12 | 1655.00 | 1.37 | 12.42 | |
| 1991 | 19.98 | 2627.00 | 0.86 | 0.64 | ||
| 2001 | 22.79 | 2293.00 | 0.70 | 2.07 | ||
| 2011 | 13.68 | 996.00 | 0.82 | 2.83 | ||
| 2018 | 15.29 | 2510.00 | 2.07 | 1.13 | ||
| Water Bodies | 1981 | 13.36 | 1349.00 | 1.11 | 5.52 | |
| 1991 | 12.88 | 1038.00 | 0.86 | 5.30 | ||
| 2001 | 11.61 | 850.00 | 0.70 | 5.02 | ||
| 2011 | 12.79 | 484.00 | 0.40 | 3.88 | ||
| 2018 | 13.62 | 1414.00 | 1.17 | 3.84 | ||
| Cultivated Land | 1981 | 45.36 | 811.00 | 0.67 | 37.50 | |
| 1991 | 51.04 | 143.00 | 0.12 | 59.43 | ||
| 2001 | 41.34 | 862.00 | 0.71 | 28.91 | ||
| 2011 | 36.85 | 919.00 | 0.76 | 26.93 | ||
| 2018 | 18.40 | 2008.00 | 1.66 | 0.97 |
| City | Category | Year | PLAND | NP | PD | LPI |
|---|---|---|---|---|---|---|
| Kunshan | Construction Land | 1981 | 9.87 | 2475.00 | 2.60 | 0.25 |
| 1991 | 15.37 | 862.00 | 0.90 | 0.66 | ||
| 2001 | 42.79 | 1118.00 | 1.17 | 24.39 | ||
| 2011 | 41.40 | 932.00 | 0.98 | 26.52 | ||
| 2018 | 53.96 | 312.00 | 0.33 | 50.99 | ||
| Green Land | 1981 | 12.03 | 2201.00 | 2.31 | 0.70 | |
| 1991 | 30.47 | 1965.00 | 2.06 | 6.04 | ||
| 2001 | 12.07 | 2787.00 | 2.92 | 0.25 | ||
| 2011 | 22.13 | 1236.00 | 1.30 | 3.60 | ||
| 2018 | 18.87 | 2243.00 | 2.35 | 0.69 | ||
| Water Bodies | 1981 | 15.58 | 1510.00 | 1.58 | 3.48 | |
| 1991 | 13.43 | 944.00 | 0.99 | 3.02 | ||
| 2001 | 13.69 | 1472.00 | 1.54 | 1.86 | ||
| 2011 | 13.62 | 773.00 | 0.81 | 1.87 | ||
| 2018 | 14.77 | 1727.00 | 1.81 | 1.92 | ||
| Cultivated Land | 1981 | 62.52 | 190.00 | 0.20 | 60.98 | |
| 1991 | 40.72 | 352.00 | 0.37 | 46.08 | ||
| 2001 | 31.45 | 1270.00 | 1.33 | 5.27 | ||
| 2011 | 22.85 | 1942.00 | 2.04 | 1.82 | ||
| 2018 | 12.39 | 2086.00 | 2.19 | 0.20 |
| City | Category | Year | PLAND | NP | PD | LPI |
|---|---|---|---|---|---|---|
| Jiangyin | Construction Land | 1981–1991 | 83.22% | −41.95% | −41.95% | 518.57% |
| 1991–2001 | 64.55% | 49.49% | 49.49% | 423.80% | ||
| 2001–2011 | 61.80% | −51.34% | −51.34% | 411.29% | ||
| 2011–2018 | 23.19% | −75.30% | −75.30% | 72.09% | ||
| 1981–2018 | 500.94% | −89.57% | −89.57% | 28,407.87% | ||
| Green Land | 1981–1991 | 32.51% | 73.44% | 73.45% | 60.33% | |
| 1991–2001 | 1.13% | −57.99% | −57.98% | −80.91% | ||
| 2001–2011 | −50.73% | 207.26% | 207.25% | −98.65% | ||
| 2011–2018 | −82.45% | 319.30% | 319.25% | −98.86% | ||
| 1981–2018 | −19.62% | 1.50% | 1.50% | −51.44% | ||
| Water Bodies | 1981–1991 | 17.11% | −17.33% | −17.33% | 14.70% | |
| 1991–2001 | 2.07% | −45.02% | −45.01% | −14.63% | ||
| 2001–2011 | −3.45% | −34.38% | −34.38% | −14.41% | ||
| 2011–2018 | 1.03% | 357.46% | 357.43% | 5.98% | ||
| 1981–2018 | 16.61% | 36.46% | 36.46% | −11.17% | ||
| Cultivated | 1981–1991 | 26.71% | −64.69% | −64.70% | 74.39% | |
| 1991–2001 | −26.75% | 181.63% | 181.65% | −44.55% | ||
| 2001–2011 | −12.65% | −47.97% | −47.97% | 52.85% | ||
| 2011–2018 | −12.28% | 181.34% | 181.34% | −57.87% | ||
| 1981–2018 | −77.60% | 865.31% | 865.33% | −99.07% |
| City | Category | Year | PLAND | NP | PD | LPI |
|---|---|---|---|---|---|---|
| Zhangjiagang | Construction Land | 1981–1991 | 16.49% | −45.26% | −71.76% | 54.54% |
| 1991–2001 | 105.65% | 63.57% | 217.10% | 844.20% | ||
| 2001–2011 | 72.75% | −48.89% | −48.89% | 389.01% | ||
| 2011–2018 | 23.75% | −44.38% | −44.38% | 71.64% | ||
| 1981–2018 | 412.16% | −74.55% | −74.55% | 12,147.14% | ||
| Green Land | 1981–1991 | −45.06% | 9.65% | 9.65% | −86.21% | |
| 1991–2001 | −20.41% | 93.12% | 93.12% | −95.25% | ||
| 2001–2011 | −45.08% | −64.00% | −64.00% | 389.10% | ||
| 2011–2018 | 95.95% | 133.95% | 133.95% | −69.15% | ||
| 1981–2018 | −52.95% | 78.33% | 78.34% | −99.01% | ||
| Water Bodies | 1981–1991 | 4.09% | −22.47% | −22.46% | 1.93% | |
| 1991–2001 | −7.33% | −38.78% | −38.79% | −2.21% | ||
| 2001–2011 | 0.93% | −35.23% | −35.23% | −12.77% | ||
| 2011–2018 | −0.63% | 418.13% | 418.19% | −0.70% | ||
| 1981–2018 | −3.26% | 59.29% | 59.29% | −13.66% | ||
| Cultivated Land | 1981–1991 | 26.71% | −64.69% | −64.70% | 74.39% | |
| 1991–2001 | −11.74% | 40.37% | 40.44% | −14.89% | ||
| 2001–2011 | −22.02% | 169.03% | 168.98% | −24.46% | ||
| 2011–2018 | −43.52% | 135.20% | 135.19% | −93.92% | ||
| 1981–2018 | −50.74% | 213.60% | 213.59% | −93.18% |
| City | Category | Year | PLAND | NP | PD | LPI |
|---|---|---|---|---|---|---|
| Changshu | Construction Land | 1981–1991 | 125.25% | −36.69% | −36.69% | 193.36% |
| 1991–2001 | 50.61% | 67.73% | 67.73% | 465.91% | ||
| 2001–2011 | 51.24% | −54.31% | −54.31% | 430.88% | ||
| 2011–2018 | 43.65% | −57.26% | −57.26% | 92.99% | ||
| 1981–2018 | 637.03% | −79.27% | −79.27% | 16,908.96% | ||
| Green Land | 1981–1991 | −41.45% | 58.73% | −37.28% | −94.87% | |
| 1991–2001 | 14.09% | −12.71% | −18.11% | 225.15% | ||
| 2001–2011 | −40.01% | −56.56% | 17.17% | 36.67% | ||
| 2011–2018 | 11.78% | 152.01% | 152.01% | −60.26% | ||
| 1981–2018 | −55.20% | 51.66% | 51.66% | −90.94% | ||
| Water Bodies | 1981–1991 | −3.65% | −23.05% | −23.05% | −3.86% | |
| 1991–2001 | −9.87% | −18.11% | −18.11% | −5.29% | ||
| 2001–2011 | 10.20% | −43.06% | −43.06% | −22.78% | ||
| 2011–2018 | 6.47% | 192.15% | 192.17% | −0.97% | ||
| 1981–2018 | 1.89% | 4.82% | 4.82% | −30.37% | ||
| Cultivated Land | 1981–1991 | 12.51% | −82.37% | −82.37% | 58.49% | |
| 1991–2001 | −19.00% | 502.80% | 502.96% | −51.36% | ||
| 2001–2011 | −10.87% | 6.61% | 6.61% | −6.83% | ||
| 2011–2018 | −50.08% | 118.50% | 118.49% | −96.40% | ||
| 1981–2018 | −59.45% | 147.60% | 147.62% | −97.41% |
| City | Category | Year | PLAND | NP | PD | LPI |
|---|---|---|---|---|---|---|
| Kunshan | Construction Land | 1981–1991 | 55.85% | −65.17% | −65.17% | 159.74% |
| 1991–2001 | 178.30% | 29.70% | 29.71% | 3587.65% | ||
| 2001–2011 | −3.23% | −16.64% | −16.64% | 8.73% | ||
| 2011–2018 | 30.34% | −66.52% | −66.52% | 92.29% | ||
| 1981–2018 | 447.01% | −87.39% | −87.39% | 19,926.20% | ||
| Green Land | 1981–1991 | 153.33% | −10.72% | −10.72% | 761.93% | |
| 1991–2001 | −60.39% | 41.83% | 41.83% | −95.84% | ||
| 2001–2011 | 83.36% | −55.65% | −55.65% | 1334.49% | ||
| 2011–2018 | −14.74% | 81.47% | 81.48% | −80.76% | ||
| 1981–2018 | 56.86% | 1.91% | 1.91% | −1.00% | ||
| Water Bodies | 1981–1991 | −13.84% | −37.48% | −37.49% | −13.26% | |
| 1991–2001 | 1.96% | 55.93% | 55.94% | −38.29% | ||
| 2001–2011 | −0.52% | −47.49% | −47.48% | 0.28% | ||
| 2011–2018 | 8.46% | 123.42% | 123.41% | 2.74% | ||
| 1981–2018 | −5.21% | 14.37% | 14.37% | −44.84% | ||
| Cultivated Land | 1981–1991 | −34.86% | 85.26% | 85.25% | −24.43% | |
| 1991–2001 | −22.77% | 260.80% | 260.83% | −88.57% | ||
| 2001–2011 | −27.37% | 52.91% | 52.91% | −65.41% | ||
| 2011–2018 | −45.74% | 7.42% | 7.42% | −89.22% | ||
| 1981–2018 | −80.17% | 997.89% | 997.94% | −99.68% |
| Year | CONTAG | SPLIT | SHDI | SHEI | |
|---|---|---|---|---|---|
| Jiangyin | 1981 | 25.93 | 3.18 | 1.10 | 0.79 |
| 1991 | 22.88 | 8.02 | 1.17 | 0.84 | |
| 2001 | 24.24 | 4.33 | 1.15 | 0.83 | |
| 2011 | 28.84 | 6.53 | 1.12 | 0.81 | |
| 2018 | 22.25 | 3.11 | 1.14 | 0.82 | |
| Zhangjiagang | 1981 | 22.75 | 2.56 | 1.27 | 0.92 |
| 1991 | 31.06 | 3.52 | 1.16 | 0.84 | |
| 2001 | 24.29 | 4.59 | 1.28 | 0.92 | |
| 2011 | 28.37 | 5.50 | 1.23 | 0.89 | |
| 2018 | 18.72 | 5.67 | 1.28 | 0.92 | |
| Changshu | 1981 | 20.15 | 2.25 | 1.18 | 0.85 |
| 1991 | 29.92 | 2.80 | 1.06 | 0.76 | |
| 2001 | 13.46 | 11.13 | 1.30 | 0.93 | |
| 2011 | 24.21 | 16.98 | 1.20 | 0.87 | |
| 2018 | 17.31 | 14.23 | 1.21 | 0.87 | |
| Kunshan | 1981 | 28.57 | 2.68 | 1.07 | 0.77 |
| 1991 | 26.55 | 4.56 | 1.11 | 0.80 | |
| 2001 | 15.20 | 14.90 | 1.25 | 0.90 | |
| 2011 | 16.25 | 13.43 | 1.29 | 0.93 | |
| 2018 | 19.99 | 13.83 | 1.18 | 0.85 |
© 2019 by the authors. Licensee MDPI, Basel, Switzerland. This article is an open access article distributed under the terms and conditions of the Creative Commons Attribution (CC BY) license (http://creativecommons.org/licenses/by/4.0/).
Share and Cite
Zhu, Y.; Wang, C.; Sakai, T. Remote Sensing-Based Analysis of Landscape Pattern Evolution in Industrial Rural Areas: A Case of Southern Jiangsu, China. Sustainability 2019, 11, 4994. https://doi.org/10.3390/su11184994
Zhu Y, Wang C, Sakai T. Remote Sensing-Based Analysis of Landscape Pattern Evolution in Industrial Rural Areas: A Case of Southern Jiangsu, China. Sustainability. 2019; 11(18):4994. https://doi.org/10.3390/su11184994
Chicago/Turabian StyleZhu, Yifan, Chengkang Wang, and Takeru Sakai. 2019. "Remote Sensing-Based Analysis of Landscape Pattern Evolution in Industrial Rural Areas: A Case of Southern Jiangsu, China" Sustainability 11, no. 18: 4994. https://doi.org/10.3390/su11184994
APA StyleZhu, Y., Wang, C., & Sakai, T. (2019). Remote Sensing-Based Analysis of Landscape Pattern Evolution in Industrial Rural Areas: A Case of Southern Jiangsu, China. Sustainability, 11(18), 4994. https://doi.org/10.3390/su11184994