Development of a Refined Analysis Method for Earthquake-Induced Pounding between Adjacent RC Frame Structures


1
Institute of Engineering Mechanics, China Earthquake Administration, Harbin 150080, China
2
Key Laboratory of Earthquake Engineering and Engineering Vibration, China Earthquake Administration, Harbin 150080, China
3
Key Lab of Structures Dynamic Behavior and Control of the Ministry of Education, Key Lab of Smart Prevention and Mitigation of Civil Engineering Disasters of the Ministry of Industry and Information Technology, Harbin Institute of Technology, Harbin 150090, China
*
Author to whom correspondence should be addressed.
Sustainability 2019, 11(18), 4928; https://doi.org/10.3390/su11184928
Submission received: 3 August 2019
/
Revised: 29 August 2019
/
Accepted: 3 September 2019
/
Published: 9 September 2019
(This article belongs to the Special Issue Sustainability in Civil Engineering: from Sustainable Materials to Sustainable Structures)
Abstract
:Pounding of two adjacent structures is one of the factors that cause damage and hinder sustainable use of reinforced concrete (RC) frame structures under strong ground motion excitations. This study developed a pounding analysis method with a refined beam-column element in order to solve the pounding problem between two RC frame structures. The analysis method combines the fiber beam-column element model with the element sections discretized into concrete and longitudinal rebar fibers, the Hertz-damp contact element model to describe the pounding between beam-column elements, and the method to integrate the pounding force into the system dynamic equilibrium equation. The pounding can be considered either at the level between the story slab to slab or at the level between story slab to mid-column. The application of the proposed method in pounding analyses to provide a rational seismic separation gap between two adjacent RC frame structures is finally conducted to increase their safety and sustainability under strong earthquakes.
1. Introduction
The damage of structures in strong earthquakes causes economic loss, casualties and downtime. Pounding between adjacent structures is the one of the reasons that causes such damage and is commonly observed after strong earthquakes, e.g., 1971 San Fernando earthquake [1], 1985 Mexico earthquake [2], 1989 Loma Prieta earthquake [3], 1999 Taiwan Chi-Chi earthquake [4], 2008 Wenchuan earthquake [5], 2011 Christchurch earthquake [6,7], and 2015 Gorkha Earthquake [8]. Usually, the pounding becomes the source of local damages and in some cases it may even lead to collapse of the structures. Pounding occurs in adjacent structures due to the difference of their dynamic properties and the insufficient seismic separation gap between them.
Studies on structural pounding during last two decades have been extensively conducted. Besides some experimental works [9,10,11], the researchers used various numerical structural models and different models to describe poundings. Structures are generally idealized as lumped mass story models with single degree of freedom (SDOF) systems or multi-degree of freedom (MDOF) systems. Pantelides and Ma [12] studied the dynamic behaviors of a SDOF system with one-sided pounding during an earthquake. Muthukumar and DesRoches [13] studied the cogency of various pounding models in capturing the seismic pounding response of adjacent structures. Dimitrakopoulos et al. [14] used the dimensional analysis method to study the earthquake-induced pounding between adjacent structures. Cole et al. [15] studied the effects of mass distribution on pounding response of structures. Crozet et al. [16] studied the sensitivity of the response of pounding buildings with respect to structural and earthquake excitation parameters. Studies based on the MDOF systems had also been conducted. Jankowski [17] studied the earthquake-induced pounding between equal height buildings with different dynamic properties. MDOF systems to represent the isolated structures were used by some researchers [18,19,20,21,22,23] in order to studied the earthquake-induced poundings of seismically isolated buildings with adjacent structures. Generally, the studies using lumped mass models focus on the structural story responses.
Endeavors on structures with beam-column models and different pounding models were also performed. Rojas and Anderson [1] analyzed the seismic pounding of an 18-story structure at its bottom part with beam-column elements and 5-link version of a gap element and a damper link type of element. Efraimiadou et al. [24] studied the effect of different structural configurations on the pounding between adjacent planar reinforced concrete (RC) frames subjected to strong earthquakes, with contact springs in Ruaumoko software [25]. Pratesi et al. [26] analyzed seismic pounding of a RC bell tower with beam-column elements and 5-link version of a multi-link viscoelastic pounding model. Chujo et al. [27] studied the seismic pounding of adjacent RC structures damaged in 1985 Mexico earthquake, in which they used the beam-column elements with a linear viscoelastic pounding model. The above studies required the pounding occurred between the two element nodes rather than within the beam-column element itself. There were also studies that used more complex numerical models (e.g., reference [28]) in order to obtain the pounding response at the material levels but with high computational cost.
In practical applications of pounding analyses, a seismic separation gap is commonly set between two adjacent structures in order to avoid pounding damage in earthquakes. However, the width of the seismic gap cannot be unlimited in most cases due to practical constraints, and an economic gap is therefore preferable. Several studies have been focused on this topic, e.g., references [29,30,31]. In general, modeling strategies based on beam-column elements are better than that based on lumped mass story models, because the former can provide estimations at both the story and member levels, as well as keep acceptable computational cost. In this study, a fiber beam-column element model and analysis method that can consider the pounding is firstly developed, then the proposed method is used in pounding analyses for providing a rational seismic separation gap between two adjacent RC frames.
2. Beam-Column Element Model
The developed beam-column element is a two-dimensional element. The element formula follows the Euler-Bernoulli third-order beam-column element, which its displacement interpolation functions use linear Lagrangian polynomials and three-order Hermitian polynomials for axial and transversal displacements, respectively. Because the widely used of such catalog of third-order beam-column element, basic formulas for derivation of this type of element (i.e., element stiffness matrix, element consistent mass matrix, and element equivalent nodal loads) can be found in many research texts and textbooks [32,33], which are not repeated here. The fiber section model is used to describe the section axial and flexural force-deformation behaviors. The derivations of section stiffness matrix, section resistance moment and axial force vectors can refer to existing studies, in this study, the method provided in the classic literature which initially proposed the fiber beam-column model [34] (Equations (27) and (28) in the reference) is used.
2.1. Concrete and Steel Materials
Each fiber in section is assigned with a specific uniaxial stress-strain relation representing either the unconfined concrete, confined concrete or steel rebars. The adopted material constitutive models in this study for concrete and steel rebars are the widely used models up to date, even though more accurate and completed models have been published in recent years, they offer a good balance between simplicity and accuracy. This section gives a brief introduction on the adopted material stress-strain relations.
The modified Kent-Park concrete constitutive model as shown in Figure 1a is adopted to mimic the material behaviors of the unconfined and confined concrete. The envelop curve of this model is initially proposed by Kent and Park [35] as extended by Scott et al. [36], then extended again by Yassin [37] for cyclic loading and taken into account the concrete damage and hysteresis. In the figure, fc is the concrete compressive strength in MPa, K is a factor which accounts for the strength increase due confinement, Ec0 is the initial tangent modulus, ε0 is the concrete strain at maximum stress, ε20′ and ε20 are unconfined and confined concrete strain at 20% of maximum stress, respectively. The point P is used to define the degradation of stiffness that the projections of all reloading lines intersect at that common point. This concrete material has degraded linear unloading/reloading stiffness and no tensile strength. Detailed formulas and rules governing envelop (O→A→B→H branch) and unloading/reloading behaviors (B→C→D→E→G branch) are based on the study by Yassin [37] (Equations (2.22)–(2.40) in the reference).
The material behavior of steel rebar is described by the constitutive model proposed by Menegotto and Pinto [38] as shown in Figure 1b. In the figure, σy and εy are the stress and strain at the point of modulus change, Es and Esh are the initial modulus and slope of a straight-line asymptote of the stress. Detailed formulas and rules governing hysteretic behaviors are based on the study by Spacone [39] (Equations (3.9)–(3.12) in this reference). In this model, the parameters R0 = 20, a1 = 18.5, and a2 = 0.15 are used in the analyses. The above steel rebar constitutive model is extended to include the prediction of the rebar buckling and description of the post-buckling behavior. The implementation is a complex procedure and the formulas and rules are based on the study by Talaat [40] (Equations (2.12)–(2.38) in the reference).
Using damage indices with a range from 0 to 1 is a straightforward way to describe the damage degree of an element. For the beam-column element, the damage indices for axial force and bending moment at section level are firstly calculated by using the damage index formulas proposed by Talaat [40] (Equations (3.42)–(3.43) in the reference). Then, the elemental damage index is represented as the maximum value of the section damage indices among all integration points. In the study, the Gauss-Lobatto integration scheme is used to solve the integrals relevant to the element formulas and five integration points are used for each element.
2.2. Verification of Element Model
The developed beam-column element involves a series of components, e.g., the third-order beam-column element, uniaxial material models of modified Kent-Park and Menegotto-Pinto for the fiber section, the rebar buckling behavior, and the element damage index to describe the damage degree. Three verification examples for the developed material and element are conducted, in which the first and second examples verify the rebar material behavior with buckling and the third example verifies the cyclic loading performance of a cantilever RC column. The monotonic and cyclic loading rebar buckling tests are used, respectively. Figure 2 shows the comparison results between the numerical predictions and the monotonic compression rebar buckling tests by Bae et al. [41] for nine levels of rebar slenderness ratio L/d = 4, 5, 6……, 12. Figure 3 shows the comparison results between the numerical prediction and the cyclic loading rebar buckling test with slenderness ratio L/d = 11 conducted by Monti and Nuti [42]. These two figures show that the method for predicting the rebar material behavior in this study can capture the tested rebar stress-strain curves and the bulking behavior of rebars. Figure 4 shows the prediction results on a cyclic loading test of a RC column (side column specimen) performed by Lu [43]. The comparison shows a good match between the numerical prediction and the test result. The beam-column elemental mesh is one in the numerical analysis and Figure 5 provides the development of elemental damage index of the RC column during the cyclic loading.
3. Integration of Pounding in the Element Model
3.1. Contact Element
Two modeling techniques have been primarily used: the stereo-mechanical method and the contact element method. The stereo-mechanical method is not easy to implement into the existing finite element method and software for analysis of MDOF structures [13]. Therefore, the contact element method is used in this study. This method is a force-based approach, which uses an activate contact element once contact occurs and delete the element when there is no contact. The pounding force can be seen as a complementary loading restricts to the original system dynamic equilibrium equation. Commonly there are four pounding models, i.e., the linear-spring model (this model is regarded as impractical as it cannot account for the energy loss during collision), the Kelvin model (this model is regarded as impractical as it results in tensile forces acting on the bodies just before separation), the Hertz model (this model is regarded as impractical as it fails to include the energy dissipation during collision), and the Hertz-damp model [13]. The Hertz-damp model can overcome the shortages of the above-mentioned models and it is used in this study. The following contact force (Fc) formulas of Hertz-damp model is originally used in areas of robotics and multi-body systems, and firstly introduced into the structural engineering area by Muthukumar and DesRoches [13], this model is based on the Hertz law and using a non-linear damper
where kh is the contact stiffness, generally set as for concrete structures [44]; n is the Hertz coefficient for describing a nonlinear contact force-deformation relationship, which is typically taken as 3/2; is relative penetration (compression deformation), in which u1, u2, and gp are the displacements of the contact pairs along the contact axis and the gap between contact points; the dot denotes differentiation with respect to time; ch is the damping coefficient, which can be calculated as
where is the damping constant. The derivation of is by equating the energy loss during stereo-mechanical collision to the energy dissipated by the damper, then a formula for the damping constant () can be expressed in terms of the spring stiffness (kh), the restitution coefficient (e) and the relative approaching velocity (v0), as follows [45]
Other methods to determine the damping constant () were also proposed for a better accuracy [46,47]. In the study by Ye et al. [46], who thought that the Equation (3) is valid only for the case of restitution coefficient (e) approximating one and pointed out the logical relationship between and e (i.e., e = 1 → = 0 and e = 0 → = ∞) can’t be reached by Equation (3). Therefore, they derived a more theoretically rational approximating formula for the damping constant (), as follows
Hence, the force during pounding in Equation (1) can be expressed as Equation (5). Because the theoretically rational of Equation (4), Equation (5) for calculating the collision force is finally used in this study. The restitution coefficient (e) used to simulate real collision in structural engineering commonly varies in the range of 0.5 and 0.75, and 0.65 is adopted in the analyses.
3.2. Compression Deformation
The compression deformation of the Hertz-damp model needs to be calculated firstly and then calculation of the pounding force. There are two typical pounding situations between adjacent frame structures as shown in Figure 6, including (1) When the heights corresponding to story slabs of the two adjacent structures at which pounding occurs are same, pounding will be between the beam-column joint to joint (i.e., the pounding occurs at the level of story slab to slab. See Figure 6a); (2) Otherwise, the pounding may occur between the story slab and a point within the column (i.e., story slab to mid-column. See Figure 6b). In the finite element model to simulate the first situation, the pounding occurs between two elemental nodes; and for the second situation, the pounding may occur between two elemental nodes or between the elemental node and the mid-element.
For the first situation, the compression deformation of the Hertz-damp model can be directly expressed by using the structural nodal displacement vector. A vector is defined as follows to locate the pounding point.
where is the position transfer coefficient vector for the k-th contact nodal pair; TDOF is total degree of freedoms of the structure, the superscript “1” and “2” denotes structure 1 and structure 2; is the position of horizontal displacement component at node i of structure 1 in the structural displacement vector in the global coordinate system; is the position of horizontal displacement component at node m of structure 2 in the structural nodal displacement vector in the global coordinate system.
The compression deformation at the k-th contact nodal pair in the global coordinate system can be expressed as
where and are nodal displacement vector of structure 1 and structure 2 in the global coordinate system. Note that the gap is not considered in Equation (7) for brief but it is easily to be added.
For the second situation, the horizontal displacement at pounding point N (see Figure 6b) needs to be firstly derived. Because in the finite element analysis procedure, only the elemental nodal displacement is recorded, the horizontal displacement at point N is certainly relevant to the element nodal displacement which the element includes the point N. As shown in Figure 6b, the displacement vector of point N in the global coordinate system is taken as
where is the compression deformation at the l-th contact nodal pair in the global coordinate system; and are the horizontal and vertical displacement components at pounding point N in the global coordinate system.
The compression deformation can be expressed in element coordinate system as follows
where is the transfer matrix for displacement vector of element at point N in structure 1 from element coordinate system to global coordinate system; is the compression deformation in element coordinate system. The element displacement interpolation functions () used in Section 2 for the third-order beam-column element is adopted, therefore
where is the nodal displacement of element at point N in structure 1 in element coordinate system. The can be represented in global coordinate system as
where is the transfer matrix for nodal displacement vector of element in structure 1 from global coordinate system to element coordinate system; is the nodal displacement vector of element in the global coordinate system.
According to Equations (8)–(11), the following equation can be obtained
Set as the transfer coefficient matrix from the nodal displacement vector of structure 1 in the global coordinate system to the nodal displacement vector of element in the global coordinate system. Thus
where is a matrix consisting of 0 and 1; is the dimension of the structural displacement vector of structure 1; is the dimension of the nodal displacement of element ie in structure 1, for planar beam-column element, = 6.
According to Equations (12) and (13), the following equation can be obtained and expressed in a brief form
where is the transfer coefficient matrix from structural nodal displacement vector to the horizontal and vertical displacement components at pounding point N in the global coordinate system
where the subscripts s1 and s2 correspond to the horizontal and vertical components. If denotes the position of horizontal nodal displacement of node N in structure 2 in structural nodal displacement vector 2 as , Equation (6) can be changed to
Similar to Equation (7), the compression deformation at contact pair l can be expressed in the following Equation
The above derivations correspond to the collision occurs within the column in structure 1 and at the story slab in structure 2. If the collision occurs at the story slab in structure 1 and at within the column in structure 2, same derivation procedure can be adopted and will not be provided here again in the study for brief. In the calculation, it is easy to distinguish the pounding cases and use the formulas.
If there are contact pairs in the two structures, a packing equation for the compression deformations can be given as
A brief expression of Equation (18) can be given as
where is the transfer coefficient matrix for contact nodal pair; is nodal displacement vector of structure 1 and structure 2 in the global coordinate system; is compression deformation vector at contact nodal pairs in the global coordinate system.
3.3. Pounding Force
The penetration velocity at the contact nodal pair used in Equation (5) can be calculated by differentiate the penetration displacements within the time step. Therefore, the pounding force at the contact nodal pair can be calculated. Then, the pounding force will be expressed by the format of external equivalent nodal loads.
Assuming the pounding forces on structure 1 and structure 2 at k-th contact nodal pair are expressed as the following Equation
where k will change to l if it is at l-th contact nodal pair.
For the first situation, the equivalent nodal load vector of structure in global coordinate system can be easily obtained by the Equation
For the second situation, the contact force at pounding point N needs to be firstly transferred to the elemental coordinate system, and then expressed by the equivalent elemental nodal load induced by the pounding as
where is the matrix of elemental displacement interpolation functions of element at pounding point N in structure 1; the superscript T denotes matrix transpose. Transfer the equivalent elemental nodal load from the elemental coordinate system to the global coordinate system
The matrix is used to get the elemental equivalent elemental nodal load vector for structure 1 in global coordinate system
Therefore, if denotes the position of pounding force of node m in structure 2 in structural nodal load vector as , we can get
If there are contact pairs in the two structures, a packing equation for the structural equivalent nodal load can be given as
3.4. Integration into System Equation
The Equation (27) can be seen as external nodal loads on the structures, which can be integrated into the system dynamic equilibrium equations of motion of the two adjacent structures. Newmark implicit numerical integration method is used with a default incremental time step of 5 × 10⁻³ s. The time step can be automatically interpolated into a small value by checking whether the pounding occurs.
4. Pounding Analysis for RC Frames
4.1. Building Information and Selected Ground Motions
Two RC frames with 5 stories (J-1 frame) and 11 stories (J-2 frame) are modeled to illustrate the collision analysis and discuss on the rational seismic separation gap. The two frames are with regular configuration, as shown in Figure 7. The fundamental periods are 1.11 s and 2.23 s for the 5-story frame and 11-story frame, respectively. For detail information of these RC frames, such as cross-section dimensions of beams and columns, and materials of concrete and steel rebars, are provided in Table 1, Table 2 and Table 3 shows a total of 24 records of horizontal components of ground motion records selected for the pounding analyses and determination of the rational separation gap between the two frame structures. These ground motion records are recommended by the standard of general rule for performance-based seismic design of buildings [48].
4.2. Pounding Analysis and the Rational Separation Gap
The first ground motion record from Table 3, as shown in Figure 8, from 1979 Imperial Valley earthquake at station of El Centro, Array #5 (140 component) is selected to illustrate the pounding analyses. The 24 of ground motion records are then used for analyze the rational separation gap. The ground motion intensity is scaled to PGA = 0.4 g, which corresponds to the rare earthquake intensity at the building site (seismic hazard of 2–3% probability of exceedance in the 50 years).
Figure 9 shows the pounding forces at positions of J-1-D1 (1st story in axis D in J-1 RC frame) and J-1-D5 (5th story in axis D in J-1 RC frame). The figure illustrates that the pounding force and pounding frequency generally increase as the separation gap decreases. The pounding force and pounding frequency of upper stories (e.g., 5th story) are more serious than those of lower stories (e.g., 1st story). Figure 10 shows the horizontal acceleration and displacement responses at positions of J-1-D1 and J-1-D5. It seems that the pounding increases acceleration and displacement responses in most cases. The final states of beam and column damage indices are shown in Figure 11.
Pounding aggravates member damage indices around the pounding point, and the damage indices of other members may increase or decrease. Therefore, the structural damage is complex by including poundings. Although local damage is important in pounding but the global damage is more important when evaluation of a structure under earthquake loads. A structural damage index Ds shown as Equation (28) is used here to describe the global damage of the structure. Considering the correlation between the structural global damage and each beam is generally same, i.e., the contribution to structural global damage by beams in different stories may not have large differences, the weights of all beams are set with a same value. Assuming that the correlation between the structural global damage and each column generally decreases from lower stories to upper stories, the weights among different stories is set with the reciprocal of its story number and the weights of columns within a story are proportional to its axial stiffness.
where
In which , , and are the weight and damage index of beam and column, respectively; is the number of beams; is the sum of weights of columns in j-th story; is the axial stiffness of columns in j-th story. The calculation of elemental damage index of a beam or column is same as that in Section 2.1.
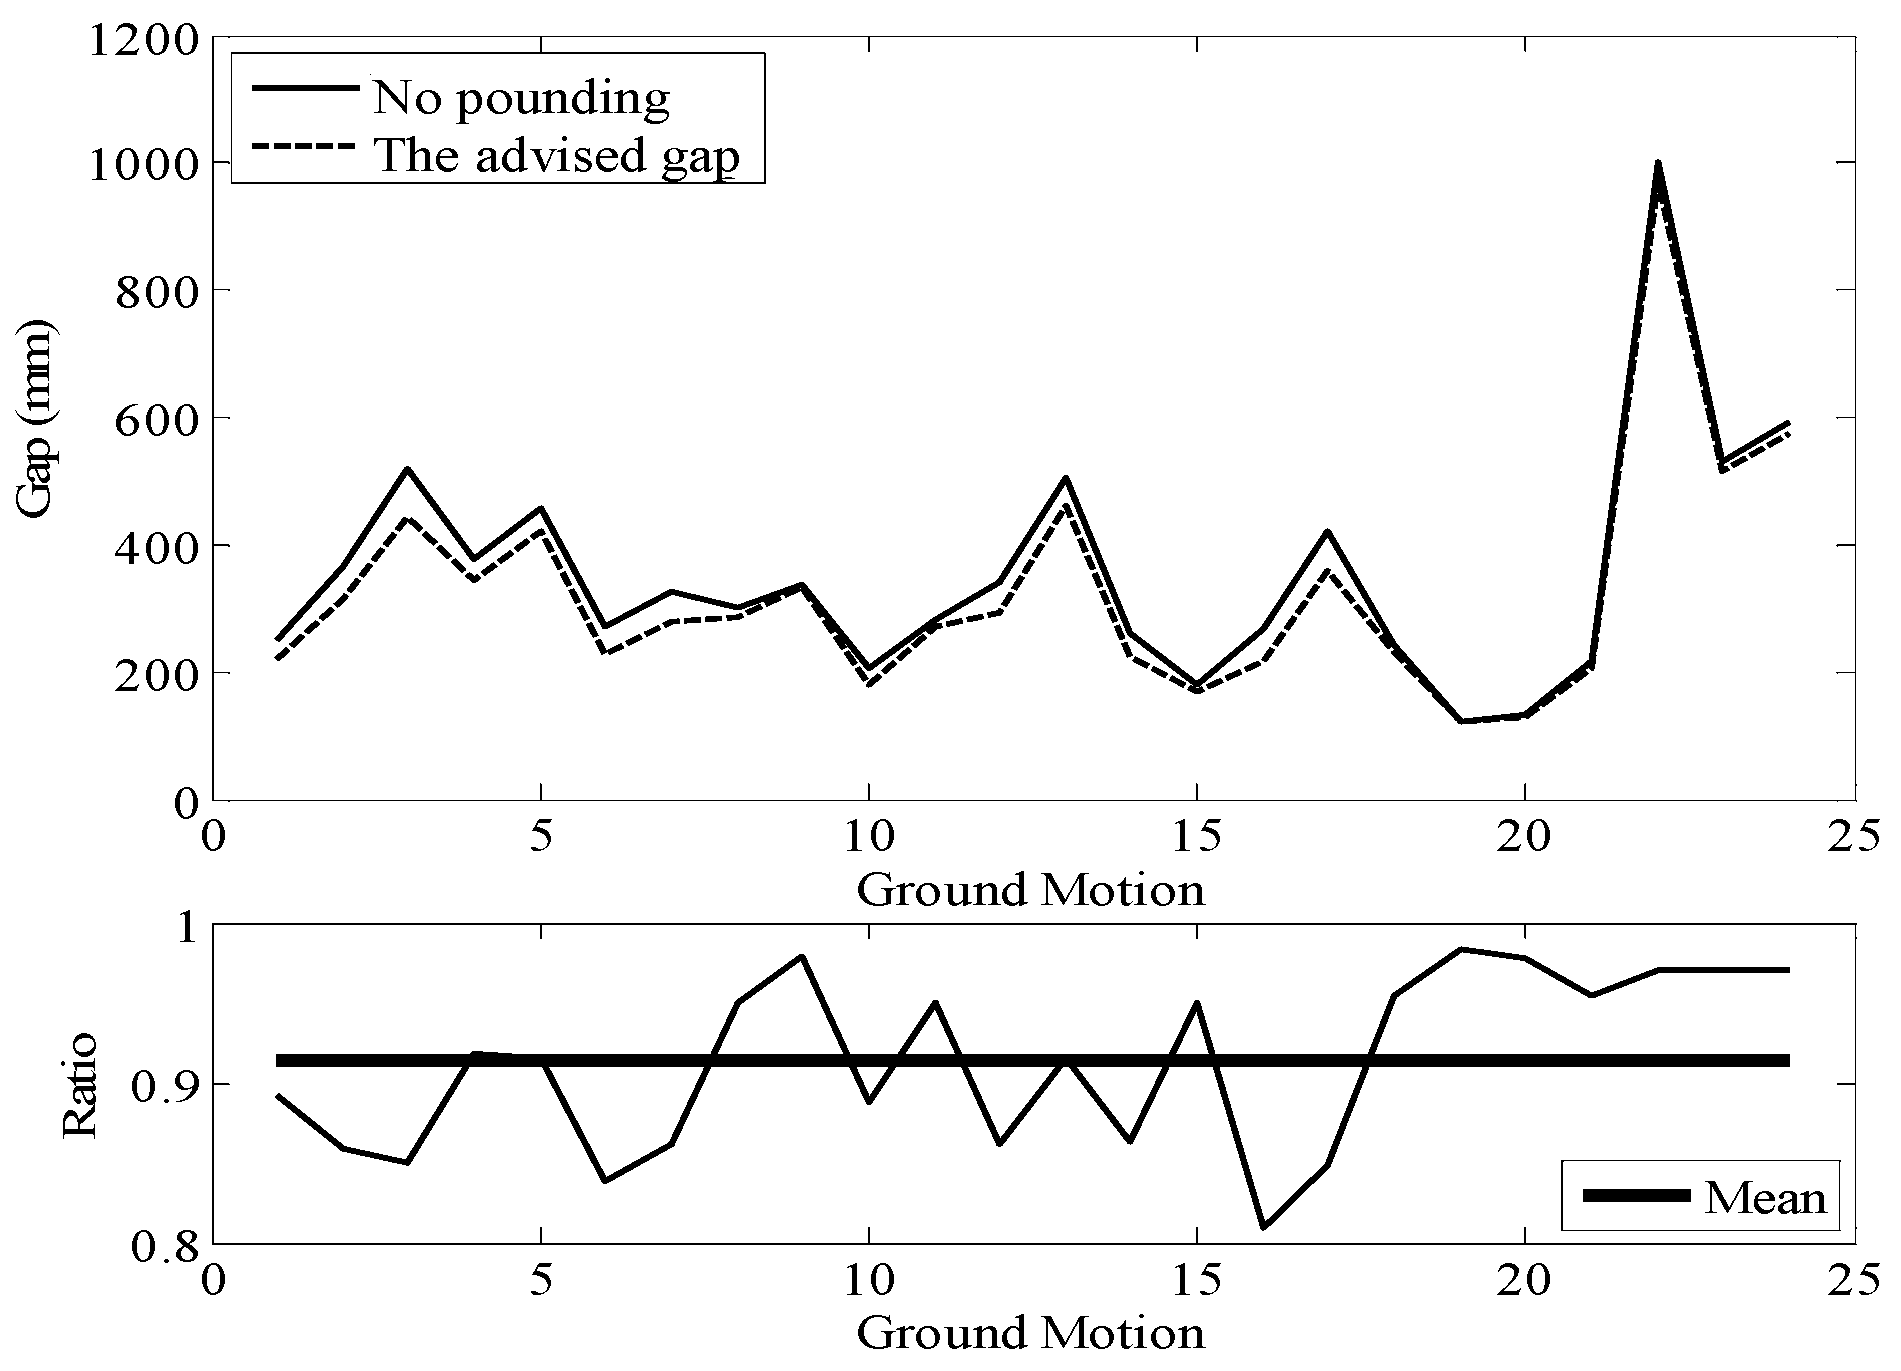
Figure 12 shows the structural damage index varied with the separation gap between the two RC frames. The figure illustrates the structural damage index is not linearly relevant to the separation gap. However, it seems that the structural damage will become to a constant value, i.e., it does not increase to larger values, when the separation gap is larger than a threshold value. In addition, the threshold value can use a value smaller than the required separation gap so no pounding occurs (see the damage index variation between the line for advised gap and line for no pounding in Figure 12). In this study, the advised threshold value is set as the separation gap, which after it the variation of the structural damage index is no larger than 2% of the maximum structural damage index. Follow this definition of a threshold value, more spaces between two adjacent structures can be saved to create additional economic profits in practical engineering projects. The 24 ground motion records in Table 3 are used to calculate the advised separation gap and required separation gap with no pounding. Figure 13 shows the calculated results and the mean ratio of the advised separation gap and the required separation gap with no pounding is about 0.9. In general, if the separation gap is set as 500 mm, there are over 85% probabilities that the damages are no more than that the damage without pounding.
5. Conclusions
This study proposed a finite element analysis method with a refined beam-column element in order to solve the pounding problem between two reinforced concrete (RC) frame structures under strong ground motion excitations.
- (1)
- The fiber beam-column element model is adopted and the element section discretized into concrete and reinforcement fibers with hysteretic models while considering bucking behaviors. The formulas that integration of the beam-column element and Hertz-damp contact element are proposed. The pounding can be considered either at the level between the story slab to slab or at the level between story slab to mid-column.
- (2)
- The application of the proposed method in pounding analyses to provide a rational seismic separation gap between two adjacent RC frame structures is conducted. It seems that the structural damage may not linearly vary as the separation gap reduces, but it may remain nearly unchanged when the separation gap is larger than a threshold value. The threshold value is smaller than the required separation gap meaning no pounding occurs. This value can be set as the rational seismic separation gap.
- (3)
- The proposed method can be used in damage analysis for structures which may be influenced by pounding or used to provides a rational seismic separation gap in a probabilistic way by analyses of a series of ground motion records at a specific earthquake intensity, in order to increase the safety and sustainability of a structure in earthquakes.
Author Contributions
Conceptualization and funding acquisition: Y.Y. and S.L. Writing—review and editing: S.L. Methodology and formal analysis: Y.Y.
Funding
This research project is supported by the Scientific Research Fund of Institute of Engineering Mechanics, China Earthquake Administration (Grant No. 2018D02), National Key R&D Program of China (2017YFC1500602), and National Natural Science Foundation of China (Grant No. 51578202, 51308516). The financial supports of these research funds are greatly appreciated by the authors.
Conflicts of Interest
The authors declare that there are no conflicts of interest regarding the publication of this paper.
References
- Rojas, F.R.; Anderson, J.C. Pounding of an 18-story building during recorded earthquakes. J. Struct. Eng. 2012, 138, 1530–1544. [Google Scholar] [CrossRef]
- Anagnostopoulos, S.A.; Karamaneas, C.E. Use of collision shear walls to minimize seismic separation and to protect adjacent buildings from collapse due to earthquake-induced pounding. Earthq. Eng. Struct. Dyn. 2008, 37, 1371–1388. [Google Scholar] [CrossRef]
- Kasai, K.; Maison, B.F. Building pounding damage during the 1989 Loma Prieta earthquake. Eng. Struct. 1997, 19, 195–207. [Google Scholar] [CrossRef]
- Wang, C.J.; Shih, M.H. Performance study of a bridge involving sliding decks and pounded abutment during a violent earthquake. Eng. Struct. 2007, 29, 802–812. [Google Scholar] [CrossRef]
- Hu, M.; Han, Q.; Wen, J.; Bai, Y. Seismic failure of multi-span simply supported RC slab-on-grider bridge in 2008 Wenchuan earthquake: Case study. Eng. Fail. Anal. 2019, 95, 140–153. [Google Scholar] [CrossRef]
- Cole, G.L.; Dhakal, R.P.; Turner, F.M. Building pounding damage observed in the 2011 Christchurch earthquake. Earthq. Eng. Struct. Dyn. 2012, 41, 893–913. [Google Scholar] [CrossRef]
- Chouw, N.; Hao, H. Study of SSI and non-uniform ground motion effect on pounding between bridge girders. Soil Dyn. Earthq. Eng. 2005, 25, 717–728. [Google Scholar] [CrossRef]
- Shrestha, B.; Hao, H. Building pounding damages observed during the 2015 Gorkha earthquake. J. Perform. Constr. Facil. 2018, 32. [Google Scholar] [CrossRef]
- Filiatrault, A.; Wangner, P. Analytical prediction of experimental building pounding. Earthq. Eng. Struct. Dyn. 1995, 24, 1131–1154. [Google Scholar] [CrossRef]
- Jankowski, R. Experimental study on earthquake-induced pounding between structural elements made of different building materials. Earthq. Eng. Struct. Dyn. 2009, 39, 343–354. [Google Scholar] [CrossRef]
- Chau, K.T.; Wei, X.X.; Guo, X.; Shen, C.Y. Experimental and theoretical simulations of seismic poundings between two adjacent structures. Earthq. Eng. Struct. Dyn. 2003, 32, 537–554. [Google Scholar] [CrossRef]
- Pantelides, C.P.; Ma, X. Linear and nonlinear pounding of structural systems. Comput. Struct. 1998, 66, 79–92. [Google Scholar] [CrossRef]
- Muthukumar, S.; DesRoches, R. A Hertz contact model with non-linear damping for pounding simulation. Earthq. Eng. Struct. Dyn. 2006, 35, 811–828. [Google Scholar] [CrossRef]
- Dimitrakopoulos, E.; Makris, N.; Kappos, A.J. Dimensional analysis of the earthquake-induced pounding between adjacent structures. Earthq. Eng. Struct. Dyn. 2009, 38, 867–886. [Google Scholar] [CrossRef]
- Cole, G.; Dhakal, R.; Carr, A.; Bull, D. An investigation of the effects of mass distribution on pounding structures. Earthq. Eng. Struct. Dyn. 2011, 40, 641–659. [Google Scholar] [CrossRef]
- Crozet, V.; Politopoulos, I.; Yang, M.; Martinez, J.M.; Erlicher, S. Sensitivity analysis of pounding between adjacent structures. Earthq. Eng. Struct. Dyn. 2018, 47, 219–235. [Google Scholar] [CrossRef]
- Jankowski, R. Earthquake-induced pounding between equal height buildings with substantially different dynamic properties. Eng. Struct. 2008, 30, 2818–2829. [Google Scholar] [CrossRef]
- Matsagar, V.A.; Jangid, R.S. Seismic response of base-isolated structures during impact with adjacent structures. Eng. Struct. 2003, 25, 1311–1323. [Google Scholar] [CrossRef]
- Agarwal, V.K.; Niedzwecki, J.M.; Van de Lindt, J.W. Earthquake induced pounding in friction varying base isolated buildings. Eng. Struct. 2007, 29, 2825–2832. [Google Scholar] [CrossRef]
- Komodromos, P. Simulation of the earthquake-induced pounding of seismically isolated buildings. Comput. Struct. 2008, 86, 618–626. [Google Scholar] [CrossRef]
- Polycarpou, P.C.; Komodromos, P. Earthquake-induced poundings of a seismically isolated building with adjacent structures. Eng. Struct. 2010, 32, 1937–1951. [Google Scholar] [CrossRef]
- Moustafa, A.; Mahmoud, S. Damage assessment of adjacent buildings under earthquake loads. Eng. Struct. 2014, 61, 153–165. [Google Scholar] [CrossRef]
- Bao, Y.; Becker, T.C. Inelastic response of base-isolated structures subjected to impact. Eng. Struct. 2018, 171, 86–93. [Google Scholar] [CrossRef]
- Efraimiadou, S.; Hatzigeorgiou, G.D.; Beskos, D.E. Structural pounding between adjacent buildings subjected to strong ground motions. Part I: The effect of different structures arrangement. Earthq. Eng. Struct. Dyn. 2013, 42, 1509–1528. [Google Scholar] [CrossRef]
- Carr, A.J. Ruaumoko—Inelastic Dynamic Analysis Program; University of Canterbury: Christchurch, New Zealand, 2008. [Google Scholar]
- Pratesi, F.; Sorace, S.; Terenzi, G. Analysis and mitigation of seismic pounding of a slender R/C bell tower. Eng. Struct. 2014, 71, 23–34. [Google Scholar] [CrossRef]
- Chujo, T.; Yoshikado, H.; Sato, Y.; Naganuma, K.; Kaneko, Y. Experimental and analytical investigations of seismic pounding of adjacent 14-story reinforced concrete buildings damaged in 1985 mexico earthquake. J. Adv. Concr. Technol. 2016, 14, 753–769. [Google Scholar] [CrossRef]
- Jankowski, R. Non-linear FEM analysis of earthquake-induced pounding between the main building and the stairway tower of the Olive View Hospital. Eng. Struct. 2009, 31, 1851–1864. [Google Scholar] [CrossRef]
- Jeng, V.; Tzeng, W.L. Assessment of seismic pounding hazard for Taipei City. Eng. Struct. 2000, 22, 459–471. [Google Scholar] [CrossRef]
- Lin, J.H.; Weng, C.C. Probability analysis of seismic pounding of adjacent buildings. Earthq. Eng. Struct. Dyn. 2001, 30, 1539–1557. [Google Scholar] [CrossRef]
- Wang, S.S.; Hong, H.P. Quantiles of critical separation distance for nonstationary seismic excitations. Eng. Struct. 2006, 28, 985–991. [Google Scholar] [CrossRef]
- Smith, I.M.; Griffiths, D.V. Programming the Finite Element Method, 4th ed.; JohnWiley & Sons: Chichester, UK, 2004. [Google Scholar]
- Zienkiewicz, O.C.; Taylor, R.L.; Zhu, J.Z. The Finite Element Method: Its Basis and Fundamentals, 6th ed.; Elsevier: Oxford, UK, 2005. [Google Scholar]
- Spacone, E.; Filippou, F.C.; Taucer, F.F. Fiber beam-column model for non-linear analysis of R/C frames: Part, I. Formulation. Earthq. Eng. Struct. Dyn. 1996, 25, 711–725. [Google Scholar] [CrossRef]
- Kent, D.C.; Park, R. Flexural members with confined concrete. J. Struct. Div. 1971, 97, 1969–1990. [Google Scholar]
- Scott, B.D.; Park, R.; Priestley, M.J.N. Stress-strain behavior of concrete confined by overlapping hoops at low and high strain rates. ACI J. Proc. 1982, 79, 13–27. [Google Scholar]
- Yassin, M.H.M. Nonlinear Analysis of Prestressed Concrete Structures under Monotonic and Cyclic Loads. Ph.D. Thesis, University of California, Berkeley, CA, USA, 1994. [Google Scholar]
- Menegotto, M.; Pinto, P.E. Method of Analysis for Cyclically Loaded Reinforced Concrete Plane Frames Including Changes in Geometry and Non-Elastic Behavior of Elements Under Combined Normal Force and Bending. In Symposium Report of Resistance and Ultimate Deformability of Structures Acted on by Well-Defined Repeated Loads; IABSE: Lisbon, Portugal, 1973; pp. 15–22. [Google Scholar]
- Spacone, E. Flexibility-Based Finite Element Models for the Nonlinear Static and Dynamic Analysis of Concrete Frame Structures. Ph.D. Thesis, University of California, Berkeley, CA, USA, 1994. [Google Scholar]
- Talaat, M.M. Computational Modeling of Progressive Collapse in Reinforced Concrete Frame Structures. Ph.D. Thesis, University of California, Berkeley, CA, USA, 2007. [Google Scholar]
- Bae, S.; Mieses, A.M.; Bayrak, O. Inelastic buckling of reinforcing bars. J. Struct. Eng. 2005, 131, 314–321. [Google Scholar] [CrossRef]
- Monti, G.; Nuti, C. Nonlinear cyclic behaviour of reinforcing bars including buckling. J. Struct. Eng. 1992, 118, 3268–3284. [Google Scholar] [CrossRef]
- Lu, X.Z. Newsletter for Quasi-Static Collapse Test of RC Frame. Available online: http://www.collapse-prevention.net/download/NewsLetter02_2011-06-28.rar (accessed on 15 June 2019).
- Van Mier, J.G.M.; Paruijssers, A.F.; Reinhardt, H.W.; Monnier, T. Load-time response of colloding concrete bodies. J. Struct. Eng. 1991, 117, 354–374. [Google Scholar] [CrossRef]
- Lankarani, H.M.; Nikravesh, P.E. A contact force model with hysteresis damping for impact analysis of multibody systems. J. Mech. Des. 1990, 112, 369–376. [Google Scholar] [CrossRef]
- Ye, K.; Li, L.; Zhu, H. A note on the Hertz contact model with nonlinear damping for pounding simulation. Earthq. Eng. Struct. Dyn. 2009, 38, 1135–1142. [Google Scholar] [CrossRef]
- Zhao, D.H.; Liu, Y. Improved damping constant of Hertz-Damp model for pounding between structures. Math. Probl. Eng. 2016, 2016, 9161789. [Google Scholar] [CrossRef]
- CECS160. General Rule for Performance-Based Seismic Design of Buildings; China Planning Press: Beijing, China, 2004. [Google Scholar]
Figure 1.
Uniaxial material constitutive relations of concrete and steel rebar.

Figure 2.
Comparison between the numerical results and test results by Bae et al. [41] (Line from up to down corresponds to specimen slenderness ratio L/d = 4, 5, 6 ……, 12. Dot line: numerical results; Solid line: test results).
Figure 2.
Comparison between the numerical results and test results by Bae et al. [41] (Line from up to down corresponds to specimen slenderness ratio L/d = 4, 5, 6 ……, 12. Dot line: numerical results; Solid line: test results).
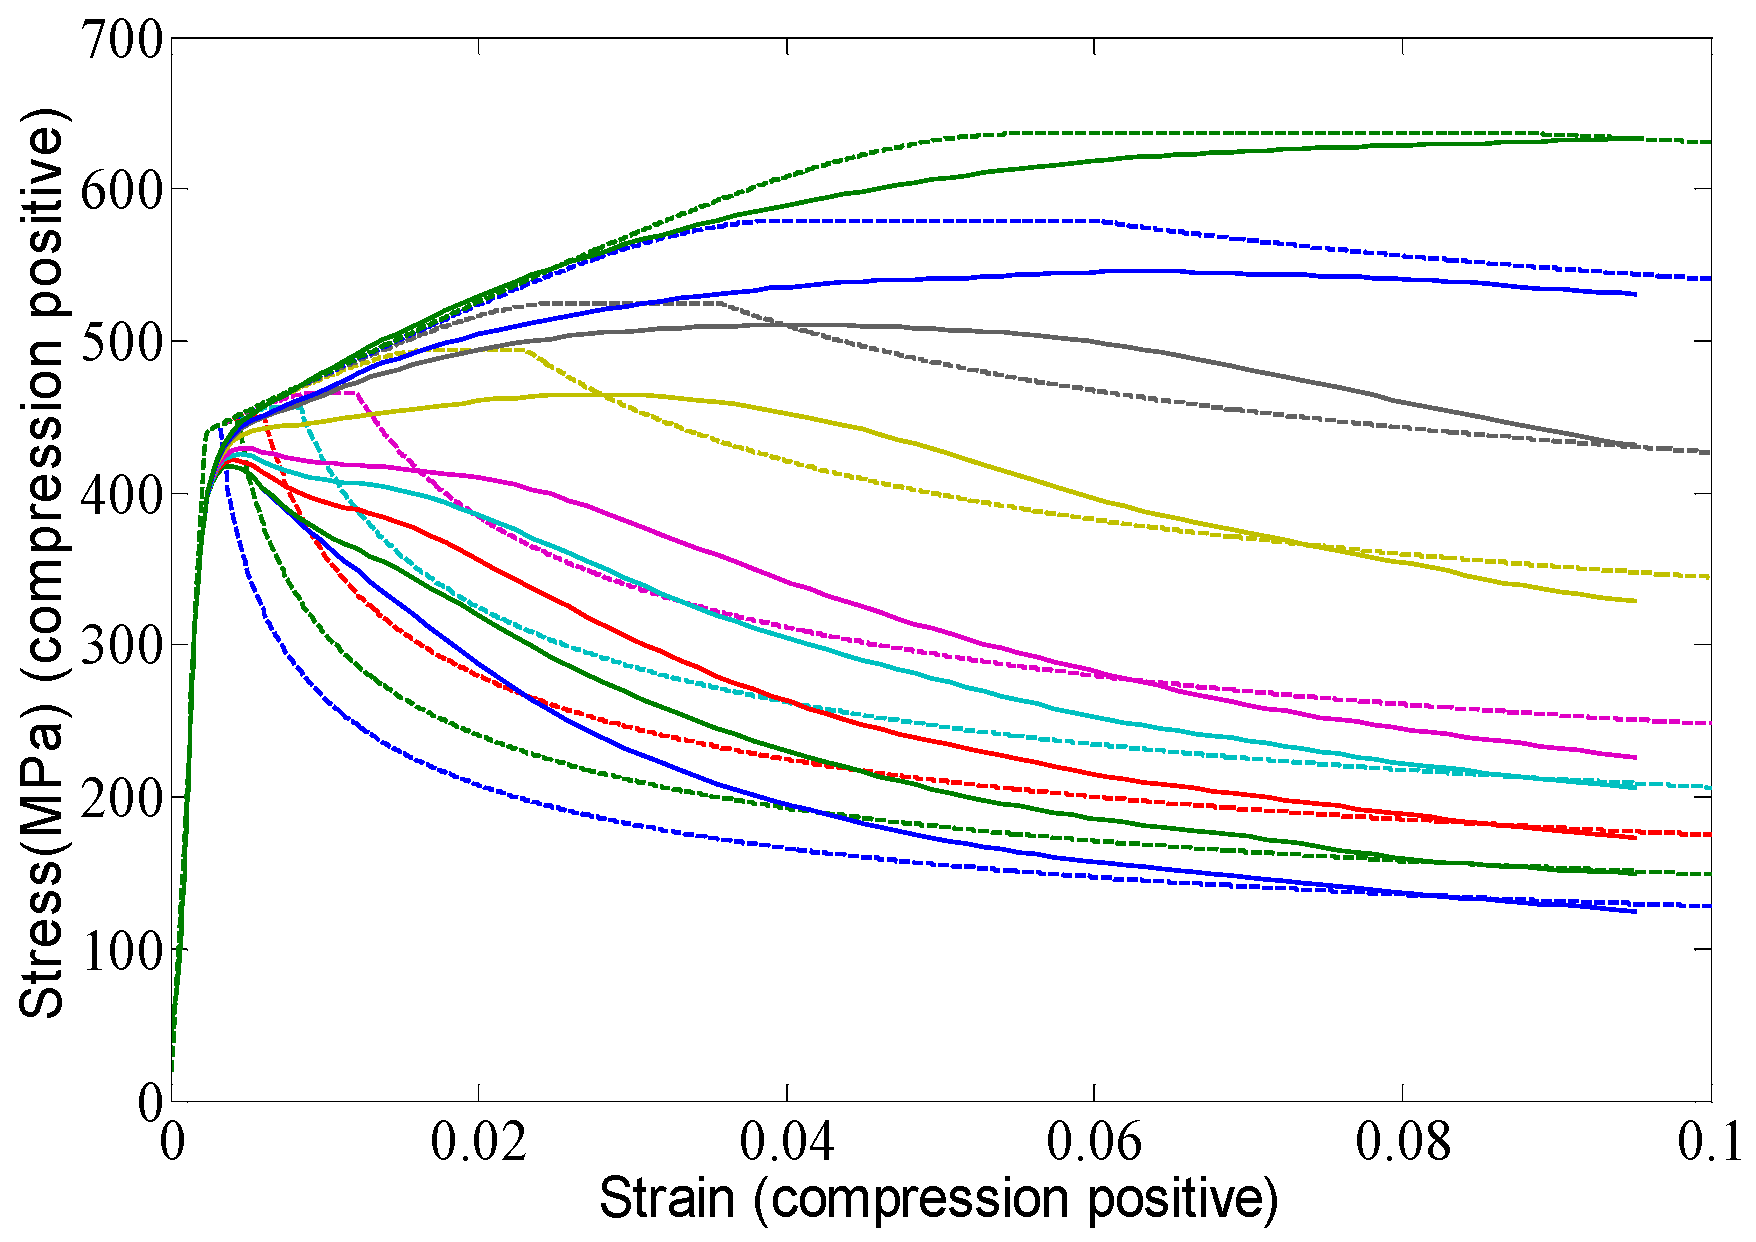
Figure 3.
Comparison between the numerical results and test results by Monti and Nuti [42] (Specimen slenderness ratio L/d = 1. Dot line: numerical results; Solid line: test results).
Figure 3.
Comparison between the numerical results and test results by Monti and Nuti [42] (Specimen slenderness ratio L/d = 1. Dot line: numerical results; Solid line: test results).

Figure 4.
Prediction results on a cyclic loading test of RC column by Lu [43] (side column specimen).
Figure 4.
Prediction results on a cyclic loading test of RC column by Lu [43] (side column specimen).
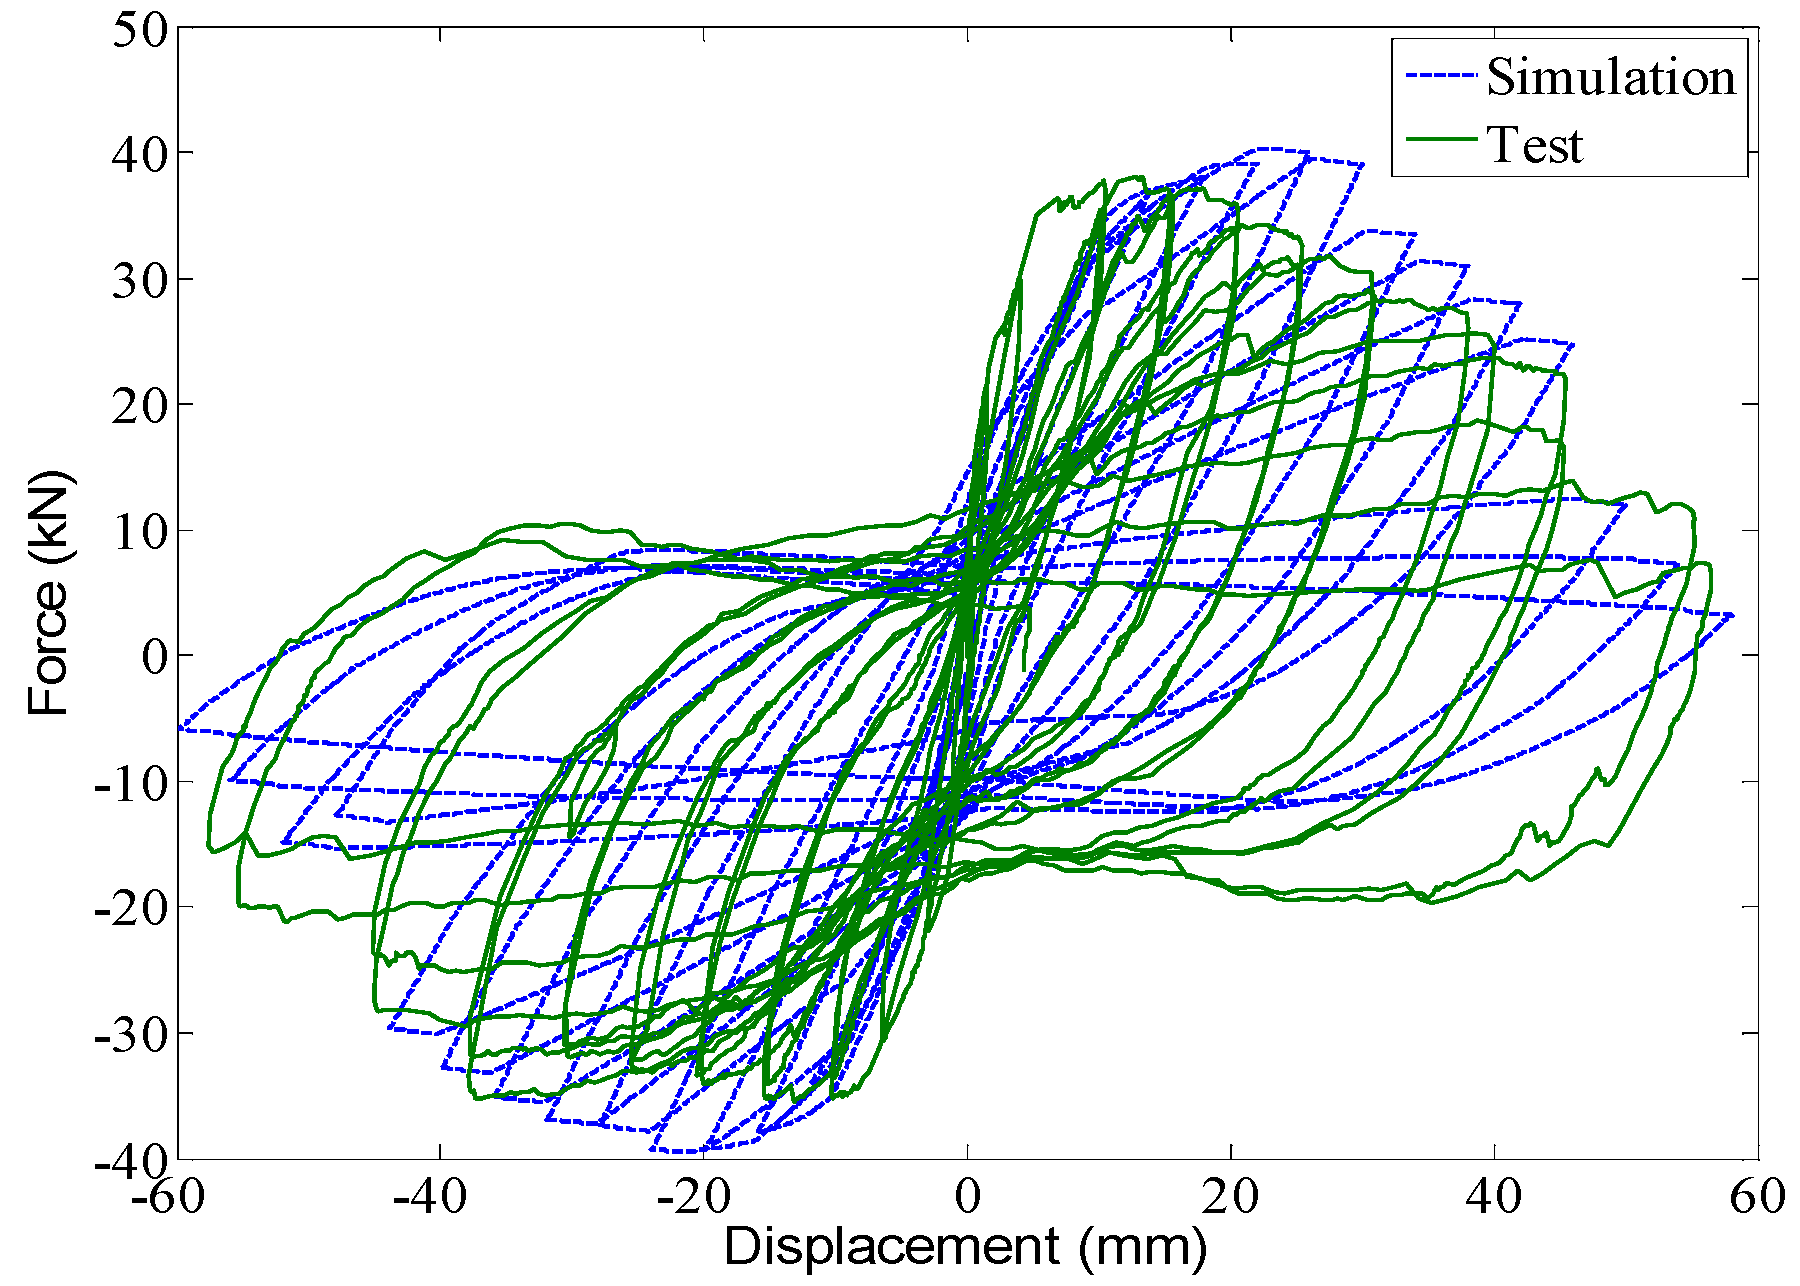
Figure 5.
Development of elemental damage index during the cyclic loading test of RC column.
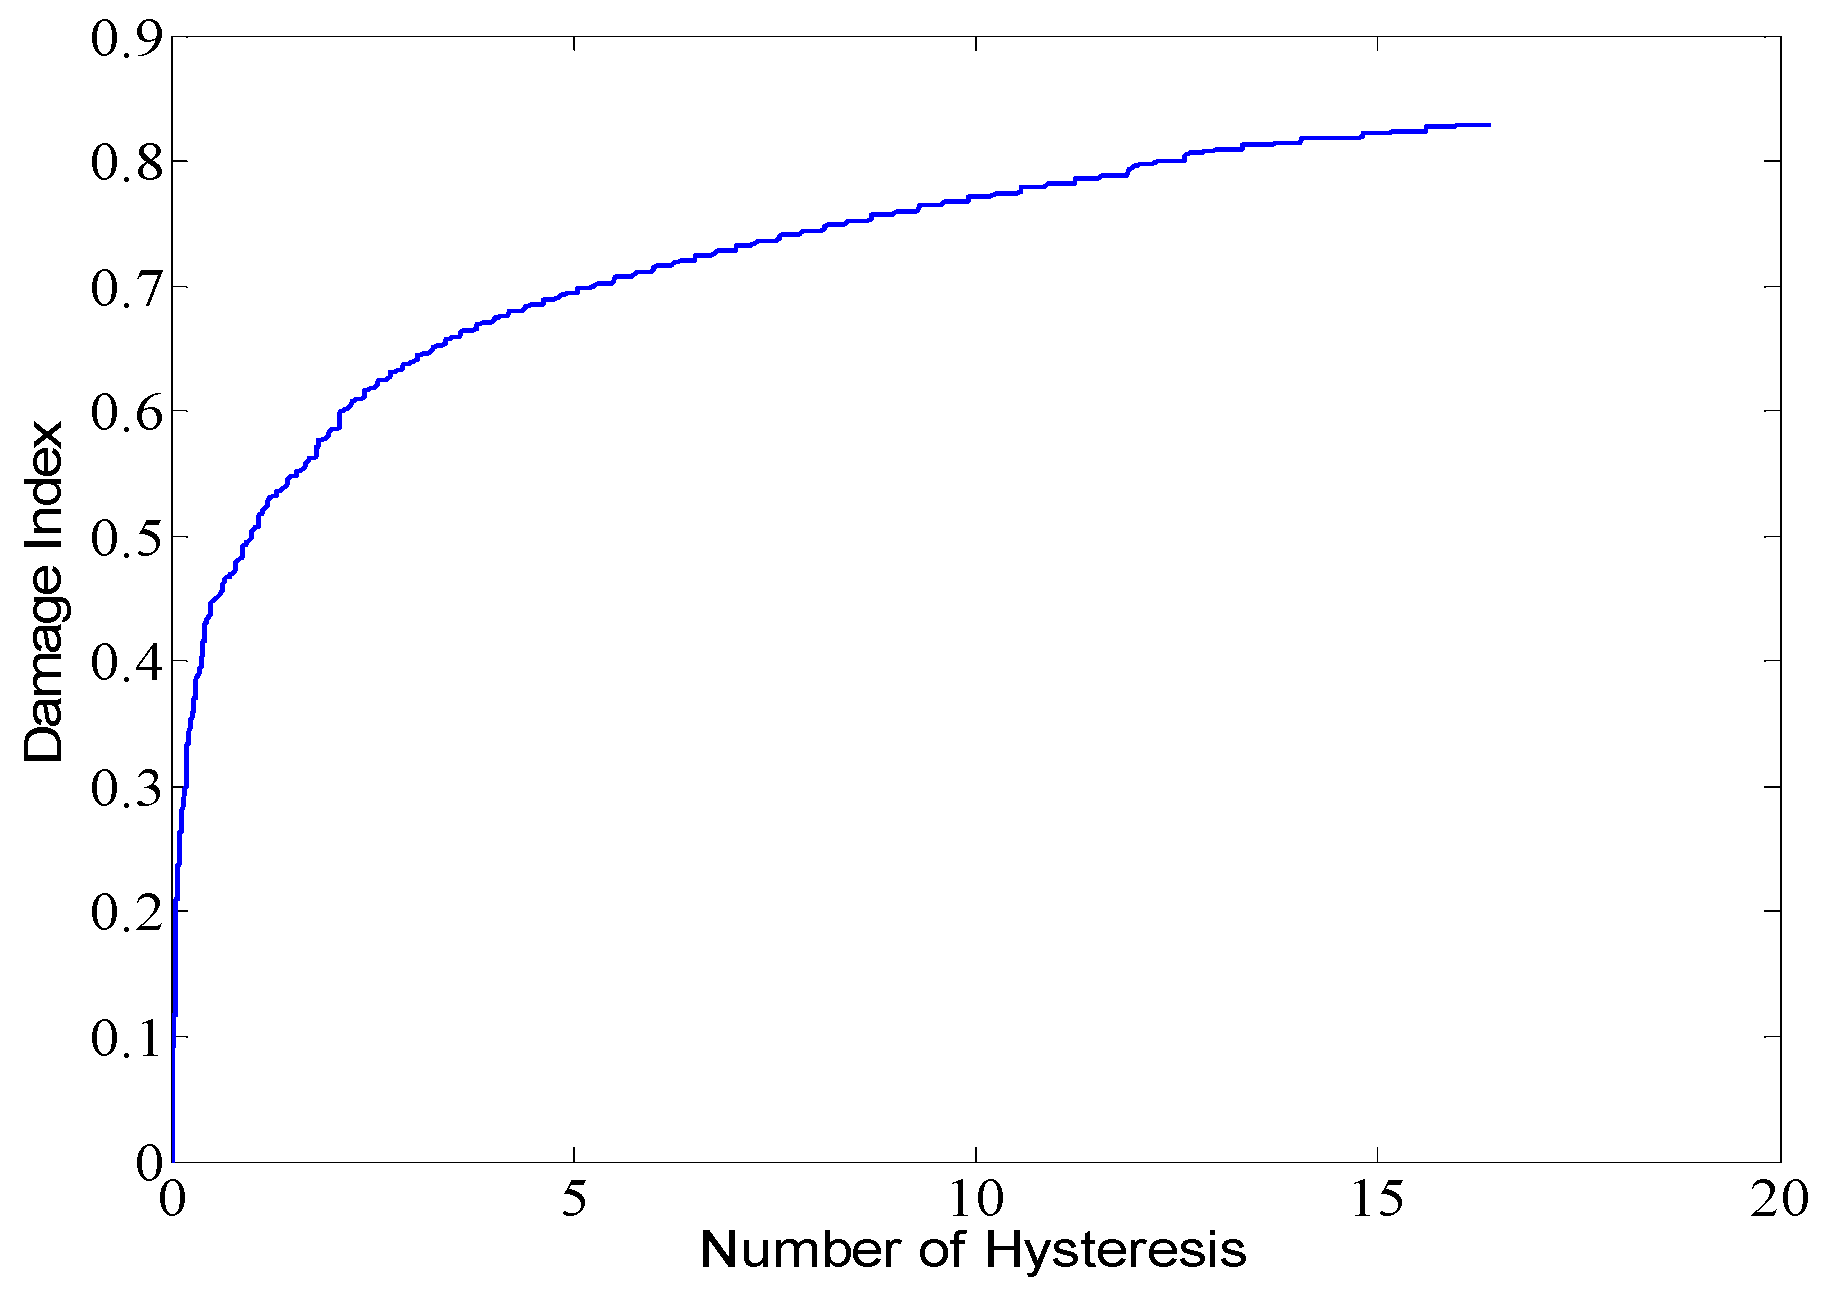
Figure 6.
Two typical situations in pounding of adjacent frame structures.

Figure 7.
RC frames used in pounding analysis.
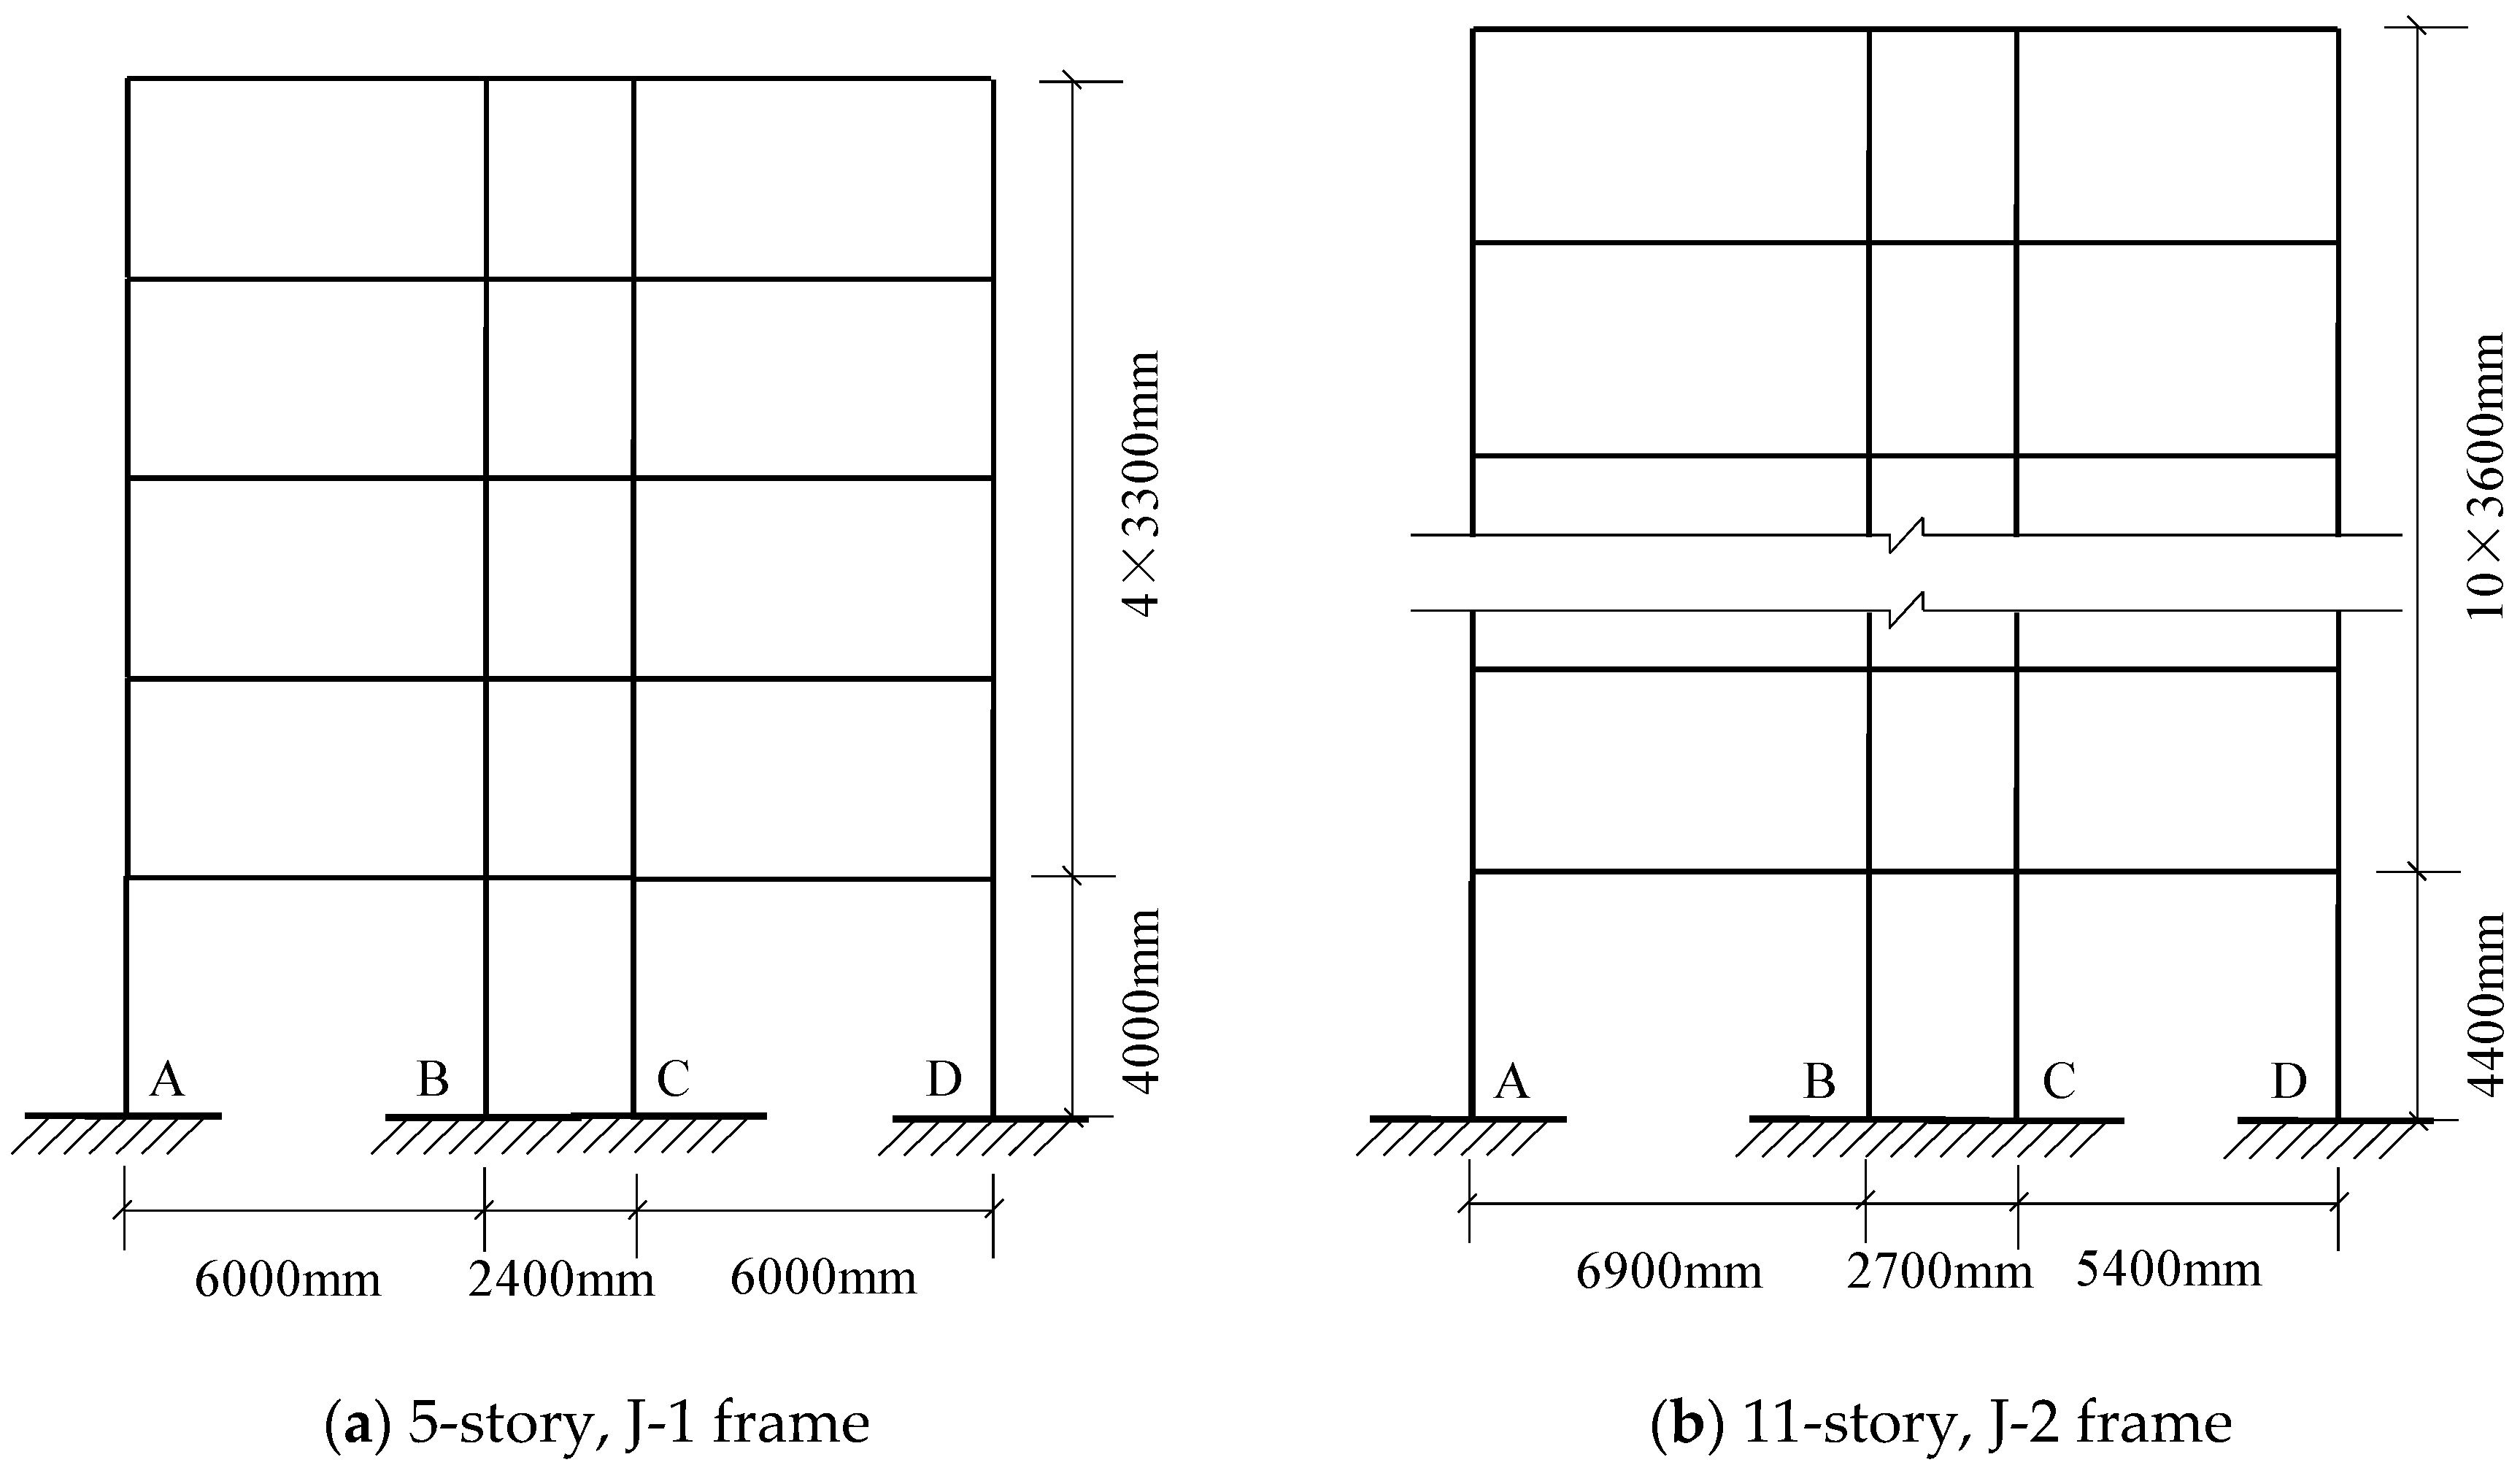
Figure 8.
Ground motion from 1979 Imperial Valley earthquake (El Centro, Array #5, 140).
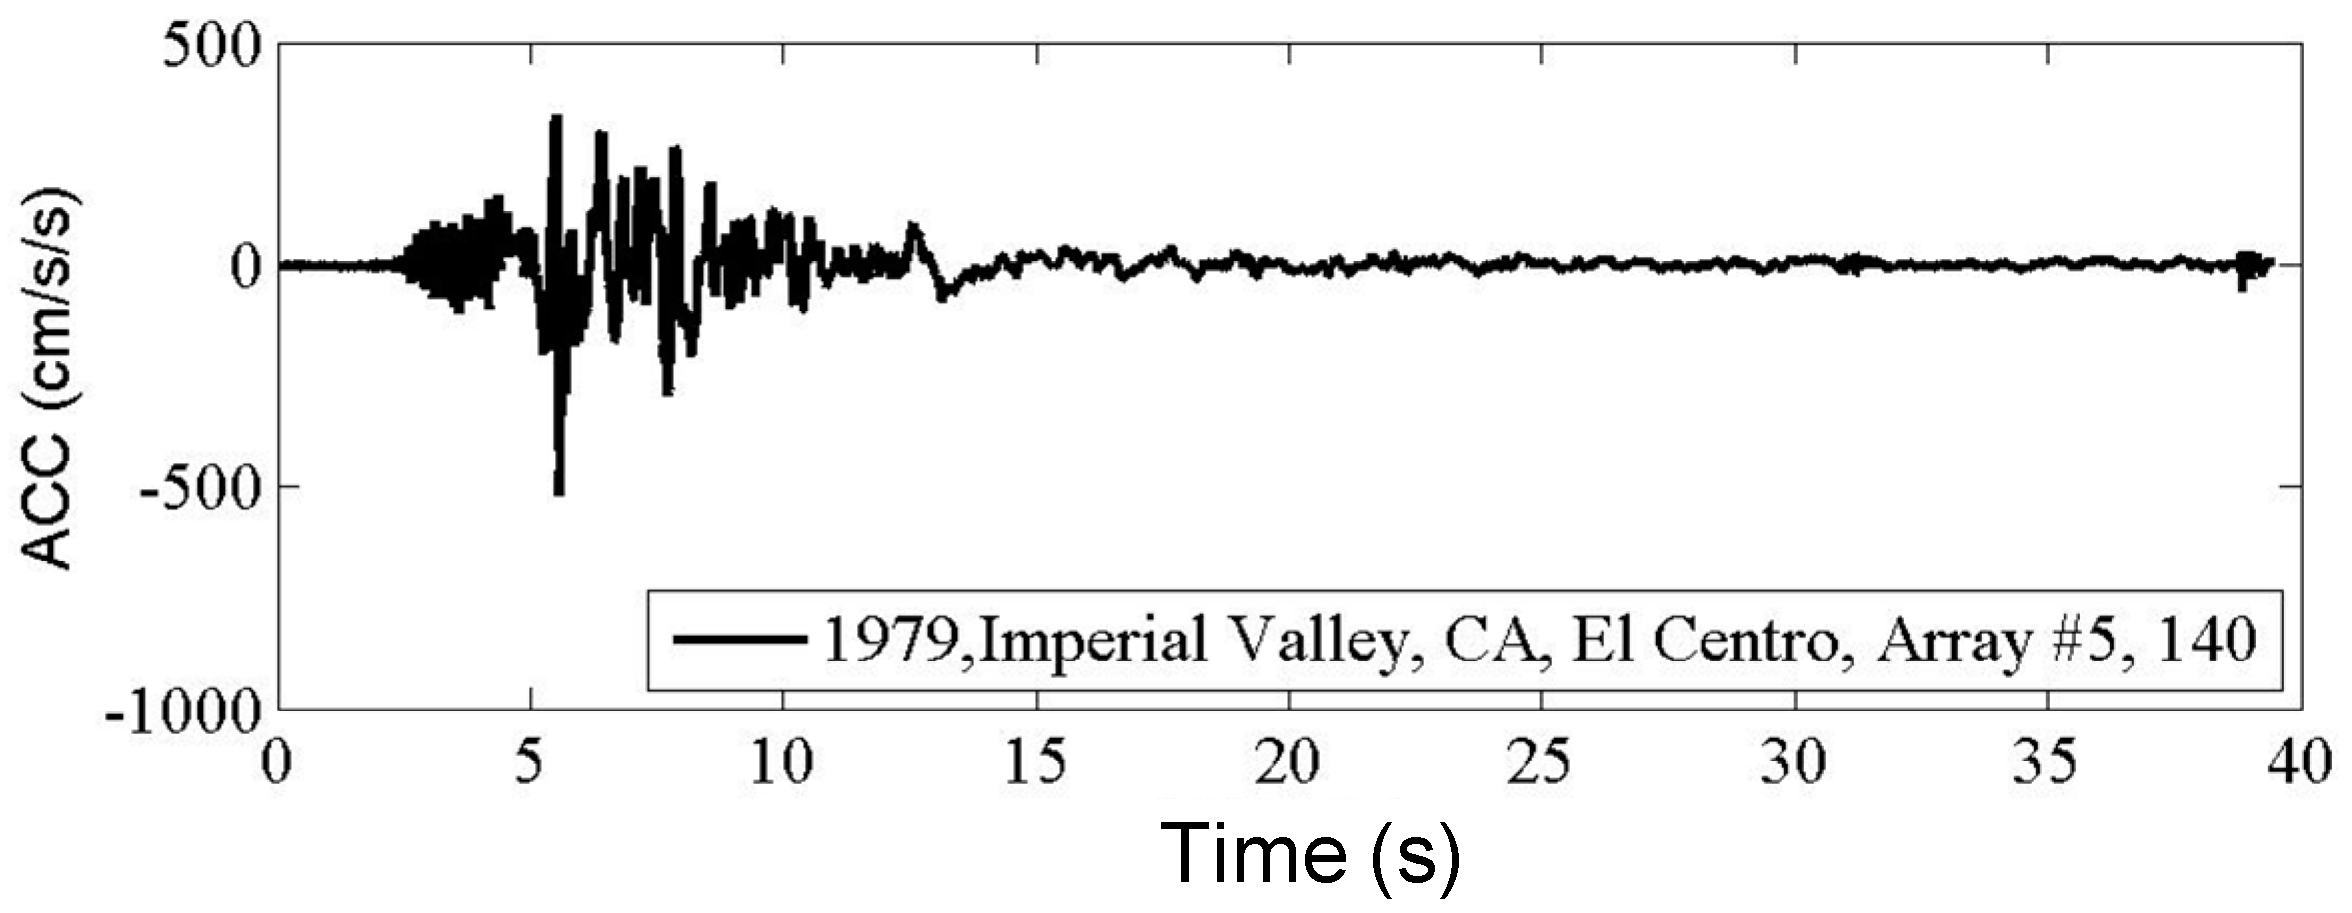
Figure 9.
Pounding forces at the 1st and 5th stories in axis D in J-1 RC frame under ground motion (El Centro, Array #5, 140). The separation gaps between two frames are D = 10 mm, 30 mm, 50 mm,70 mm, and 100 mm.
Figure 9.
Pounding forces at the 1st and 5th stories in axis D in J-1 RC frame under ground motion (El Centro, Array #5, 140). The separation gaps between two frames are D = 10 mm, 30 mm, 50 mm,70 mm, and 100 mm.
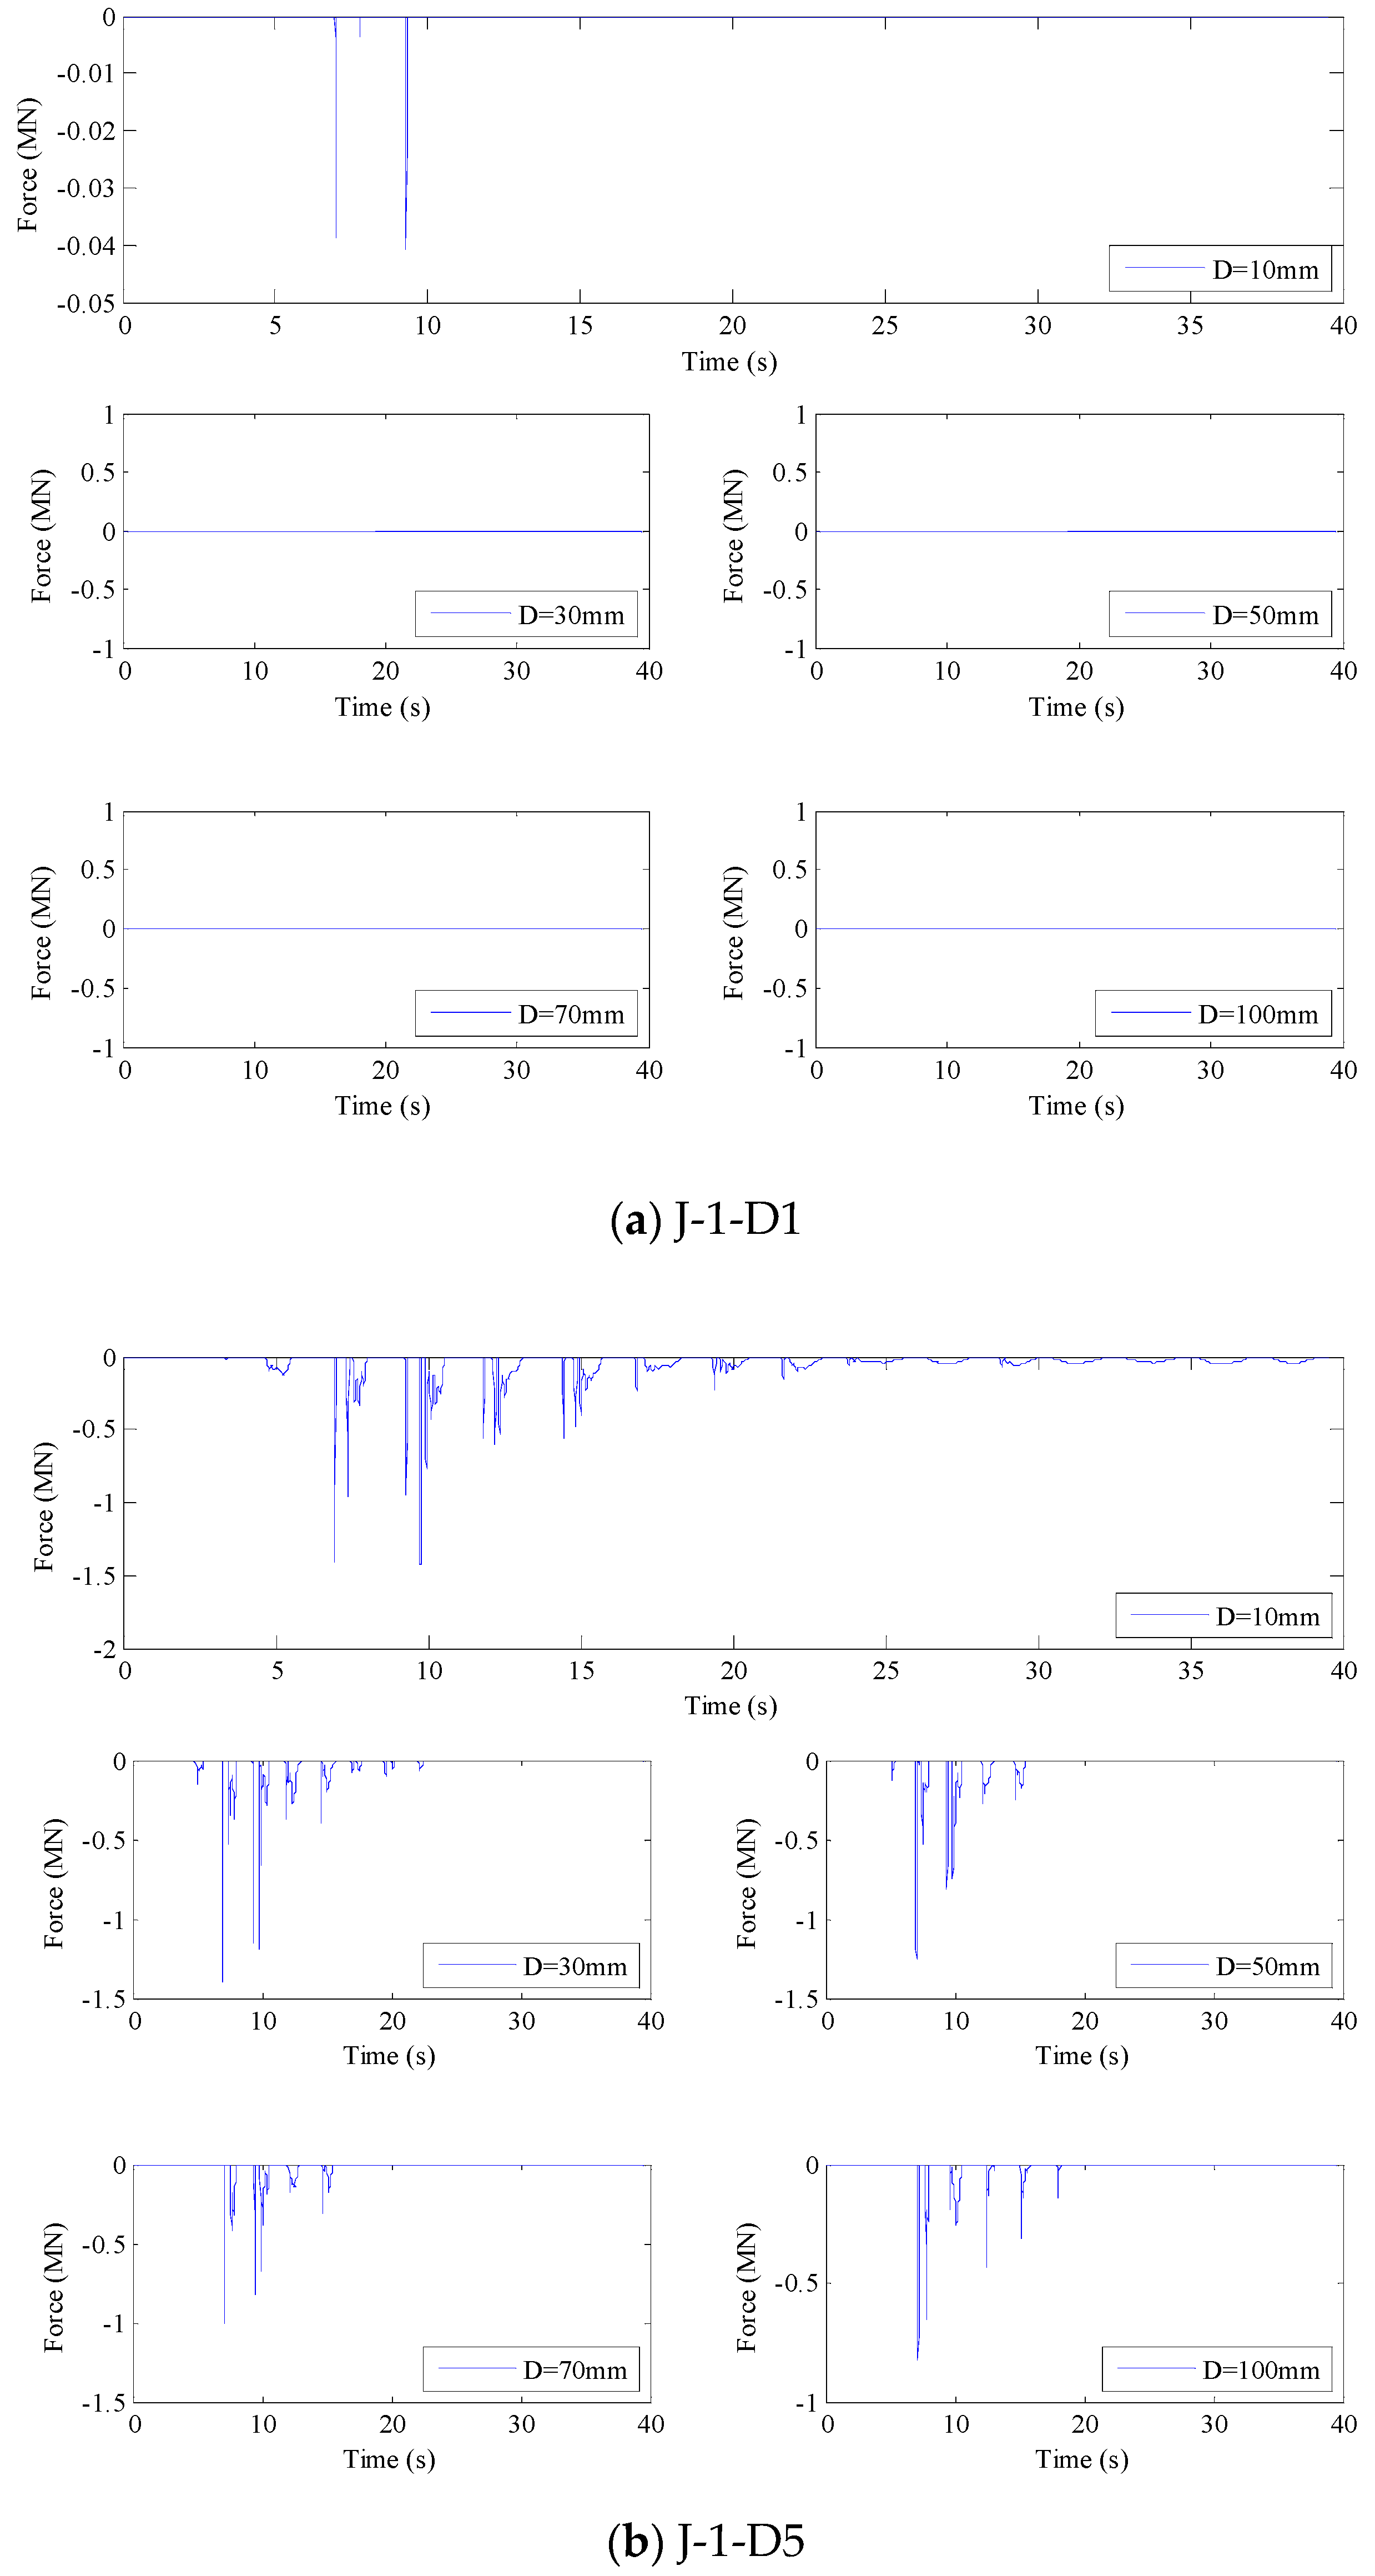
Figure 10.
Horizontal accelerations and displacements at the 1st and 5th stories in axis D in J-1 RC frame under ground motion (El Centro, Array #5, 140). The separation gaps between two frames are D = 10 mm, 30 mm, 50 mm,70 mm, and 100 mm.
Figure 10.
Horizontal accelerations and displacements at the 1st and 5th stories in axis D in J-1 RC frame under ground motion (El Centro, Array #5, 140). The separation gaps between two frames are D = 10 mm, 30 mm, 50 mm,70 mm, and 100 mm.


Figure 11.
Beam and column damage indices at the final states under ground motion (El Centro, Array #5, 140). (0 ![Sustainability 11 04928 i001]() 1).
1).
 1).
1).
Figure 11.
Beam and column damage indices at the final states under ground motion (El Centro, Array #5, 140). (0 ![Sustainability 11 04928 i001]() 1).
1).
1).
Figure 12.
Structural damage index varied with the separation gap under ground motion (El Centro, Array #5, 140).
Figure 12.
Structural damage index varied with the separation gap under ground motion (El Centro, Array #5, 140).
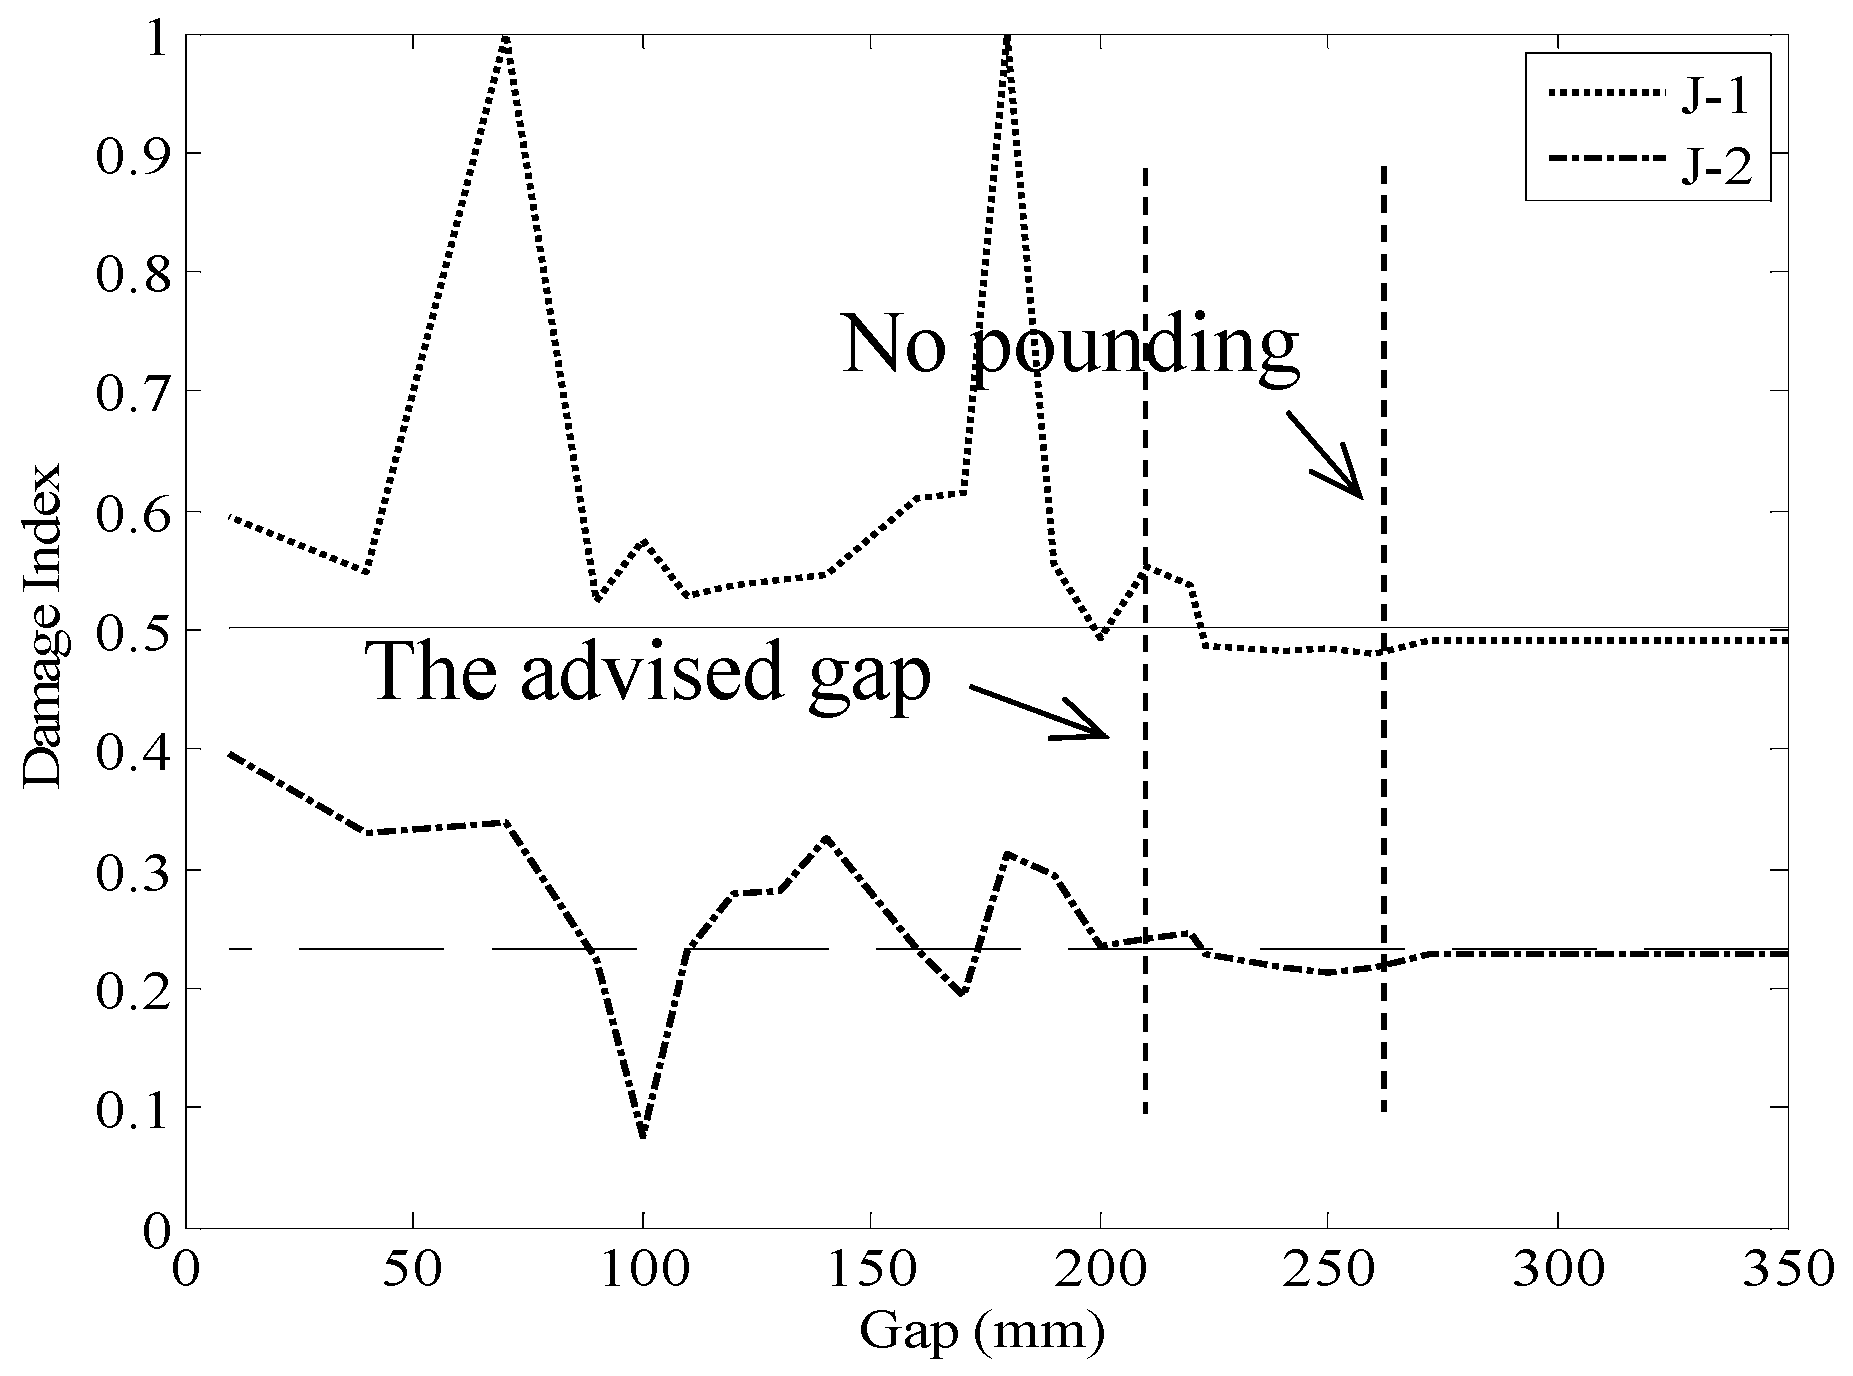
Figure 13.
Advised separation gap and required separation gap with no pounding.

Table 1.
The section and rebar information of beams in J-1 and J-2 frames.
| Frame | Floor | Concrete Type | Cross-Section Size (mm × mm) Height × Width | Beam Ends Area (mm2) | Middle Beam Area (mm2) | |||||||
|---|---|---|---|---|---|---|---|---|---|---|---|---|
| AB | BC | CD | A | B | C | D | AB | BC | CD | |||
| J-1 | 1–4 | C30 | 500 × 250 | 400 × 250 | 500 × 250 | 1008 | 1008 | 1008 | 1008 | 763 | 763 | 763 |
| 5 | C30 | 500 × 250 | 400 × 250 | 500 × 250 | 763 | 763 | 763 | 763 | 763 | 603 | 763 | |
| J-2 | 1–4 | C30 | 600 × 250 | 400 × 250 | 500 × 250 | 1610 | 1964 | 1964 | 1473 | 833 | 1074 | 833 |
| 5–6 | C30 | 600 × 250 | 400 × 250 | 500 × 250 | 1610 | 1964 | 1964 | 1473 | 833 | 833 | 710 | |
| 7–10 | C30 | 600 × 250 | 400 × 250 | 500 × 250 | 1256 | 1256 | 1256 | 1256 | 833 | 710 | 603 | |
| 11 | C30 | 600 × 250 | 400 × 250 | 500 × 250 | 942 | 942 | 942 | 829 | 833 | 710 | 603 | |
Note: As shown in Figure 7, AB, BC, and CD are first, second, and third bays; A, B, C, and D are axes; the compressive strength is 30 MPa for concrete; the yielding strength is 400 MPa for longitudinal rebars; the yielding strength is 235 MPa for stirrups with Φ8@100/200; The rebars are continuing along the beam.
Table 2.
The section and rebar information of columns in J-1 and J-2 frames.
| Frame | Floor | Concrete Type | Cross-Section Size (mm × mm) | Area (mm2) | ||
|---|---|---|---|---|---|---|
| Side Column | Middle Column | Side Column | Middle Column | |||
| J-1 | 1–5 | C30 | 500 × 500 | 500 × 500 | 2512 | 2512 |
| J-2 | 1–6 | C30 | 600 × 600 | 600 × 600 | 3807 | 3807 |
| 7–11 | C30 | 550 × 550 | 550 × 550 | 3411 | 3411 | |
Note: The compressive strength is 30 MPa for concrete; the yielding strength is 400 MPa for longitudinal rebars; the yielding strength is 235 MPa for stirrups with Φ8@100/200.
Table 3.
The selected ground motion records (24 records).
| Number | Earthquake | Station | Direction |
|---|---|---|---|
| 1 | 1979, Imperial Valley, CA | El Centro, Array #5 | 140 |
| 2 | 1979, Imperial Valley, CA | El Centro, Array #5 | 230 |
| 3 | 1979, Imperial Valley, CA | Centro, Array #10 | 50 |
| 4 | 1979, Imperial Valley, CA | Centro, Array #10 | 320 |
| 5 | 1979, Imperial Valley, CA | Meloland Overpass FF | 270 |
| 6 | 1985, Michoacan, Mexico | La Union | 90 |
| 7 | 1985, Michoacan, Mexico | La Union | 180 |
| 8 | 1992, Landers-28 June | Amboy | 0 |
| 9 | 1992, Landers-28 June | Joshua Tree-Fire Station | 0 |
| 10 | 1994, Northridge | Canoga Park | S74E |
| 11 | 1994, Northridge | Canoga Park | S16W |
| 12 | 1992, Landers-28 June | Yermo-Fire Station | 270 |
| 13 | 1992, Landers-28 June | Yermo-Fire Station | 360 |
| 14 | 1949, Western Washington | Olympia Hwy Test Lab | 356 |
| 15 | 1995, Kobe | Takarazuka | 0 |
| 16 | 1995, Kobe | Takarazuka | 90 |
| 17 | 1979, Imperial Valley, CA | El Centro, Array #6 | 140 |
| 18 | 2001, Yongsheng, China | Qina | NS |
| 19 | 2001, Yongsheng, China | Qina | WE |
| 20 | 1976, Tangshan, China | Hujialou | NS |
| 21 | 1976, Tangshan, China | Hujialou | WE |
| 22 | 1996, Atushen, China | Xikeer | WE |
| 23 | 1976, Tangshan aftershock, China | Tianjin Hospital | NS |
| 24 | 1976, Tangshan aftershock, China | Tianjin Hospital | WE |
© 2019 by the authors. Licensee MDPI, Basel, Switzerland. This article is an open access article distributed under the terms and conditions of the Creative Commons Attribution (CC BY) license (http://creativecommons.org/licenses/by/4.0/).
Share and Cite
MDPI and ACS Style
Yang, Y.; Li, S. Development of a Refined Analysis Method for Earthquake-Induced Pounding between Adjacent RC Frame Structures. Sustainability 2019, 11, 4928. https://doi.org/10.3390/su11184928
AMA Style
Yang Y, Li S. Development of a Refined Analysis Method for Earthquake-Induced Pounding between Adjacent RC Frame Structures. Sustainability. 2019; 11(18):4928. https://doi.org/10.3390/su11184928
Chicago/Turabian StyleYang, Yongqiang, and Shuang Li. 2019. "Development of a Refined Analysis Method for Earthquake-Induced Pounding between Adjacent RC Frame Structures" Sustainability 11, no. 18: 4928. https://doi.org/10.3390/su11184928
Note that from the first issue of 2016, this journal uses article numbers instead of page numbers. See further details here.