Article

A Developed Framework for the Multi-District Ecological Compensation Standards Integrating Ecosystem Service Zoning in an Urban Area in China

1
National Research Center for Upper Yangtze Economy, Chongqing Technology and Business University, Chongqing 400067, China
2
School of Economics, Chongqing Technology and Business University, Chongqing 400067, China
3
School of River and Ocean Engineering, Chongqing Jiaotong University, Chongqing 400074, China
4
State Key Laboratory of Pollution Control and Resource Reuse, School of the Environment, Nanjing University, Nanjing 210023, China
5
School of Economics, Yunnan University, Yunnan 650500, China
*
Authors to whom correspondence should be addressed.
Sustainability 2019, 11(18), 4876; https://doi.org/10.3390/su11184876
Submission received: 26 June 2019 / Revised: 2 September 2019 / Accepted: 3 September 2019 / Published: 6 September 2019

Abstract

:
Ecological compensation is an effective means to adjust relationships among stakeholders in order to conserve and/or sustainably use ecosystem services. The current ecological compensation standards (ECS) do not well reflect the differences in ecological, social, and economic development. Thus, we took a typical urbanization area (the Suzhou–Wuxi–Changzhou region) in China as an example, because of its prominent contradiction between rapid socio-economic development and fragile ecosystem. Combined with the ecological, economic, and social conditions, the methods of ecosystem service value (ESV) evaluation, cluster analysis, and scenario analysis were used to propose an optimized spatial zoning method and optimal development scenario. Then, the ECS by different zones were determined by using ESV assessment, cost-benefit analysis, and contingent valuation method. The results showed that (1) the regions were divided into two categories, with a total of four zones: ESV output areas (synergetic development zones (SDZ) and ecological conservation zones (ECZ)) and ESV input areas (ecological degradation zones (EDegZ) and economic development zones (EDevZ)); (2) among five scenarios, the best development mode in the future was the protection and development scenario, which was consistent with the existing planning; and (3) the ECS for the SDZ should be paid about 1.94 billion Yuan/year, the ECZ should be paid about 0.80 billion Yuan/year, the ECS for the EDegZ should pay about 2.20–2.25 million Yuan/year, and the EDevZ should pay about 0.06–7.33 million Yuan/year. By feasibility analysis, the ESV input areas were fully capable of inter-regional compensation, which could promote the effective purchase of ecological services. The developed evaluation framework of ECS in this study can accurately provide a scientific basis for the determination of ecological compensation regulations and policies in the future.

1. Introduction

The sustainable supply of ecosystem services is fundamental for the sustainable development of society and nature [1,2]. It has been a long time since environmental externalities were first ignored by human activity [3]. As a result, the rapid development of urbanization expansion and regional economies has resulted in the deterioration of 60% of ecosystem services worldwide over the last 50 years [4,5]. Therefore, alleviating the contradiction between ecosystem protection and socio-economic development is an urgent task for every country, especially developing countries. In this context, ecological compensation has been proposed. It can transform external and non-market ecosystem services into an economic incentive to increase the enthusiasm of environmental protectors, and to increase ecosystem services while compensating for the losses of stakeholders [6]. Compared with punitive environmental protection measures, such as sewage tax and environmental tax, the aim of ecological compensation is to eliminate the negative effects of human activities and restore and improve the ecosystem service functions provided by ecosystems.
In China, ecological compensation is generally considered to be an institutional arrangement for regulating the economic interests of ecological protectors, beneficiaries, and saboteurs, according to the ecosystem service value (ESV), ecological protection costs, and development opportunity costs, among others [7]. Initially, ecological compensation was based on the polluter pays principle (PPP), which levied taxes on actors. Gradually, it has shifted from punishing negative externalities (environmental damage) to stimulating positive external behaviors (ecological protection). Nowadays, it is frequently employed in China, such as the ‘Grain–to–Green Program’ and ‘Returning–Farmland–to–Wetland Program’ [8,9].
As a key issue for ecological compensation, the evaluation of ecological compensation standards (ECS), which are related to compensation feasibility and effect, has attracted widespread attention from governments and scholars. To date, studies on ECS have mainly focused on regions [10], wetlands [11], forests [12], watersheds [6], and grasslands [13]. ECS can be determined by evaluating the investment and opportunity costs of preservers, benefits of beneficiaries, loss values due to ecosystem damage, and ESVs [14]. Several methods, such as the contingent valuation method (CVM) [9], ecological footprint method [15], ESV evaluation method [16,17], carbon stock balance method [18], and compensation computation method, based on quotient and pollutant concentration and environmental water capacity [3], have been used to estimate ECS, only considering one or two of the aspects mentioned above. Meanwhile, as ecological compensation is closely related to regional socio-economic development and the allocation of environmental resources, the lack of socio-economic ecological compensation mechanisms will serve to hinder eco-environmental conservation and sustainable development [19]. Thus, the determination of ECS should reflect the differences in ecological, social, and economic development [10].
In China, to ensure regional sustainable development, the central government has repeatedly emphasized the need to establish ecological compensation mechanisms, since the first proposed ecological compensation mechanism in 2005. In 2017, the report of the 19th National Congress of the Communist Party of China proposed the establishment of a market-oriented and diversified ecological compensation mechanism. From 2014, there have been about 150 ecological compensation policy documents and departmental regulations issued by the competent department of ecological compensation under the State Council, mainly focusing on forests, wetlands, watersheds, oceans, key ecological functional areas, and grasslands [20]. The total amount of ecological compensation funds allocated by the central government through fiscal transfer arrangements has reached nearly 80 billion Yuan since 2012 (the average exchange rate was 7.79 Yuan to 1 USD from 2000 to 2010, the same below). With the intensive implementation of a series of policies and measures, the framework of the national ecological compensation system was initially constructed. However, because of the late start of this work in China, there are still many problems in practice. Firstly, the source of compensation funds is singular; the source of the funds is mainly governmental funds. Secondly, the method of determining the compensation object is unreasonable. Ecological compensation only focuses on the classification of ecological types, while ignoring the consideration of the values of forest land, waters, and even ecosystems as a whole. Finally, the compensation standard is low and lacks of diversity. At present, the determination of ECS is based on the government’s payment capacity, ignoring the opportunity costs for farmers and herders [21]. Additionally, ECS on a large scale is usually “one size fits all”, without considering the differences in ecosystems and the affordability of compensators [22]. Thus, it is of high importance to explore effective and differentiated multi-district ECS for China, in order to improve the EC mechanism.
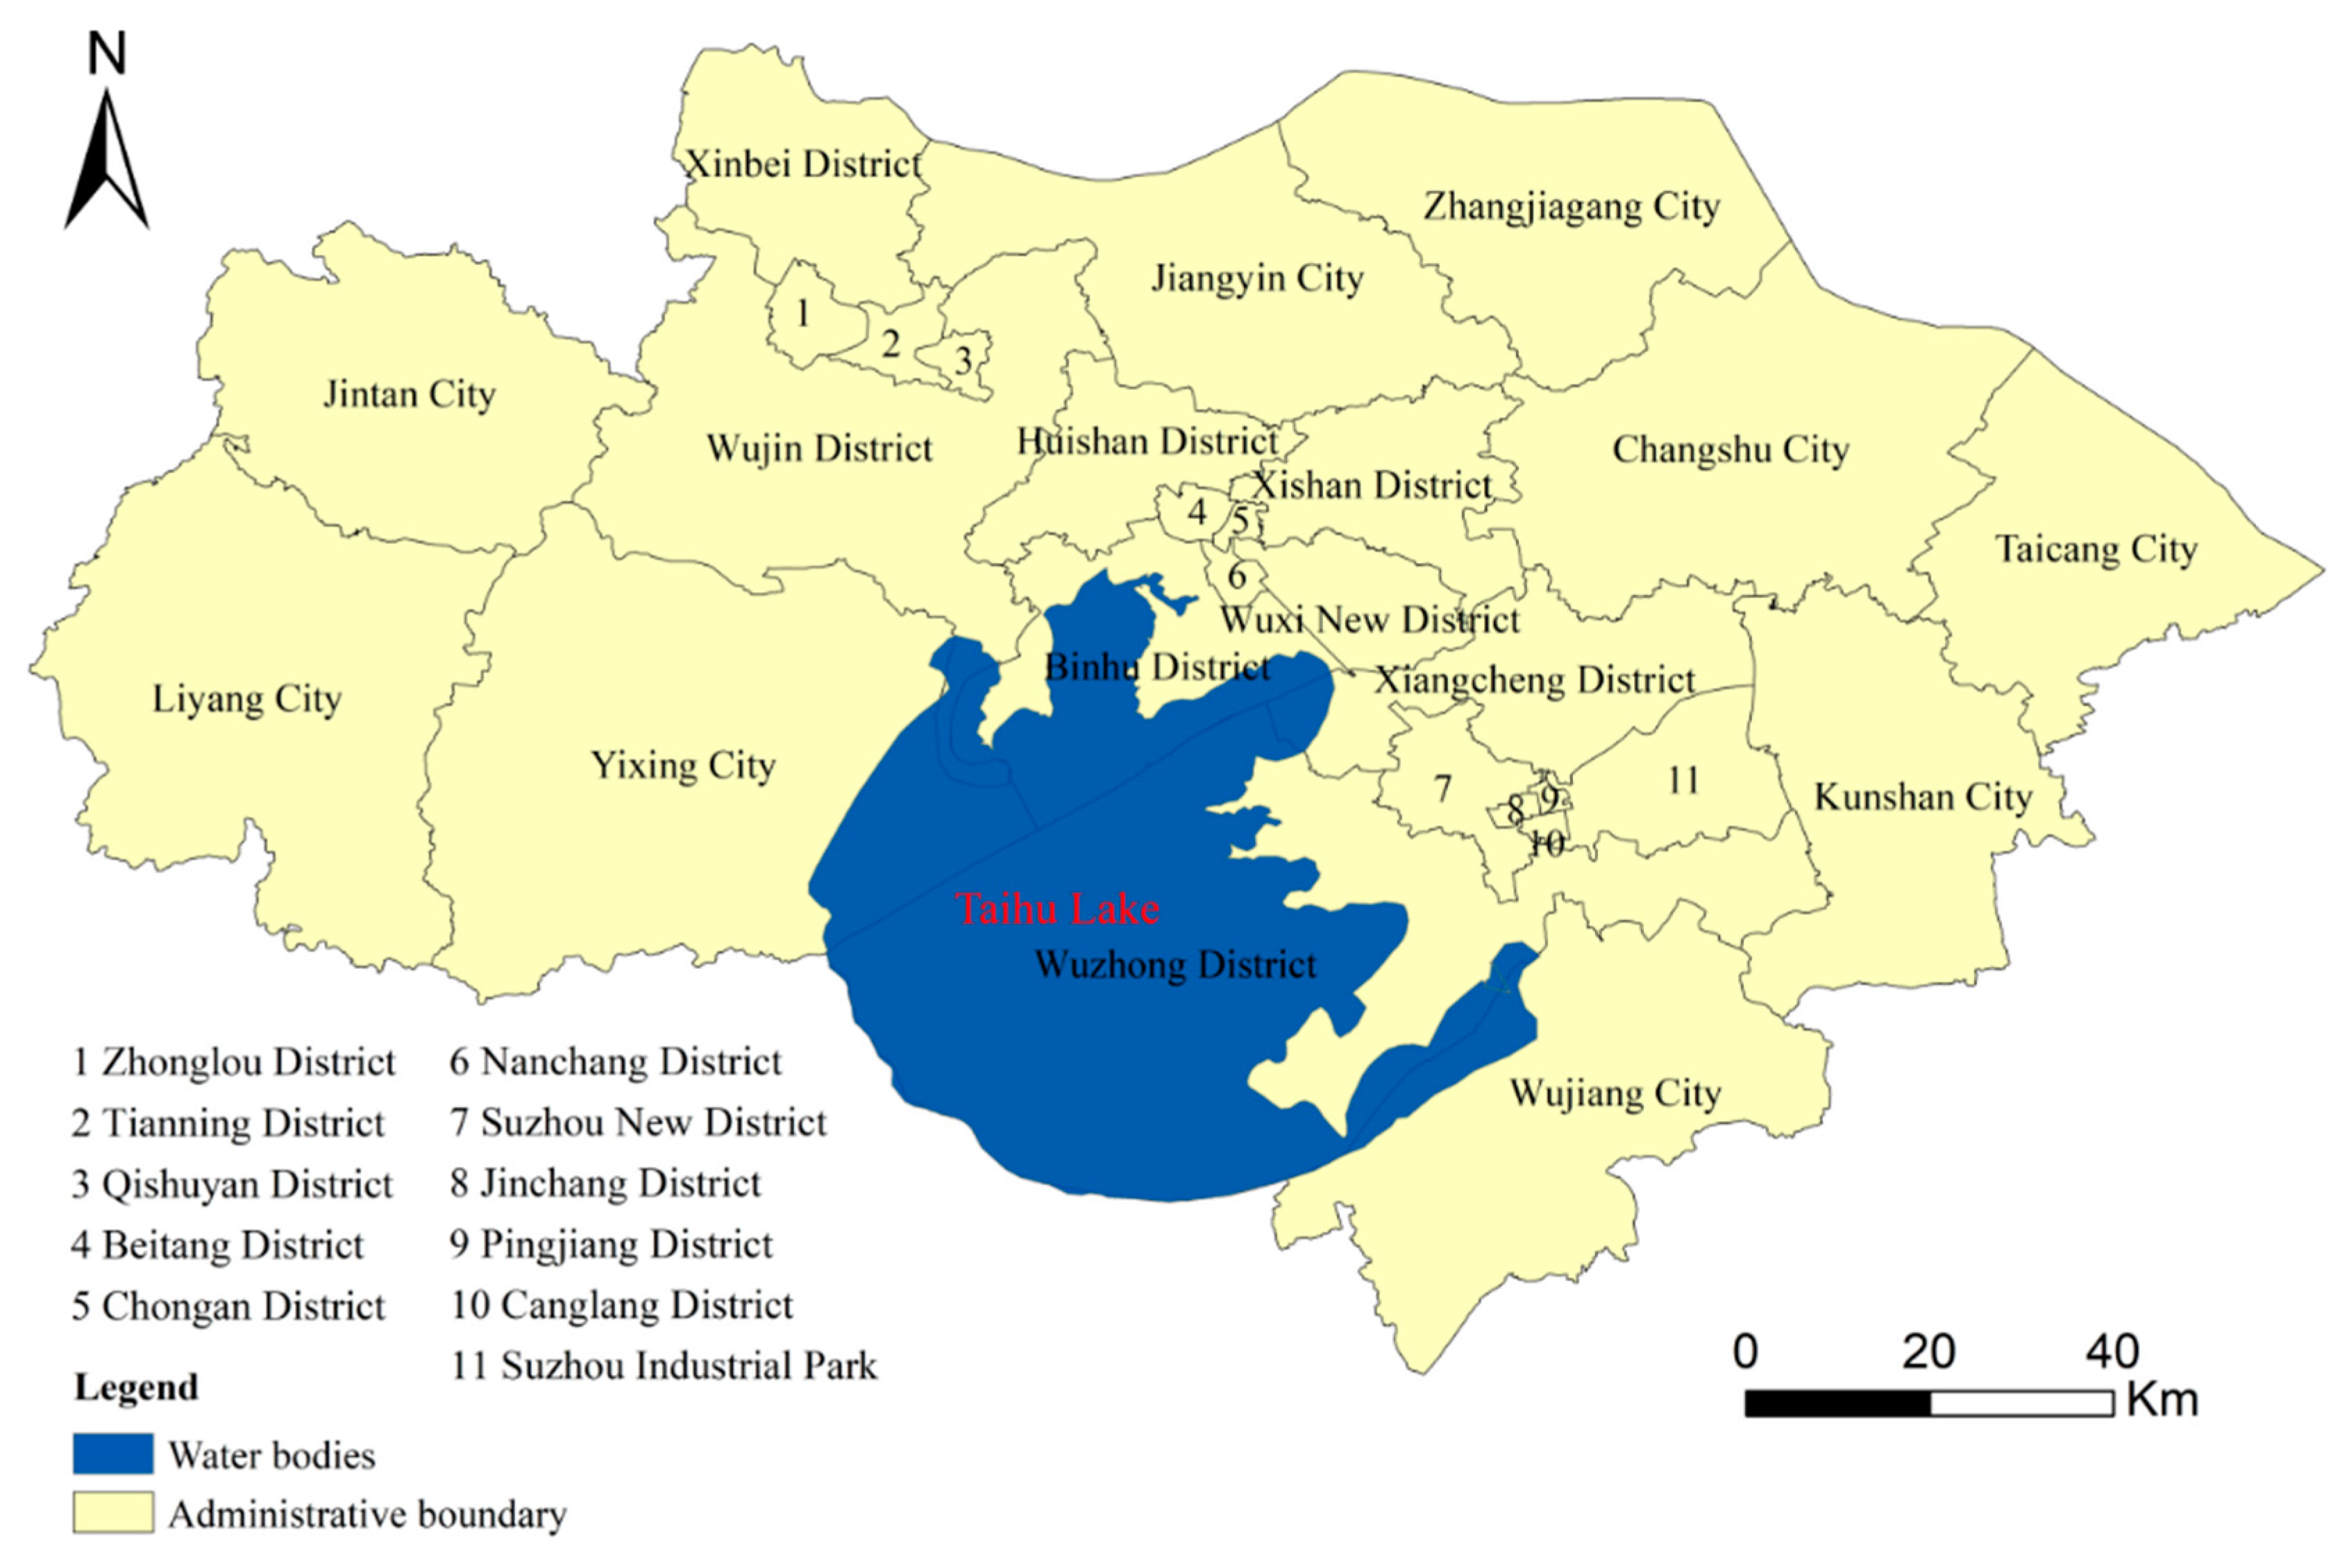
To address this problem, this paper takes a typical urbanization area (the Suzhou–Wuxi–Changzhou region, SWCR) in China as an example. It is the core area of the Yangtze River Delta city cluster, one of six world-class city clusters. In China, Jiangsu Province, where the SWCR is located, was ranked fifth in terms of urbanization rate in 2018. It is one of the most developed regions and is a highly urbanized region in China. At the same time, the ecological environmental challenges in this area were also staggering. In particular, the outbreak of blue algae in Lake Taihu in 2007 garnered global attention [
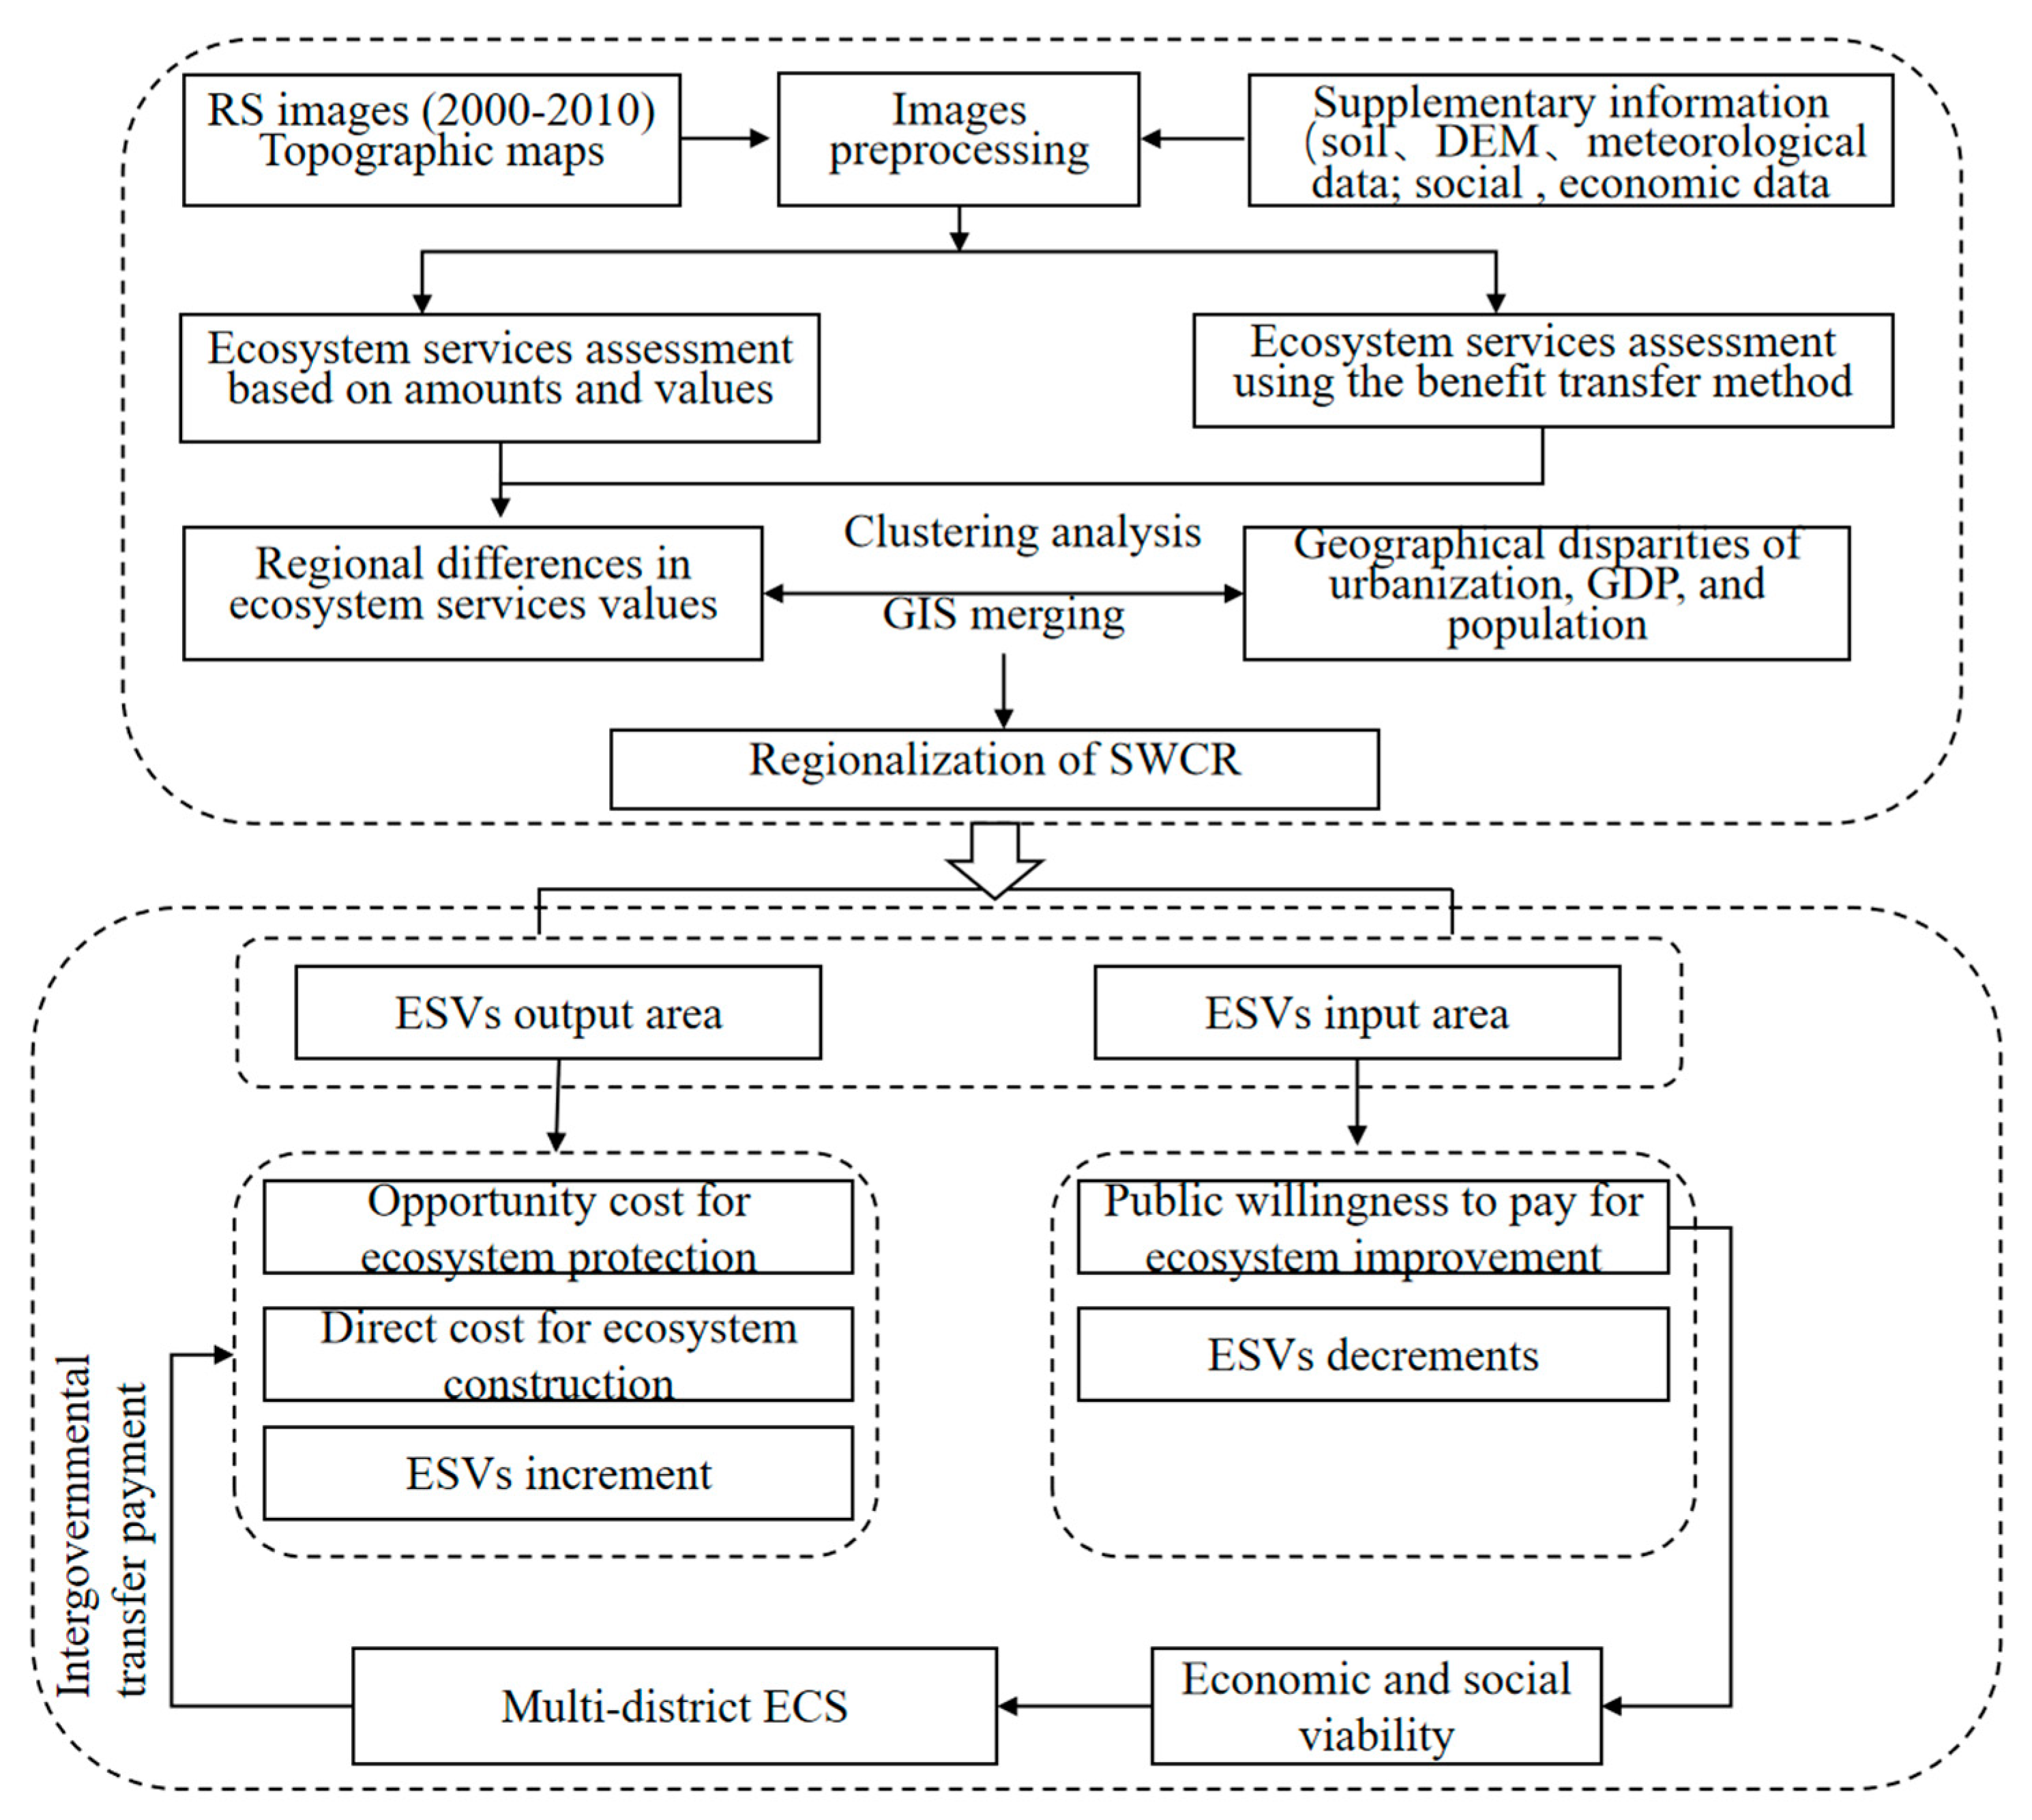
23]. Subsequently, as the current evaluation methods of ECS do not well reflect the differences in ecological, social, and economic development, we developed an evaluation framework for multi-district ECS. Evaluation methods of “matter quantity–value quantity”, spatial clustering analysis, and scenario analysis were used to quantitatively analyze and regionalize ESVs. According to the costs of the ecological protection area by benefit–cost analysis and the public’s willingness to pay (WTP) for the beneficiary area by CVM, ECS by different zones were put forward. This study has theoretical and practical significance for guiding the rational formulation of ECS. The objective of this study was to answer two questions: (1) “who compensates whom?”; and (2) “how much should be compensated in multiple districts with different ecological, economic, and social conditions?”

2. Methods and Data Sources

2.1. Study Area

Taihu Lake is the third largest freshwater lake in China. It is situated in the Yangtze Delta, which has a surface area of approximately 2338 km2 [24]. The SWCR consists of three cities, as well as the districts and cities under their jurisdiction, and is an important part of the Yangtze River Delta, which, in turn, is an important part of the Yangtze Delta. There are 28 county-level cities and districts in this region (Figure 1). The SWCR is one of the most urbanized regions in China. The average urbanization rate in 2017 was 74.5%, which was 1.27 times the national average. With rapid economic development and urban expansion, the Taihu Lake ecosystem experienced serious deterioration, which is of great concern to the local and central authorities of China [25]. In order to effectively protect and restore the environment, a series of regulations were introduced by the provincial government, such as the ‘Interim measures on transfer payment of ecological compensation in Jiangsu Province (2013)’ and the ‘National ecological protection red-line planning of Jiangsu Province (2018)’ [26,27]. Nevertheless, economic and social attributes have not been integrated into the current ecological compensation mechanism. Thus, determining a differentiated multi-district ECS by taking account of ecological, economic, and social conditions for ecological protection in SWCR is imperative.

2.2. Research Framework

At present, because of the lack of a conceptual framework for indicator selection and evaluation methods for ESVs, as well as the huge gap between ESVs and compensation standards, the evaluation results have only been considered as a theoretical upper limit for compensation [28]. That is, ECS should not only be determined by the ESVs, but also take into account other economic and social factors. Thus, in order to provide a scientific basis to establish ecological compensation mechanisms for the multiple districts, especially for a typical urbanized area, we established the framework of multi-district ECS based on the valuation and regionalization of ESVs, the beneficiaries’ WTP, and the benefit–cost analysis of compensation investment (Figure 2), which can be used to calculate the compensation value for the complex urban ecosystems. However, a variety of studies have proposed ecological function regionalization schemes or land management by evaluating ecosystem services with one-year data [29]. Ecological regionalization should be based on a dynamic evaluation in the long run [30]. Unfortunately, the current studies have rarely used incremental ESVs over a period of time (positive or negative) as an indicator of regionalization schemes. Thus, this study introduces estimated two-year changes (2000 and 2010) in ESVs into the regionalization framework, which can provide a basis for the further determination of differential ECS.
A typical fast urbanized region should ideally have an urban center with a high degree of economic and population concentration, as well as an urban ecological protection area with relatively low economic development. We also supposed that the study area could be divided into ESV output areas and ESV input areas. The ESV output areas have no opportunity for economic and social development, due to the protection of the ecological environment, and ESV input areas should compensate for the ecological benefits, ecological protection costs, and opportunity costs. ESV input areas destroy the ecological environment in order to develop the economy. These areas should pay for lost ecological benefits, and the public’s WTP for the restoration of the ecological environment should be considered accordingly. However, in the process of exploring and practicing multi-district ecological compensation in China, there were some problems, such as disconnection of interests between ecological beneficiaries and protectors, narrow compensation scope, and unreasonable compensation standards. Therefore, the multi-district ecological compensation should be based on the principle of “benefiting the protectors and compensating the users”. In comprehensive consideration of ecological protection costs, development opportunity costs, and ESVs, financial transfer payments or market transactions should be adopted to give reasonable compensation to the eco-protectors. This is an effective system that clearly defines the rights and obligations of the ecological protectors and beneficiaries and internalizes economic externalities of ecological protection.
On the basis of the information the above, we established the framework of ECS for an urbanization region, involving four steps (Figure 2). First, we adopted a method that combined valuation methods of matter quantity and value quantity, established an evaluation system of ESVs in the SWCR, and quantified the spatial heterogeneity of the changes of ESVs on the scale of cities and districts. Next, the levels of economy, society, and urbanization of the study area were also assessed. Additionally, the study area was divided into ESV output areas and ESV input areas, according to ecological, economic, and social conditions. Finally, the differential multi-district ECS were developed by investigating the costs and benefits of the ESV output areas, the public WTP for ecosystem improvement, and ESV decrements of the ESV input areas. The developed framework proposed in this study can not only help decision-makers to realize the spatial distribution of ESVs, but also help to establish policy decisions for differentiated ECS.

2.3. Data Sources

The data involved in this study included population, economy, urbanization, land-use data, and a vector diagram of administrative division, precipitation, and soil data. Socioeconomic data included population, economic, and urbanization data from 2000 and 2010, which were derived from the statistical yearbook and yearbook of each city (published in 2001 and 2011, respectively) [31,32,33]. Land-use data in 2000 and 2010 were from the land-use database with a scale of 1:100,000, provided by the National Earth System Science Data Sharing Infrastructure, National Science and Technology Infrastructure of China. The data were manually interpreted, mainly based on the Landsat-5 TM data. A large amount of field investigation has proven that land-use classification had an accuracy of more than 90% [34]. The land-use classification adopted the six categories of land use/cover classification based on the Resource and Environment Information Database of the Chinese Academy of Sciences. The land-use types in the study area were divided into six categories, including agricultural land, wetland, forest land, grassland, construction land, and unutilized land, according to the land-use characteristics and image resolution of the SWCR. Wetlands referred to riverine wetland, pond, reservoir, and marshland. Construction lands included urban/rural settlements and associated facilities, stand-alone industrial zones, and quarries. Unutilized land included bare land, saline-alkali land, sandy land, bare rock, gravel, etc. To evaluate soil conservation values, the monthly rainfall values from 200 weather stations in and around the SWCR were taken from the Hydrological Yearbook of the People’s Republic of China in 2000 and 2010 [35]. Soil data were the main input to the universal soil loss equation (USLE) model for estimating soil erosion factor. A set of 26 soil samples were obtained from China’s second soil survey (http://gis.soil.csdb.cn/).

2.4. Methodology

2.4.1. Valuation and Regionalization of ESVs

Assigning a value to ecosystem services requires a quantitative evaluation of ecosystem services in terms of their monetary value. On the basis of the widely accepted ecosystem services evaluation methods of “matter quantity–value quantity” [36], this paper adopted these methods to evaluate 10 kinds of ESV, such as waste treatment value, hydrological regulation value, carbon sequestration value, and keeping soil fertility value (see Figure 3). We estimated the ESVs using the methods detailed in He et al. (2018) [37].
The transfer benefits method modified the coeffcients of Xie et al. (2008) [38] based on the actual situation of the SWCR. The modified method of coeffcients was as follows: (1) working out the average grain yield per unit area (6813 kg/ha) by the grain yield of the SWCR in 2000 and 2010; (2) according to the subsidy standard of national returning farmland to forest in the first stage (2000–2010), grain price was 1.4 Yuan/kg; (3) in the absence of labor input, the coefficient of natural ecosystem provided the economic value was 0.143, and we could obtain the average economic value of natural grain output in 2000–2010 as being 1363 Yuan/ha, namely the reference prices of different ESVs in our study.
The spatial hierarchical clustering method applied in this study can be completed using SPSS 18.0 and ArcGIS 10.0. First, after data standardization, based on the method of R-cluster analysis and expert consultation, we screened the impact factors of the change of ESVs as much as possible and, finally, four factors—the changes of ESVs (ten kinds of ESVs), the changes of population density (the number of people per a given unit of land area), the changes of Gross Domestic Product (GDP) per unit area, and the changes of urban expansion intensity of 28 cities and districts—were confirmed between 2000 to 2010. Second, the similarity coefficients of each city and district were calculated using the Euclidean distance, and then the Q-cluster method was applied to zone the 28 cities and districts.

2.4.2. Scenarios

The scenario approach can reveal the changes of ecosystem services for different land-use patterns in the future, which is of great significance for land-use decisions and ecosystem management [39]. In this study, we adopted the modified benefit transfer method (BTM) of He et al. (2018) [37] to estimate the ESVs of SWCR using 2010 as the base year. According to the characteristics of urban expansion and agricultural land protection in the study area, wetlands were mainly transferred from agricultural land in 1995–2010 (data not shown); by 2020, agricultural land can only decrease by 1.85% compared with 2010, while construction land can increase by 9%, as mentioned in the General Land Use Plan of Suzhou City, General Land Use Plan of Wuxi City, and General Land Use Plan of Changzhou City. Thus, five possible scenarios alternative to the land-use changes in 2020 were analyzed and simulated as follows: scenario I (ecological protection scenario), all agricultural lands within 20 m around the wetland are converted into wetlands; scenario II (urban development scenario), all the land-use types within 20 m around the construction lands are converted into construction lands; scenario III (both protection and development scenario), all the agricultural lands within 20 m around the wetland are converted into wetlands and all the land-use types within 20 m around the construction lands are converted into construction lands, respectively; scenario IV (development priority over protection scenario), all the agricultural lands within 20 m around the wetland are converted into wetlands and all the land-use types within 50 m around the construction lands are converted into construction lands, respectively; scenario V (protection priority over development scenario), all the agricultural lands within 50 m around the wetland are converted into wetlands and all the land-use types within 20 m around the construction lands are converted into construction lands, respectively. These extreme cases may help assess the potential changes of the SWCR’s ESVs under extreme land-use conditions.

2.4.3. Benefits and Costs of ESV Output Areas

Because of ecological protection, the ESV output areas increase the regional ESVs, but lose the opportunity to develop the economy. Therefore, the compensation standard for ESV output areas should consider the increments of ESVs within the evaluation period, the direct cost of ecological construction, and the opportunity cost. This study used the increments of ESVs between 2000 and 2010 as the ecological benefits of this region. The costs of ESV output areas included opportunity cost and direct cost. The opportunity cost method is a widely used method, which refers to the method of determining the compensation standard based on the benefits [40]. When using the opportunity cost method, there are some differences in results for different carriers. It is key to select the appropriate carrier to calculate the maximum benefits that an ESV output area gave up. At present, there are many carrier accounting methods, such as the opportunity cost method of agricultural output value and the opportunity cost method of regional development differences, among others [41]. In terms of ecological protection practices in the SWCR, the transformation process of land-use was mainly from agricultural land to wetland. Thus, this study used the loss of agricultural production value to represent the opportunity costs of the ESV output areas. The formula is as follows:
C i , o p p = Y i × S i × P / 10 4 ,
where Ci,opp is the opportunity cost of the ith ESV output area (10,000 Yuan/year), Yi is the grain yield per unit of the ith ESV output area (kg/ha), Si is the area of the agricultural land converted into the wetland of the ith ESV output area during the evaluation period (ha/year), and P represents the average market price of grain (Yuan/kg).
Direct costs refer to the costs invested in ecological construction, including construction costs and maintenance costs. This study selected the construction costs and maintenance costs of the wetland restoration projects (WRPs) as the direct costs of ecological construction in the SWCR. The average construction costs and maintenance costs per unit area of the 10 typical WRPs in ESV output areas were counted. The formula is as follows:
C i , c m = ( C i , c o n + C i , m a n ) × S w ,
where Ci,cm is the direct cost of the ith ESV output area (100 million Yuan/year), Ci,con is the average unit area construction cost of the ith ESV output area (100 million Yuan/ha·a), Ci,man is the average maintenance cost per unit area of the ith ESV output area (100 million Yuan/ha·a), and Sw is the increased area of wetland during the evaluation period (ha).
The maintenance costs of WRPs were usually expressed in terms of annual value, while the construction costs were a one-time payment. Therefore, the following formula was used to convert a one-time payment value into a 20 year annual value:
P = L ( 1 + r ) n r ( 1 + r ) n 1 ,
where P is the annual value of benefits and costs (100 million Yuan/year), L is a one-time payment value (100 million Yuan), r is the discount rate (0.05), and n is the number of years of WRPs operation (20 years).

2.4.4. ESV Decrements and Public WTP of ESV Input Areas

ESV input areas develop the economy at the expense of the environment, with the values of the regional ecosystem services being reduced. The corresponding costs of environmental damage should be paid by these areas. In addition to the decreased ESVs, compensation standards should also consider the compensation capacity of the region, such as the WTP of the public. The contingent valuation method (CVM) is widely used in evaluation of the benefits of ecological improvement or the economic loss of ecological environment damage [9,42]. It is not based on observable market behavior but, instead, based on the respondent’s response or reflection of what action will be taken, in the context of a hypothetical market. This study mainly investigated the public’s WTP for the improvement of the ecological environment in the SWCR.
Pre-survey is an important part of a conditional value assessment study [43]. The purpose is to improve the questionnaire and summarize the reasons why the respondents are unwilling to pay. A total of 60 respondents were randomly selected from the local population of three typical economic development regions (Chong’an District, Suzhou Industrial Park, and Zhonglou District) in the ESV input areas for face-to-face interviews. In particular, two experienced psychology teachers were asked to evaluate the results of the pre-survey questionnaire and, on this basis, the formal questionnaires were refined and finalized. The official questionnaire was surveyed from April–June 2011. The respondents were residents at home, and the interview time was about 15 min. The questionnaire was completed by trained Nanjing University students. The total number of households in the survey area was 346,500 (Table 1). To select a random sample from this population, the following sample size formulas were adopted in this research [44]:
S S = z 2 [ p ( 1 p ) ] d 2 ,
where z is the z value (e.g., 1.96 for a 95% confidence level); p is the percentage of respondents who selected a choice, expressed as a decimal (0.5 used for the sample size needed); and d is the confidence interval or margin of error, expressed as a decimal. The above equation is appropriate for infinite sampling but, because the number of households is known in our study, the correction for a finite number of households is as follows:
S S = S S 1 + S S 1 F ,
where F is the number of households in the surveyed area. On the basis of the sample size formulas, z = 1.96, p = 0.5, and d = 5% were selected, and on the basis of these formulas, the necessary sample size (384) was obtained. To complete our goal, the sample size was expanded to 600. All respondents in this study were over 18 years of age. A stratified random sampling technique was used to select samples of 600 households to ensure that the samples could well represent the population of the area. In the sampling frame design, the survey area was divided into three layers, based on the administrative area: Chong’an District, Suzhou Industrial Park, and Zhonglou District. The sample size of each area should be proportional to the household density in the region (the ratio of the total number of households to the total area). Each area was divided into a number of communities, based on the number of surveyed households. Ten households were randomly selected for investigation in each community. The sample size is shown in Table 1.
In order to avoid hypothetical deviations, at the beginning of the questionnaire survey, the investigators explained to the respondents that it was a hypothetical survey and did not require the respondent to actually pay. The survey was conducted for academic purposes only and not for commercial purposes, which can effectively reduce the rejection rate. The questionnaires included two parts:
The first part introduced the survey sites, including the importance of the Taihu Lake ecosystem and the status of pollution and degradation, letting the respondents understand the basic information on Taihu Lake. The investigators showed the respondents a series of photos and maps of the Taihu Lake wetlands to intuitively display the effects of ecological protection in the Taihu Lake Basin. The second part was the main part of the questionnaire. Respondents were told that, because of the serious degradation of the Taihu Lake ecosystem in recent years, the government had implemented many projects to improve the ecological environment of Taihu Lake, such as the construction of WRPs. As a direct beneficiary of ecological improvement, the survey asked about the respondent’s willingness to pay for ecological protection in the Taihu Lake region by means of an open-ended questionnaire and interview. Respondents were first asked “Are you willing to pay?”; namely, whether the respondent’s families were willing to pay each year to support ecological protection projects in the Taihu Lake region. The second question asked “How much are you willing to pay?”; that is, how much the respondent’s families were most willing to pay each year. The WTP value of the payer was greater than zero for the positive WTP, and being unwilling to pay was regarded as the valid zero WTP. The respondents who were unwilling to pay directly were asked the reason for their refusal to pay.
The positive WTP were used to analyze the WTP amounts of respondents and their influencing factors. In this study, three survey sites were divided into short distance (Suzhou Industrial Park), medium distance (Chong’an District), and long distance (Zhonglou District), according to their distance from the Taihu Lake wetlands. The relationships between WTP and influencing factors was analyzed by SPSS 18.0 (SPSS Inc., Chicago, IL, USA). In this study, three multiple linear regression models were constructed to determine the WTP amounts and the influencing factors. The ordinary least squares (OLS) method was used to estimate the parameters in the multiple linear regression model. In the case of multiple variables, R2 and F value tests were adopted after adjusting the t value and R2. The regression equations are as follows:
ln W T P i = β 0 + β x 1 + + β n x n + ε ,
where β0 is constant term intercept; x is the independent variable of regression model, namely the value of each influencing factor; β is the regression coefficients of the factors; ɛ is the error term; and lnWTPi is the dependent variable, namely the logarithm of the largest amount of the payment of the respondents in the ith area.

3. Results and Discussion

3.1. Valuation and Regionalization of ESVs

3.1.1. Valuation of ESVs

On the time scale, the total ESVs in the SWCR showed an increasing trend, from 83.231 billion Yuan in 2000 to 97.735 billion Yuan in 2010, a total increase of 14.5 billion Yuan, with an average annual growth rate of 1.74%. In terms of the ESVs of each ecosystem, only the values of gas regulation, climate regulation, and biodiversity decreased. Among these, the value of climate regulation showed the biggest declines, with an average annual reduction rate of 3.06%, while the value of biodiversity decreased slightly, with an average annual reduction rate of 0.09%. Among the eight ESVs, five values showed an increasing trend, these being material production, hydrological regulation, waste treatment, leisure and recreation, and soil conservation value, among which the value of material production increased the most, with an average annual growth rate of 7.75% (Table 2). It can be seen that during the period from 2000 to 2010, the increase in the total ESVs in the SWCR was mainly due to the increase in the value of supply services. At the same time, as the value of supply services increased, the value of regulated services and the value of support services decreased, accordingly.
From the perspective of the changes in the ESVs of various land-use types in the SWCR, the total ESVs of the five land-use types increased by 14.5 billion Yuan between 2000 and 2010, of which the ESVs of unutilized land increased the most, from 0.02 billion Yuan in 2000 to 0.07 billion Yuan in 2010, with an average annual increase rate of 25% (Table 3). This indicates that the proportion of unutilized land converted to ecological land in the SWCR increased the most in the past 10 years. The average annual growth rates of agricultural land, forest land, wetland, and grassland were 2.36%, 2.55%, 1.28%, and 4.28%, respectively, of which the wetland ecosystem service value had the lowest rate of change. Because of the outbreak of blue algae in Taihu Lake in 2007, Jiangsu Province invested a large sum of money to restore the environment. Thus, although the existing study showed that the ESVs in Wuxi City declined from 1997 to 2007 [45], the ESVs in SWCR increased from 2007 to 2010, verifying the effectiveness of Jiangsu Province’s ecological protection policies and a series of projects, which was consistent with the research result of Shi et al. (2017) [46].
Although the ESVs of unutilized land increased the most, the ESVs per unit area of unutilized land showed a downward trend, with an average annual reduction rate of 2.61%. This was because the area of unutilized land increased significantly from 732.88 ha to 4035.46 ha between 2000 and 2010. The ESVs per unit area of agricultural lands, woodlands, wetlands, and grasslands increased. The average annual increase rates of ESVs per unit area of grasslands and agricultural lands were 8.01% and 6.25%, respectively, while the average annual increase rate of ESVs per unit area of wetlands was only 0.60%. In recent years, wetlands have been seriously polluted, and their ESVs reduced in recent years [38,47]. Moreover, the ESVs of wetland accounted for more than 60% of the total values, while the ESVs of other land use types accounted for a relatively low proportion (Table 3). It resulted that wetlands had a relatively low change rate and increase rate per unit area.
On the spatial scale, as far as the change of the total ESVs was concerned from 2000 to 2010 (Figure 4), the areas of value reduction were mainly concentrated in the central urban area of the SWCR, Wuxi New District, and Suzhou Industrial Park. Among these, the total ESVs of Suzhou Industrial Park decreased the most, with a value reduction of 331 million Yuan in 10 years. The other areas showed increasing trends to different extents, among which Liyang City and Yixing City (located in the northwest of the study area), and Wuzhong District (located in the south of the study area) had the largest increase in the total ESVs, more than 1.349 billion Yuan over 10 years. Furthermore, the increments of total ESVs in peripheral areas (such as Zhangjiagang City, Jintan City, Kunshan City, Wujin District, etc.) were higher than those in central areas (such as Suzhou High-tech Zone, Xiangcheng District, Binhu District, etc.). Generally speaking, the increment of ESVs in the study area showed a spatial distribution trend spreading from the center of the study area to the periphery.

3.1.2. Regionalization of ESVs

The clustering method was applied to 28 cities and districts by using four zoning variables. We initially used a range of 3–5 categories. The clustering required the same dimension, so we standardized the data and measured these with squared Euclidean distance. In order to get a more scientific, reasonable, and practical regionalization in the SWCR, combined with mean analysis, experts (from environmental scholars to public officials) familiar with the situation of Taihu Lake were invited to have a discussion. The experts were invited to give their opinions and fine-tune the clustering analysis results. Finally, the SWCR was divided into the following four zones, according to four factors (the changes of ESVs, the changes of population density, the changes of GDP per unit area, and the changes of urban expansion intensity of 28 cities and districts between 2000 and 2010).
Zone I was a synergistic development zone (SDZ), including 14 cities and districts (Figure 5). They were mainly located in the north, center, and east of the SWCR, and agricultural lands and construction lands were the main land-use types in this zone. From 2000 to 2010, there was an upward trend in the expansion of urban construction, population density, and GDP per unit area (Table 4). At the same time, the government spent a great deal of money on the restoration of ecosystem in this zone, such as the construction of WRPs and National Wetland Parks, which increased the ESVs from 2000 to 2010.
Zone II was an ecological conservation zone (ECZ), which consisted of eight cities and districts, mainly located in the northern, western, and southern parts of the SWCR (Figure 5). The main land-use types were agricultural lands and wetlands, and this zone had the most forest in the study area. Compared with the other three zones, the increments of ESVs were the largest, while the increments of GDP per unit area, population density, and urban expansion intensity were the smallest between 2000 to 2010 (Table 4). This showed that this zone was a typical ESV output region, which implemented ecological protection at the expense of economic and social development.
Zone III was an ecological degradation zone (EDegZ), which consisted of five cities and districts, mainly located in the north, center, and east of the study area (Figure 5). Construction land was the main type of land-use in this zone. In the four zones, ESVs declined the most over 10 years in this zone, while the indicators related to GDP, population, and urban expansion increased (Table 4). This suggested that this zone was a typical ESV input area, developing the economy at the expense of the ecological environment.
Zone IV was an economic development zone (EDevZ), including one district (Chong’an District) (Figure 5). The land-use type was mainly construction land, accounting for more than 90% of the total area. It was a typical ESV input region, where the zone was rapidly promoting its economy while taking the cost of destroying the ecosystem. Although GDP per unit area in this region increased most during 2000–2010, Chong’an District is an old urban area, and so its urbanization expansion and population density change rate were lower than those of Zone III, and the impact of human activities on the eco-environment of the region was smaller than that of Zone III. Therefore, the decrement of ESVs was less than that in Zone III (Table 4).

3.2. Scenario Analysis

As shown in Table 5, among the five scenarios, the protection priority over development scenario had the most increments of ESVs per unit area from 2000 to 2010, and the urban development scenario had the least. This indicates that the ESVs increased with an increase of the area from cultivated lands to wetlands. It was not difficult to find this, as the ecosystem service value of wetlands per unit area was higher than that of agricultural lands and, so, the ESV increased in the process of transforming agricultural lands into wetlands in the ecological protection scenario. Meanwhile, the expansion of construction lands occupied other kinds of valuable land, which caused the ESV to decrease with the expansion of construction lands in the urban development scenario.
Among the five scenarios, the total ESVs increased the most in the protection priority over development scenario; however, the agricultural lands could not be completely converted into wetlands because of the Ecological Red Line Policy adopted by China to protect cultivated land area. Thus, in order to find a more reasonable future development mode, the trade-off of the increments of ESVs per unit area under the five scenarios were further discussed. As can be seen in Figure 6, hydrological regulation values and waste treatment values increased more the under ecological protection scenario, but less under the urban development scenario. It showed that an increase of wetland area mainly improved the hydrological regulation function and waste treatment function of the ecosystem. As can be seen from the radar map, the increments of all kinds of ESVs in the protection and development scenario were the most balanced.
Generally speaking, it was not surprising that although the ESVs increased the most in the protection priority over development scenario, the transformations of land use in reality did not occur in such an extreme scenario. The protection and development scenario can not only guarantee the increase of ESVs, but also balance the increase of various types of ecosystem services. Therefore, this scenario was the relatively optimal one. At the same time, this scenario was in-line with the general land-use plan of the study area, showing that this scenario had certain reasonability and practicality.

3.3. Compared with Ecological Protection Red-Line Planning

According to the latest National Ecological Protection Red-Line Planning of Jiangsu Province [27], the SWCR carried out hierarchical management of ecological red-lines to restrict the development and construction activities that destroy ecosystems. The four zones divided in this study were basically consistent with the ecological space control zones in the ecological protection red-line planning of Jiangsu Province. This also suggested that the government should redouble its efforts in protecting and improving the ecological environment in this region, especially in ECZ, and adopt strict policies and measures to ensure the maximum ecological benefits of ESV output areas. In summary, the comprehensive zoning method based on ESV increment, economic, and social factors proposed in this study is consistent with existing ecological protection plans and overall land-use planning of Jiangsu Province, which are scientifically reasonable.

3.4. ECS for ESV Output Area

3.4.1. Opportunity Cost

The SDZ included 14 cities and districts, and the EDevZ included eight cities and districts. Table 6 showed that the average grain yield per hectare of the SDZ was not much different from that of the ECZ, which was only lower than the ECZ by 34 kg/ha. Using the spatial overlay analysis of ArcGIS, the area of agricultural land converted to wetland of each city and district in the SDZ and ECZ from 2000 to 2010 can be obtained (Figure 7). According to Equation (1), the lost opportunity cost per year in the SDZ was 1.02 million Yuan/year, which was far lower than the ECZ (2.79 million Yuan/year). This was because, compared with the SDZ, the ECZ had a lower GDP and more incremental ESVs, which meant more lost opportunity costs for ecological conservation. The opportunity costs calculated by different methods are quite different. Dai et al. (2013) [47] estimated the opportunity cost of limited industrial development in Fogang County, China, due to ecological conservation by using the development loss cost method, which was about 400 million Yuan/year, while Zheng et al. (2013) [41] used the agricultural income opportunity cost method to estimate the opportunity cost of Miyun Reservoir, China as 710 Yuan/ha. The opportunity cost calculated in this study was lower than that of Dai et al. (2013) [47], as they considered the regional lost GDP, but regional GDP change was not only caused by ecological conservation. Kosoy et al. (2007) [48] used ecological compensation to solve ecological problems in Central America, and suggested that land benefits should be used as a carrier for opportunity costs. The ecological protection in the SWCR was mainly returning farmland to wetland. Therefore, this study chose the lost grain income due to ecological protection as the evaluation carrier. Moreover, in developing countries, farmers’ incomes mainly come from the agricultural management of land. For the regions that implement ecological protection, if farmers’ income cannot be compensated, local farmers will choose to continue to operate the land instead of joining the environmental protection contract.

3.4.2. Direct Cost

Table 7 shows that the construction cost per unit area and operating costs of 10 typical WRPs in SDZ and ECZ. The construction cost was a one-time investment and was converted into an annual value by Equation (3). In the SDZ, the construction cost per unit area was about three times the operating cost per unit area, while the ECZ had little difference. This was because the SDZ was mainly located in the center of the cities, and the population density was relatively large. The WRPs implemented were mostly wetland parks for public enjoyment of leisure and entertainment. On the contrary, ECZ was often geographically remote, and most of the WRPs were wetland conservation projects without wetland parks, thus the construction cost and operating costs in the SDZ were higher than the ECZ. The total cost per unit area of the SDZ was 0.00165 billion Yuan/ha·year, which was four times higher than the ECZ. According to Equation (2), it can be concluded that the opportunity costs of SDZ and ECZ were 1.94 billion Yuan/year and 0.71 billion Yuan/year, respectively.

3.4.3. ECS

The ECS of SDZ and ECZ can be obtained by combining the regional increments of ESVs under both protection and development scenarios, opportunity costs, and direct costs. As can be seen from Table 8, the opportunity cost was the lowest, while the direct cost was the highest. According to the costs, the compensation standard for the SDZ was about 1.94 billion Yuan/year, and the compensation standard for the ECZ was about 0.71 billion Yuan/year. According to the increments of ESVs, the compensation standard for the SDZ was about 22.30 million Yuan/year, and the compensation standard for the ECZ was about 90.00 million Yuan/year. With comprehensive consideration of the values of three aspects, the compensation standard for the SDZ should be about 1.94 billion Yuan/year, and the compensation standard for the ECZ should be about 0.80 billion Yuan/year.

3.5. ECS for ESV Input Areas

3.5.1. WTP Assessment

Among the 600 study samples, 22 invalid questionnaires with unknown information were excluded, and 578 questionnaires were taken as valid. The effective rate of questionnaire recovery was 96.3%. Among the 578 valid samples, 391 (67.6%) of the respondents were willing to pay for the WRPs (WTP > 0) after the basic situation of the wetlands was understood, indicating that sustainable protection of the wetlands was accepted by most people. A total of 187 of the 578 respondents (32.4%) refused to pay any fees for the WRPs (WTP = 0).
Figure 8 showed the distribution of WTP bids for WRPs. The bid amount ranged from 1 Yuan to 1000 Yuan, of which the frequencies of 10 Yuan, 50 Yuan, and 100 Yuan were relatively high. The mean and median values of WTP were 70.53 Yuan and 50.00 Yuan, respectively. The median value of WTP was lower than the mean value, indicating that most of the respondent’s payment costs were lower than the average value, and that the bid amount obviously showed a left-biased distribution, which was consistent with the public’s daily payment psychology—that is, payment frequencies with a low amount were relatively high. The low-paying psychology of the respondents was also related to the degree of understanding of the WRPs and environmental awareness of the respondents.
The correlation between WTP amounts and the geographical location of the respondents was analyzed by a non-parametric Spearman correlation test. Unexpectedly, the geographical location was negatively correlated with WTP amounts (p < 0.01) (Table 9).
Suzhou Industrial Park (short distance), Chong’an District (medium distance), and Zhonglou District (long distance) were introduced into three regression models as dependent variables. The independent variables were the individual’s understanding of ecological protection, attitude, trust in the government, and demographic variables. As the WTP amounts had a skewed distribution, the peak was left, and the long tail was biased to the right (Figure 8), and the logarithmic transformation method was used to shift the distribution closer to a normal distribution and reduce the variability of the data. Stepwise regression models were constructed, and the difference significance levels of 0.01 and 0.05 were selected.
It can be seen from Table 10 that there was a significant positive correlation between the income level and the WTP amounts of the respondents in the three different distance levels. In general, the respondents most willing to pay for the Taihu Lake ecological protection were those with higher incomes living in areas closer to the wetlands.
The WTP amounts of the respondents were predicted using the average values of the variables in Equation (6). The predicted average WTP was 68.50 Yuan/household/year for Suzhou Industrial Park, 25.53 Yuan/household/year for Chong’an District, and 12.71 Yuan/household/year for Zhonglou District. Finally, the average WTP was obtained according to the area of each region (Table 11).

3.5.2. ECS

The ECS for EDegZ and EDevZ can be obtained from the regional decrements of ESVs under both the protection and development scenario and the WTP of the public in the ecosystem service input areas. As can be seen from Table 12, the public’s WTP was higher, while the ESVs were lower. According to the WTP compensation, the compensation standard for EDegZ should be about 2.25 million Yuan/year, and the compensation standard for EDevZ should be about 7.33 million Yuan/year. Compared with EDevZ, although the lost ESVs in EDegZ were relatively high, due to the low public perception of environmental degradation, their WTP was directly related to the income level of the public. According to the decrements of ESVs, the compensation standard for EDegZ was about 2.20 million Yuan/year, and the compensation standard for EDevZ was about 0.06 million Yuan/year. In terms of the values of the two aspects, the compensation standard for EDegZ should be about 2.20–2.25 million Yuan/year, and the compensation standard for EDevZ should be about 0.06–7.33 million Yuan/year.
It can be seen that, if public participation is strengthened during the implementation of ecological compensation, under reasonable development conditions, most of the public are willing and able to compensate for the reduction in the value of ecosystem services caused by regional economic development. Combining the principle of ‘who develops, who protects, who benefits, and who compensates’ and public participation can enable local residents to actively participate in the work of regional ecological environmental protection and governance and, accordingly, put forward specific opinions and policy suggestions in accordance with the local economic development level and citizens’ will. This will not only protect the local people’s right to know the environment, but also strengthen the participation and supervision of the public. It will also help alleviate the government’s financial pressure, promote the implementation of comprehensive ecological environment prevention and control, and establish a long-term mechanism for water resource protection.

3.6. Feasibility Analysis of Ecological Compensation

Many scholars have suggested that opportunity cost should be used as the lower limit of ECS, and that ESVs should be the upper limit of ECS [49]. With the deepening of the research on ESVs, Lai et al. (2015) [50] considered that the ECS was not directly based on the stock values of regional ecosystem services, but on the added values of ecosystem services generated by regional ecological restoration as the theoretical limit of compensation. Newton (2012) [51] and Ferraro (2015) [52] also selected protected areas and non-protected areas for comparisons, in order to calculate changes in ecosystem services caused by ecological protection. The ecosystem service input areas considered in this study were all economically developed areas. The ECS was based on the WTP and the decrement of ESVs. The ratio of ecological compensation to the average annual GDP did not exceed the proportion of regional environmental protection investment in GDP (3%) (Table 12), indicating that the ecosystem service input areas were fully capable of inter-regional compensation, which made ecological beneficiaries and providers more reasonable in sharing and enjoying the costs and benefits, promoting the effective purchase of ecological services. On the other hand, the ecological service output areas can obtain corresponding economic compensation, thereby stimulating the enthusiasm of various regions to protect the ecological environment, forming a benign interactive relationship between ecological compensation and environmental protection and promoting the harmonious development of economic construction and ecological civilization.

4. Conclusions

Taking ecological compensation as the breakthrough point, on the basis of a large number of investigations on ecological compensation mechanisms and evaluation methods of ESVs, combined with the research background and significance of the differentiation of ECS, using a rapidly urbanized area (the SWCR) as the research area, a differentiated assessment method of ECS was proposed based on the changes of ESVs with the spatial analysis method of ArcGis. The main results are summarized as follows:
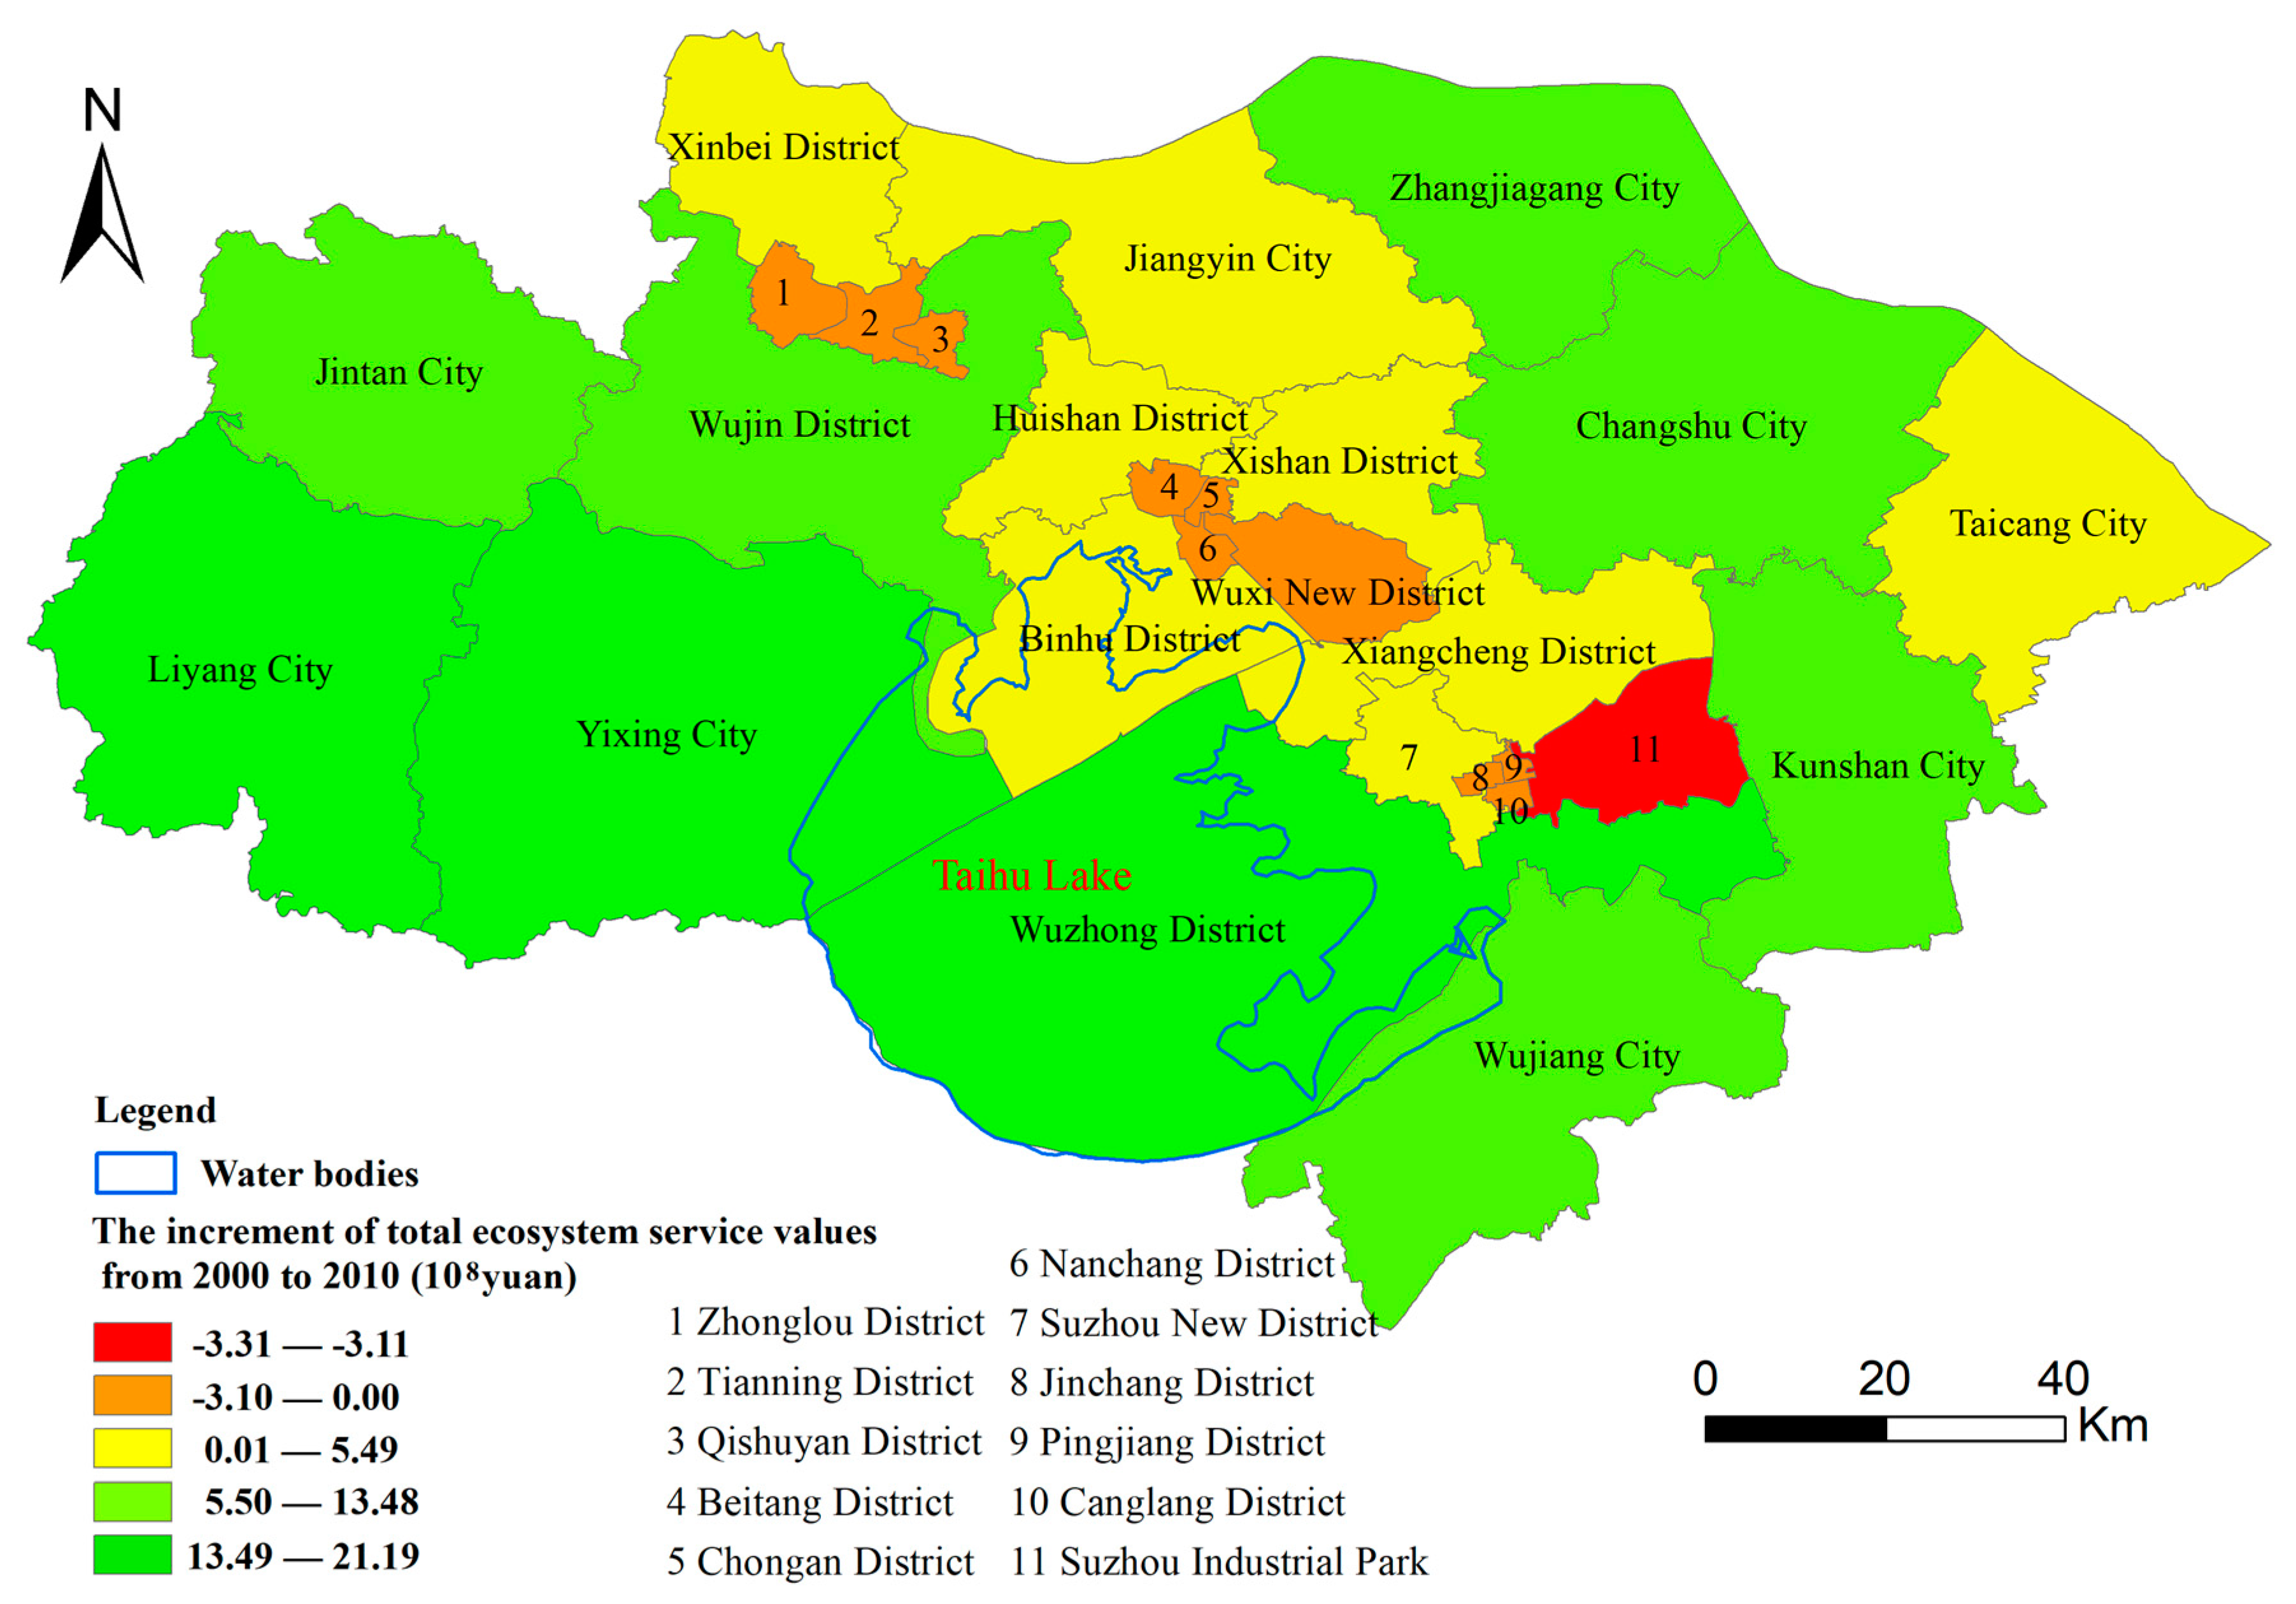
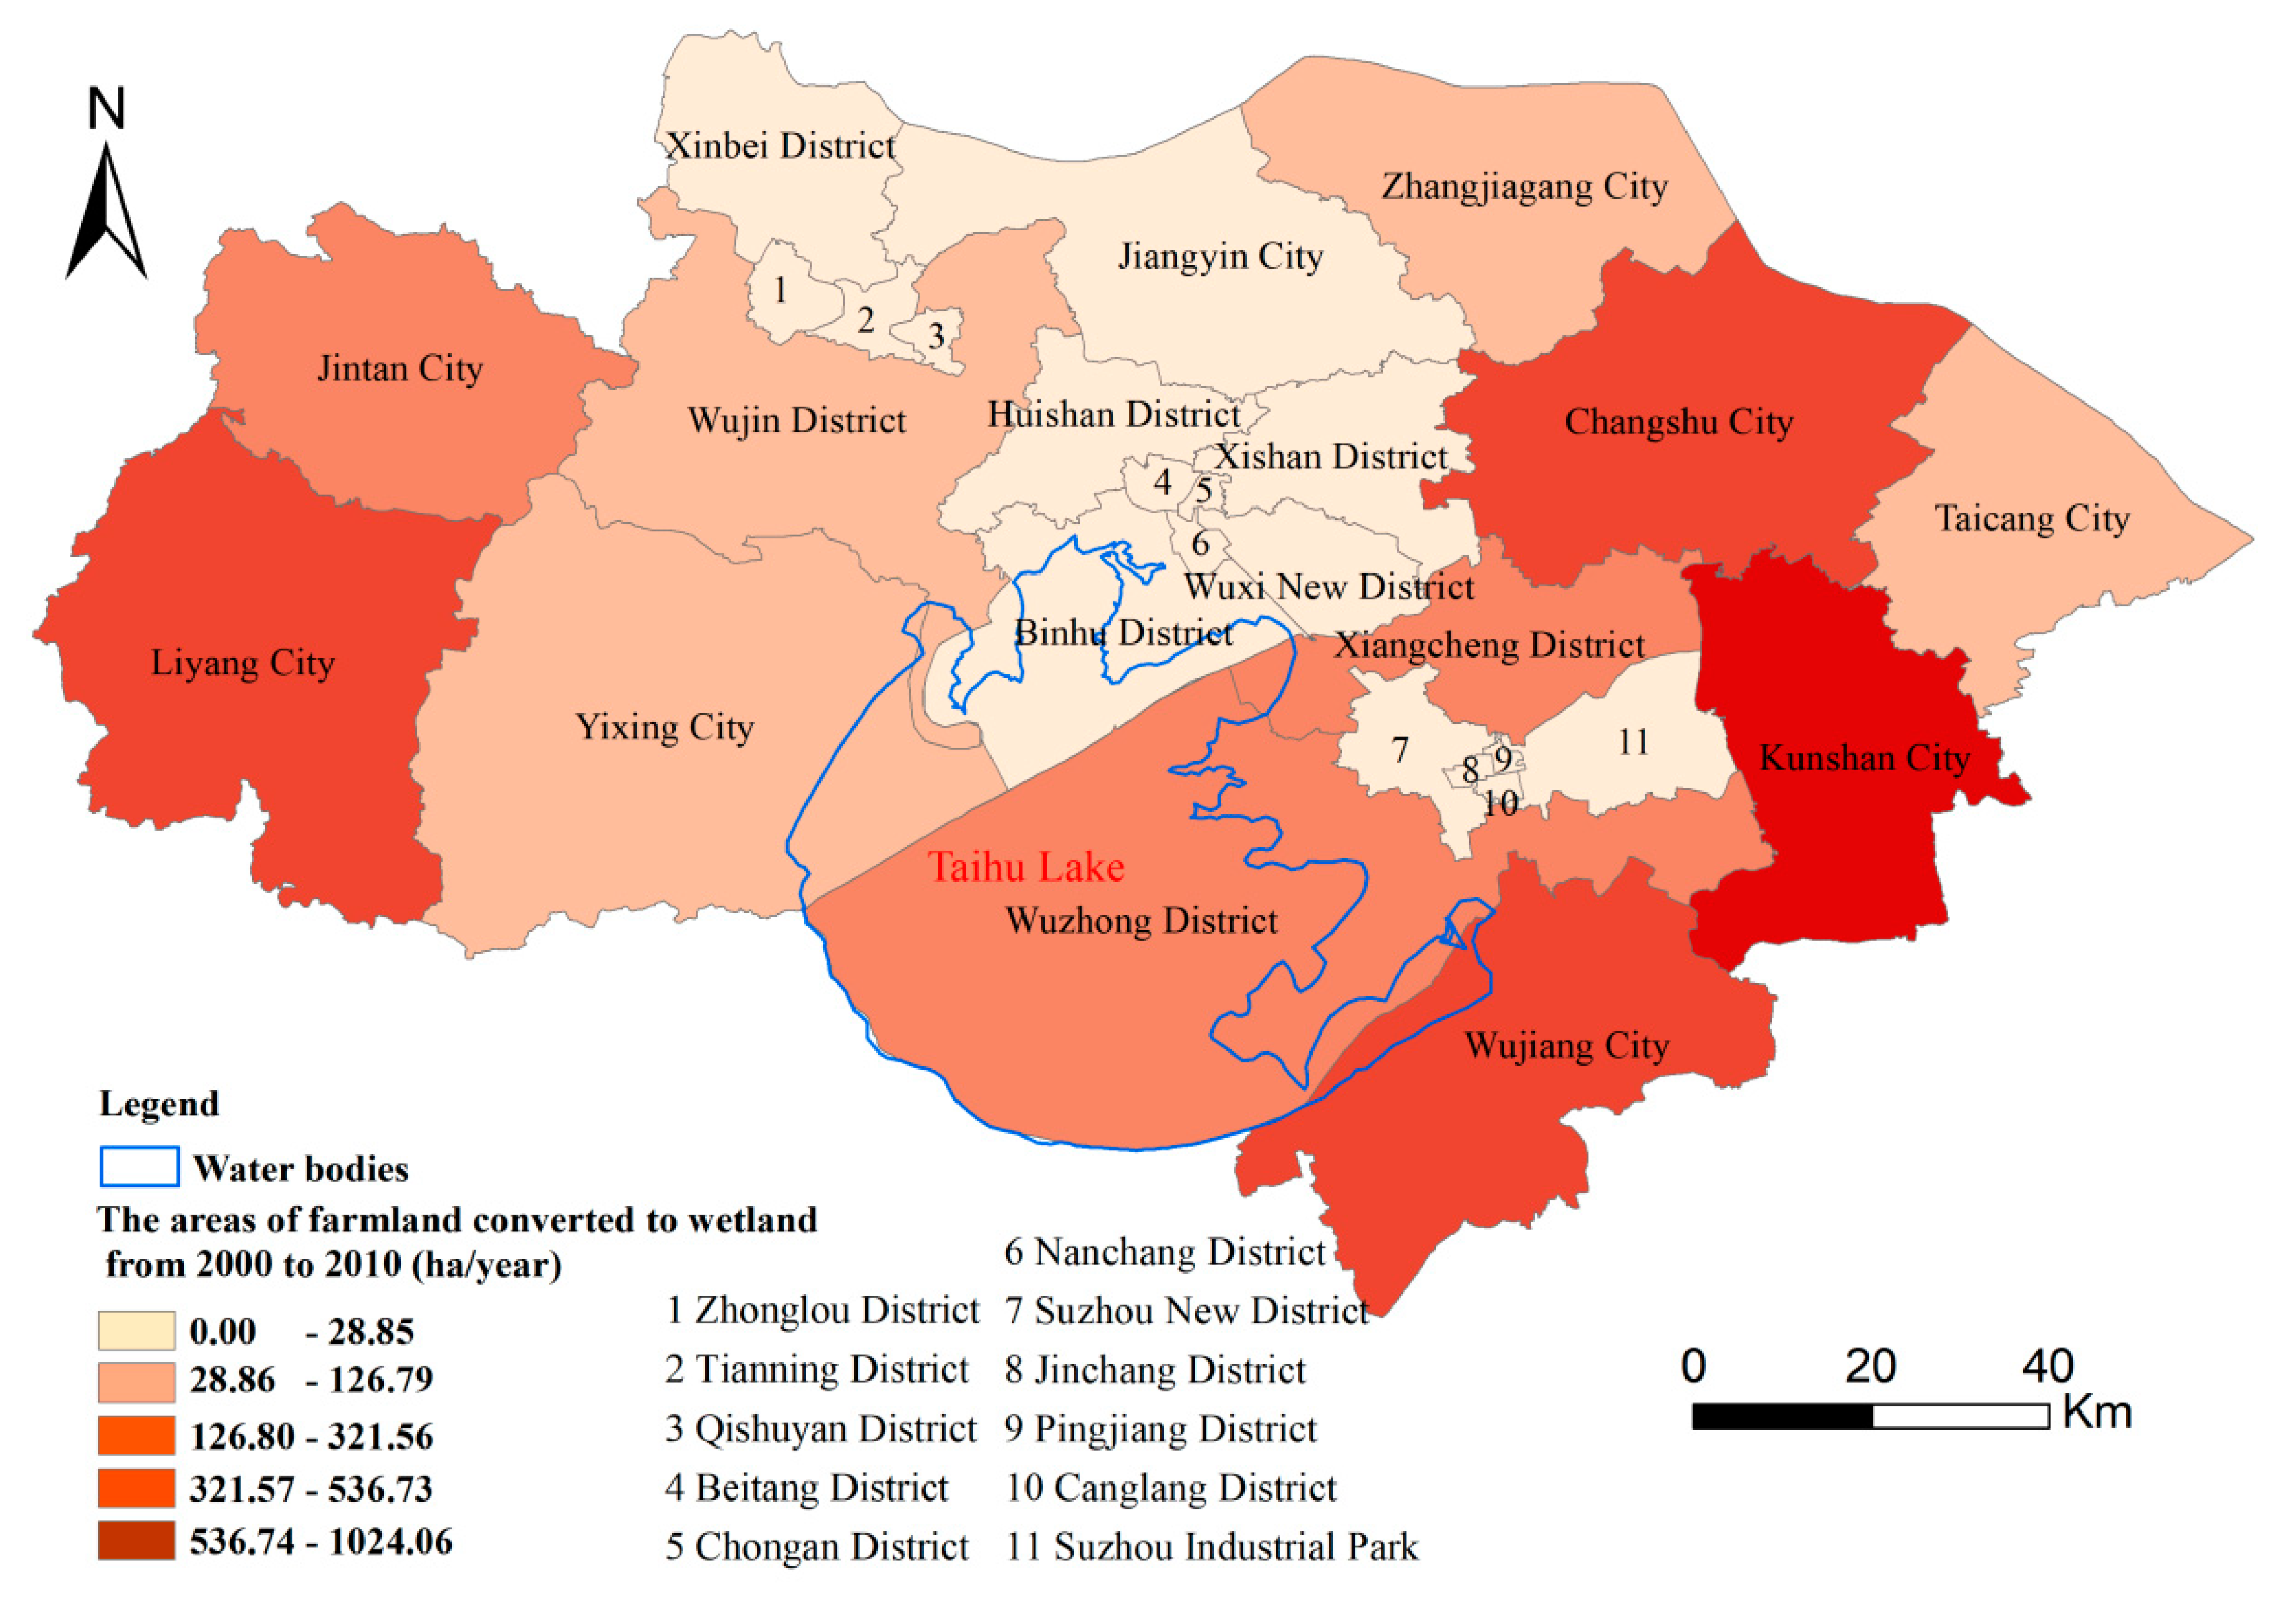
First, the total ESVs increased by 14.5 billion Yuan in 2000–2010. The increase of total ESVs in the SWCR was mainly due to the increase in the value of supply services. At the same time, as the value of supply services increased, the value of regulating services and the value of supporting services decreased, accordingly. From the point of view of land-use types, the total ESVs of five land-use types showed an upward trend, in which the ecosystem service value of unutilized land increased the most, but the ecosystem service value per unit area showed a downward trend. On the spatial scale, there was an obvious difference in ESVs, and the increment of ESVs in the study area showed a spatial distribution trend of spreading from the center of the study area to the periphery.
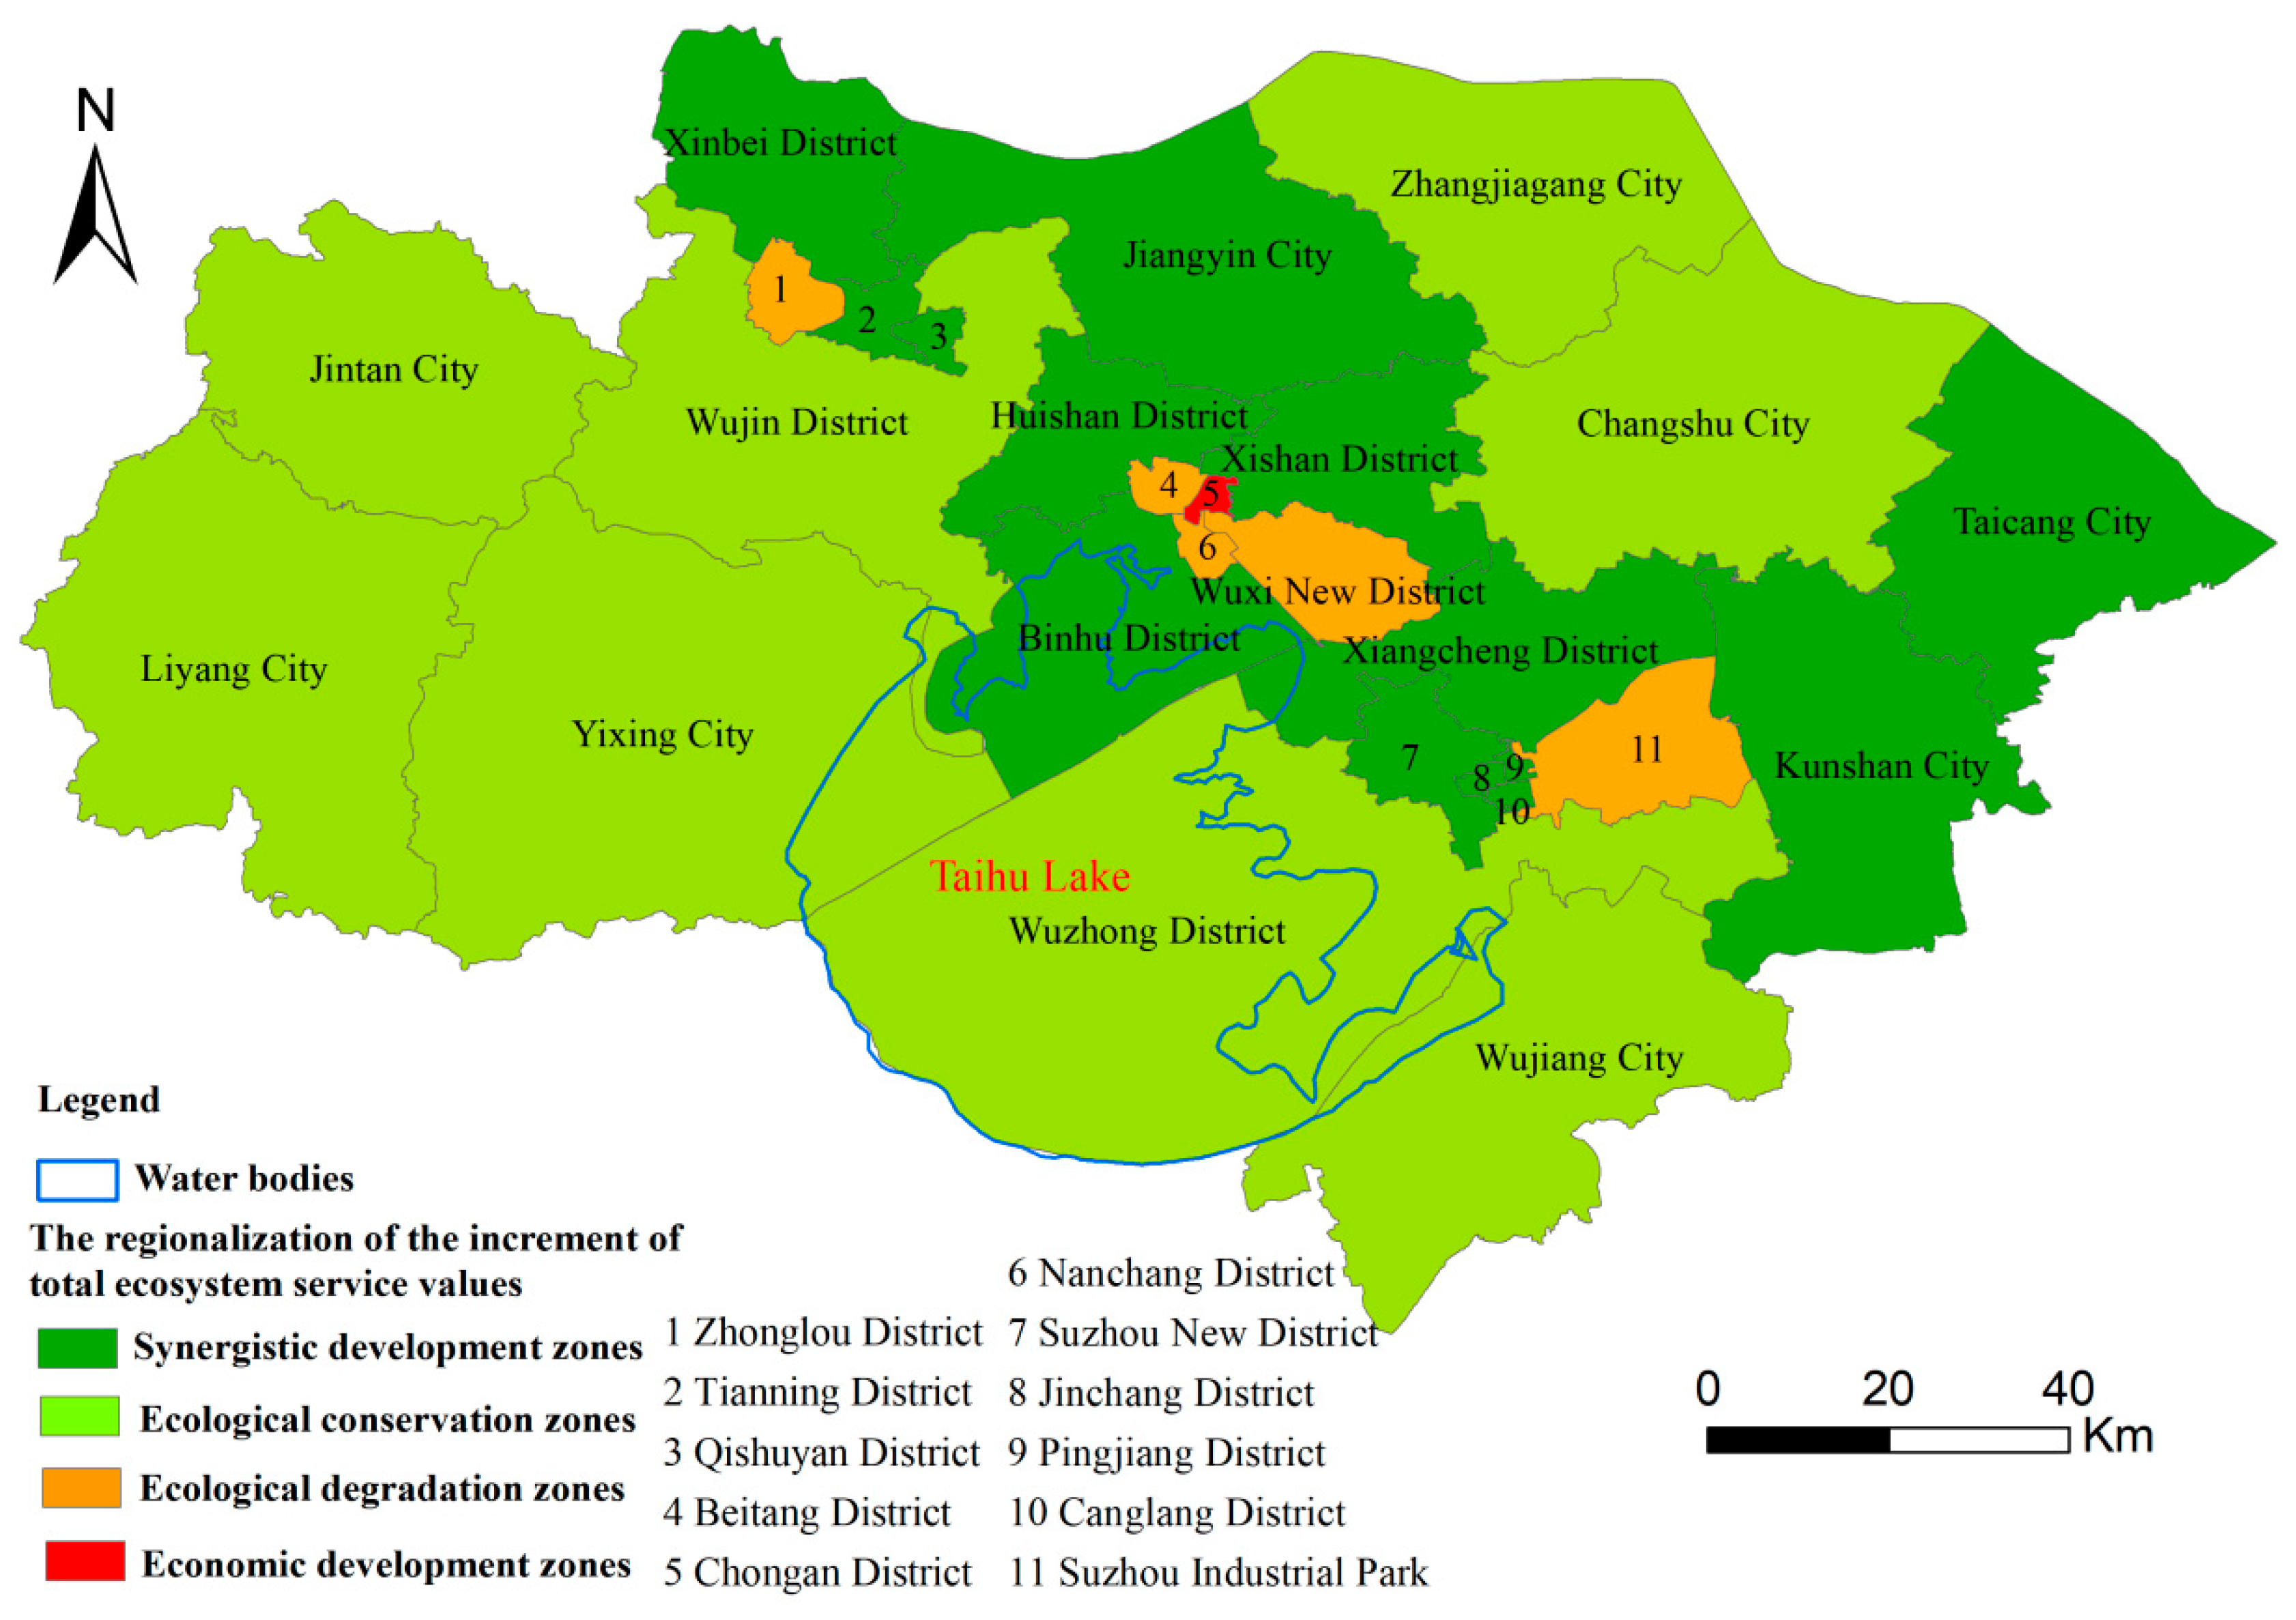
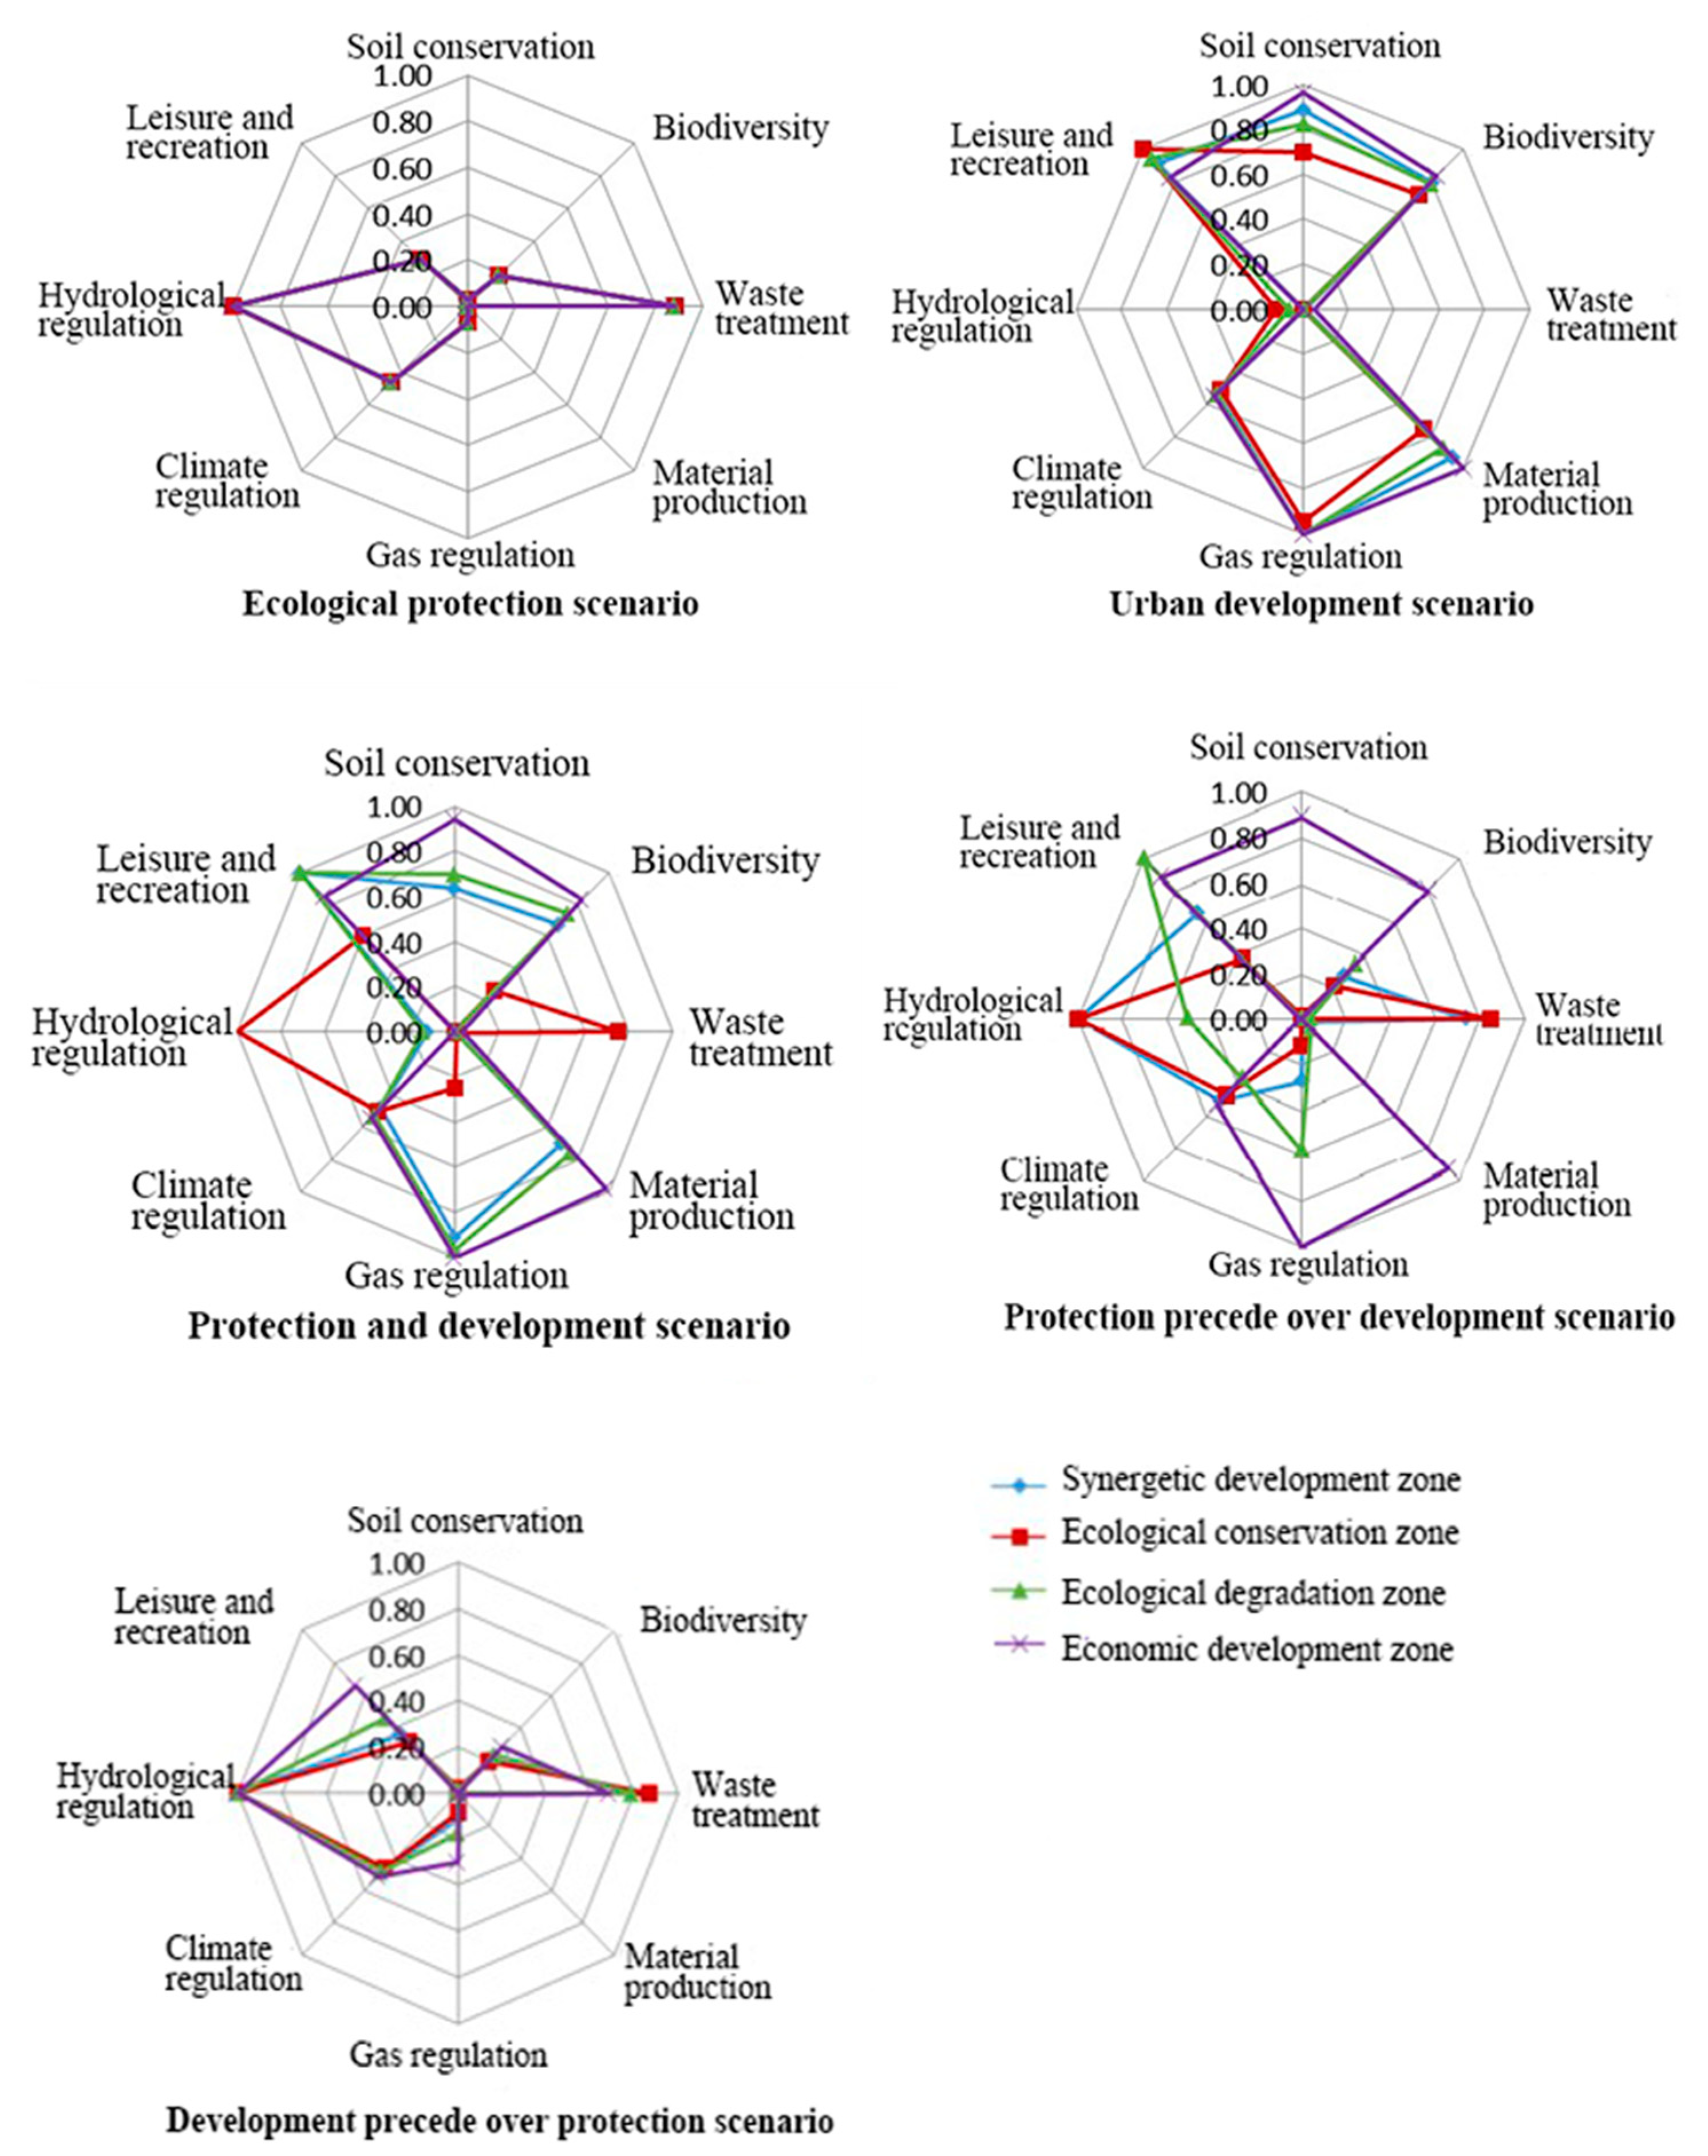
Second, a comprehensive ESV zoning model was constructed in this study. The SWCR was divided into four zones, among which the SDZ and the ECZ were the ESV output areas, and the EDegZ and EDevZ were the ESV input areas. The protection and development scenarios in the future will be optimal, with the increments of ESVs per unit area being the most well-balanced under each zone. The proposed comprehensive zoning method can be consistent with the existing ecological protection plans and overall land-use planning of the Jiangsu Province, which is scientifically reasonable.
Finally, on the basis of ESV regionalization and scenario analysis, combined with direct cost, opportunity cost, and changes of ESVs, different ECS were proposed. Under the protection and development scenario, the SDZ should be paid about 1.94 billion Yuan/year, the ecological conservation area should be paid about 0.80 billion Yuan/year, the EDegZ should pay about 2.20–2.25 million Yuan/year, and the EDevZ should pay about 0.06–7.33 million Yuan/year. A feasibility analysis of ecological compensation showed that the ecological compensation values of the ESV input areas accounted for no more than the proportion of the regional environmental protection investments (3%), indicating that the ecosystem service input areas were fully capable of inter-regional compensation, which made ecological beneficiaries and providers more reasonable in sharing and enjoying costs and benefits, promoting the effective purchase of ecological services. This indicates that the multi-district ECS proposed in this study are reasonable and operational.
Ecological compensation has been implemented for a long time in China; in particular, the large-scale projects of returning farmland to forestry (grassland) have achieved remarkable results. However, China has a vast territory, along with a large number of contradictions in stakeholders. It is difficult to determine the scope and object of compensation when the government often acts as an ecological payer, which causes conflicts of interest among provinces and basins. As China’s compensation fund is often insufficient and limited, in order to maximize the efficiency of compensation funds, it is necessary to scientifically and reasonably spatially identify recipients and compensators under the compensation contract. However, the spatial selection methods of the compensation objects in existing studies have been focused on the economic and the maximum compensation benefits of the cost, while ignoring the ecological and social benefits. This study suggests that future spatial selection methods of the compensation objects should combine ecological, economic, and social factors, and that the proposed ecological compensation zoning method based on ESV assessment and spatial clustering analysis can effectively alleviate the inequalities of the regions. In addition, in the process of ecological protection, the error of compensation standard was caused by the difference between the accounting cost and the actual cost. Therefore, this study suggests that the ECS of each recipient and compensator should be accounted for separately by a cost–benefit analysis method and CVM, when determining future ECS. The developed evaluation framework of ECS in this study can accurately provide a scientific basis for the determination of ecological compensation regulations and policies in the future.

Author Contributions

J.H. and Y.W. developed the original idea for the study, contributed to data collection, and completed the manuscript. Z.T. carried out calculation analysis. C.W. and X.Z. revised the paper. All the authors contributed to drafting the manuscript and approved the final version of the manuscript.

Funding

This researh was funded by the National Social Science Fund of China (NO. 18CJY005).

Acknowledgments

This work was supported by the National Social Science Fund of China (18CJY005). This work also was supported by the Key Research Base of Humanities and Social Sciences of the Ministry of Education.

Conflicts of Interest

The authors declare no conflict of interest.

References

  1. Costanza, R.; de Groot, R.; Sutton, P.; van der Ploeg, S.; Anderson, S.J.; Kubiszewski, I.; Farber, S.; Turner, R.K. Changes in the global value of ecosystem services. Glob. Environ. Chang. 2014, 26, 152–158. [Google Scholar] [CrossRef]
  2. Shang, W.; Gong, Y.; Wang, Z.; Stewardson, M.J. Eco-compensation in China: Theory, practices and suggestions for the future. J. Environ. Manag. 2018, 210, 162–170. [Google Scholar] [CrossRef] [PubMed]
  3. Yang, Y.; Zhang, X.; Chang, L.; Cheng, Y.; Cao, S. A method of evaluating ecological compensation under different property rights and stages: A case study of the Xiaoqing River Basin, China. Sustainability 2018, 10, 615. [Google Scholar] [CrossRef]
  4. Lü, Y.; Fu, B.; Feng, X.; Zeng, Y.; Liu, Y.; Chang, R.Y.; Sun, G.; Wu, B.F. A policy-driven large scale ecological restoration: Quantifying ecosystem services changes in the Loess Plateau of China. PLoS ONE 2012, 7, e31782. [Google Scholar] [CrossRef] [PubMed]
  5. Zhou, S.; Huang, Y.; Yu, B.; Wang, G. Effects of human activities on the eco-environment in the middle Heihe River basin based on an extended environmental Kuznets curve model. Ecol. Eng. 2015, 76, 14–26. [Google Scholar] [CrossRef]
  6. Guan, X.; Liu, W.; Chen, M. Study on the ecological compensation standard for river basin water environment based on total pollutants control. Ecol. Indic. 2016, 69, 446–452. [Google Scholar] [CrossRef]
  7. Wang, J.N.; Wan, J.; Zhang, H.Y. Some understandings on China’s ecological compensation mechanism and policy. Environ. Prot. 2006, 19, 24–28. (In Chinese) [Google Scholar] [CrossRef]
  8. Huang, N.; Wang, Z.M.; Liu, D.W.; Niu, Z. Selecting sites for converting farmlands to wetlands in the sanjiang plain, northeast China, based on remote sensing and GIS. Environ. Manag. 2010, 46, 790–800. [Google Scholar] [CrossRef]
  9. Xie, X.; Xie, H.L.; Shu, C.; Wu, Q.; Lu, H. Estimation of ecological compensation standards for fallow heavy metal-polluted farmland in China based on farmer willingness to accept. Sustainability 2017, 9, 1859. [Google Scholar] [CrossRef]
  10. Zhang, W.; Zhang, H.Y.; Zhang, Y.F. A method to determine the spatial allocation standard of social ecological compensation. J. Geogr. Sci. 2012, 22, 283–300. [Google Scholar] [CrossRef]
  11. Ambastha, K.; Hussain, S.A.; Badola, R. Social and economic considerations in conserving wetlands of indo-gangetic plains: A case study of Kabartal wetland, India. Environmentalist 2007, 27, 261–273. [Google Scholar] [CrossRef]
  12. He, Q.S.; Zeng, C.; Xie, P.; Liu, Y.L.; Zhang, M.K. An assessment of forest biomass carbon storage and ecological compensation based on surface area: A case study of Hubei Province, China. Ecol. Indic. 2018, 90, 392–400. [Google Scholar] [CrossRef]
  13. Matthias, A.; Bernhard, S.; Martin, K.O.; Beatrice, S.; David, K.; Peter, D. Effects of ecological compensation meadows on arthropod diversity in adjacent intensively managed grassland. Biol. Conserv. 2010, 143, 642–649. [Google Scholar] [CrossRef] [Green Version]
  14. He, J.; Zhu, X.D.; Sun, X.; Ai, J.Y. Ecological compensation standard of wetland restoration projects. Pol. J. Environ. Stud. 2015, 24, 2421–2432. [Google Scholar] [CrossRef]
  15. Wei, X.Y.; Xia, J.X. Ecological compensation for large water projects based on ecological footprint theory: A case study in China. Procedia Environ. Sci. 2012, 13, 1338–1345. [Google Scholar] [CrossRef]
  16. Rao, H.H.; Lin, C.C.; Kong, H.; Jin, D.; Peng, B.R. Ecological damage compensation for coastal sea area uses. Ecol. Indic. 2014, 38, 149–158. [Google Scholar] [CrossRef]
  17. Liu, M.; Yang, L.; Min, Q. Establishment of an eco-compensation fund based on eco-services consumption. J. Environ. Manag. 2018, 211, 306–312. [Google Scholar] [CrossRef]
  18. Yu, B.; Xu, L.Y.; Yang, Z.F. Ecological compensation for inundated habitats in hydropower developments based on carbon stock balance. J. Clean. Prod. 2016, 114, 334–342. [Google Scholar] [CrossRef]
  19. Tan, L.; Zhang, Q.G.; Zhang, Y. Modelling a compensation standard for a regional forest ecosystem: A case study in Yanqing district, Beijing, China. Int. J. Environ. Res. Public Health 2018, 15, 565. [Google Scholar] [CrossRef]
  20. Wang, J. The construction progress and prospects of China’s ecological compensation system. Arch. Environ. Prot. 2014, 42, 18–22. (In Chinese) [Google Scholar] [CrossRef]
  21. Ouyang, Z.Y.; Zheng, H.; Yue, P. Establishment of ecological compensation mechanisms in China: Perspectives and strategies. Acta Ecol. Sin. 2013, 33, 0686–0692. [Google Scholar] [CrossRef]
  22. Wunder, S. When payments for environmental services will work for conservation. Conserv. Lett. 2013, 6, 230–237. [Google Scholar] [CrossRef]
  23. Guo, L. Doing battle with the green monster of Taihu Lake. Science 2007, 317, 1166. [Google Scholar] [CrossRef] [PubMed]
  24. Qin, B.Q.; Zhu, G.W.; Gao, G.; Zhang, Y.L.; Li, W.; Hans, W.P.; Wayne, W.C. A drinking water crisis in lake Taihu, China: Linkage to climatic variability and lake management. Environ. Manag. 2010, 45, 105–112. [Google Scholar] [CrossRef] [PubMed]
  25. Tao, Y.Q.; Yao, S.C.; Xue, B.; Deng, J.C.; Wang, X.L.; Feng, M.H.; Hu, W.P. Polycyclic aromatic hydrocarbons in surface sediments from drinking water sources of Taihu Lake, China: Sources, partitioning and toxicological risk. J. Environ. Monit. 2010, 12, 2282–2289. [Google Scholar] [CrossRef]
  26. Finance Department and Environmental Protection Department of Jiangsu Province. Interim Measures on Transfer Payment of Ecological Compensation in Jiangsu Province. Available online: http://www.js.gov.cn/art/2013/12/26/art_46691_2587261.html (accessed on 26 December 2013).
  27. Jiangsu Provincial Government. National Ecological Protection Red-Line Planning of Jiangsu Province. Available online: http://www.jiangsu.gov.cn/art/2018/6/26/art_46143_7715521.html (accessed on 26 June 2018).
  28. Loomis, J.; Kent, P.; Strange, L.; Fausch, K.; Covich, A. Measuring the total economic value of restoring ecosystem services in an impaired river basin: Results from a contingent valuation survey. Ecol. Econ. 2000, 33, 103–117. [Google Scholar] [CrossRef]
  29. Van Oudenhoven, A.P.; Petz, K.; Alkemade, R.; Hein, L.; Groot, R.S. Framework for systematic indicator selection to assess effects of land management on ecosystem services. Ecol. Indic. 2013, 21, 110–122. [Google Scholar] [CrossRef]
  30. Zhang, Q.F.; Wu, F.Q.; Wang, L.; Yuan, L.; Zhao, L.S. Application of PCA integrated with CA and GIS in eco-economic regionalization of Chinese Loess Plateau. Ecol. Econ. 2011, 70, 1051–1056. [Google Scholar] [CrossRef]
  31. Changzhou City Statistics Bureau. Changzhou Statistical Yearbook 2001; China Statistical Press: Beijing, China, 2001.
  32. Suzhou City Statistics Bureau. Suzhou Statistical Yearbook 2001; China Statistical Press: Beijing, China, 2001.
  33. Wuxi City Statistics Bureau. Wuxi Statistical Yearbook 2001; China Statistical Press: Beijing, China, 2001.
  34. Sun, X.; He, J.; Shi, Y.Q.; Zhu, X.D.; Li, Y.F. Spatiotemporal change in land use patterns of coupled human-environment system with an integrated monitoring approach: A case study of Lianyungang, China. Ecol. Complex 2012, 12, 23–33. [Google Scholar] [CrossRef]
  35. The Ministry of Water Resources of the People’s Republic of China. Hydrological Yearbook of the People’s Republic of China 2000; Hydrological data of Yangtze River Basin (Taihu Lake); Hydrological Bureau of the Ministry of Water Resources of the People’s Republic of China Press: Beijing, China, 2010.
  36. Costanza, R.; d’Arge, R.; de’Groot, R.; Farber, S.; Grasso, M.; Hannon, B.; Limburg, K.; Naeem, S.; ONeill, R.V.; Paruelo, J.; et al. The value of the world’s ecosystem services and natural capital. Nature 1997, 387, 253–260. [Google Scholar] [CrossRef]
  37. He, J.; Yan, Z.Y.; Wan, Y. Trade-offs in ecosystem services based on a comprehensive regionalization method: A case study from an urbanization area in China. Environ. Earth Sci. 2018, 77, 179. [Google Scholar] [CrossRef]
  38. Xie, G.D.; Zhen, L.; Lu, C.X.; Xiao, Y.; Chen, C. Expert knowledge based valuation method of ecosystem services in China. J. Nat. Res. 2008, 23, 911–919. (In Chinese) [Google Scholar] [CrossRef]
  39. Hu, Y.; Peng, J.; Liu, Y.; Tian, L. Integrating ecosystem services trade-offs with paddy land-to-dry land decisions: A scenario approach in Erhai Lake Basin, southwest China. Sci. Total Environ. 2018, 625, 849–860. [Google Scholar] [CrossRef] [PubMed]
  40. Asquith, N.M.; Vargas, M.T.; Wunder, S. Selling two environmental services: In-kind payments for bird habitat and watershed protection in Los Negros, Bolivia. Ecol. Econ. 2008, 65, 675–684. [Google Scholar] [CrossRef]
  41. Zheng, H.; Robinson, B.E.; Liang, Y.C.; Polasky, S.; Ma, D.C.; Wang, F.C.; Ruckelshaus, M.; Ouyang, Z.Y.; Daily, G.C. Benefits, costs, and livelihood implications of a regional payment for ecosystem service program. Proc. Natl. Acad. Sci. USA 2013, 110, 16681–16686. [Google Scholar] [CrossRef] [PubMed] [Green Version]
  42. Lantz, V.; Boxall, P.C.; Kennedy, M.; Wilson, J. The valuation of wetland conservation in an urban/peri urban watershed. Reg. Environ. Chang. 2013, 13, 939–953. [Google Scholar] [CrossRef]
  43. Mmopelwa, G.; Kgathi, D.L.; Molefhe, L. Tourists’ perceptions and their willingness to pay for park fees: A case study of self-drive tourists and clients for mobile tour operators in Moremi Game Reserve, Botswana. Tour. Manag. 2007, 28, 1044–1056. [Google Scholar] [CrossRef]
  44. Sample Size Calculator. The Survey System (A Website of Creative Research Systems). Available online: www.surveysystem.com/sscalc.htm (accessed on 5 April 2012).
  45. Zhang, X.L.; Pu, L.J. Anaysis of influence on ecosystem service value due to land-use change in Wuxi over the last decade. J. Shangdong Norm. Univ. 2009, 24, 84–88. (In Chinese) [Google Scholar] [CrossRef]
  46. Shi, Y.Y.; Lu, X.; Huang, X.J.; Yu, M. Arable land use transitions and its response of ecosystem services value change in Jiangsu coastal areas. J. Nat. Resour. 2017, 32, 961–976. (In Chinese) [Google Scholar] [CrossRef]
  47. Dai, M.; Liu, Y.N.; Chen, L.J. The study on quantitative standard of Eco-compensation under major function-oriented zone planning and opportunity cost. J. Nat. Resour. 2013, 28, 1310–1317. (In Chinese) [Google Scholar] [CrossRef]
  48. Kosoy, N.; Martinez-Tuna, M.; Muradian, R.; Martinez-Alier, J. Payments for environmental services in watersheds: Insights from a comparative study of three cases in Central America. Ecol. Econ. 2007, 61, 446–455. [Google Scholar] [CrossRef]
  49. Zhou, C.; Ding, X.H.; Li, G.P.; Wang, H.Z. Ecological compensation standards in the water source area of the middle route project of the South-North water transfer project. Resour. Sci. 2015, 37, 0792–0804. (In Chinese) [Google Scholar]
  50. Lai, M.; Wu, S.H.; Yin, Y.H.; Pan, T. Accounting for eco-compensation in the three-river headwaters region based on ecosystem service value. Acta Ecol. Sin. 2015, 35, 227–236. (In Chinese) [Google Scholar] [CrossRef]
  51. Newton, A.C.; Hodder, K.; Cantarello, E.; Perrella, L.; Birch, J.C.; Robins, J.; Douglas, S.; Moody, C.; Cordingley, J. Cost-benefit analysis of ecological networks assessed through spatial analysis of ecosystem services. J. Appl. Ecol. 2012, 49, 571–580. [Google Scholar] [CrossRef]
  52. Ferraro, P.J.; Hanauer, M.M.; Miteva, D.A.; Nelson, J.L.; Pattanayak, S.K.; Nolte, C.; Sims, K.R.E. Estimating the impacts of conservation on ecosystem services and poverty by integrating modeling and evaluation. J. Appl. Ecol. 2015, 112, 7420–7425. [Google Scholar] [CrossRef] [PubMed] [Green Version]
Figure 1. The location of the study area.
Sustainability 11 04876 g001
Figure 2. The study framework. SWCR: Suzhou–Wuxi–Changzhou region, ESV: ecosystem service value, ECS: ecological compensation standards, RS: remote sensing, DEM: digital elevation model, GIS: geographic information system, GDP: gross domestic product.
Sustainability 11 04876 g002
Figure 3. Assessment methods of ecosystem service values in SWCR.
Sustainability 11 04876 g003
Figure 4. The increment of total ecosystem service values from 2000 to 2010.
Sustainability 11 04876 g004
Figure 5. The regionalization of the increment of total ecosystem service values.
Sustainability 11 04876 g005
Figure 6. The changes of eight ESVs per unit area under five scenarios.
Sustainability 11 04876 g006
Figure 7. The spatial distribution of the areas of farmland converted to wetland.
Sustainability 11 04876 g007
Figure 8. The statistics of willing to pay bid amounts.
Sustainability 11 04876 g008
Table 1. Sample sizes in the investigation area.
AreasPopulation (104 People)Households (104 Households)Area (km2)Samples (Households)
Chong’an District18.6510.7017.59245
Suzhou Industrial Park35.4911.35288170
Zhonglou District35.3812.6072.2185
Total89.5234.65377.79600
Table 2. Change in ecosystem service values in the study area from 2000 to 2010.
Type of Ecosystem ServiceTotal Value (108 Yuan)Average Annual Change Rate (%)
Primary TypesSecondary Types20002010
Provisioning servicesMaterial production184.18326.857.75
Regulating servicesGas regulation32.4631.22−0.38
Climate regulation52.9436.75−3.06
Hydrological regulation207.77217.650.48
Waste treatment195.34202.170.35
Soil conservation38.4239.140.19
Cultural servicesLeisure and recreation59.4362.370.50
Supporting servicesBiodiversity61.7861.19−0.09
Total 832.31977.351.74
Table 3. Change in ecosystem service values of different land-use types from 2000 to 2010.
YearAgricultural LandWoodlandWetlandGrasslandUnutilized Land
ESVs (108 Yuan)2000202.3263.78538.8727.320.02
2010250.1380.07608.0839.000.07
Proportion (%)200024.317.6664.743.280.00
201025.598.1962.223.990.01
Annual change rate (%) 2.362.551.284.2825.00
ESVs per unit area (104 Yuan/ha)20002.086.9612.3065.470.23
20103.388.8713.04117.930.17
Annual change rate of ESVs per unit area (%) 6.252.740.608.01−2.61
Table 4. Average value of zoning indicators in four zones from 2000 to 2010.
Zone TypesZonesChange of GDP Per Unit Area (108 Yuan/km2)Change of Population Density (104 Person/km2)Change of Urban Expansion IntensityChange of ESVs (108 Yuan/Year)
ESV output areaZone I2.459 0.086 0.016 2.221
Zone II0.638 0.007 0.008 14.487
ESV input areaZone III3.7760.300 0.028 −0.932
Zone IV16.460 −0.0940.018−0.092
Note: GDP: gross domestic product.
Table 5. The changes of ESVs in five scenarios (unit: Yuan 108/a).
ScenariosSoil ConservationBiodiversityWaste TreatmentMaterial ProductionGas RegulationClimate RegulationHydrological RegulationLeisure and RecreationChanges of Total ESVs
Scenario I0.020.140.650.000.050.340.730.212.15
Scenario II −0.10−0.10−0.23−0.09−0.07−0.14−0.22−0.06−1.02
Scenario III−0.080.040.41−0.09−0.010.190.510.141.10
Scenario IV−0.24−0.130.04−0.23−0.12−0.040.150.05−0.53
Scenario V−0.050.251.39−0.090.060.711.610.464.34
Table 6. The opportunity costs of ecosystem service output zones.
ZonesCities and DistrictsGrain Yield Per Hectare (kg/ha)Area of Agricultural Land Converted to Wetland (ha/year)Unit Price of Grain (Yuan/kg)Opportunity Costs (10,000 Yuan/Year)
Synergetic development zoneCanglang District7131 *0.001.4102
Pingjiang District7131 *0.00
Jinchang District7131 *0.00
Xinbei District66202.42
Qishuyan District81560.08
Tianning District7131 *0.34
Huishan District6889 *24.51
Xishan District6889 *0.91
Binhu District6889 *6.03
Jiangyin City681028.85
Suzhou High-tech Zone7171 *0.00
Taicang City693471.38
Kunshan City70421024.06
Xiangcheng District7171*278.09
Mean7078102.62
Ecological conservation areaJintan City6995223.73279
Liyang City7510451.99
Wujin District678781.55
Yixing City6722126.79
Wuzhong District7171 *321.56
Wujiang City7829536.73
Zhangjiagang City668347.97
Changshu City7198455.29
Mean7112280.70
Note: * indicates that there was no data for the separated grain crop yield in this area, which was replaced by the average of the city or the whole city.
Table 7. The direct costs of ecosystem service output zones. WRPs: wetland restoration projects,
ZonesWRPsWetland Area (ha)Construction Cost (108 Yuan/Year)Construction Cost Per Unit Area (108 Yuan/Year)Operating Cost (108 Yuan/Year)Operating Cost Per Unit Area (108 Yuan/Year)Total Cost Per Unit Area (108 Yuan/Year)Direct Cost (Billion Yuan/Year)
Synergetic development zoneShiba Bay wetland 26588.960.02210.980.0030.0246 1.94
Guanshe Mountain wetland 5816.410.0183.960.0040.0229
Shangxian River 8719.630.0156.320.0050.0194
Changguangxi wetland 9327.610.0198.710.0060.0255
Lianghe Bay wetland1955.060.0024.020.0010.0030
Lianghong wetland 12040.640.0229.080.0050.0270
Gonghu Lake 953.830.0032.360.0020.0042
Jiuli River 471.530.0022.390.0030.0054
Mean 0.013 0.0040.0165
Ecological conservation zoneShatang Port– Zhudu Port 762.910.0021.930.0020.0042 0.71
Dapu Port 832.760.0021.430.0010.0033
Mean 0.002 0.0020.0038
Table 8. Ecological compensation standard of ecosystem service output zones.
ZonesOpportunity Cost (Million Yuan/Year)Direct Cost (Billion Yuan/Year)Increment of ESVs (Million Yuan/Year)
Synergetic development zone1.021.9422.30
Ecological conservation zone2.790.7190.00
Total3.812.65112.30
Table 9. Spearman correlation analysis of the effects of location on willingness to pay (WTP) amounts.
VariablesCorrelation Coefficientp-Value (2-Tailed)Samples
Location–WTP amounts−0.2070.000 **391
Note: ** p < 0.01.
Table 10. Influencing factors of willingness to pay amounts under distance restrictions.
ModelsSignificant VariablesUnstandardized Coefficient (B)p-Value95% Confidence Interval
Model A: Suzhou Industrial Park (short distance)Constant2.6040.0001.7523.457
Household income0.4140.0000.2770.551
Model B: Chong’an District (medium distance) Constant1.9240.0001.1302.718
Household income0.4760.0000.3260.626
Education−0.1250.019−0.230−0.021
Model C: Zhonglou District (long distance)Constant1.9290.0020.7873.071
Household income0.3100.0200.0510.569
Age−0.3120.005−0.526−0.097
Table 11. WTP in different districts.
ZonesCities and DistrictsHouseholds (104)Average WTP (Yuan/Household·Year)WTP (104 Yuan/Year)
Economic development areaChong’an District10.7068.50733
Ecological degradation areaSuzhou Industrial Park11.3525.53225
Zhonglou District12.6012.71
Total34.65
Table 12. The ecological compensation standard of ecosystem services input zone.
ZonesWTP (Million Yuan/Year)Decrements of ESVs (Million Yuan/Year)The Ratio of Ecological Compensation to GDP (%)
Ecological degradation area2.25−2.200.01
Economic development area7.33−0.060.05
Total9.58−2.26

