Dynamic Feedback Analysis of Influencing Factors and Challenges of Dockless Bike-Sharing Sustainability in China


1
School of Economics and Management, Beijing University of Posts and Telecommunications, Beijing 100876, China
2
Department of Electrical and Computer Engineering, Jack Baskin School of Engineering, University of California, Santa Cruz, CA 95060, USA
*
Author to whom correspondence should be addressed.
Sustainability 2019, 11(17), 4674; https://doi.org/10.3390/su11174674
Submission received: 16 July 2019
/
Revised: 20 August 2019
/
Accepted: 25 August 2019
/
Published: 28 August 2019
(This article belongs to the Special Issue Sustainable Mobility: Social, Technological and Environmental Issues)
Abstract
:Dockless bike-sharing programs (DBSPs) are typical representatives of the new era of the internet economy. These schemes alleviate urban traffic congestion, reduce carbon emissions, and change people’s preferred travel modes, but they also suffer from a series of problems related to unsustainability. The sustainability performance of a DBSP is closely related to its influencing factors, which can be used to understand the main challenges of the program and consider what useful measures should be taken to overcome these issues. Therefore, it is essential to investigate the related factors that are critical to the sustainability of DBSPs from a systems-level perspective. In this paper, we explored publicly available data sources (i.e., literature, institutional reports, and announcements) to determine the intrinsic influencing factors and understand their interactions and feedback relationships. A taxonomy of the key challenges with respect to the fundamental pillars of DBSP sustainability (i.e., environment, society, and economy) was provided. System dynamics methodology was employed to map the critical factors and links in order to analyze the key challenges in facilitating the sustainability of DBSPs. Based on this approach, we put forward proposals to mitigate the severe challenges for governments and DBSP operators. The findings provide a theoretical basis and guiding role to develop improvement strategies for DBSP sustainability.
1. Introduction
For the past four years, dockless bike-sharing programs (DBSPs) have developed rapidly in China, thanks mainly to mobile payment systems, which allow borrowing and returning of the bikes to occur at any time and any place. There are also other reasons why people choose to share bikes, including this transportation mode being economically cost-effective and a way to keep fit and healthy [1]. With the support of mobile Internet and global positioning system (GPS) technology, users can use shared bikes more conveniently. The shared bike supply can be precisely matched to the user’s needs; these schemes are different from traditional station-based bike-sharing programs. Through this program, urban dwellers can ease the travel problem of “the last mile”, improve the efficiency of urban travel, and achieve a low-carbon lifestyle [2]. The development of DBSPs is in line with green consumption and sustainable urban travel modes advocated by governments. DBSPs rely on these significant advantages in order to be spread around hundreds of cities globally, with more than 200 million users worldwide in the short time they have been available [3].
However, with the large-scale development of DBSPs in cities, a series of unsustainability issues have been exposed in China [4]. These issues include the following. (1) The profit model is currently unsuitable, as DBSPs are difficult to profit from when only relying on direct bike-riding profits. (2) Many DBSPs blindly compete in a market consisting of various cities, where the number of bikes supplied far exceeds market demand. (3) Cycling facilities currently cannot support the huge number of shared bikes, resulting in irregular parking and illegal cycling, which seriously affects the traffic order and hampers pedestrian safety. Cycling facilities should be constructed with a reasonable spatial distribution. (4) Relevant regulations and market supervision are still not perfect, with vandalism and theft rates of shared bikes still very high. (5) There are no standards for the cost and quality of shared bikes, meaning excessively damaged and safety concerns often cause trouble for users. These issues must be addressed to achieve DBSP sustainability.
The history of shared bikes can be traced back to the 1960s, with the first “shared” concept bike was born in Amsterdam, the Netherlands [5]. In many developed cities (e.g., New York, Paris, Copenhagen, Melbourne), station-based bike-sharing programs are well-established due to smooth operation and local government management [6]. Many articles studied these programs from the perspectives of policy, usage, planning, rebalancing, and health impacts to improve usage [7,8,9]. However, many of these DBSPs ended in failure after a few months of operation in many developed cities. For example, in July 2018, Ofo announced the closure of its Australian operations [10]. In August, Ofo announced its withdrawal from the U.S. Seattle market [11]. In September, Mobike decided to give up the Manchester market [12]. The issues of unsustainability in the DBSP industry have caught the attention of more and more people around the world.
Various local governments correspondingly launched a series of policies to alleviate these issues according to urban characteristics. For example, the Beijing government regulated the maximum number of shared bikes supplied to relieve the pressure on urban space and prevent the waste of resources [13]. The Shanghai government established relevant standards for the quality of shared bikes in order to maintain users’ safety [14]. To maintain traffic order, the Sydney government penalized operators for illegal parking [15]. Despite the introduction of more and more policies, DBSPs have not materialized to the anticipated level. The key cause is that DBSPs involve various stakeholders, numerous factors, and complex feedback relationships. Thus, there are still no effective policies to enable sustainable DBSP performance [16].
Several authors conducted research on DBSPs and focused mainly on user behavior [17,18], big data, machine learning applications [19,20,21], and environmental benefits [22,23]. Nickkar et al. considered facility distribution with the aim of equitably providing service to all potential riders, which helps DBSPs increase their profit and market share [24]. Dang et al. provided a great way to measure DBSP size, which is an important factor of achieving DBSP sustainability [25]. Although Shi et al. studied the relationship between these related factors using social network analysis [26], they did not analyze dynamic feedback characteristics from a systems-level perspective. The interactive and complex dynamic characteristics of DBSPs were not clearly reflected in their research. The relationship between stakeholders and the numerous influencing factors of DBSPs is intricate and complex. Therefore, it is essential to research the influencing factors and their interactions and feedback relationships that relate to DBSP sustainability and discuss what pertinent strategies should be formulated from a systems-level perspective.
In this paper, our main objectives were: (1) To map DBSP sustainability-related challenges in certain medium–large cities from the associated influencing factors and their corresponding feedback relationships; (2) to explore the non-linear behavior and the implicit complexities of the dynamic feedback system to obtain a deeper understanding of DBSP sustainability; and (3) to provide the basis for research to improve system performance and formulate effective strategies in the management of DBSPs. To achieve these objectives, a system dynamics (SD) feedback relationship model of DBSPs was established to tackle major sustainability challenges from a bike-sharing closed-loop supply chain (BSCLSC) perspective [27]. The choice of an SD approach was based on its excellent ability in policy-making at a strategic level in regard to an extensive range of industries and challenges [28]. This approach overcomes the limitation of only focusing on several influencing factors that hindered previous research. Our research findings, which are reflected in a causal loop diagram (CLD), adequately reveal the structural relationships of the system and systematically present the feedback relationships and interactions between a variety of factors that influence DBSP sustainability. Meanwhile, our research contributes to the existing literature of shared bikes by classifying the key challenges into three pillars of DBSP sustainability, and provide a useful reference to generate effective strategies for DBSPs.
The paper is organized as follows. The research methodology is described in the next section. In Section 3, the influencing factors and key challenges of the DBSPs are discussed. In Section 4, the results displayed in an SD causal loop projection are presented alongside managerial implications. The research contribution is described in Section 5. Finally, the main conclusions are given. For the convenience of the reader, all the acronyms are summarized in Table A1 of Appendix A.
2. Research Methodology
SD is considered to be a significant method in interdisciplinary issue simulations and analysis, gaining ground over the past few years in the field of social sciences [29]. The principle of SD is insensitive to numbers and instead focuses on the “structure” of the system, treating the system as a feedback mechanism with a variety of information causalities to capture the dynamic behavior of a system [30]. In this paper, the SD method was used to understand the influencing factors and the interactions and feedback relationships of the identified challenges across BSCLSCs. We presented the dynamic feedback structure using a CLD to explicitly show the cause of the dynamic formation of this complex system. The CLD followed the conventions of the software Vensim DSS v5.6a (Ventana Systems Inc., Harvard, MA, USA), which was used to map relevant causal relationships and feedback loops.
The CLD treated all the variables as unit-less, and focused on the behavior between influencing factors in regard to feedback. The major advantage of the CLD was that it enabled using “hard” and “soft” variables in the diagram without the need to take their properties into account; instead, it only factored in the direction of their causal influences [31].
The CLD took a “systems-level” perspective to capture the mental models of systematic description. The causal relationships among the variables were depicted by annotated arrows. The polarity distinguished how independent variables changed to influence relevant variables. A positive (denoted as “+”) polarity indicated that the cause and effect changed in the same direction. Feedback loops that moved in the same direction were called reinforcing feedback loops. Similarly, a negative (denoted as “–”) polarity indicated that the cause and effect changed in opposite directions. Feedback loops that moved in opposite directions were called balancing feedback loops.
3. Influencing Factors and Key Challenges in DBSPs
Numerous factors influence stakeholders and the sustainability of DBSPs, which are closely linked to various key challenges. Hence, the influencing factors and key challenges of DBSPs should be fully considered. The variables and the corresponding stakeholders of the influencing factors are recognized in Section 3.1. A taxonomy of critical unresolved problems and key challenges is provided in Section 3.2 in order to identify interactions and feedback relationships and propose relevant management strategies.
3.1. Identification of Influencing Factors
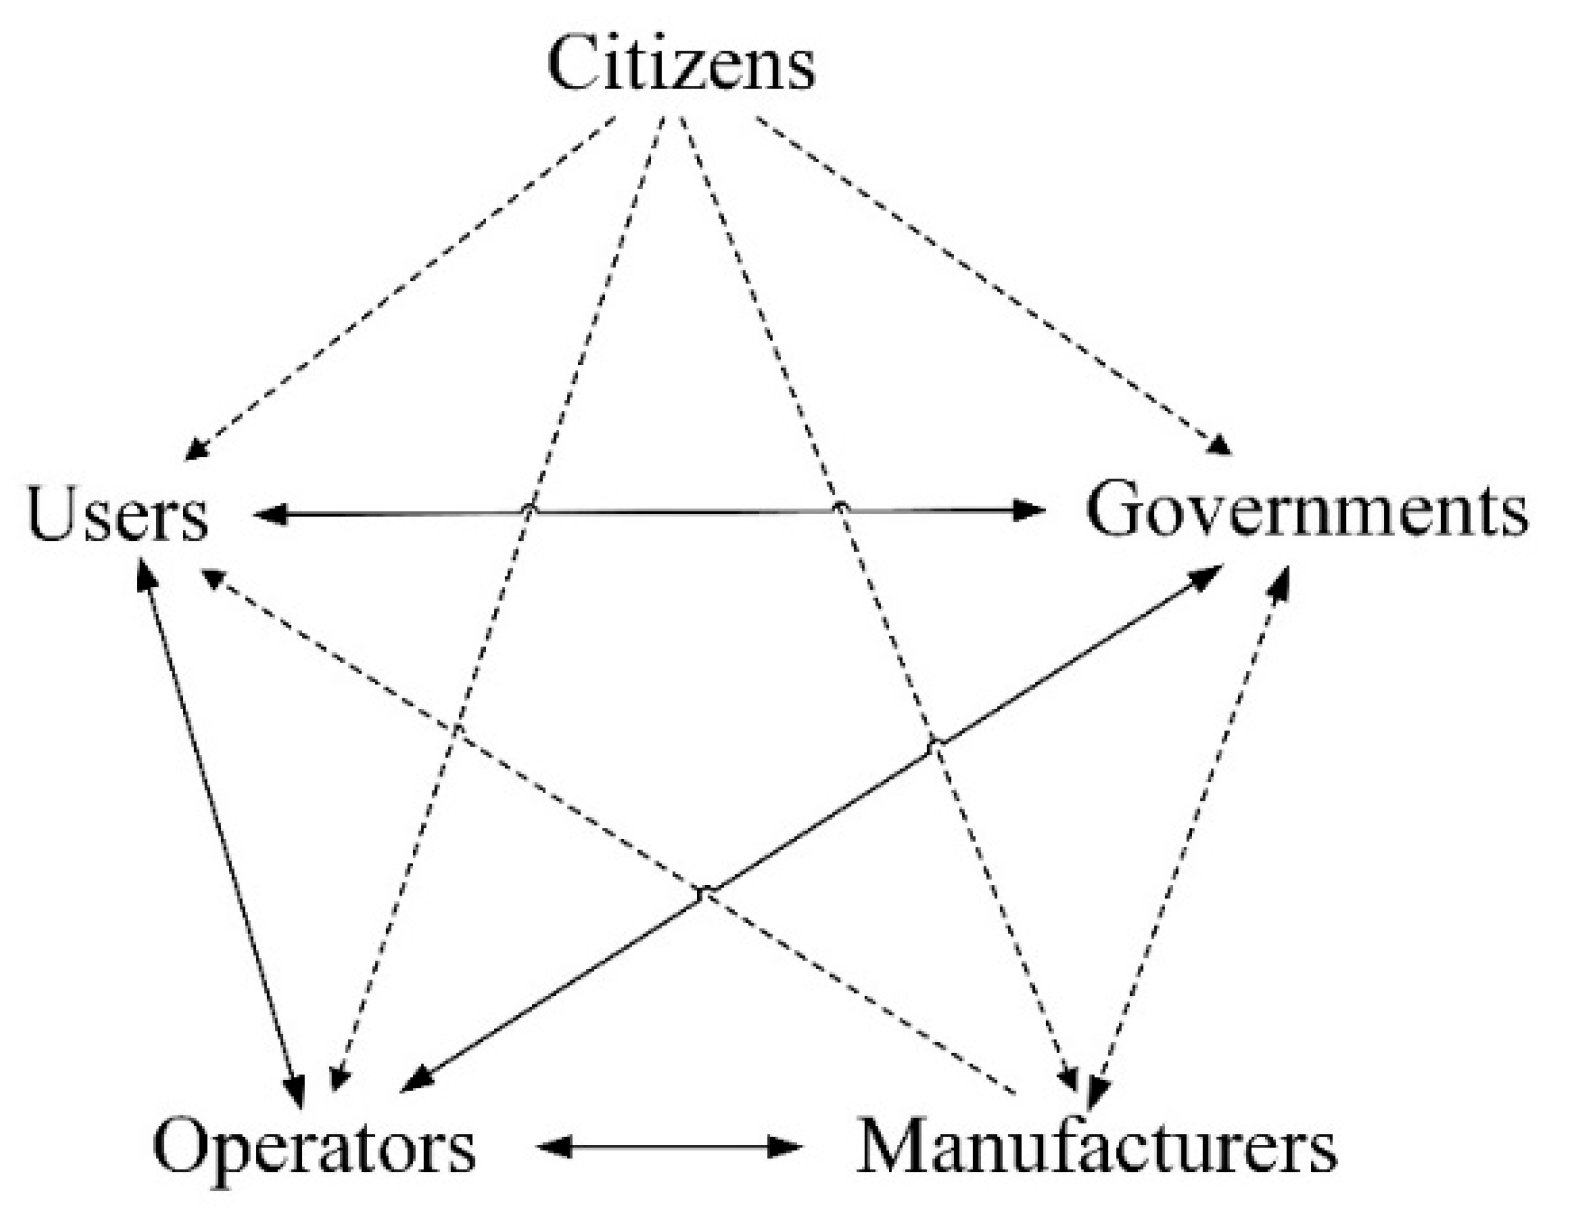
This study explored a large amount of publicly available data sources regarding DBSPs’ relative influencing factors, such as institutional authoritative publications, government announcements, and academic literature. According to classification and extraction, citizens, governments, users, operators, and manufacturers were determined to be the main stakeholder groups from the systems-level perspective, which is shown in Figure 1. The solid line indicates a direct influence, and the dashed line indicates an indirect influence.
On this basis, the influencing factors were constantly adjusted, corrected, and supplemented through several interviews and discussions. In order to propose potential comprehensive improvement strategies, these influencing factors were used to analyze the key challenges that hinder DBSP sustainability. Afterward, the influencing factors and their relationships were determined while considering the key challenges. The results are presented in Section 4.
3.2. Taxonomy of Key Challenges
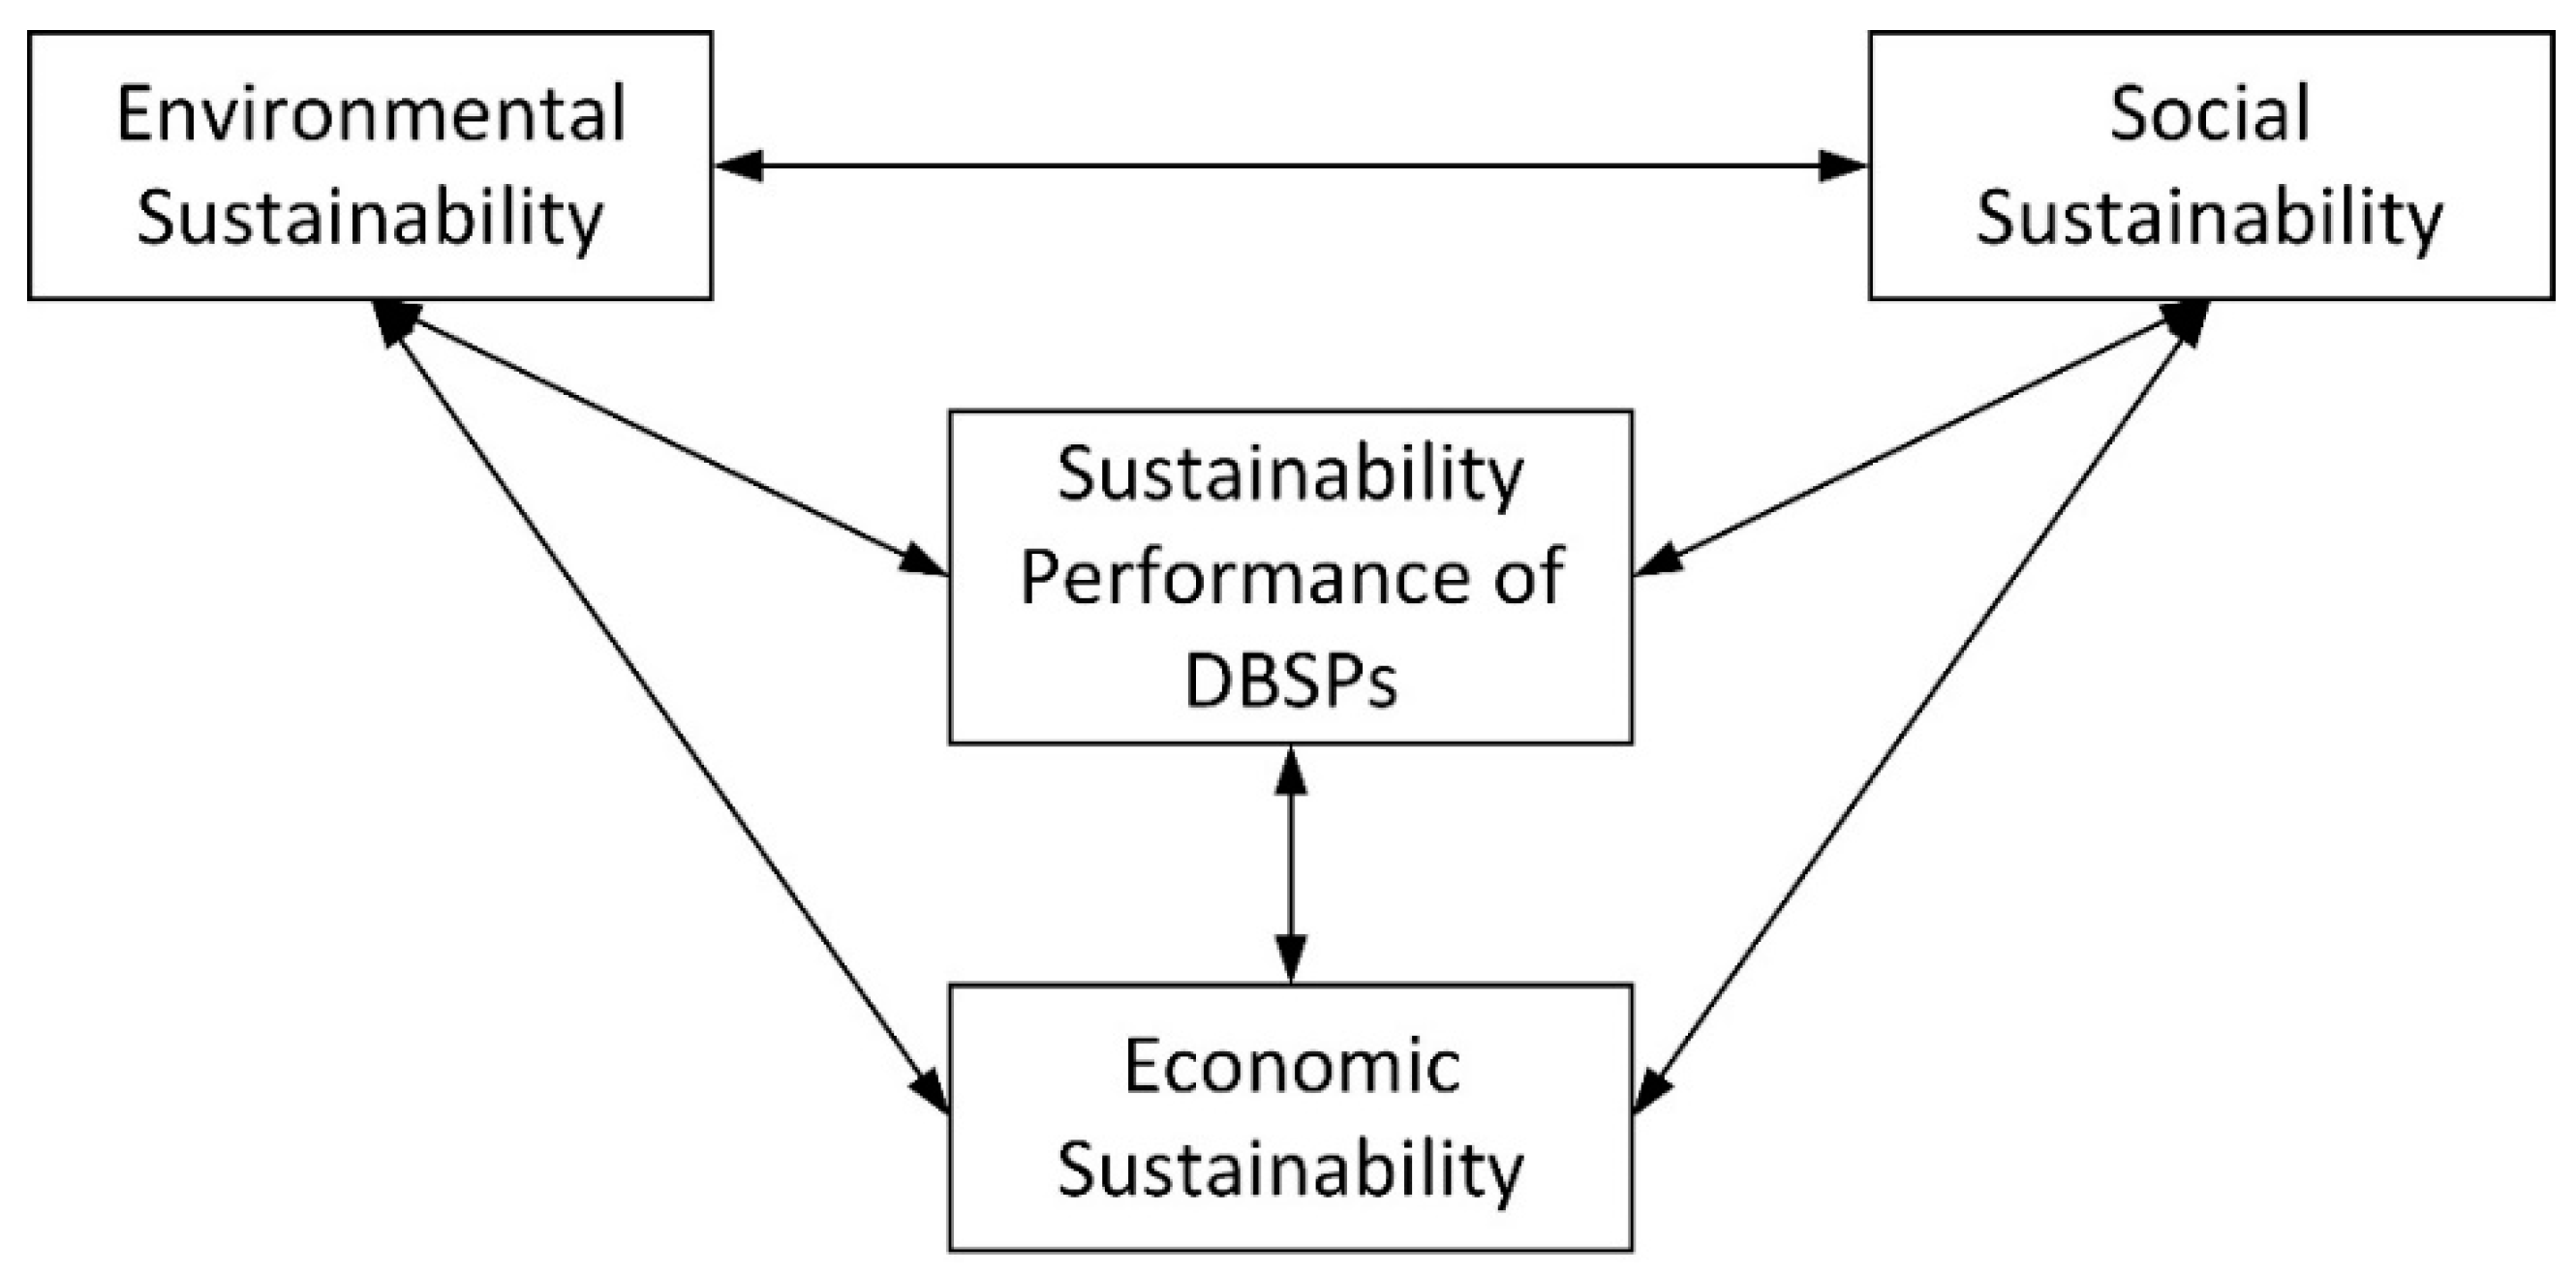
Sustainability, a development theory that guides humanity through the 21st century, has transcended pure environmental protection. It organically combines environmental and development issues, and has now become a comprehensive strategy for social and economic development [32]. Figure 2 shows that environmental, social, and economic sustainability are the main pillars of DBSP sustainability. These three pillars of sustainability are interconnected and mutually constrained to form a complex system. Complex systems are generally characterized by numerous influencing factors, delays in system behavior, and a complicated structure [33]. One of the reasons why this study used the SD method was due to its ability to model complex systems by means of visual representation.
On the basis of the analysis of publicly available data sources, we identified key challenges and important problems regarding DBSPs that remain unresolved. A BSCLSC perspective was employed to gain a more meaningful interpretation of the results [34]. Therefore, in the following four subsections, we provide a taxonomy of key challenges with respect to environmental, social, and economic sustainability regarding module production, processing–assembly–distribution, operation–maintenance, and consumption (renting) levels, respectively.
3.2.1. Module Production
Safety, the normal damage rate, and the recycling rate of shared bikes are the general denominators among the numerous challenges at the module production level. The Chinese government successfully launched relevant policies for DBSPs regarding these issues in recent years. In response to this situation, DBSPs have gradually changed from a traditional production mode to a modular production mode [35]. Through innovations in production and recycling technologies, component upgrades, and material improvements, DBSPs have increased the overall quality of shared bikes and recycling revenue, while approximately maintaining costs [36]. At the same time, they reduce resource waste and facilitate the maintenance of the order of the bike-sharing market. Table 1 summarizes the key challenges related to module production.
3.2.2. Processing–Assembly–Distribution
Based on the modular concept of manufacturing shared bikes, it is convenient to formulate quality standards for each module [42]. This way, quality control of the shared bikes can be achieved, and normal damage rates can be effectively reduced. The user’s riding experience can be promptly returned to the corresponding module manufacturer to improve the module. The modular supply chain adopts a distributed manufacturing model, which is conducive to optimizing transportation routes, saving transportation costs, and shortening the delivery cycle [35]. Moreover, in the BSCLSC, the modular supply chain facilitates the diagnosis and remanufacturing of non-repairable shared bikes to reduce the amount of waste material returned to the upstream echelon. Table 2 provides a summary of the main challenges with regard to the processing–assembly–distribution supply chain echelon.
3.2.3. Operation–Maintenance
Although the dockless bike-sharing industry has developed rapidly over recent years, there are still many shortcomings at the operation–maintenance level, which have produced chaos. Many influencing factors affect both the upstream and downstream echelon and greatly obstruct the development of the industry. In order to seize market resources, vicious competition between DBSPs occurred. Many DBSPs blindly provided shared bikes to the market without considering their profit models, daily operations, maintenance issues, etc. In addition, in the early stages of the industry’s development, governmental and industry regulatory mechanisms were still flawed. Even though the number of users surged in a short period of time, most Chinese DBSPs’ financial problems were exposed in 2018 [3]. The amount of market resources was also insufficient to supply the huge demand on the DBSP, which seriously disturbed the market and social orders. Table 3 outlines the related challenges regarding the operation–maintenance level.
3.2.4. Consumption (Renting)
In 2018, the bike-sharing industry entered a mature stage, and its growth momentum stabilized. The number of shared bike users reached 235 million [64]. Shared bikes are an environmentally friendly, low-carbon, healthier way to travel from the perspective of the user; they can improve travel efficiency and greatly reduce travel time. Even through the DBSP industry exposes many problems that affect people’s daily lives and work, users are still fairly satisfied [65]. Table 4 shows a list of the key challenges related to consumption (renting).
4. Results and Managerial Implications
In this paper, a BSCLSC was considered to contain the following four levels: (i) Module production, (ii) processing–assembly–distribution, (iii) operation–maintenance, and (iv) consumption. Three main pillars of sustainability were used to identify sustainability at each level. The dynamic feedback relationship of these challenges that influences BSCLSCs was presented through the corresponding CLD. The analysis of public data sources allowed the determination of the influencing factors and key challenges and their interactions and feedback relationships to structural elements.
In order to increase the readability of the diagrams, not all the variables of the influencing factors and their feedback relationships related to DBSP sustainability are presented in one CLD. The general BSCLSC model is shown in Section 4.1, and the analysis of environmental, social, and economic sustainability and the corresponding managerial implications are given in Section 4.2.
4.1. General BSCLSC Model
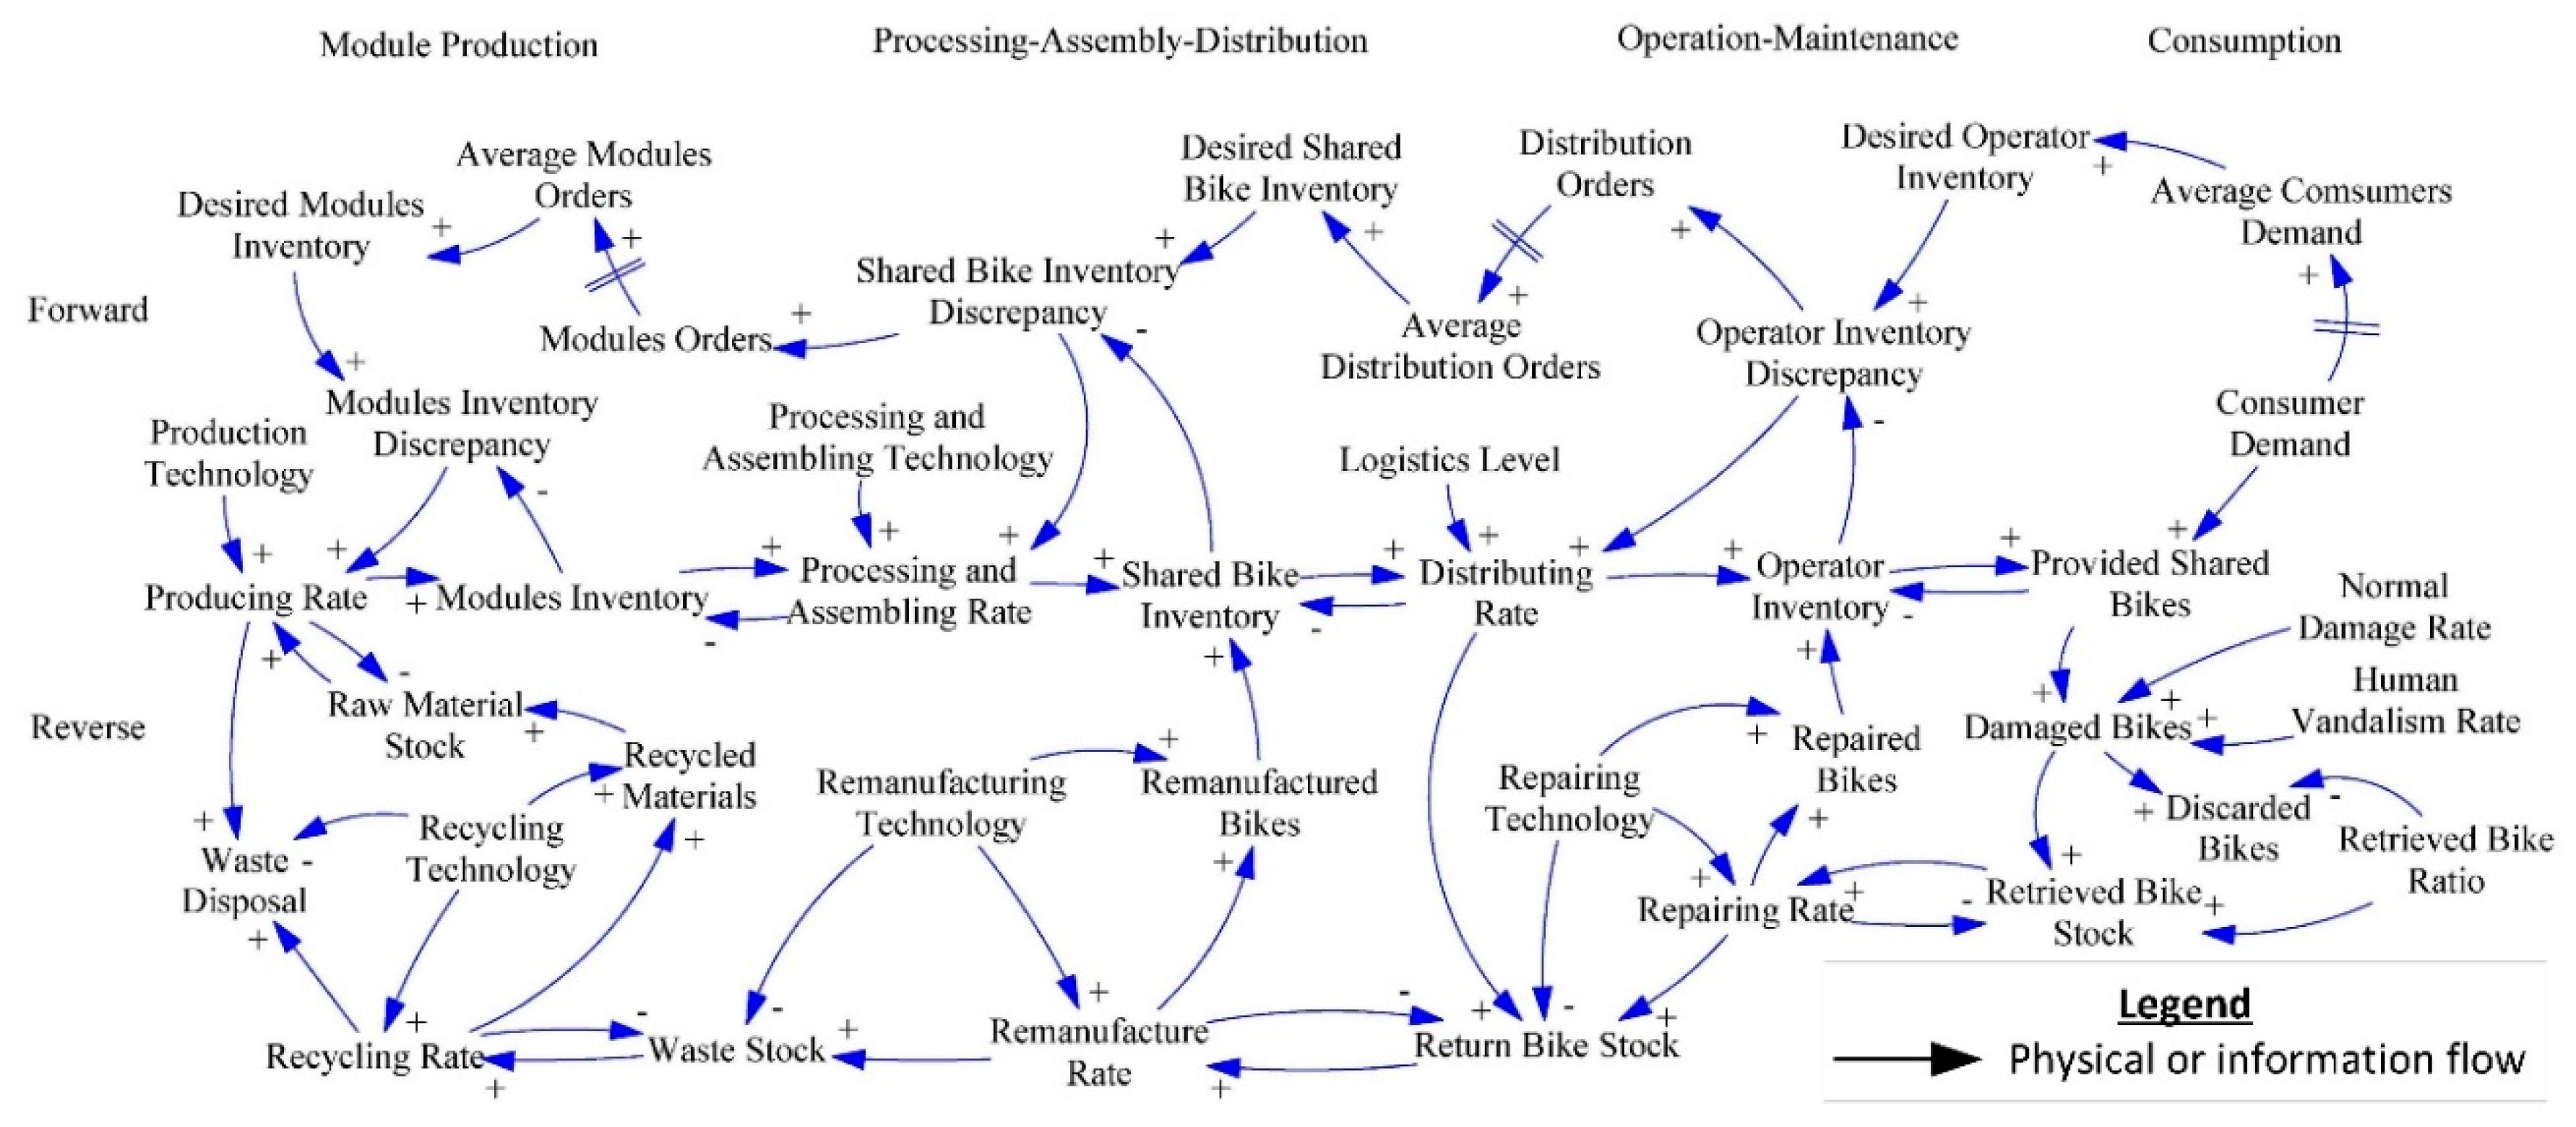
Figure 3 shows a CLD of the general BSCLSC, which consists of both forward and reverse processes simultaneously [3,34,73]. Based on this diagram, the following dynamic feedback analysis of DBSP sustainability was made.
Compared to the early bike-sharing supply chain, the currently adopted BSCLSC contributes to the improvement of the sustainability performance of DBSPs. The BSCLSC enables effective management of the shared bike life-cycle and reduces the adverse impacts of supply chain activities on the environment. After a damaged shared bike has undergone a series of processes, such as retrieval, repair, remanufacturing, and recycling, most of the materials are circulated in the BSCLSC. The BSCLSC should not only meet the requirements of the government, but should also have direct benefits, such as the reduction of resource input, decrease of inventory, and transportation costs, etc., which reduces the total cost and enhances competitiveness for the DBSP.
4.2. DBSP Sustainability Analysis and Managerial Implications (MI)
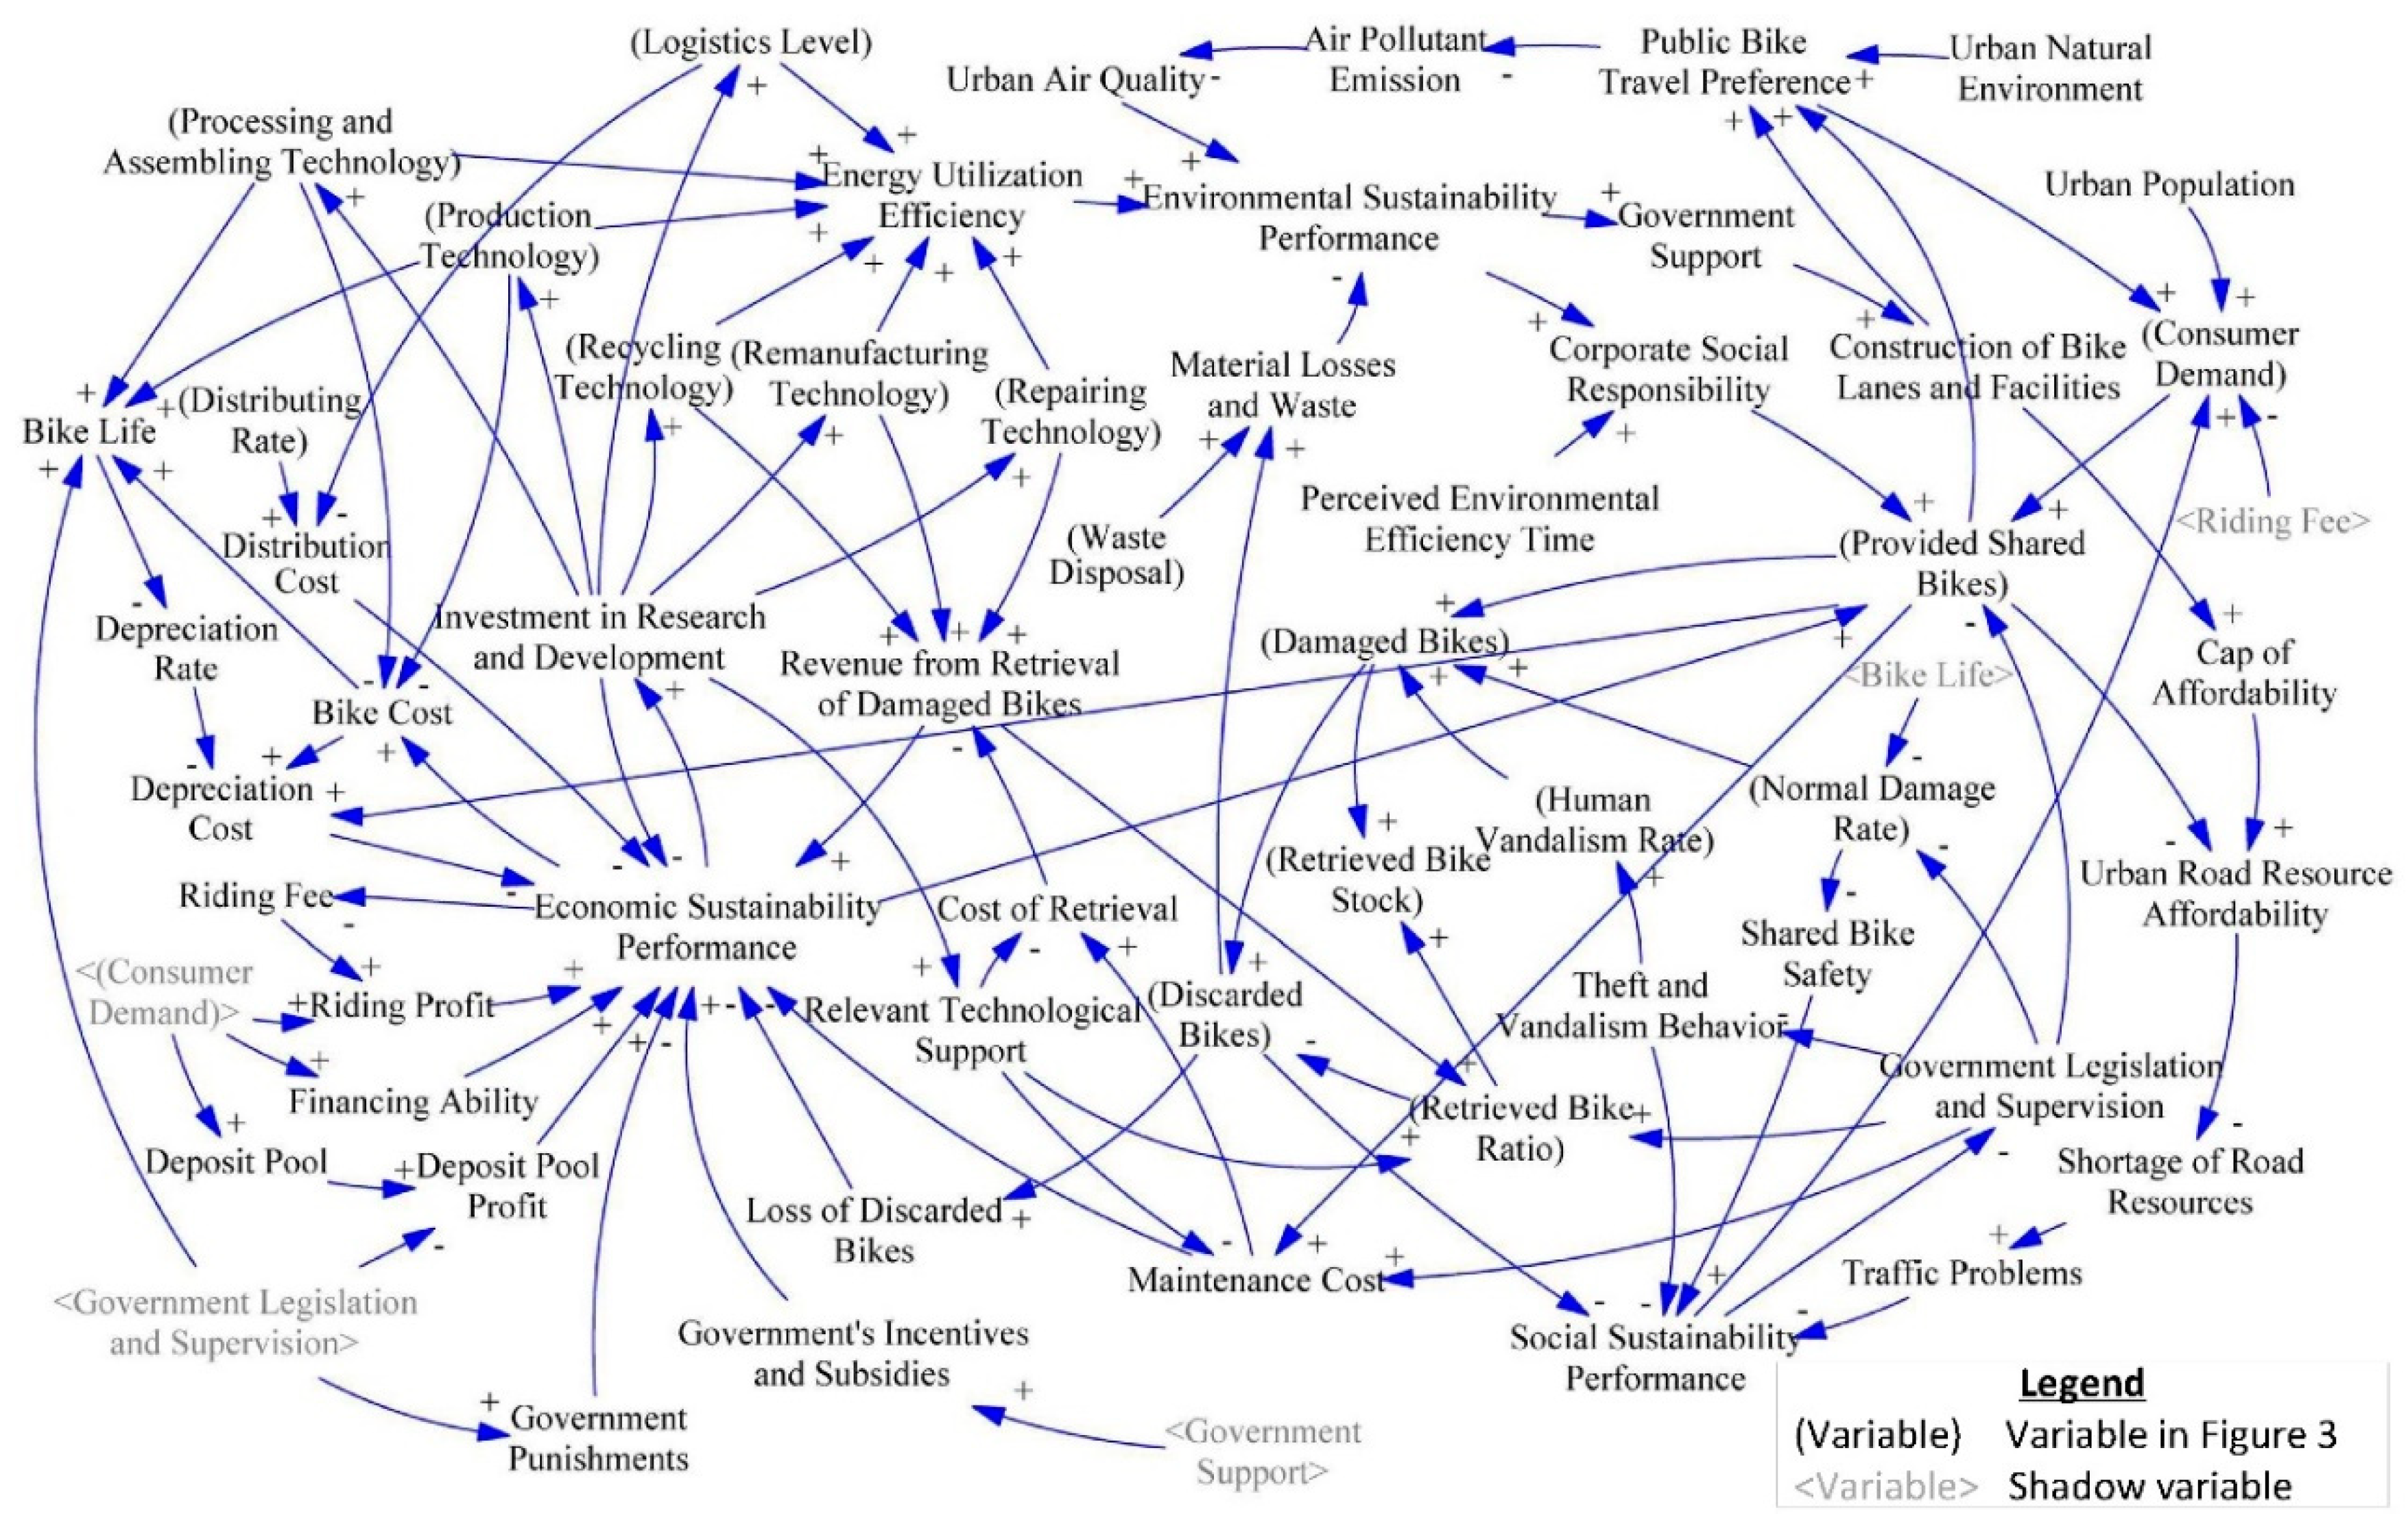
Figure 4 shows the causal relationships of the DBSPs’ environmental, social, and economic sustainability performance. The non-linear behaviors and complexities of the main challenges governing BSCLSCs in China are presented through this CLD. These three performances are interconnected and mutually constrained to decide DBSP sustainability together. Figure 4 helps us to determine the dynamic feedback relationships of the identified challenges and propose relevant managerial implications.
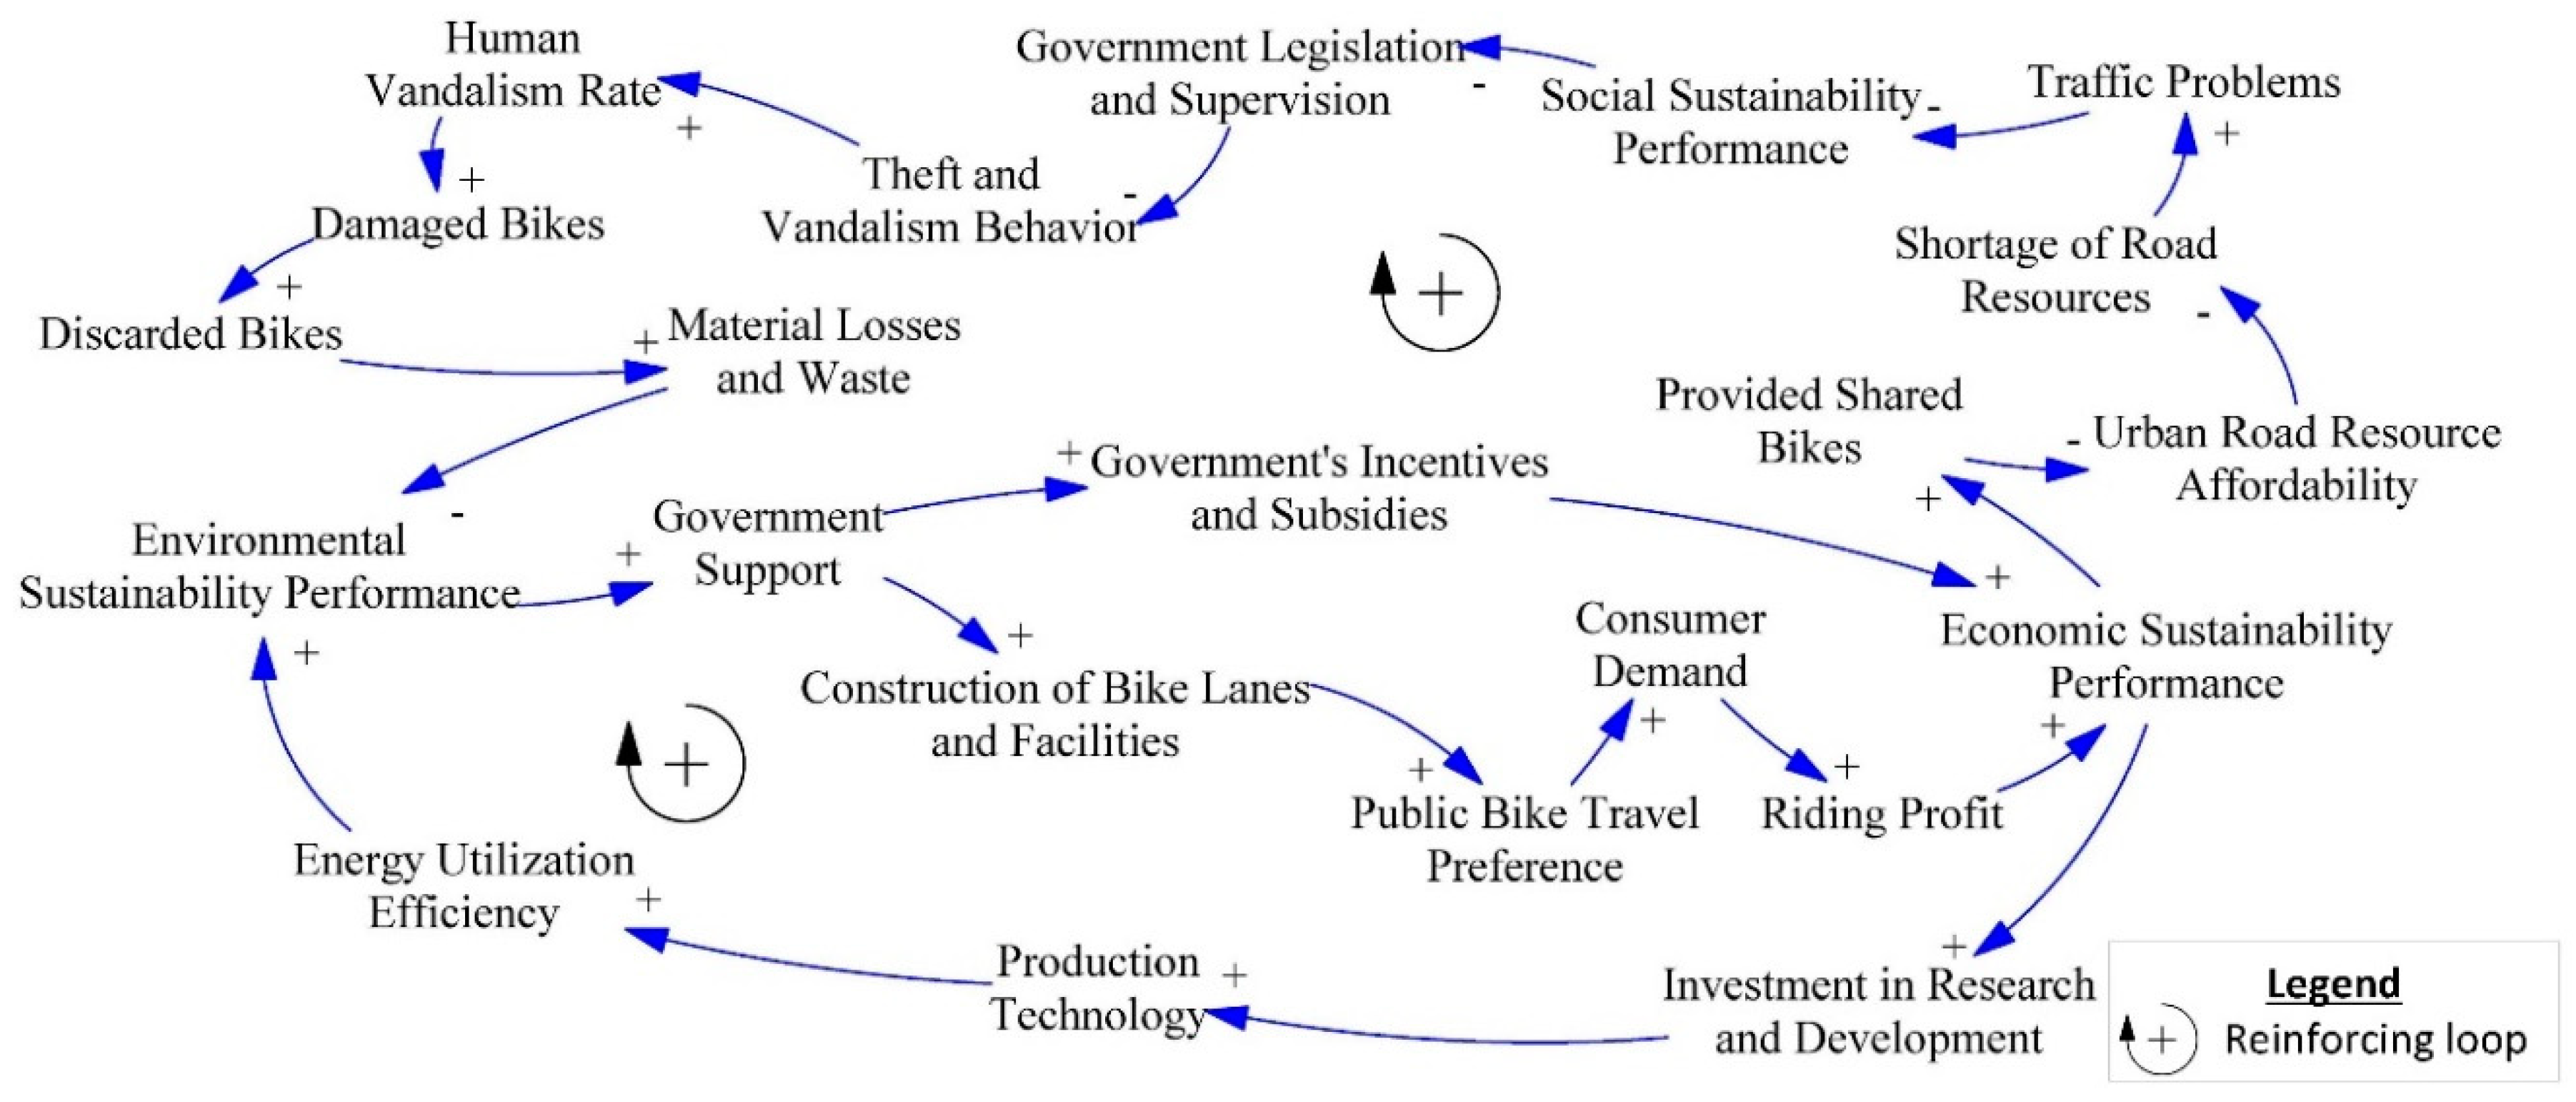
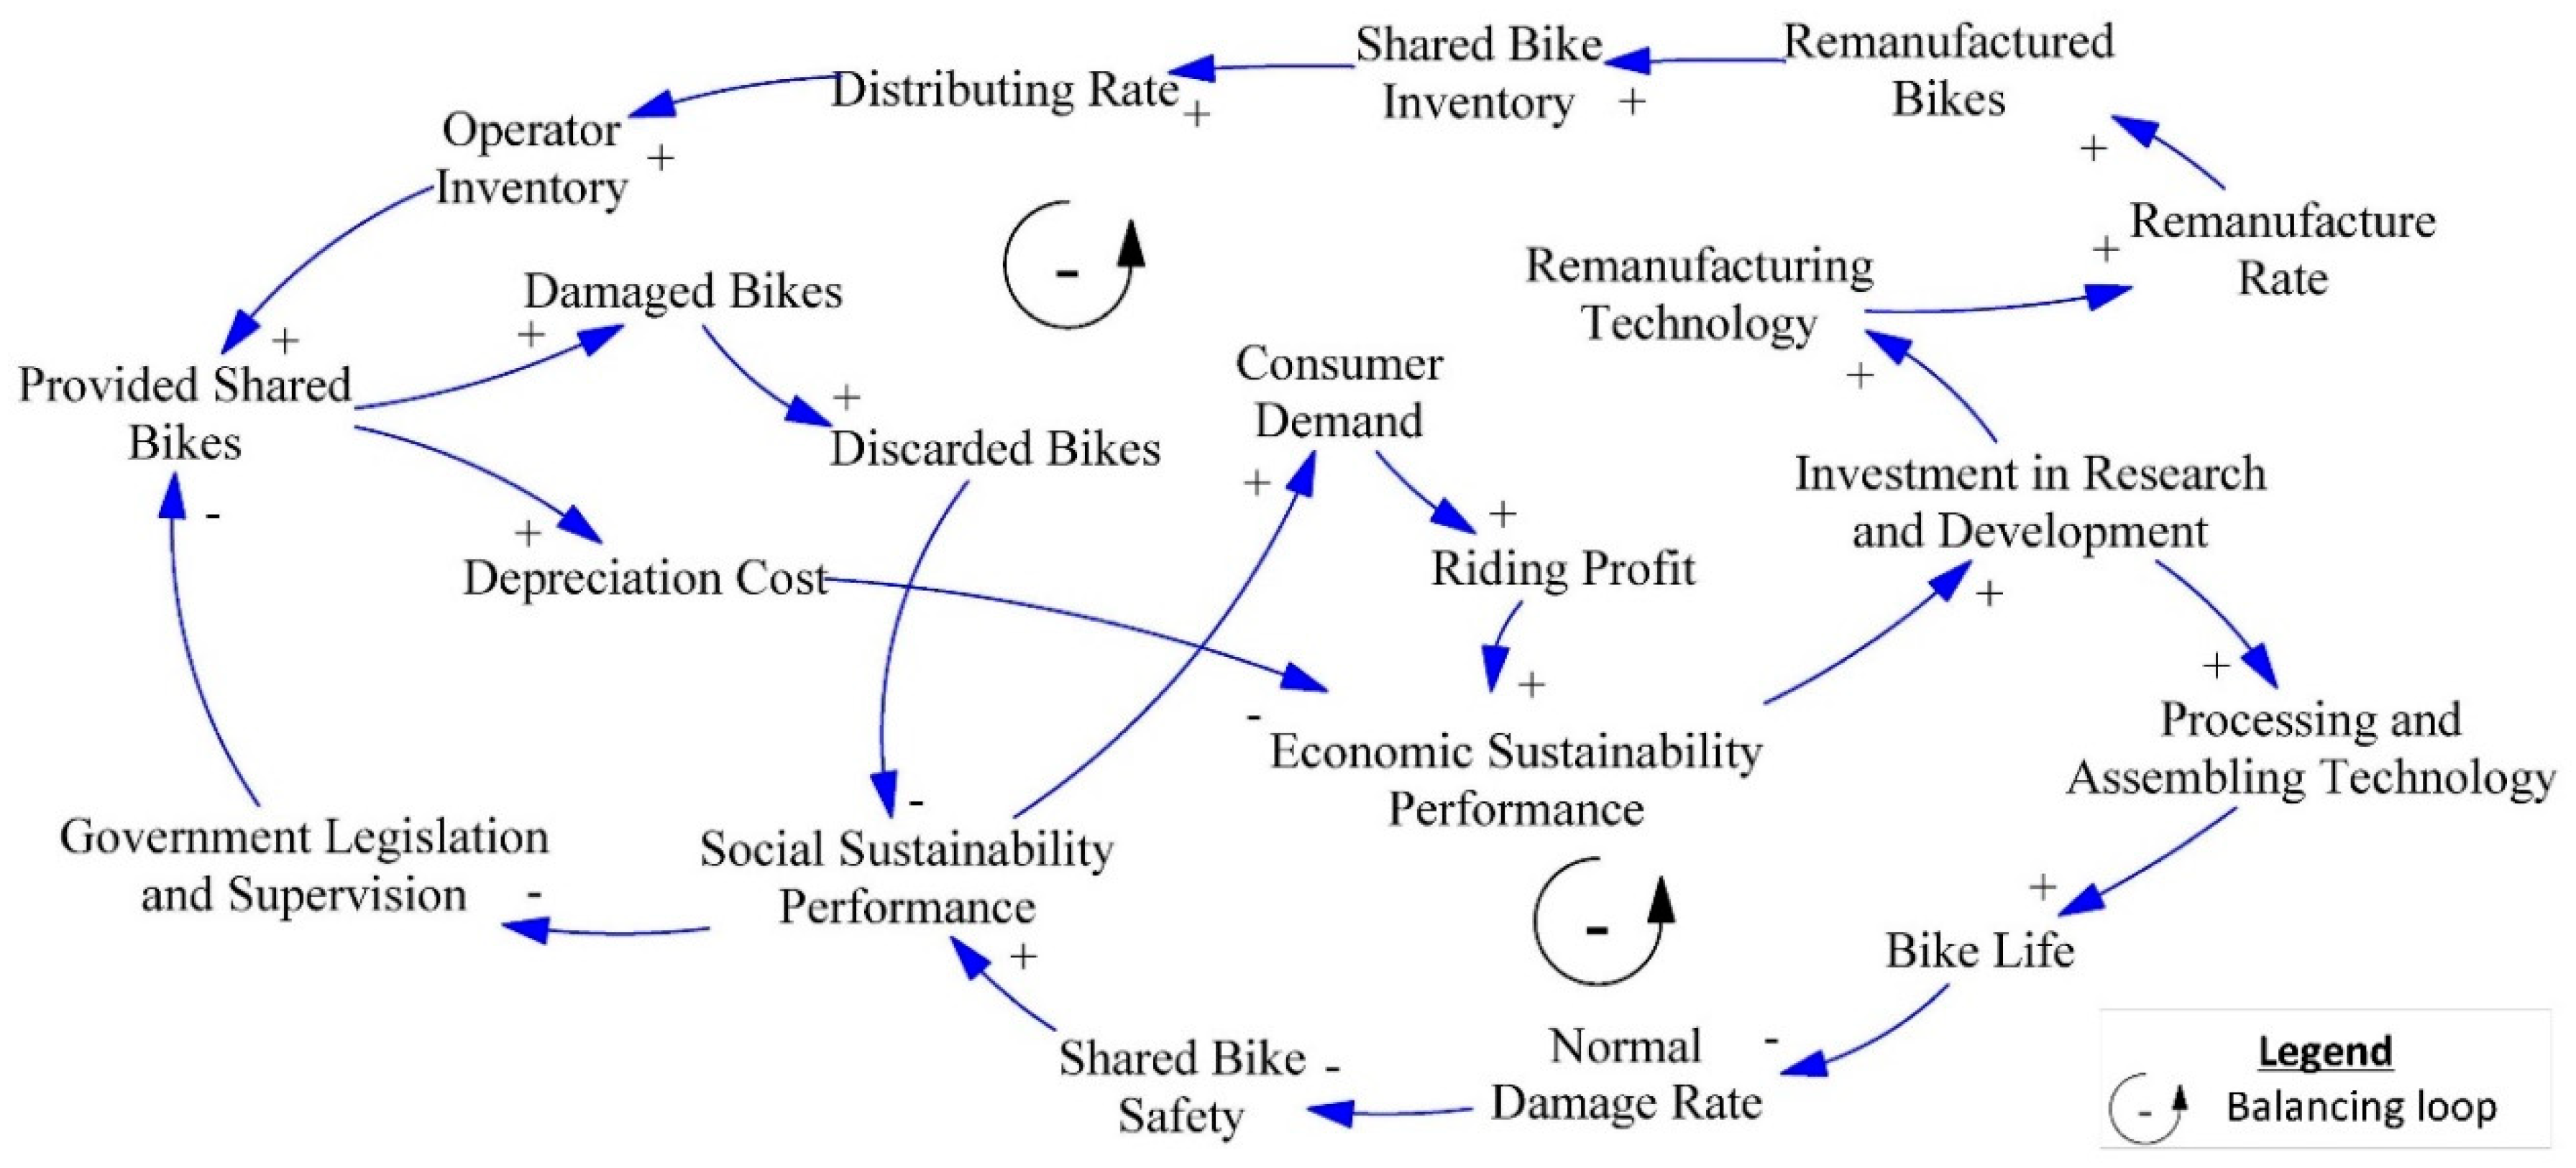
Three important variables, i.e., “Environmental Sustainability Performance”, “Social Sustainability Performance”, and “Economic Sustainability Performance” together reflect system performance directly. As described in Section 3.2, there are close relationships and interactions between them. Combined with Figure 3, a total of 92 significant feedback loops were identified, including 44 reinforcing feedback loops and 48 balancing feedback loops. These causal loops mainly explain the sequence of causes and effects that exist in each loop and impact the sustainability and key challenges of DBSPs [74]. Briefly, a few examples of representative loop analysis processes are given below. The corresponding representative reinforcing loops and balancing loops are shown in Figure 5 and Figure 6, respectively.
Indicatively, in a reinforcing feedback loop, the better “Environmental Sustainability Performance” of DBSPs, the more “Government Support” they receive. As a result, DBSPs can get more “Government Incentives and Subsidies”, which improve their “Economic Sustainability Performance”. Nevertheless, an increased performance of economic sustainability leads to an increase in the number of “Provided Shared Bikes”, which reduces “Urban Road Resource Affordability” and results in a “Shortage of Road Resources”. Thereafter, more “Traffic Problems” arise, which reduces “Social Sustainability Performance”. The government pays increasing attention to “Government Legislation and Supervision”, which reduces “Theft and Vandalism Behavior” and decreases the “Human Vandalism Rate”. In turn, a decreased “Human Vandalism Rate” reduces the number of “Damaged Bikes”, which reduces the number of “Discarded Bikes”. A reduction in the number of “Discarded Bikes” promotes DBSPs to avoid unnecessary “Material Losses and Waste”, which associates with better “Environmental Sustainability Performance”. These three performances exist in one reinforcing feedback loop, which means that maintaining an overall perspective on environmental, social, and economic sustainability is key to the sustainable development of DBSPs.
Similarly, in a reinforcing feedback loop, the more “Government Support” DBSPs receive, the more “Construction of Bike Lanes and Facilities” occurs, which improves “Public Bike Travel Preference”. Improved “Public Bike Travel Preference” increases “Consumer Demand”, which increases DBSPs’ “Riding Profit”. Thereafter, DBSPs show better “Economic Sustainability Performance”, which associates with more “Investment in Research and Development” and improves “Production Technology”. Improved “Production Technology” leads to higher “Energy Utilization Efficiency” and results in better “Environmental Sustainability Performance”. As a result, DBSPs can get more “Government Support”. In summary, DBSPs should pay more attention to gaining government support to improve their sustainability performance.
On the other hand, in a balancing feedback loop, an increased “Depreciation Cost” leads to worse “Economic Sustainability Performance”, which reduces “Investment in Research and Development” and results in worse “Processing and Assembling Technology”. Thus, “Bike Life” decreases, which leads to an increased “Normal Damage Rate”. Thereafter, an increased “Normal Damage Rate” reduces “Shared Bike Safety”, which in turn reduces “Social Sustainability Performance”. Governmental focus on “Government Legislation and Supervision” restricts the number of “Provided Shared Bikes”, which decreases “Depreciation Cost”. The depreciation cost of shared bikes has a significant impact on economic sustainability, which affects the sustainability performance of the entire system.
Furthermore, in a balancing feedback loop, an increased “Economic Sustainability Performance” leads to more “Investment in Research and Development”, which improves “Remanufacturing Technology”. Thereafter, improved “Remanufacturing Technology” increases the “Remanufacture Rate”, which increases the number of “Remanufactured Bikes”. The “Shared Bike Inventory” grows due to increased numbers of “Remanufactured Bikes” being put into inventory, which is associated with a higher “Distributing Rate”. An enhanced “Distributing Rate” leads to augmented “Operator Inventory”. The greater the availability of inventory, the more “Provided Shared Bikes” are available, which increases the number of “Damaged Bikes”. Since not all “Damaged Bikes” can be retrieved, the number of “Discarded Bikes” increases. The road resource occupation of “Discarded Bikes” reduces “Social Sustainability Performance”, which negatively impacts “Consumer Demand” and “Riding Profit”. Lower “Riding Profit” results in worse “Economic Sustainability Performance”. In conclusion, the appropriate proportion of technology research and development investment is important for DBSPs to achieve sustainability.
After completing the above analysis of all the significant feedback loops and analyzing the results, some important managerial implications were obtained. Since the manufacturers, operators, and governments are the main enablers of DBSPs in China, the managerial implications were primarily based on these enablers’ perspectives. These can be summarized as follows.
● MI1: Production of Urban Space
DBSPs directly affect the planning and layout of urban space. This impact on the production of urban space [75] is obviously derived from capital investment. As the number of provided shared bikes and the frequency of use increases, the impact becomes increasingly obvious. The two issues arising from this impact are oversupply and traffic problems (e.g., irregular parking, illegal cycling). The oversupply of shared bikes is caused by the blind provision of operators, and most of the traffic problems are caused by a shortage of road resources. From the perspective of the loops containing the relationship (Provided Shared Bikes → Urban Road Resource Affordability → Shortage of Road Resources → Traffic Problems), effectively limiting the number of provided bikes and the construction of related facilities and bike lanes in limited urban space are still two key challenges.
To mitigate these challenges, the following practices are considered to be effective through CLD analysis. (1) Ensure close cooperation between governments and operators and utilize user data collected by operators to scientifically plan parking areas, bike lanes, and facilities. (2) According to actual market demand, governments should limit the number of shared bikes provided to avoid a shortage of road resources. (3) Governments should introduce corresponding regulations and punishment policies to urge operators to increase maintenance personnel and pay attention to the adverse impacts of shared bikes on society. These practices refine the conclusions of previous literature [2,76]. However, ensuring standardization and guiding the development of DBSPs are difficult for governments. The blind introduction of restrictive policies may stifle the development of the bike-sharing industry and deviate from the original intention of developing DBSPs that facilitate short-distance travel and ease urban traffic pressure.
● MI2: The Broken Window Effect
The broken window effect [77] occurs when shared bikes are damaged and discarded. This means that even if only a small number of damaged bikes are not processed in a timely manner, other problems quickly arise that seriously hinder the normal operation of DBSPs. For instance, from the perspective of the loops containing the relationship (Damaged Bikes → Discarded Bikes → Social Sustainability Performance → Consumer Demand), the overall performance of the system is affected by damaged and discarded bikes, which is closely related to DBSP sustainability.
To solve this problem, the following three aspects should be considered. (1) The quality of the shared bikes should be improved to reduce the rate of normal damage. (2) The reverse supply chain must be improved to ensure that damaged bikes are handled correctly and timely to increase people’s awareness around protecting shared bikes. (3) Governmental supervision and legislation of theft and vandalism behavior should be strengthened, and the retrieved bike ratio should be improved by launching appropriate laws to regulate the behavior of operators, users, and citizens. These aspects are justified by the existing literature [78,79].
● MI3: Holistic Governance
Holistic governance [80] is guided by the needs of the public, and relies on modern technology to coordinate and integrate the interests of all parties to achieve seamless cooperation. The problem of shared bikes disrupting urban social order can be attributed to the lack of supervision by relevant departments due to limited resources, and can also be attributed to the lack of public awareness of operators and the public. Many fragmented governance methods cannot fundamentally solve the problems experienced by the bike-sharing industry; instead, they complicate them further.
Through analysis of the various factors in the CLD, the critical factors involve many stakeholders, e.g., citizens, governments, users, operators, and manufacturers. Based on the principle of holistic governance, the core of solving the problem of bike-sharing cross-border governance is achieving multi-stakeholder co-governance, promoting collaborative governance, and forming a multi-center governance model. Governments need to pay attention to the importance and value of shared bikes as green public transport, and they must take care to adhere to the decisive role of the market in the development of the bike-sharing industry and play their role in guidance and regulation. Operators need to focus on improving service levels and optimizing operation and maintenance. They should strengthen coordination with government departments to build relevant bike-sharing facilities and re-plan urban layouts. Manufacturers should continually improve the quality of bikes and ensure a sophisticated reverse supply chain. Citizens need to understand the reasons for the development of shared bikes and support the construction of low-carbon cities. Users should abide by the rules and regulations and promptly suggest feedback. These strategies show a similar way of thinking, as seen in previous research regarding solutions to the unsustainability problems around DBSPs [81].
● MI4: Research and Development Investment
The development of bike-sharing technologies is directly related to the DBSP industry’s search for a suitable profit model. For example, good production technology can extend the life of each component and maintain production costs, thereby reducing the depreciation cost of shared bikes. The introduction of big data and the Internet of Things technology can enable operators to understand the travel rules of users, thus reducing the maintenance cost. At the same time, as technology continues to advance, the energy utilization efficiency in the BSCLSC will increase and the loss and waste of materials will be reduced, leading to a better environmental sustainability performance of DBSPs. The environment is the basis and condition for human survival and development. The sustainable use of resources and the sustainability of the environment are the primary requirements for maintaining DBSP sustainability.
From the systems-level perspective, “Investment in Research and Development” is one of the most critical factors. Operators and manufacturers should seek a suitable proportion of research and development investment to improve the sustainability performance of DBSPs, with a focus on improving the many technologies involved in the forward and reverse supply chains. The government can also provide corresponding incentives and subsidies to encourage DBSPs’ technological innovation, ensure the sound development of the bike-sharing industry, and contribute to the construction of low-carbon cities.
5. Research Contribution
First, many DBSP studies have explored the key factors that could affect their performance. However, most of these studies have been single-level approaches exploring the impacts on one factor. For example, influencing factors of every echelon in dockless bike-sharing supply chains have not been comprehensively examined. To address this gap, the systematic DBSP model constructed in this study considered many different levels, including the module production level, processing–assembly–distribution level, operation–maintenance level, and consumption (renting) level. This study also provided a taxonomy of the key challenges with respect to environmental, social, and economic sustainability regarding these levels. These levels were integrated to construct the model that covered them all. Furthermore, this type of integrated systematic model (compared with single-level studies of influencing factors) has the added benefit of considering more important dimensions of DBSPs. It also integrates the influencing factors of more dimensions that might impact their performance. Hence, this simulation approach takes a more extensive perspective on the exploration of the influencing factors, thereby developing a more comprehensive DBSP model.
Second, no systematic approach has been used to evaluate DBSP sustainability from a BSCLSC perspective. The construction of an SD feedback relationship model for DBSPs helps researchers explore current and future DBSP predicaments by analyzing the interactions between a variety of factors. The model also offers researchers an in-depth understanding to develop improvement strategies for DBSP sustainability. Some managerial implications have been obtained to provide a useful reference for governments to formulate effective policies for DBSP. The findings can be developed to conduct further analyses on the changes in various factors after governments have launched some new policies or DBSPs have introduced new technology. The model of DBSPs constructed by this study could be used as a research reference for researchers carrying out future DBSP studies, thereby improving their comprehensiveness. Finally, this paper has been done considering sources other than academic literature, such as institutional authoritative publications and government announcements. As the model combined related theories with practices in reality as the main entry point, it could also enhance the sophistication of the DBSP research field.
6. Conclusions
DBSPs have brought great convenience to citizens for short-distance travel, which not only eases the pressure of urban traffic congestion, but also contributes to the improvement of the urban environment. However, DBSPs are associated with many challenges that directly impede their sustainable development, e.g., a lack of profit models, shortage of road resources, and cutthroat competition. These challenges are generally related to the multiple stakeholders present and inter-related influencing factors, which result in the complexity of the governance of DBSPs. These complexities cause an increasing number of challenges that need to be solved as a matter of urgency.
In order to offer a useful reference to generate effective strategies for DBSPs, this paper explored publicly available data sources to provide a taxonomy of key challenges with respect to the main pillars of DBSP sustainability (i.e., environment, society, and economy) and determine the influencing factors and their interactions and feedback relationships. The SD approach was applied to explore the non-linear behavior and implicit complexities of the dynamic feedback system in order to obtain a deeper understanding of the sustainability performance of DBSPs from a BSCLSC perspective. This study’s findings, which were reflected in the proposed CLDs, revealed four corresponding managerial implications and provided the basis for research to improve DBSP sustainability performance. For instance, understanding the significance of the production of urban space affected by DBSPs may encourage governments to pay attention to the shortage of urban road resources and introduce more pointed policies. Meanwhile, governments and operators could cooperate to construct cycling facilities. Moreover, the SD methodology employed in this study could also be used to analyze the feedback relationships and interactions between a variety of influencing factors in other shared economy programs, such as shared accommodation and shared cars.
The primary limitations of this study are that the representation of behavior over time is relative to the study frame, and can only be defined in relative terms such as shortage or sufficient supply, rather than in exact numbers. Furthermore, the system boundaries need to be determined to apply a system dynamics analysis. Some potential factors influencing the sustainability of DBSPs may not have been covered here. Future research could follow two avenues. First, enough quantitative data could be acquired for a simulation of DBSP sustainability. Second, more influencing factors could be considered to generate a more scientific and comprehensive SD feedback relationship model of DBSPs. We will continue to study the ways in which to improve the sustainability performance of DBSPs in the future.
Author Contributions
T.Y. and Y.Z. analyzed the data; S.Z. and Y.L. conceived and designed the model; Y.L. performed the model; T.Y. and Y.L. discussed the results; Y.L. wrote the paper.
Funding
This research was funded by the National Natural Science Foundation of China (No. 71001010).
Conflicts of Interest
The authors declare no conflict of interest.
Appendix A
All the acronyms used in this paper are presented in Table A1.

Table A1.
Acronym list.
| Acronym | Acronym | ||
|---|---|---|---|
| DBSP | Dockless bike-sharing program | BSCLSC | Bike-sharing closed-loop supply chain |
| GPS | Global positioning system | CLD | Causal loop diagram |
| SD | System dynamics | MI | Managerial implication |
References
- Zhang, L.; Zhang, J.; Duan, Z.-Y.; Bryde, D. Sustainable bike-sharing systems: Characteristics and commonalities across cases in urban China. J. Clean. Prod. 2015, 97, 124–133. [Google Scholar] [CrossRef]
- Xu, Y.; Chen, D.; Zhang, X.; Tu, W.; Chen, Y.; Shen, Y.; Ratti, C. Unravel the landscape and pulses of cycling activities from a dockless bike-sharing system. Comput. Environ. Urban Syst. 2019, 75, 184–203. [Google Scholar] [CrossRef]
- Yang, T.; Li, Y.; Zhou, S. System Dynamics Modeling of Dockless Bike-Sharing Program Operations: A Case Study of Mobike in Beijing, China. Sustainability 2019, 11, 1601. [Google Scholar] [CrossRef]
- Wang, J.; Huang, J.; Dunford, M. Rethinking the Utility of Public Bicycles: The Development and Challenges of Station-Less Bike Sharing in China. Sustainability 2019, 11, 1539. [Google Scholar] [CrossRef]
- DeMaio, P. Bike-sharing: History, impacts, models of provision, and future. J. Public Transp. 2009, 12, 3. [Google Scholar] [CrossRef]
- Parkes, S.D.; Marsden, G.; Shaheen, S.A.; Cohen, A.P. Understanding the diffusion of public bikesharing systems: Evidence from Europe and North America. J. Transp. Geogr. 2013, 31, 94–103. [Google Scholar] [CrossRef]
- Ahillen, M.; Mateo-Babiano, D.; Corcoran, J. Dynamics of bike sharing in Washington, DC and Brisbane, Australia: Implications for policy and planning. Int. J. Sustain. Transp. 2016, 10, 441–454. [Google Scholar] [CrossRef]
- Faghih-Imani, A.; Hampshire, R.; Marla, L.; Eluru, N. An empirical analysis of bike sharing usage and rebalancing: Evidence from Barcelona and Seville. Transp. Res. Part A Policy Pract. 2017, 97, 177–191. [Google Scholar] [CrossRef]
- Otero, I.; Nieuwenhuijsen, M.; Rojas-Rueda, D. Health impacts of bike sharing systems in Europe. Environ. Int. 2018, 115, 387–394. [Google Scholar] [CrossRef] [PubMed]
- Ifeng News. Ofo Evacuation from Australia: Sydney Users Average 0.3 Times a Day. Available online: http://news.ifeng.com/a/20180711/59119593_0.shtml (accessed on 11 July 2018).
- Sina Finance. US Media: Ofo Will Fully Withdraw from the Seattle Market, Only $3 Per Car. Available online: http://finance.sina.com.cn/chanjing/gsnews/2018-08-16/doc-ihhvciiv9270159.shtml (accessed on 11 August 2018).
- Sina Finance. Encounter Extensive Destruction and Theft, Mobike Decided to Give Up the Manchester Market. Available online: http://finance.sina.com.cn/stock/usstock/c/2018-09-06/doc-ihitesuy8832978.shtml (accessed on 6 September 2018).
- Xinhua Net. Beijing Bike-Sharing Policy Officially Introduced. Available online: http://www.xinhuanet.com/fortune/2017-09/16/c_1121672161.htm (accessed on 16 September 2017).
- Xinhua Net. Shanghai Released Bike-Sharing Guidance. Available online: http://www.xinhuanet.com/info/2017-11/21/c_136767505.htm (accessed on 21 November 2017).
- Tencent News. Sydney’s Shared Bike Chaos Is Highly Valued by the Government and Will Be Severely Punished. Available online: https://new.qq.com/omn/20180305/20180305C0JC22.html (accessed on 5 March 2018).
- Zuev, D.; Tyfield, D.; Urry, J. Where is the politics? E-bike mobility in urban China and civilizational government. Environ. Innov. Soc. Transit. 2019, 30, 19–32. [Google Scholar] [CrossRef]
- Faghih-Imani, A.; Eluru, N. Analysing bicycle-sharing system user destination choice preferences: Chicago’s Divvy system. J. Transp. Geogr. 2015, 44, 53–64. [Google Scholar] [CrossRef]
- Sun, Y.; Mobasheri, A.; Hu, X.; Wang, W. Investigating impacts of environmental factors on the cycling behavior of bicycle-sharing users. Sustainability 2017, 9, 1060. [Google Scholar] [CrossRef]
- Taleqani, A.R.; Hough, J.; Nygard, K.E. Public Opinion on Dockless Bike Sharing: A Machine Learning Approach. Transp. Res. Board 2019, 2673, 195–204. [Google Scholar] [CrossRef]
- Xu, C.; Ji, J.; Liu, P. The station-free sharing bike demand forecasting with a deep learning approach and large-scale datasets. Transp. Res. Part C Emerg. Technol. 2018, 95, 47–60. [Google Scholar] [CrossRef]
- Ai, Y.; Li, Z.; Gan, M.; Zhang, Y.; Yu, D.; Chen, W.; Ju, Y. A deep learning approach on short-term spatiotemporal distribution forecasting of dockless bike-sharing system. Neural Comput. Appl. 2019, 31, 1665–1677. [Google Scholar] [CrossRef]
- Zhang, Y.; Mi, Z. Environmental benefits of bike sharing: A big data-based analysis. Appl. Energy 2018, 220, 296–301. [Google Scholar] [CrossRef]
- Mateo-Babiano, I.; Bean, R.; Corcoran, J.; Pojani, D. How does our natural and built environment affect the use of bicycle sharing? Transp. Res. Part A Policy Pract. 2016, 94, 295–307. [Google Scholar] [CrossRef] [Green Version]
- Nickkar, A.; Banerjee, S.; Chavis, C.; Bhuyan, I.A.; Barnes, P. A spatial-temporal gender and land use analysis of bikeshare ridership: The case study of Baltimore City. City Cult. Soc. 2019. [Google Scholar] [CrossRef]
- Dang, C.; Li, Z.F.; Yang, C. Measuring firm size in empirical corporate finance. J. Bank. Financ. 2018, 86, 159–176. [Google Scholar] [CrossRef]
- Shi, J.-g.; Si, H.; Wu, G.; Su, Y.; Lan, J. Critical factors to achieve dockless bike-sharing sustainability in China: A stakeholder-oriented network perspective. Sustainability 2018, 10, 2090. [Google Scholar] [CrossRef]
- Guo, H.; Qiao, W.; Liu, J. Dynamic feedback analysis of influencing factors of existing building energy-saving renovation market based on system dynamics in China. Sustainability 2019, 11, 273. [Google Scholar] [CrossRef]
- Anastasiadis, F.; Tsolakis, N.; Srai, J. Digital technologies towards resource efficiency in the agrifood sector: Key challenges in developing countries. Sustainability 2018, 10, 4850. [Google Scholar] [CrossRef]
- Abdelkafi, N.; Täuscher, K. Business models for sustainability from a system dynamics perspective. Organ. Environ. 2016, 29, 74–96. [Google Scholar] [CrossRef]
- Coyle, R.G. System dynamics modelling: A practical approach. J. Oper. Res. Soc. 1997, 48, 544. [Google Scholar] [CrossRef]
- Haraldsson, H.; Ólafsdóttir, R. Evolution of tourism in natural destinations and dynamic sustainable thresholds over time. Sustainability 2018, 10, 4788. [Google Scholar] [CrossRef]
- Berke, P.R.; Conroy, M.M. Are we planning for sustainable development? An evaluation of 30 comprehensive plans. J. Am. Plan. Assoc. 2000, 66, 21–33. [Google Scholar] [CrossRef]
- Dörnyei, Z. Researching complex dynamic systems: ‘Retrodictive qualitative modelling’ in the language classroom. Lang. Teach. 2014, 47, 80–91. [Google Scholar] [CrossRef]
- Geissdoerfer, M.; Morioka, S.N.; de Carvalho, M.M.; Evans, S. Business models and supply chains for the circular economy. J. Clean. Prod. 2018, 190, 712–721. [Google Scholar] [CrossRef]
- China Shared Bike Industry Development Report; China Communications Institute: Beijing, China, 2018.
- State Intellectual Property Office. Insist on Continuous Innovation. Available online: http://www.cnipa.gov.cn/ztzl/zscqzldzcywzcx/fxjdz/1110166.htm (accessed on 27 December 2017).
- China National Radio. Mobike Launches Special Campaign for Recycling of Used Shared Bikes, More Than 60,000 Bikes Recycling. Available online: http://www.cnr.cn/gd/zt/cxzg/twxw/20180718/t20180718_524305158.shtml (accessed on 18 July 2018).
- Beijing Municipal Commission of Transport. Notice on Printing and Distributing the Guiding Opinions on the Implementation of Beijing’s Encouraging the Development of Shared Bikes. Available online: http://jtw.beijing.gov.cn/xxgk/flfg/fgbz/201709/t20170915_187384.html (accessed on 15 September 2017).
- General Office of the State Council. Decision on Strengthening Energy Conservation Work. Available online: http://www.gov.cn/zwgk/2006-08/23/content_368136.htm (accessed on 23 August 2006).
- China Industrial Information Network. 2017 Shared Bike User Behavior Analysis. Available online: http://www.chyxx.com/industry/201705/523611.html (accessed on 8 May 2017).
- Nan Fang Daily. Who Can Laugh at the End of the Shared Bike Race? Available online: http://epaper.southcn.com/nfdaily/html/2017-03/15/content_7624750.htm (accessed on 15 March 2017).
- Sturgeon, T.J. Modular production networks: A new American model of industrial organization. Ind. Corp. Chang. 2002, 11, 451–496. [Google Scholar] [CrossRef]
- Sina News. Invisible Killer! Shared Bike Quality Survey: Unqualified Rate of 12.5% Mobike has Failed Products. Available online: http://news.sina.com.cn/o/2018-04-08/doc-ifyteqtq5833790.shtml (accessed on 8 April 2018).
- Sina Finance. Beijing Banned the Shared Bike Body Advertisements. Available online: http://finance.sina.com.cn/chanjing/gsnews/2018-04-04/doc-ifyswxnq2451930.shtml (accessed on 4 April 2018).
- 163 News. There Is a Safety Hazard in Sharing Bikes, and Brake Problems Often Occur. Available online: http://bj.news.163.com/18/1207/11/E2E052F604388CS9.html (accessed on 7 December 2018).
- Sohu Tech. Supply Chain Perspective: Barbaric Growth of Shared Bikes. Available online: http://www.sohu.com/a/290864900_738537 (accessed on 23 January 2019).
- Ministry of Transport of China. The Ministry of Transport and Other 10 Departments Jointly Issued Guidance on the Development of Shared Bike Development: Implementation of Encouraging Development Policies, Standardizing Operational Service Behavior. Available online: http://www.gov.cn/xinwen/2017-08/03/content_5215643.htm (accessed on 3 August 2017).
- Beijing Evening News. Shared Bike Illegal Parking Will Be Punished, Affecting Personal Credit. Available online: https://www.creditchina.gov.cn/gerenxinyong/gerenxinyongliebiao/201805/t20180531_116969.html (accessed on 31 May 2018).
- Razzaque, M.A.; Clarke, S. Smart management of next generation bike sharing systems using Internet of Things. In Proceedings of the 2015 IEEE First International Smart Cities Conference (ISC2), Guadalajara, Mexico, 25–28 October 2015; pp. 1–8. [Google Scholar]
- Liu, J.; Sun, L.; Chen, W.; Xiong, H. Rebalancing bike sharing systems: A multi-source data smart optimization. In Proceedings of the 22nd ACM SIGKDD International Conference on Knowledge Discovery and Data Mining, San Francisco, CA, USA, 13–17 August 2016; pp. 1005–1014. [Google Scholar]
- Hangzhou Municipal Government. Guiding Opinions on Promoting the Development of Internet Rental Bikes in Hangzhou. Available online: http://www.hangzhou.gov.cn/art/2017/10/23/art_1320523_4177.html (accessed on 23 October 2017).
- Guangzhou Municipal Government. Interpretation of “Guiding Opinions on Encouraging and Regulating the Development of Internet Rental Bikes in Guangzhou”. Available online: http://www.gz.gov.cn/gzjtjg/snzc/201801/5d4af7eaf5a045c599a96915a1c872c2.shtml (accessed on 5 January 2018).
- China Youth News. The Government Must Support the Shared Bikes. Available online: http://theory.people.com.cn/n1/2017/0302/c40531-29117671.html (accessed on 2 March 2017).
- Xinhua Net. Sharing Bikes: How to Solve the Problem of Recycling Management. Available online: http://www.xinhuanet.com//info/2017-06/24/c_136391049.htm (accessed on 24 June 2017).
- Van Waes, A.; Farla, J.; Frenken, K.; de Jong, J.P.; Raven, R. Business model innovation and socio-technical transitions. A new prospective framework with an application to bike sharing. J. Clean. Prod. 2018, 195, 1300–1312. [Google Scholar] [CrossRef]
- Cohen, B.; Kietzmann, J. Ride on! Mobility business models for the sharing economy. Organ. Environ. 2014, 27, 279–296. [Google Scholar] [CrossRef]
- Shanghai Municipal Government. Notice on Printing and Distributing the Guiding Opinions of Shanghai on Encouraging and Regulating the Development of Internet Rental Bikes (Trial). Available online: http://www.shanghai.gov.cn/nw2/nw2314/nw2319/nw12344/u26aw54099.html (accessed on 9 November 2017).
- Ministry of Transport of China. Notice of Multi-Sectors on Printing and Distributing the Measures for the Administration of Funds for New Business Users of Transportation (Trial). Available online: http://www.gov.cn/xinwen/2019-05/17/content_5392421.htm (accessed on 17 May 2019).
- Ministry of Industry and Information Technology of China. Policy and Regulation Division Organizes Research and Study of Social Responsibility Work for Shared Bike Companies. Available online: http://www.miit.gov.cn/n1146290/n1146402/n1146440/c5584659/content.html (accessed on 13 April 2017).
- Jinchang Municipal Government. People’s Republic of China Cyber Security Law. Available online: http://yjj.jc.gansu.gov.cn/art/2018/7/27/art_19406_334362.html (accessed on 27 July 2018).
- Nan Fang Express. The Number of Shared Bike Users Is Less Than 100 Million in 2018, and the User Experience Becomes the Key to Business Competition. Available online: http://kb.southcn.com/content/2018-12/11/content_184422605.htm (accessed on 11 December 2018).
- People’s Daily Online. New Rules for Shared Bikes in Beijing: Three Years of Service Should Be Updated. Available online: http://bj.people.com.cn/n2/2017/0920/c233088-30756762.html (accessed on 20 September 2017).
- Xinhua Net. The Cost of Shared Bikes Generally Rose, and the Platform Responded: The Price of the Bike Did Not Rise. Available online: http://www.xinhuanet.com//fortune/2017-03/15/c_1120628271.htm (accessed on 15 March 2017).
- China’s Bike-Sharing Industry Monitoring Report for the First Half of 2018; iiMedia Research: Guangzhou, China, 2018.
- Bike-Sharing Industry Report; iiMedia Research: Guangzhou, China, 2018.
- Qiu, L.-Y.; He, L.-Y. Bike sharing and the economy, the environment, and health-related externalities. Sustainability 2018, 10, 1145. [Google Scholar] [CrossRef]
- Government of Tibet Autonomous Region. Promotion of Activities Related to Shared Bike Related Legal Issues. Available online: http://www.xzpfw.gov.cn/qqpfjb/10238.jhtml (accessed on 18 October 2017).
- Capital Civilization Net. Dongcheng District Held a Publicity Campaign for the shared Bike Civilization. Available online: http://www.bjwmb.gov.cn/xxgk/xcjy/t20170605_827614.htm (accessed on 5 June 2017).
- Beijing Municipal Government. Launch a Campaign to Encourage Civilized Use of Shared Bikes. Available online: http://www.beijing.gov.cn/zfxxgk/cyq11E121/bmdt52/2017-05/05/content_756795.shtml (accessed on 5 May 2017).
- Bhuyan, I.A.; Chavis, C.; Nickkar, A.; Barnes, P. GIS-Based Equity Gap Analysis: Case Study of Baltimore Bike Share Program. Urban Sci. 2019, 3, 42. [Google Scholar] [CrossRef]
- Ministry of Transport of China. Interpretation of the Policy on the Guidance and Opinions on Encouraging and Regulating the Development of Internet Rental Bikes. Available online: http://www.mot.gov.cn/zxft2017/yss_0803/ (accessed on 3 August 2017).
- Li, W.; Kamargianni, M. Providing quantified evidence to policy makers for promoting bike-sharing in heavily air-polluted cities: A mode choice model and policy simulation for Taiyuan-China. Transp. Res. Part A Policy Pract. 2018, 111, 277–291. [Google Scholar] [CrossRef]
- Govindan, K.; Soleimani, H. A review of reverse logistics and closed-loop supply chains: A Journal of Cleaner Production focus. J. Clean. Prod. 2017, 142, 371–384. [Google Scholar] [CrossRef]
- Georgiadis, P.; Vlachos, D. The effect of environmental parameters on product recovery. Eur. J. Oper. Res. 2004, 157, 449–464. [Google Scholar] [CrossRef]
- McGee, T.G. Interrogating the production of urban space in China and Vietnam under market socialism. Asia Pac. Viewp. 2009, 50, 228–246. [Google Scholar] [CrossRef]
- Li, Z.; Wang, W.; Yang, C.; Ding, H. Bicycle mode share in China: A city-level analysis of long term trends. Transportation 2017, 44, 773–788. [Google Scholar] [CrossRef]
- Xu, Y.; Fiedler, M.L.; Flaming, K.H. Discovering the impact of community policing: The broken windows thesis, collective efficacy, and citizens’ judgment. J. Res. Crime Delinq. 2005, 42, 147–186. [Google Scholar] [CrossRef]
- Wang, Z.; Zheng, L.; Zhao, T.; Tian, J. Mitigation strategies for overuse of Chinese bikesharing systems based on game theory analyses of three generations worldwide. J. Clean. Prod. 2019, 227, 447–456. [Google Scholar] [CrossRef]
- Li, X.; Zhang, Y.; Sun, L.; Liu, Q. Free-floating bike sharing in jiangsu: Users’ behaviors and influencing factors. Energies 2018, 11, 1664. [Google Scholar] [CrossRef]
- Kirkbride, J.; Letza, S. Regulation, Governance and Regulatory Collibration: Achieving an “holistic” approach. Corp. Gov. Int. Rev. 2004, 12, 85–92. [Google Scholar] [CrossRef]
- Ma, Y.; Lan, J.; Thornton, T.; Mangalagiu, D.; Zhu, D. Challenges of Collaborative Governance in the Sharing Economy: The case of free-floating bike sharing in Shanghai. J. Clean. Prod. 2018, 197, 356–365. [Google Scholar] [CrossRef]
Figure 1.
Dockless bike-sharing programs’ (DBSPs’) stakeholder framework from a systems-level perspective.
Figure 1.
Dockless bike-sharing programs’ (DBSPs’) stakeholder framework from a systems-level perspective.

Figure 2.
Analysis framework of DBSP sustainability performance.

Figure 3.
Casual loop diagram (CLD) of the general bike-sharing closed-loop supply chain (BSCLSC).

Figure 4.
CLD of environmental, social, and economic sustainability based on the BSCLSC.

Figure 5.
Reinforcing loops involving the presented analysis processes.

Figure 6.
Balancing loops involving the presented analysis processes.

Table 1.
Main challenges regarding “module production” and sustainability.
| # | Challenge | Sustainability | Source | ||
|---|---|---|---|---|---|
| En | So | Ec | |||
| 1 | Reduce the waste of resources by using recyclable materials and improving recycling technology | ● | ● | ● | [1,37] |
| 2 | Optimize and upgrade components to increase service life and durability | ● | ● | [35] | |
| 3 | Meet the government’s requirements for some components (e.g., GPS, breaks) | ● | [38] | ||
| 4 | Make full use of energy in production and recycling | ● | ● | [39] | |
| 5 | Provide a better experience for users (e.g., GPS, intelligent locks) | ● | ● | [35,40] | |
| 6 | Implement cost and quality control of various components | ● | [41] | ||
Abbreviations: En: Environmental; So: Social; Ec: Economic; GPS: global positioning system.
Table 2.
Main challenges regarding “processing–assembly–distribution” and sustainability.
| # | Challenge | Sustainability | Source | ||
|---|---|---|---|---|---|
| En | So | Ec | |||
| 1 | Improve shared bike quality and durability to reduce normal damage rate | ● | ● | [43] | |
| 2 | Design a good bike appearance while meeting government requirements (e.g., advertisements) | ● | ● | [44] | |
| 3 | Get accurate user experiences in a timely manner to optimize product design and improve technique simultaneously | ● | ● | [35] | |
| 4 | Ensure the effective safety performance of bikes | ● | [45] | ||
| 5 | Make more efficient use of energy resources | ● | ● | [39] | |
| 6 | Enable transportation systems to be more efficient | ● | ● | [46] | |
| 7 | Develop remanufacturing technology | ● | ● | [37] | |
Abbreviations: En: Environmental; So: Social; Ec: Economic.
Table 3.
Main challenges regarding “operation–maintenance” and sustainability.
| # | Challenge | Sustainability | Source | ||
|---|---|---|---|---|---|
| En | So | Ec | |||
| 1 | Ensure that a reasonable amount of shared bikes are provided to the market and meet government restrictions | ● | ● | [38,47] | |
| 2 | Solve traffic violation problems (e.g., irregular parking, illegal cycling) | ● | [48] | ||
| 3 | Implement innovative research and development in regard to all important points in the supply chain | ● | ● | ● | [35] |
| 4 | Introduce relevant new technologies (e.g., Internet of Things, big data) to improve operation and maintenance efficiency | ● | ● | [49,50] | |
| 5 | Maintain sufficient operation and maintenance personnel according to the number of bikes provided | ● | ● | [51,52] | |
| 6 | Build infrastructure through cooperation with the government | ● | ● | [53] | |
| 7 | Retrieve and repair damaged bikes promptly | ● | ● | [54] | |
| 8 | Find a profit model that corresponds to the current situation | ● | [55,56] | ||
| 9 | Reduce vandalism of shared bikes | ● | ● | [57] | |
| 10 | Make more efficient use of energy resources | ● | ● | [39] | |
| 11 | Manage user deposits under government supervision | ● | ● | [58] | |
| 12 | Enhance corporate social responsibility | ● | [59] | ||
| 13 | Collect user data legally | ● | ● | [60] | |
| 14 | Improve user experience (e.g., apps, shared bikes) | ● | ● | [61] | |
| 15 | Set reasonable shared bike production costs in different situations | ● | [62,63] | ||
Abbreviations: En: Environmental; So: Social; Ec: Economic.
Table 4.
Main challenges regarding “consumption renting” and sustainability.
| # | Challenge | Sustainability | Source | ||
|---|---|---|---|---|---|
| En | So | Ec | |||
| 1 | Enhance public environmental awareness to form low-carbon travel habits | ● | ● | [66] | |
| 2 | Strengthen legal promulgation and education to reduce vandalism and urge people to obey traffic rules | ● | ● | [67,68] | |
| 3 | Improve cultural quality and moral cultivation of citizens to advise users to use bikes regularly | ● | ● | [69] | |
| 4 | Improve the spatial distribution of facilities to enhance equity, accessibility, expansion, and opportunities to cycle | ● | ● | [70] | |
| 5 | Provide data with informed consent | ● | [71] | ||
| 6 | Meet people’s needs (e.g., saving time, health) | ● | ● | [66] | |
| 7 | Have a suitable environment and air quality for cycling | ● | ● | ● | [4,72] |
| 8 | Build a well-established credit system by multi-party cooperation | ● | [47] | ||
Abbreviations: En: Environmental; So: Social; Ec: Economic.
© 2019 by the authors. Licensee MDPI, Basel, Switzerland. This article is an open access article distributed under the terms and conditions of the Creative Commons Attribution (CC BY) license (http://creativecommons.org/licenses/by/4.0/).
Share and Cite
MDPI and ACS Style
Yang, T.; Li, Y.; Zhou, S.; Zhang, Y. Dynamic Feedback Analysis of Influencing Factors and Challenges of Dockless Bike-Sharing Sustainability in China. Sustainability 2019, 11, 4674. https://doi.org/10.3390/su11174674
AMA Style
Yang T, Li Y, Zhou S, Zhang Y. Dynamic Feedback Analysis of Influencing Factors and Challenges of Dockless Bike-Sharing Sustainability in China. Sustainability. 2019; 11(17):4674. https://doi.org/10.3390/su11174674
Chicago/Turabian StyleYang, Tianjian, Ye Li, Simin Zhou, and Yu Zhang. 2019. "Dynamic Feedback Analysis of Influencing Factors and Challenges of Dockless Bike-Sharing Sustainability in China" Sustainability 11, no. 17: 4674. https://doi.org/10.3390/su11174674
Note that from the first issue of 2016, this journal uses article numbers instead of page numbers. See further details here.