Green BIM Assessment Applying for Energy Consumption and Comfort in the Traditional Public Market: A Case Study

1
Department of Civil Engineering, Feng Chia University, Taichung 40724, Taiwan
2
Ph.D. Program for Civil Engineering, Water Resources Engineering, and Infrastructure Planning, Feng Chia University, Taichung 40724, Taiwan
*
Author to whom correspondence should be addressed.
Sustainability 2019, 11(17), 4636; https://doi.org/10.3390/su11174636
Submission received: 9 July 2019
/
Revised: 18 August 2019
/
Accepted: 22 August 2019
/
Published: 26 August 2019
Abstract
:This study focused on the energy consumption and environmental comfort of the traditional Xindian Central Public Retail Market. Established for more than 30 years, the market has been a crucial role in the daily life of local residents. Thus, the energy consumption and comfort level of the market are subjects of great concern. By using green building information modeling (BIM) simulation, which is an innovative assessment process that combines green buildings and BIM for the architecture, engineering, and construction (AEC) industries to achieve sustainability, this study explored the current situation of energy efficiency and comfort level of the market. A green BIM model of the market and surrounding area was constructed in Autodesk Revit. Subsequently, nine items pertaining to energy consumption and environmental comfort were selected from the green BIM model to conduct simulation by using the software package Integrated Environmental Solutions Virtual Environment (IES VE). Based on the IES VE simulation results, heat radiation was identified as one of the main causes of energy consumption in the market. Moreover, the results indicated problems of ventilation and insufficient sunlight inside the market. These analytical outcomes and optimization suggestions can be provided as references for retrofitting to obtain sustainable architectures in future.
1. Introduction
For the earth to remain sustainable, green buildings have become a widely discussed topic in recent years because they achieve comfortable environment with the minimal energy consumption. The idea of green building was originally conceived in reaction to the first energy crisis in the 1970s [1]. Since then, green buildings have drawn a balance between architecture and the natural environment; the process requires designers, contractors, and clients to work together closely during all stages of the project. A green building complements the shortcomings of previous architectural designs in terms of economic benefits, practicality, durability, and comfort, focusing not only on the building itself but also on the building materials and construction methods. Besides, a green building is a design concept that emphasizes coexistence with the environment [2]. It was under this context that BREEAM (Building Research Establishment Environmental Assessment Method), the world’s first green building assessment system, was put forth by the British Building Research Establishment (BRE) in 1990. This approach later influenced the development of the other rating systems, such as American LEED (Leadership in Energy and Environment Design) in 1996, and the Canadian GBTool in 1998; the EEWH (Ecology, Energy Saving, Waste Reduction, and Health) established in Taiwan in 1999 is a pioneer in Asia and the fourth such certification system in the world [3]. Among them, LEED has an entire credit category dedicated to the indoor environment: Indoor Environmental Quality (IEQ), which includes prerequisites and credits for design and construction projects, interiors, homes and existing buildings [4].
Meanwhile, as a revolutionary technology and process, Building Information Modeling (BIM) has been regarded by many as a promising tool to improve the AEC industry [5]. BIM provides information required for preventive maintenance, decision-making, building system analysis, planning, and responsive strategies [6,7,8], and facility elimination and reuse [9,10]. BIM enables stakeholders during a project lifecycle to organize and exchange information from multiple perspectives in a digital environment [11]. In general, the essential features of BIM can be summarized into four aspects, namely integrating with various databases, facilitating document management, visualizing analytical processes and results, and providing sustainability analyses and simulations [5]. On the other hand, the “green BIM” concept integrates BIM with green buildings, which has been explored by previous studies [5], based on several relevant concepts such as green buildings, sustainable design, and construction [12,13,14]. Krygiel and Nies [15] summarized the different ways that BIM could aid in building sustainability. McGraw-Hill Construction in the SmartMarket report [16] provided an in-depth discussion over the green BIM practices approaches in the AEC industry. Green BIM is considered the use of BIM tools to achieve sustainability and building performance objectives on a project [16]. Wong and Zhou [17] reviewed the previous green BIM research over building lifecycles and defined green BIM as “a model based process of generating and managing coordinated and consistent building data during its project lifecycle that enhance building energy efficiency performance, and facilitate the accomplishment of established sustainability goals”. Lu et al. [5] concluded that the majority of green BIM applications were designed for building performance analysis and simulations, such as energy performance analysis [18,19,20,21,22,23,24], embodied carbon dioxide emission analysis, lighting simulations and some integrated building performance optimization [25,26,27,28].
At present, comfortable environments and energy-saving building designs are mostly found in new buildings; their energy consumption and environmental factors are evaluated during the initial stage of designing, and subsequently the relevant design changes are made. However, the energy consumption and environmental comfort of the existing, older buildings should also be studied and analyzed. In general, building energy consumption and human perception of comfort are often in conflict with each other. When the building users are not feeling comfortable in an indoor environment, the usage of air-condition/heater and lighting increases, resulting to more energy consumption. Therefore, as one of most frequented old buildings in Taiwan, this study focused on the energy consumption and environmental comfort of the Xindian Central Public Retail Market. The traditional market has played a crucial role in the daily life of the local residents; thus, the energy use and comfort level of the market are subjects of great concern. This study explored the actual implementation of green BIM process, in which a green BIM model of the market and surrounding area was constructed in Autodesk Revit, and subsequently a green building energy analysis was conducted using the software IES VE. The corresponding parameters for green building assessment were configured according to an onsite investigation. Ultimately, these analytical outcomes and optimization suggestions can be provided as references in future retrofit to sustainability.
The structure of this study is organized as followings. Section 2 describes the research materials and methods of this study, including software selection, analysis to complete and algorithm to use. Section 3 illustrates the proposed Green BIM case study in detail, demonstrating the latest BIM analytical functions for addressing various green aspects in energy consumption and comfort. Section 4 discusses the results and limitation of this study, and finally, Section 5 concludes this article and offers direction for future studies.
2. Materials and Methods
2.1. Overview
The traditional Xindian Central Public Retail Market in northern Taiwan was chosen as the case study [29], in which a BIM model was constructed to conduct airflow condition, sunlight, and energy consumption analyses, after which the results of each item were assessed. For environmental simulation analysis, project data should first be prepared for each case, including parameters such as building geometry models, adjacent building volumes, impact factors for energy consumption, and climate. A suitable energy analysis software package should be evaluated and chosen for the energy analysis based on the conditions required by this study.
The analyzed items, formulated based on the existing buildings, were sunlight, solar radiation, natural daylighting, indoor and outdoor airflow conditions, predicted mean vote (PMV), predicted percentage dissatisfied (PPD) Index, building cooling load, annual energy consumption, and energy use intensity (EUI). The analysis results were then compared with relevant specifications in Taiwan and other countries for evaluation and optimization. Among the nine items, solar radiation, building cooling load, annual energy consumption, and EUI were directly analyzed for their energy consumption. By contrast, sunlight, natural lighting, indoor and outdoor airflow conditions, PMV, and PPD were related to people’s comfort in an environment; however, they were also indirectly related to energy consumption. If the comfort analysis results reflected dissatisfaction or discomfort, then the building’s energy consumption required improvement.
Above all, Jin et al. [30] remarked that in order to improve user comfort, PMV is the most widely used model and was developed by Fanger in the 1970s through expensive laboratory experiments [31]. The PMV model is the basis of the International Organization for Standardization (ISO) 7730 standard, which was available in 1994 and 2005 versions [32,33]. A personal comfort model is in response to individual thermal comfort, which comments or interprets the comfort level based on the person’s surrounding environment. In detail, there are six variables in defining the PMV thermal comfort, namely air temperature, relative air velocity, mean radiant temperature, mean air humidity, clothing insulation, and metabolic rate. Albatayneh et al. [34] summarized that the first four of these variables can be obtained through measurement sensors; and the remaining two variables of metabolic rate and clothing insulation are dependent on individual users: ISO 9920 (clothing), ISO 8996 (metabolic rate), and ISO 7726 (instruments and methods) [32]. The PMV is established using heat balance principles and data gathered in a controlled climate environment under steady-state conditions. The PMV index predicts the mean response of the general public, as outlined by the American Society of Heating, Refrigerating, and Air-Conditioning Engineers (ASHRAE) thermal sensation scale, as shown in Table 1.
The acceptable thermal comfort range for predicted mean vote (PMV) from the ASHRAE 55-2010 is between −0.85 and +0.85 [35]. Further, the ASHRAE has developed an industry standard, which is known as the Thermal Environmental Conditions for Human Occupancy/ASHRAE Standard 55-2017. PMV and PPD models are the main thermal comfort modules used by ASHRAE Standard 55-2010, which are also adopted by Comité European de Normalization (CEN) and by International Standardization Organization (ISO) standards [34].
2.2. Selecting the Software Package for Green Building Energy Analysis
The development of BIM, from its original two-dimensional (2D) plane operation to the current three-dimensional (3D) information modeling, has led to the integration of multidisciplinary talents, enabling them to participate in the entire life cycle of a building through BIM-related software and technology [36]. However, at present, the analysis and simulation functions of green building applications in BIM-related software are relatively simple and imperfect, requiring assistance from other professional energy analysis software packages to complete all necessary processes. Many such packages can now be linked with BIM models, such as Vasari, Ecotect, Green Building Studio, and IES VE. Table 2 provides an overview of the functions of each software package in its application to green building analysis.
Based on the functions and features of each software package as well as the integrity of information conversion between the BIM model and energy analysis software, IES VE 2018 (Integrated Environmental Solutions Ltd., Glasgow, UK) was employed by this study as the green energy analysis software. IES VE 2018 can read gbXML files converted by Autodesk Revit, and its energy consumption analysis is more specific. The integrated software module is extremely flexible and adaptable, and the parameters can be adjusted according to the current situation, such as the number of people, equipment, exterior wall and window materials, and air-conditioning equipment. It could be used to simulate PMV and PPD, thereby enabling the identification of the reasons behind comfort issues and the comparison through simulated data with comfort requirement standards [37,38]. Accordingly, simulations using IES VE closely resemble actual situations, and the configurations that consider different situations can be directly fed back into the energy consumption data. Therefore, this study selected IES VE as its main energy analysis model.
2.3. Prepreparation: BIM Guidelines
Certainly, introducing the BIM model at different stages results in different workflows and required designs. Thus, a BIM model constructed when implementing various engineering applications should be individually designed according to the needs of the project.
This study involved a green BIM process in the subsequent reconstruction phase, and the completed BIM model was drawn using Autodesk Revit 2018. Before modeling, the requirements of the BIM model that could be subjected to energy analysis in IES VE had to first be understood to serve as criteria for modeling. Therefore, the general model roll-out criteria were as follows:
- Modeling only requires the wall, floor, doors, windows, and roof to be drawn.
- The model should be simplified, such as by changing the circle to a polygon.
- Space/room labels are required for each space.
- A Chinese document name should be avoided for the exported gbXML file.
In addition to modeling the main building, adjacent buildings are a crucial factor in building energy consumption. They affect sunlight, solar radiation amount, and outdoor airflow conditions. Thus, the construction of surrounding building volumes is also critical. The construction of adjacent buildings in IES VE also follows a set of criteria listed as follows:
- The building volume is set as the energy model.
- The surrounding area and window opening rate are cancelled during energy configuration.
- Chinese file names are avoided for the exported gbXML file.
- Building nature is changed to building volume in IES VE.
After the energy model was constructed according to the abovementioned criteria, the gbXML file was exported and opened with IES VE for subsequent energy simulation analysis.
2.4. Status Analysis: Green Building Energy Analysis Using IES VE
Simulation analysis of green building energy consumption requires information such as building geometry volume, meteorological data, air-conditioning systems, and indoor load (i.e., people, equipment, and lighting) as well as a clear understanding of the parameters required for the analyzed items; some require actual surveying. Complete collection of the parameters can accelerate the analysis process and enhance the accuracy of the results.
2.4.1. Referencing External Meteorological Information
The meteorological information cited in this study was the “Hourly Typical Meteorological Years 3 (TMY3) for Taiwan Green Building Energy Simulation Analysis,” which covered eight locations in northern, central, southern, and eastern Taiwan, namely Taipei, Hsinchu, Taichung, Chiayi, Tainan, Kaohsiung, Hualien, and Taitung. TMY3 comprises months from various years that form 1-year hourly meteorological data. Each weather station acquires a long-term average status while simultaneously excluding abnormal climate conditions from 1990 to 2012 (23 years in total); this serves as the screening period for TMY. The selected months are determined based on a screening procedure known as the Sandia method, which was developed by the National Renewable Energy Laboratory in the United States. The research process includes analyzing the sensitivity of various meteorological elements (i.e., sunlight volume, temperature, wind velocity, wind direction, and humidity) for the building energy simulation [39].
2.4.2. IES VE Internal Settings
The internal settings concern various parameter configurations, such as structural materials, types of use, windowing conditions, open-window conditions, and air-conditioning systems, which may all affect the energy performance of the model.
- Using the internal settings of the hypothetical parameters
The energy configuration criteria were based on the standards of the American Society of Heating, Refrigerating, and Air-Conditioning Engineers, and the IES VE default values were used as the criteria for those not covered by the aforementioned standards. The sources of energy value assumptions were as follows:
- Energy consumption density of the lighting and equipment in the space template: ASHRAE 90.1 2010 (shown in Table 3).
- Air-conditioning system: fan coil system, IES VE default values.
- Hardware equipment (solar photovoltaic [PV] panel): monocrystalline silicon solar PV panel, IES VE default values.
- Exterior wall and window glass structure: structure coefficient of reinforced concrete (RC) exterior walls in the 2012 Green Building Evaluation Manual—Basic Version.
In this study, most of the market equipment analyzed was old and unverifiable. Although the lighting, equipment, and air-conditioning system were inconsistent with the actual situation, the cited data were still based on credible sources; thus, the analysis results were consistent with common situations.
- 2.
- Internal settings using actual parameters
Through actual onsite investigation, the relevant parameters collected were as follows:
2.5. Optimization Analysis
In this study, the following indicators were adopted as criteria for optimizing the analysis results. However, because of limitations of the existing conditions in the traditional market, not all analyzed items could be improved. Without changing the original usage of the market, this study proposed optimization suggestions for envelope heat radiation, energy consumption of the air-conditioning system, and indoor airflow. The remaining analyzed items were subjected to energy consumption evaluations to serve as reference for subsequent research and reconstruction.
2.5.1. Sunlight Analysis
- Purpose of the analysis
Sunlight directly affects the external radiation and indoor natural daylighting of the building, and the analysis results revealed the position that had the most sunlight, as well as shadow relationships with the adjacent buildings.
- 2.
- Evaluation indicators and optimization plans
Improvements in people’s quality of life have led to an increasing emphasis on the right to enjoy sunshine [40]. The indicator used in this study was to examine sunlight during winter solstice and the effective hours of daylighting in adjacent houses (more than 1 h). According to the Taiwan’s Building Technical Regulations [41], for newly built buildings or additional constructions that exceed a height of 21 m, more than 1 h of effective sunlight during winter solstice should be ensured for the neighboring housing sites to guarantee their right to enjoy sunshine. Therefore, this indicator was adopted to discuss the relationship between the traditional market and adjacent buildings. However, because the case study involved analyzing an existing building with somewhat limited relationships with surrounding buildings, little improvement could be made in terms of sunlight. Therefore, this study only provides analysis results for the reference of subsequent reconstruction designs.
2.5.2. Envelope Heat Radiation Analysis
- Purpose of the analysis
If the wall and window materials are prone to heat absorption and have difficulty in heat insulation, indoor heat storage will result in increased temperatures. The analysis results revealed the amount of envelope heat radiation, based on which an improvement approach was proposed to reduce the effect of indoor heat storage, namely wall insulation. Wall insulation can reduce energy consumption and has a positive effect on building energy consumption.
- 2.
- Evaluation indicators and optimization plans
Heat insulation is crucial in the design of green buildings because it enables rooms to retain their original internal heat while simultaneously avoiding excessive envelope heat as well as decreasing the design capacity of the building’s heating, ventilation, and air conditioning (HVAC) system [42].
In this study, a Photo Voltaic (PV) system was used to simulate the annual power generation of solar cells. The PV system was installed on the building’s roof to block part of the heat radiation and convert sunlight into usable energy.
Monocrystalline solar panels were installed on the roof under the assumption that the rooftop space was fully used to predict the maximum possible generation of renewable energy. The solar panel size was set as 2 m × 0.9 m, and the IES VE default parameter was used. Future settings can be based on the product parameter of the PV system. Taiwan is located on the Tropic of Cancer in the northern hemisphere, and the location of direct solar radiation is between the equator and the Tropic of Cancer. Therefore, the solar panels were oriented southward to receive sunshine daily. Moreover, Taiwan’s latitude is between 22° and 25° north, and thus, tilting the solar panels at 25° enabled sunlight to shine directly on them during winter, thereby achieving optimal heat collection.
2.5.3. Door Natural Daylighting Analysis
- Purpose of the analysis
The ideal light source for buildings is natural light, and the daylighting condition of a building should be prioritized in the examination of its lighting equipment design. Free sunlight should be used to the greatest extent possible to reduce a building’s artificial lighting and its energy consumption.
- 2.
- Evaluation indicators and optimization plans
This study focused on the analysis of indoor natural daylighting, and the Chinese National Standard CNS12112 [43] for illumination was used as the research indicator. Venues of different purposes have appropriate horizontal illuminance values that match their respective needs. Illuminance is the total luminous flux incident on a surface, per unit area, using the LUX for measurement unit. The following is a list of the illuminance values required for the space in the traditional market according to the abovementioned standard.
- Office: 500 LUX
- Retail store—large sales area: 500 LUX
- Library—reading area: 500 LUX
- Entertainment venue—multipurpose hall: 300 LUX
- Classroom: 200–500 LUX
- Corridor, stairs, toilet: 100–150 LUX
- Warehouse: 75–100 LUX
2.5.4. Door and Outdoor Ventilation Analysis
- Purpose of the analysis
Simulation analysis of outdoor airflow conditions was originally applied at the design end to review the orientation, window opening rate and appropriateness of the building volume combination to improve the comfort of outdoor space use. However, the present study was concerned with the simulation analysis of outdoor airflow conditions of existing buildings, and thus focused on pedestrian-level wind near the site.
Next, simulation analysis of indoor airflow conditions was conducted. Air-conditioning equipment is often used to improve indoor environmental conditions caused by heat during summer in Taiwan, resulting in substantial energy consumption. The effective use of natural ventilation can achieve energy-saving effects while simultaneously removing harmful pollutants indoors. The present study proposed an optimization suggestion based on the simulation results of the natural indoor ventilation conditions, namely to increase indoor airflow, thereby reducing the use of indoor air conditioning.
- 2.
- Evaluation indicators and optimization plans
- Outdoor airflow condition analysis
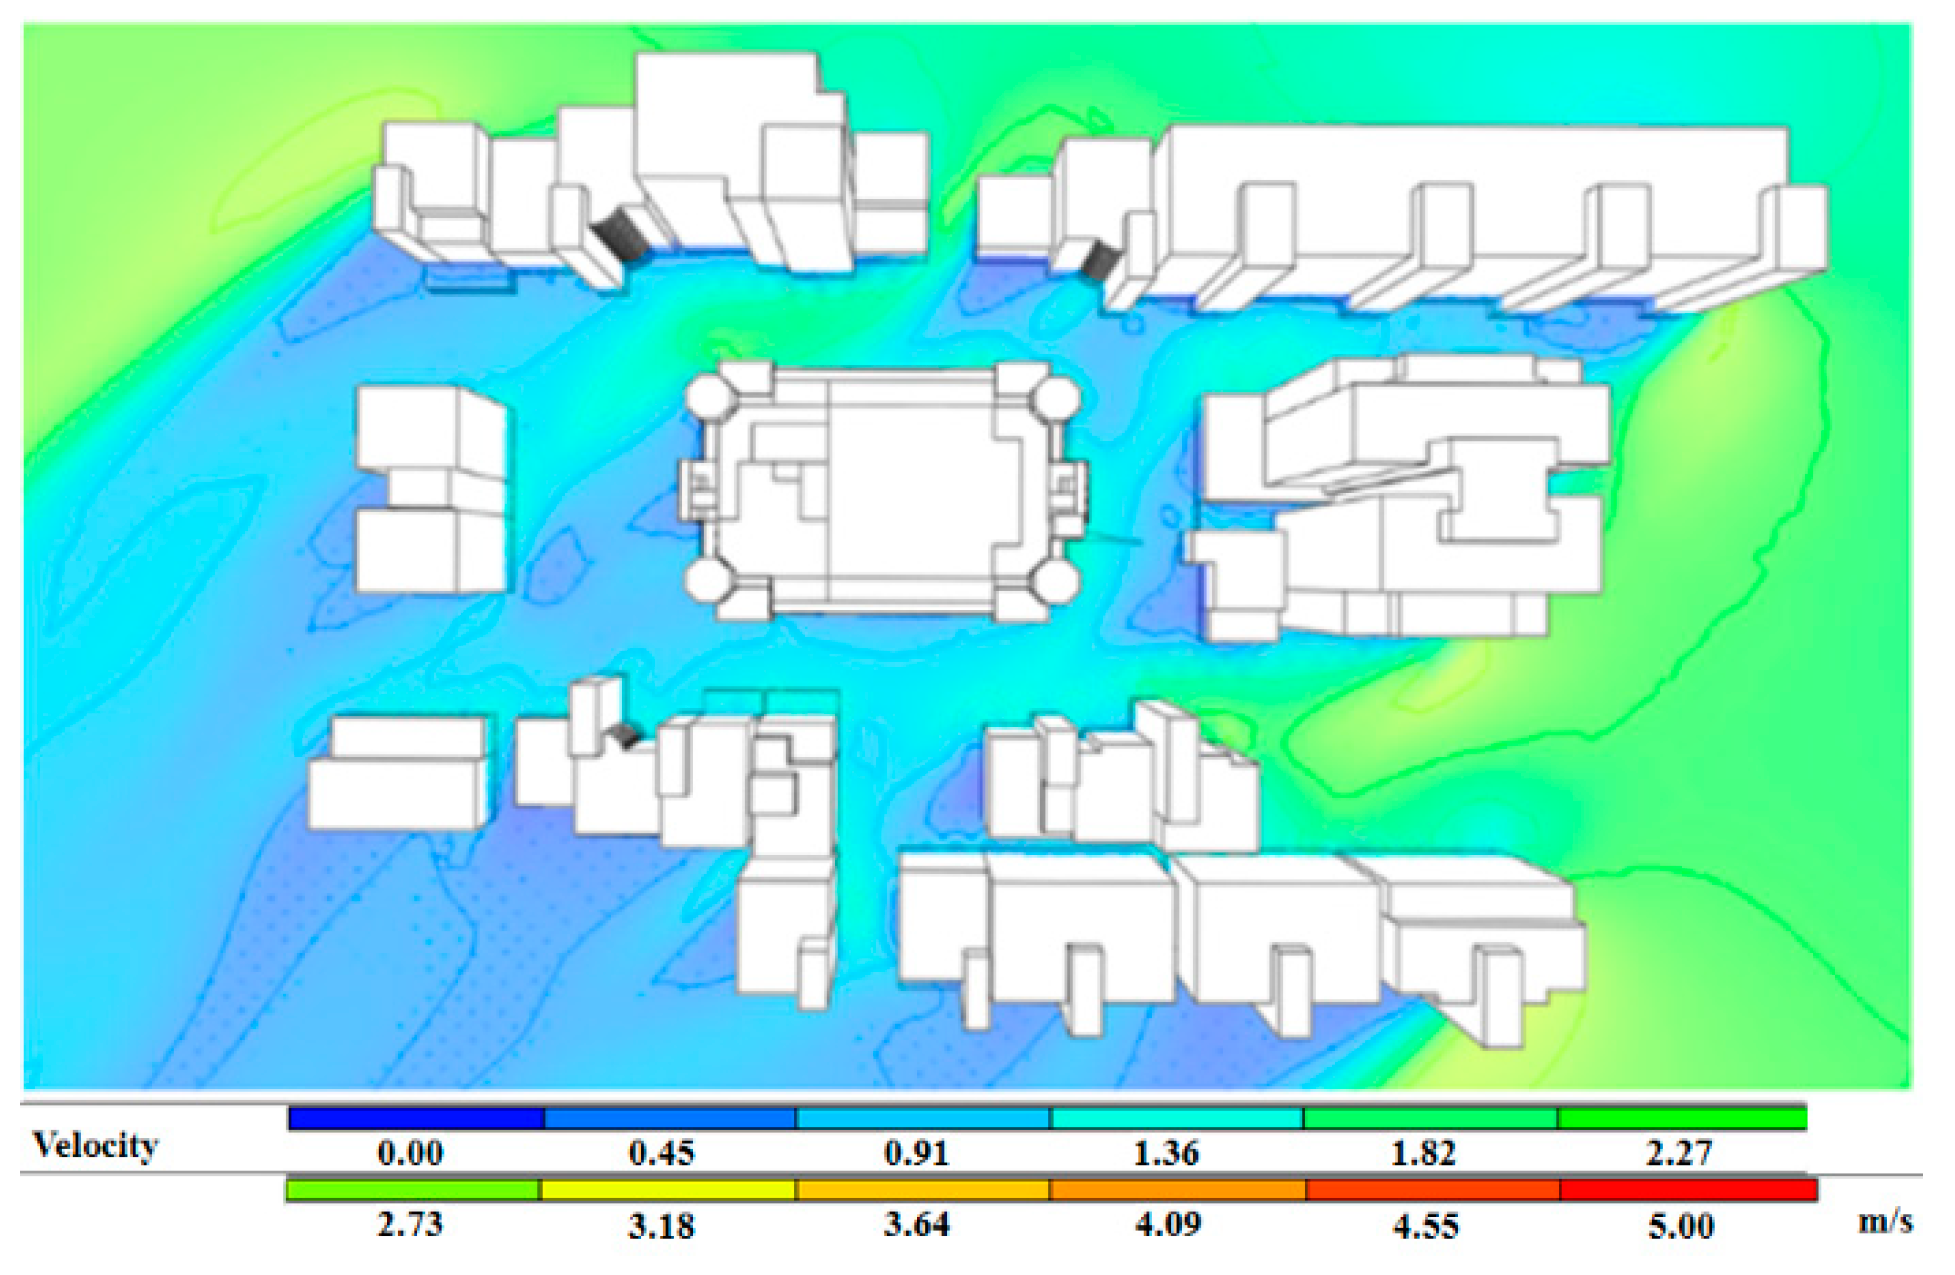
The indicators employed for the outdoor airflow condition were based on China’s Evaluation Standard for Green Building. The wind velocity of the pedestrian-level wind at 1.5 m from the ground should be less than 5 m/s. The most common annual wind direction and wind velocity based on the wind rose plot acquired from the analysis results were used to explore whether the pedestrian-level wind near the building was consistent with the specification of the indicators. Additionally, to explore the changes in pedestrian-level wind near the building under the maximum wind velocity, the wind direction of the maximum wind velocity during that year and its outdoor airflow condition were analyzed.
- Indoor airflow condition analysis
The indoor airflow condition analysis focused on the indoor wind velocity and distribution of the age of air in various spaces within a room. Indoor computational fluid dynamics (CFD) for outdoor annual wind as well as the wind at maximum velocity were analyzed to compare the distribution of its indoor airflow conditions. The indoor wind velocity indicator was based on the specification set by the ASHRAE, namely that an indoor wind velocity of less than 0.5 m/s is the most comfortable. According to Sandberg et al. [44], the age of air refers to the retention time of the air when it enters a space, with a younger age indicating a more favorable age and quality of air in the space.
Building ventilation is achieved through means of mechanical or natural ventilation, each of which has its own advantages and disadvantages; mechanical ventilation consumes energy, whereas natural ventilation is unstable. In the present study, without changing the indoor layout, mechanical ventilation was selected as the optimization suggestion.
2.5.5. PMV and PPD Analyses
- Purpose of the analyses
As mentioned in Section 2.1, the indoor comfort would be assessed using PMV and PPD model. The factors affecting the PMV index include indoor environmental factors (temperature, humidity, and wind velocity) and human body factors (clothing amount and activity volume). The percentages of people who feel uncomfortable under the PMV comfort index are represented using the PPD. Each factor will be set from specific real data collections and corresponding activity intensity in a reasonable way.
- 2.
- Evaluation indicators and optimization plans
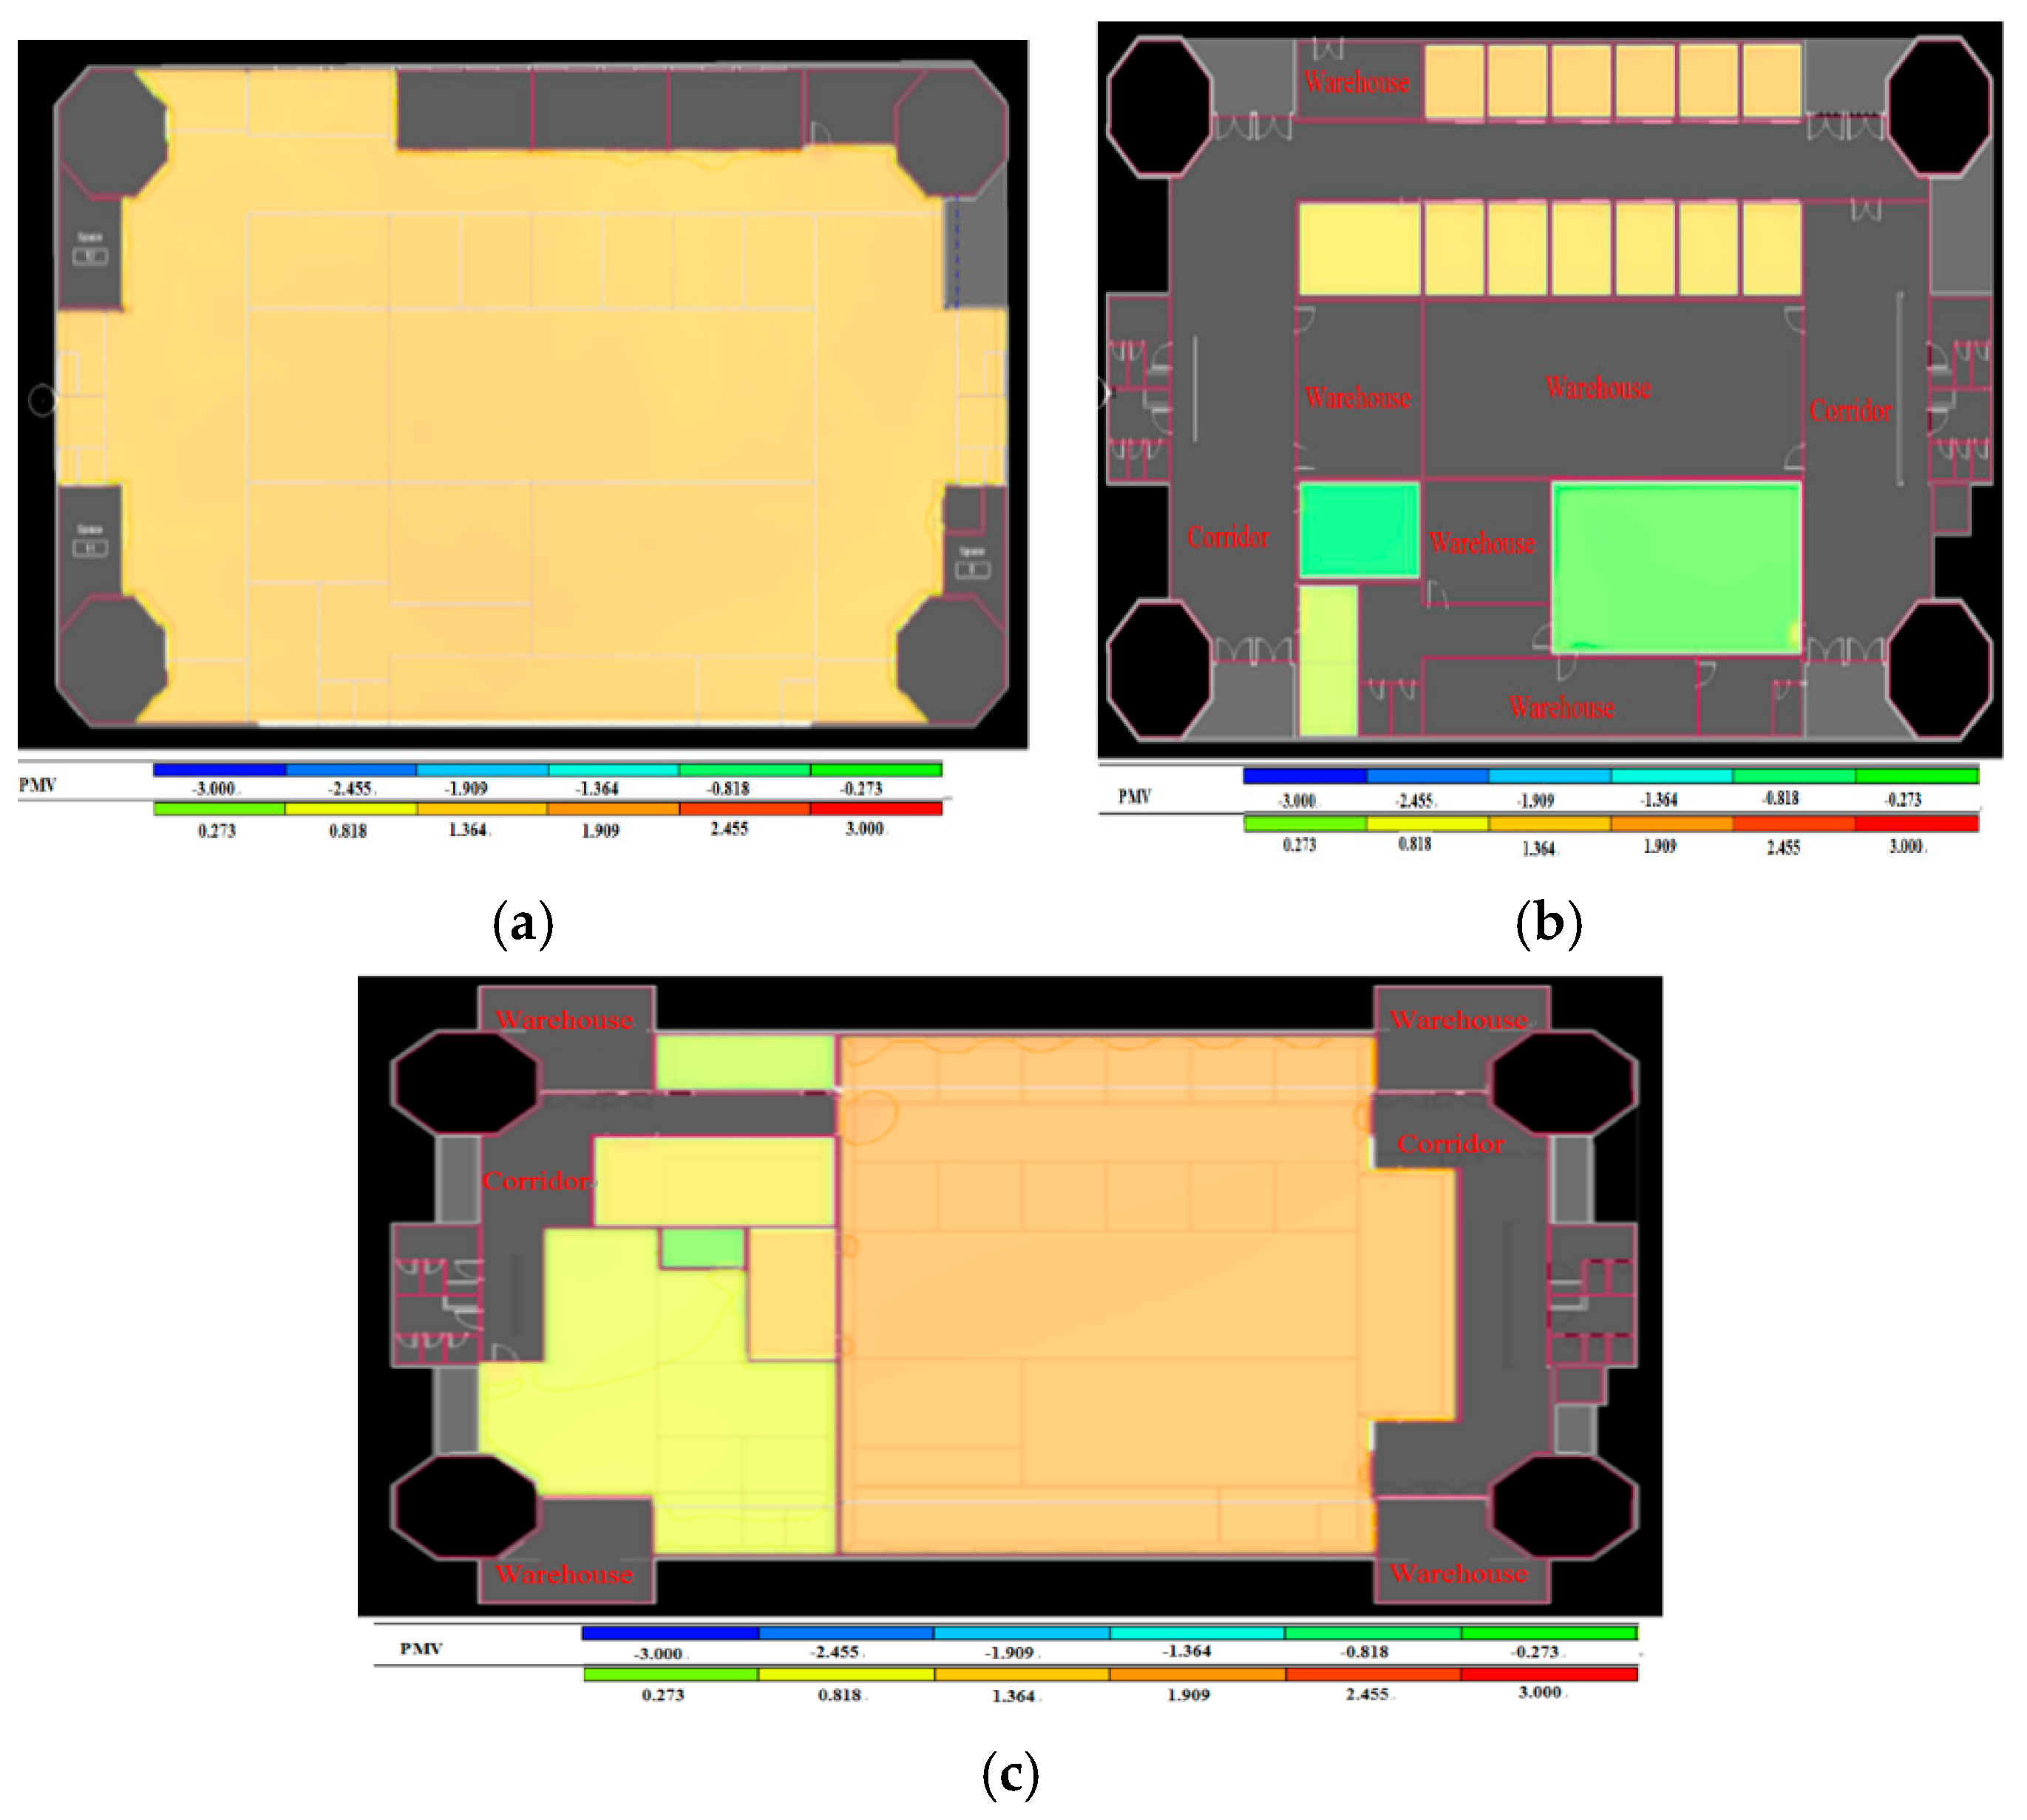
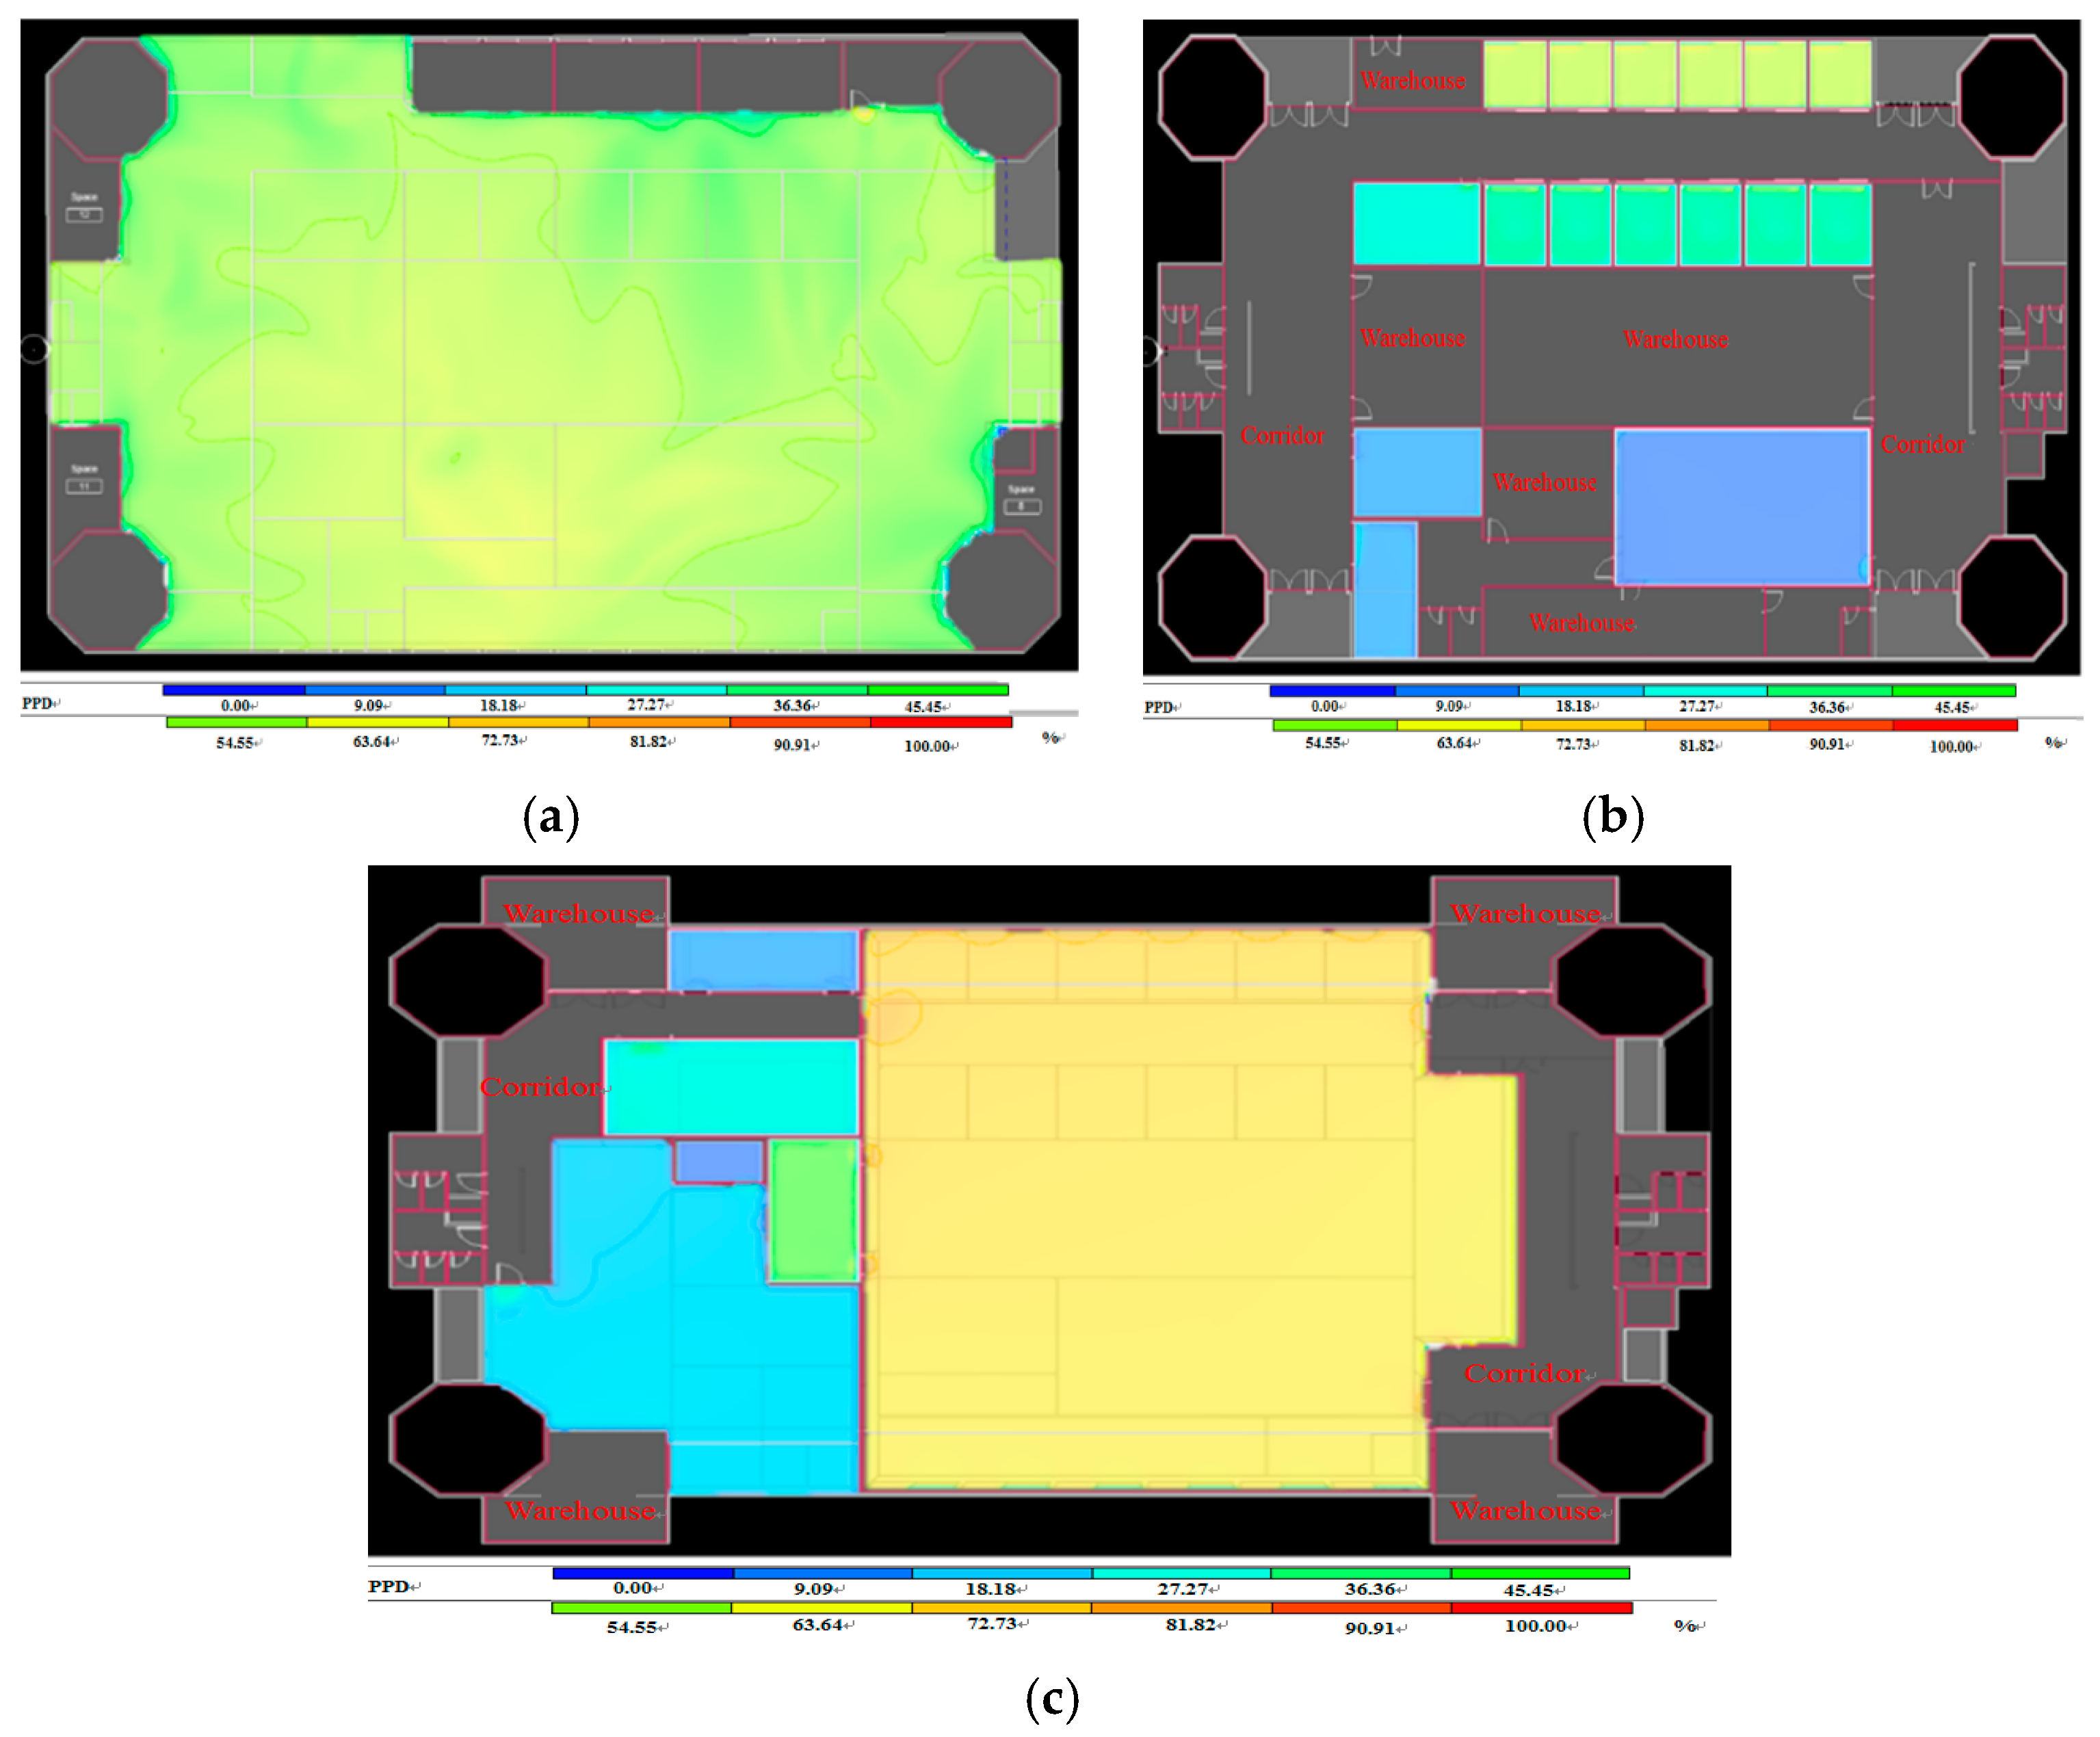
PMV and PPD are used to determine the level of comfort of the body within a space. The PMV index quantifies the comfort level of the body’s perception of cold and heat in the environment into seven levels: the most comfortable level is PMV = 0; PMV = 0–3 indicate higher temperatures perceived by the body; and from −1 to −3 indicate lower perceived temperatures (Table 1). The PPD index represents the percentage of people who feel hot (+3), warm (+2), cool (−2), and cold (−3) based on the seven PMV index levels.
In this study, PMV and PPD comfort levels during the summer and winter solstice were analyzed to explore the human body’s perception of comfort and warmth during these periods if only windows are open and no air conditioning is used in a space.
2.5.6. Load Analysis of the Building’s Cold and Warm Rooms
- Purpose of the analysis
To maintain constant indoor temperatures for people’s comfort, the heat that must be removed from the room (cold room load) per unit time by the air-conditioning system must be calculated. Therefore, the design capacity of the HVAC system required for each building is different.
The heat transferred from the building’s exterior wall is often a main source of air-conditioning load. Thus, correctly using exterior-wall heat insulation in a building can reduce its energy consumption and the design capacity of its HVAC system [42]. Accordingly, improving the exterior wall and window materials and decreasing the heat gain can reduce the load demand of cold and warm rooms, in turn attaining decreased energy consumption.
- 2.
- Evaluation indicators and optimization plans
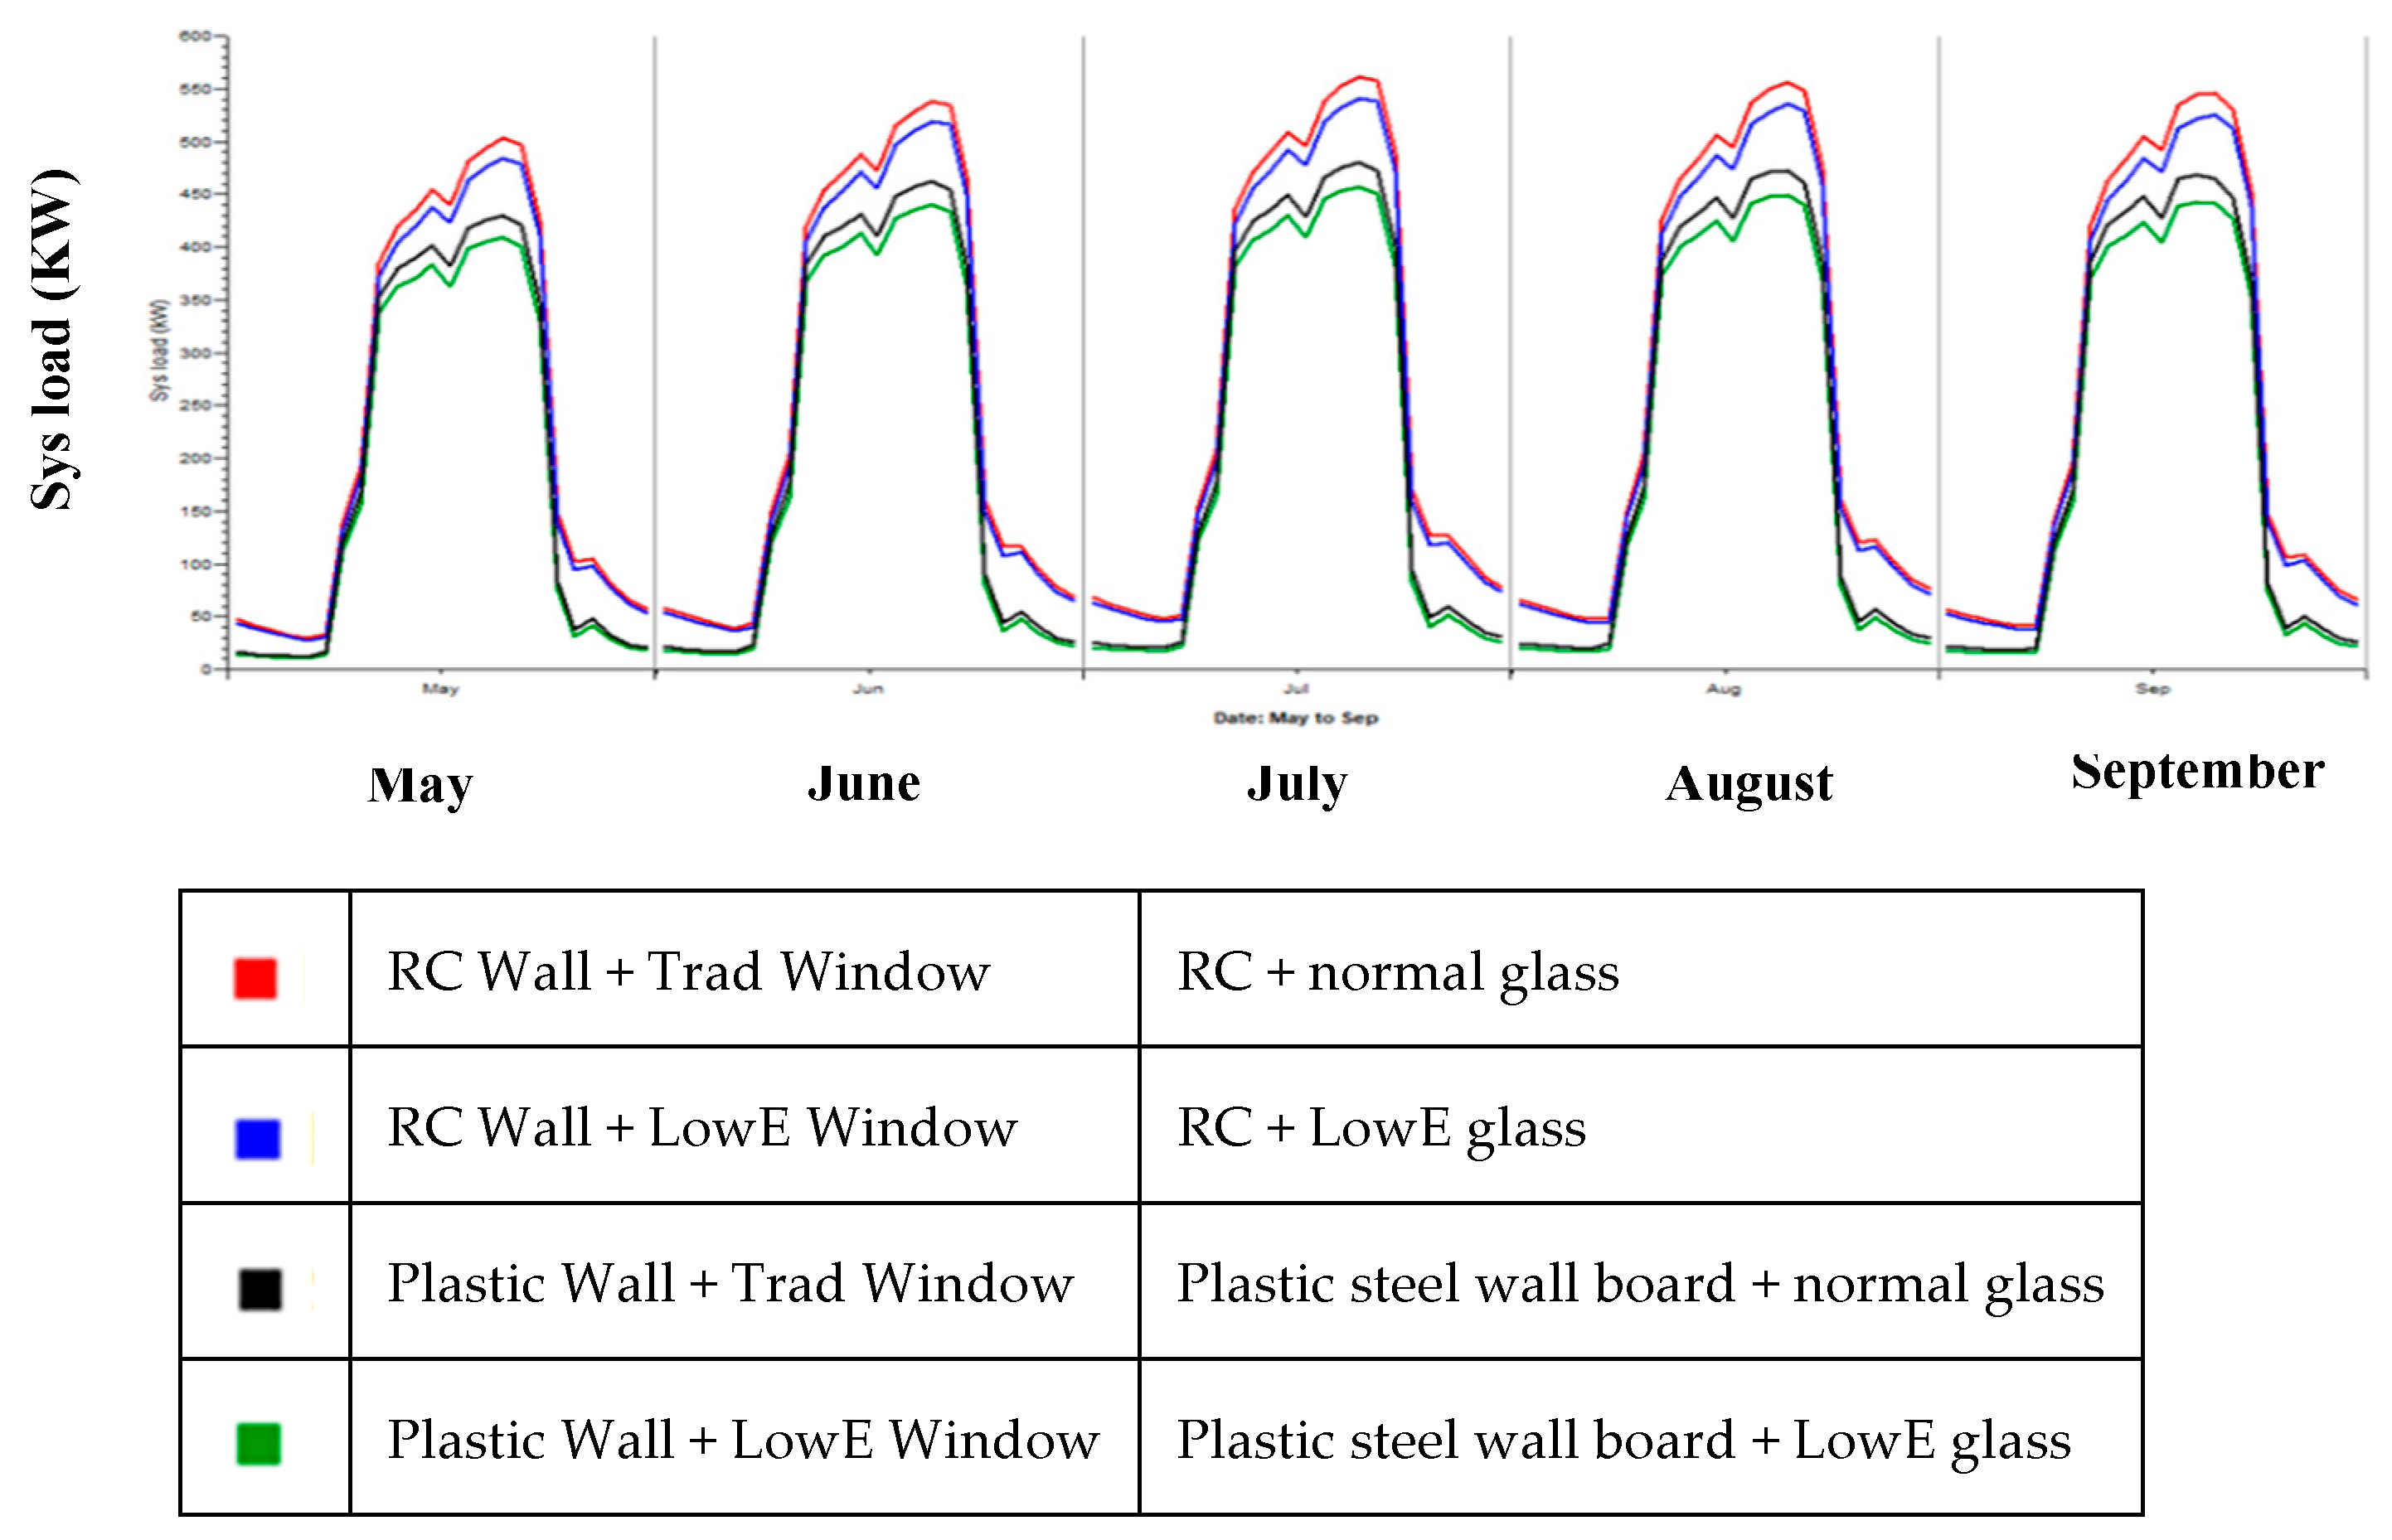
According to the analysis results, the total power consumed by a building’s air conditioner to maintain indoor temperatures under normal circumstances is the cold room load. The heat transferred indoors through the building’s exterior wall is often a main source of the cold room load. Taiwan’s building materials are mostly noninsulating and houses are mostly built using RC, which is prone to heat storage. Currently, the most common heat insulation method is to construct an additional layer of insulating exterior wall outside the building’s wall to prevent it being directly exposed to sunlight. Therefore, without replacing the air-conditioning system, this study assumed that an additional exterior wall was installed outside the building’s wall and the window material was replaced; subsequently, the cold room loads before and after the improvement were compared.
Regarding the exterior wall, a plastic steel wall board was selected for its material, the main component of which is polyoxymethylene and its thermal conductivity is several times lower than that of RC. Furthermore, LowE glass was selected as the window material; also known as insulated glass, it is composed of two glass sheets with a layer of dry, nonconvecting air sandwiched between to reduce heat transfer.
2.5.7. Annual Energy Consumption Analysis
- Purpose of the analysis
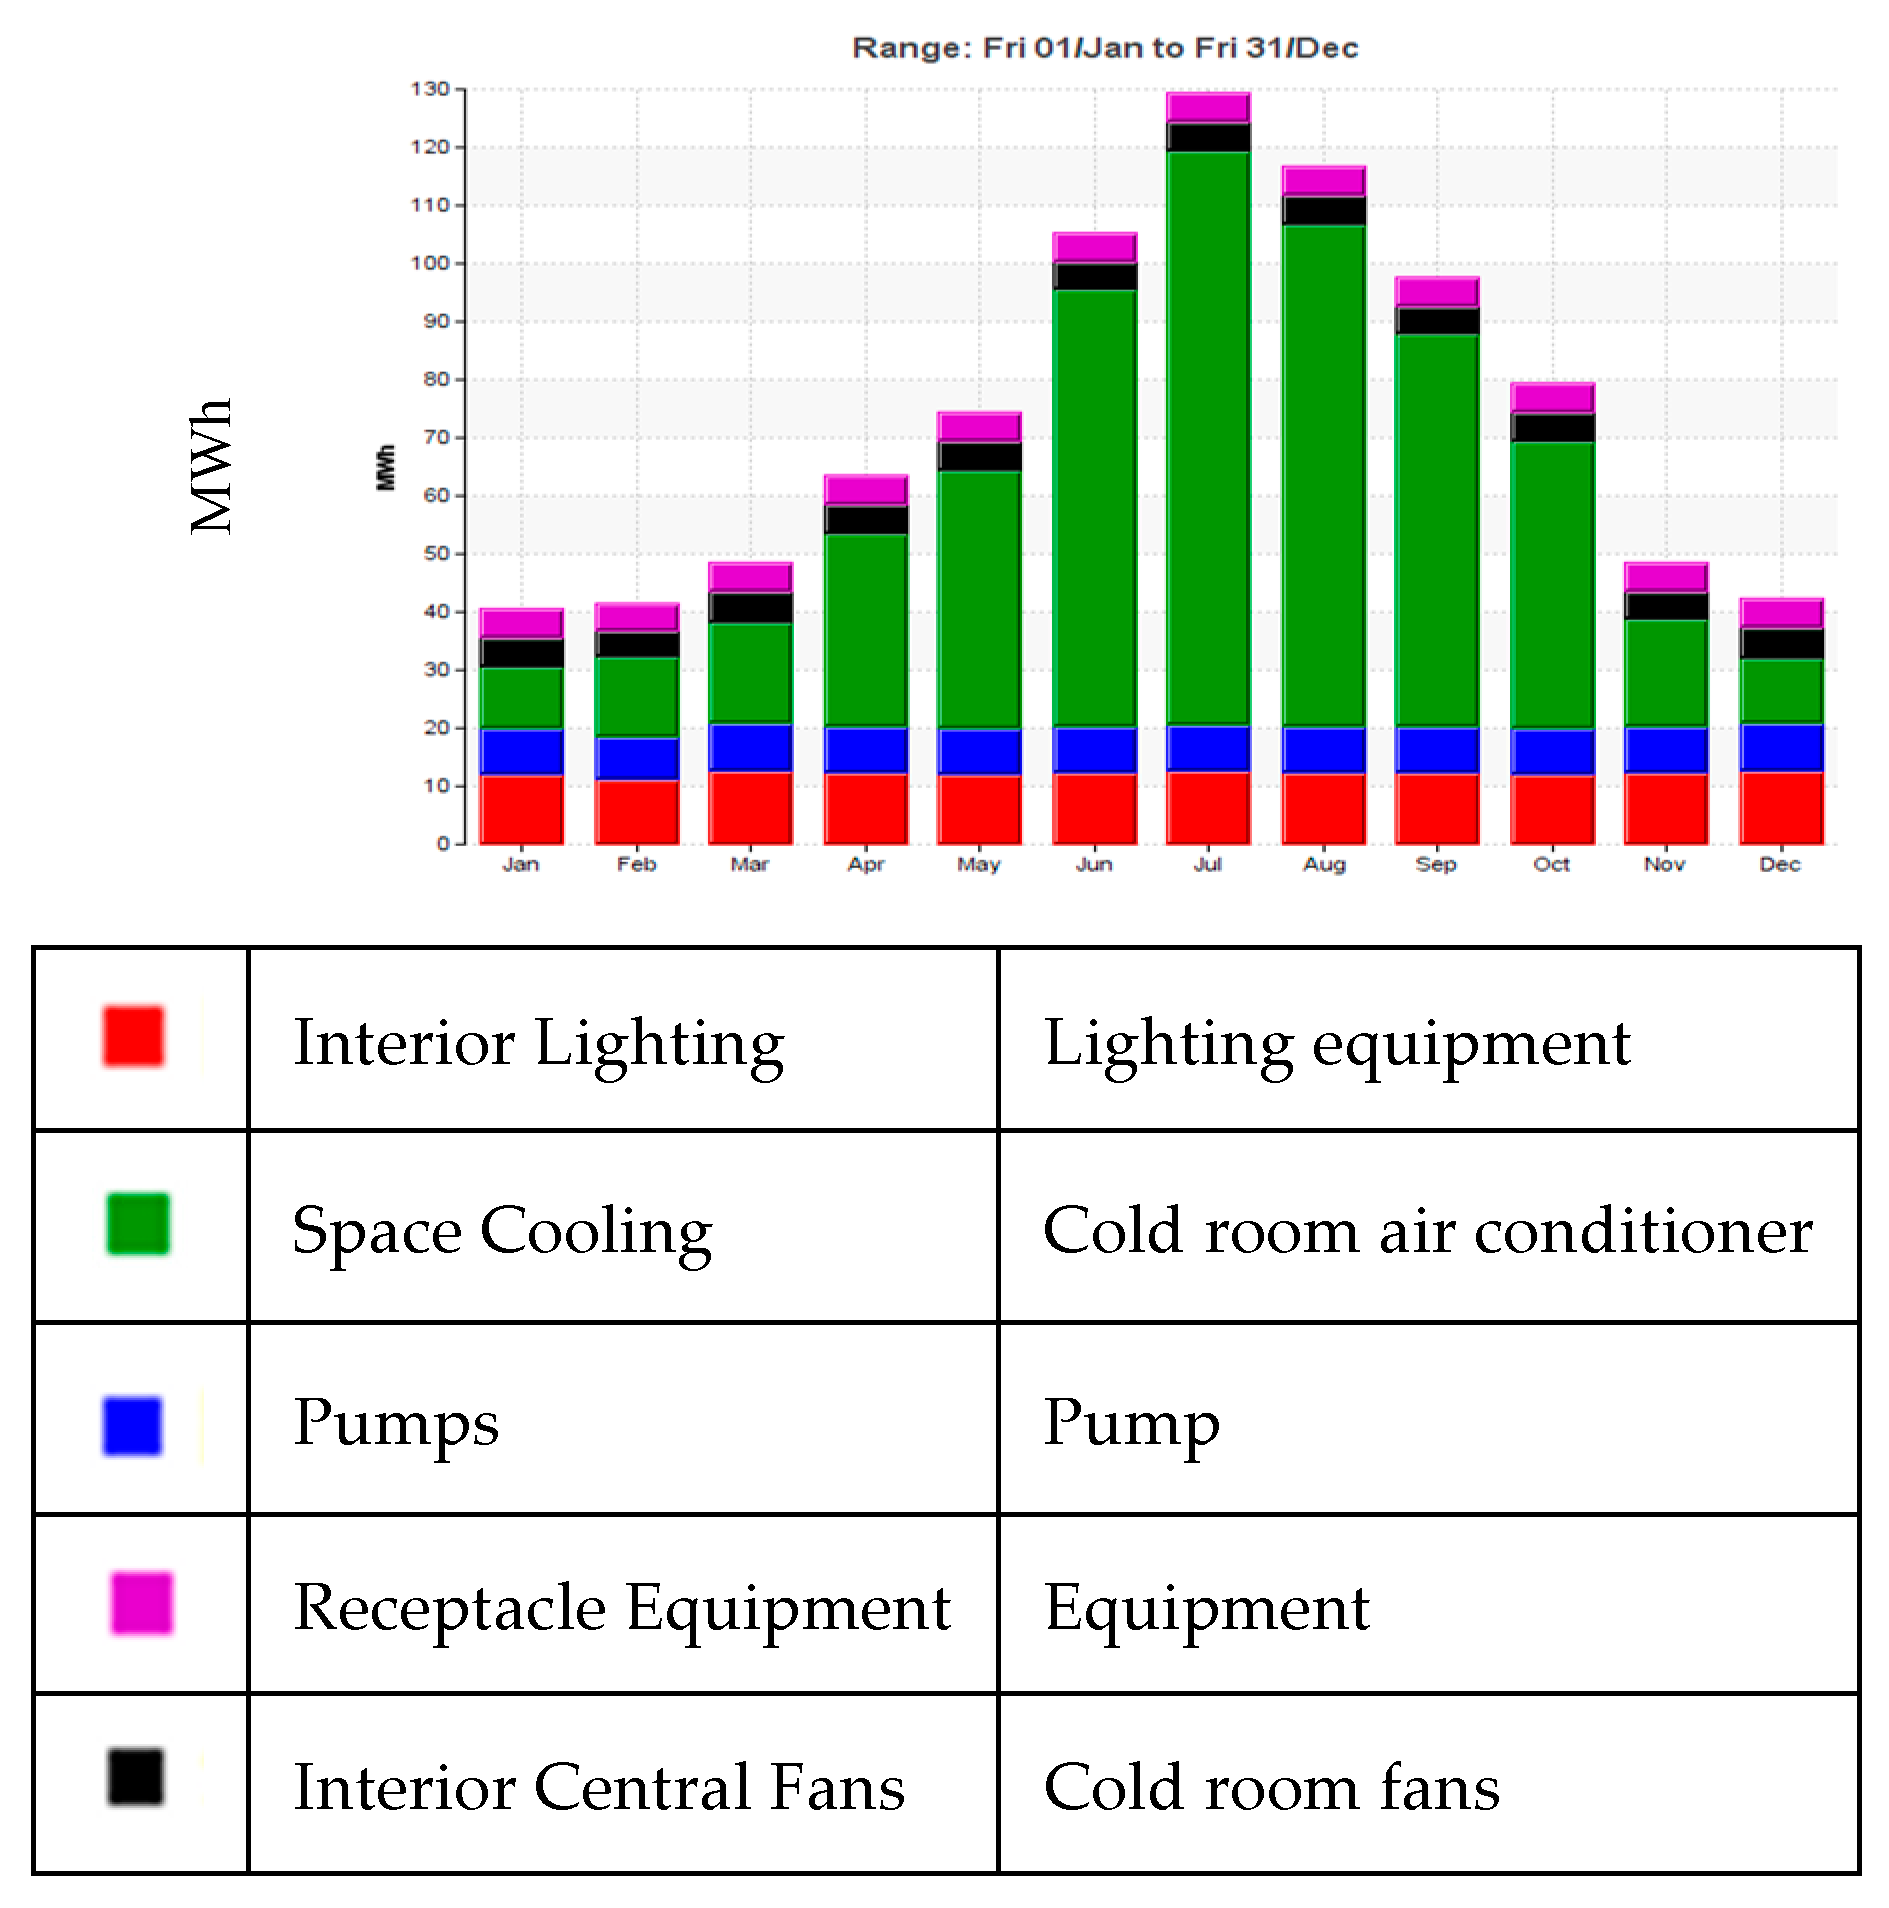
The annual energy consumption analysis of a building predicts its energy consumption throughout the year; it is calculated hourly throughout the year in IES VE. Based on the preset indoor heating source in the previously configured space template, the various factors that affected the building’s energy consumption were considered to analyze the energy consumption of the building’s lighting, equipment, HVAC system, domestic hot water, fans, and pumps. The analysis results could be employed to determine the factor with the highest energy consumption level, after which improvements were suggested to reduce the building’s energy consumption.
- 2.
- Evaluation indicators and optimization plans
The analysis results revealed the factors with the highest energy consumption in the traditional market, enabling relevant improvements to be implemented. Lighting and air conditioning were generally responsible for the most energy consumption, and therefore, replacing relevant equipment in the traditional market can achieve significant energy-saving effects.
2.5.8. Analysis of Annual Energy Consumption Density per Unit Area
- Purpose of the analysis
EUI is a widely used indicator for building’s electricity consumption. EUI values reflect the proportions of energy use, and thus, are widely used to analyze energy consumption.
- 2.
- Evaluation indicators and optimization plans
The EUI value was calculated based on the total energy consumption for the whole year obtained from the annual energy consumption analysis, together with the total floor area of Xindian Central Public Retail Market acquired from the collected information. Additionally, the EUI statistical data (Table 6) in the Technical Manual for Building Energy Conservation Application [45] was referenced for evaluating the energy consumption level of the market’s EUI value in relation to the average.
3. Case Study: Xindian Central Public Retail Market, New Taipei City
3.1. Current Usage
Completed in 1983, Xindian Central Public Retail Market (24°58′29.1″ N, 121°31′37.1″ E) was the first public market in Xindian District, New Taipei City. An RC building with two floors above ground and one basement level, the market not only retains the atmosphere of shops from previous eras but also introduces new stores for the convenience of residents of the district. The market’s current uses are as follows [29]:
- The basement is mostly occupied by a supermarket.
- The first floor mainly features stores and offices of the following types: daily necessities, manicures, papermaking, cultural creativity, and handicrafts.
- The second floor serves as an activity center for the public.
- The facilities near the market are mostly parking lots and YouBike stations.
- The surrounding buildings are mostly residential and community buildings.
3.2. Green Building Energy Analysis Results
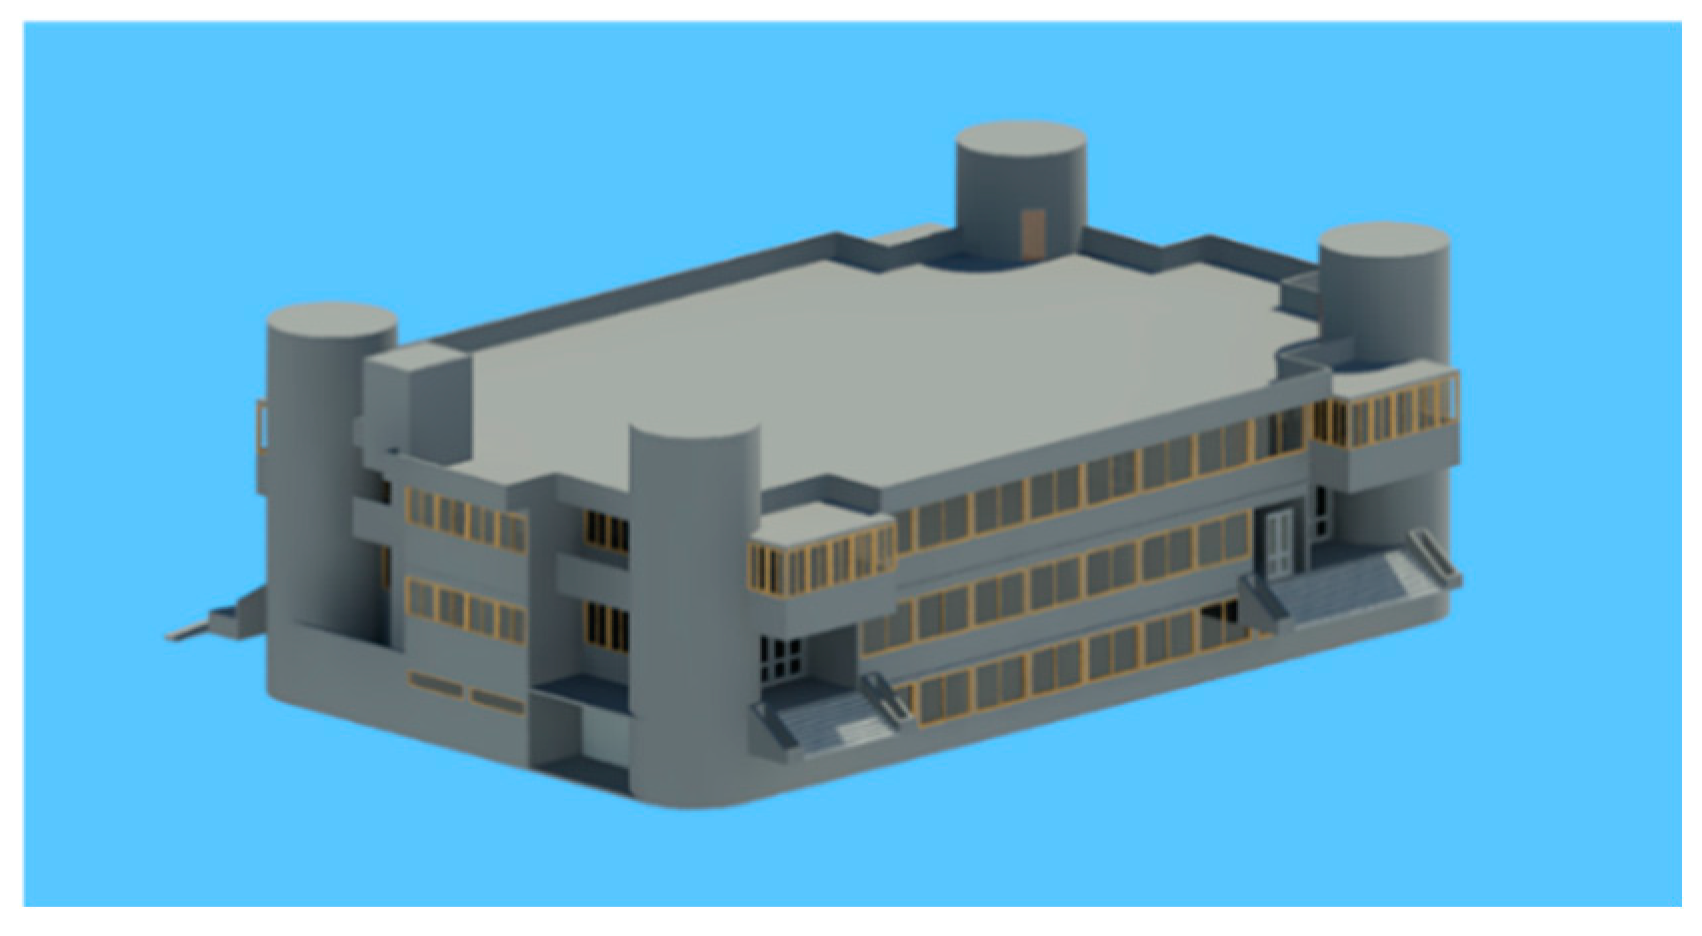
The 3D model of Xindian Central Public Retail Market and its surrounding building volumes were constructed in Autodesk Revit (Figure 1), after which the gbXML file was exported and transferred to IES VE for green building energy analysis.
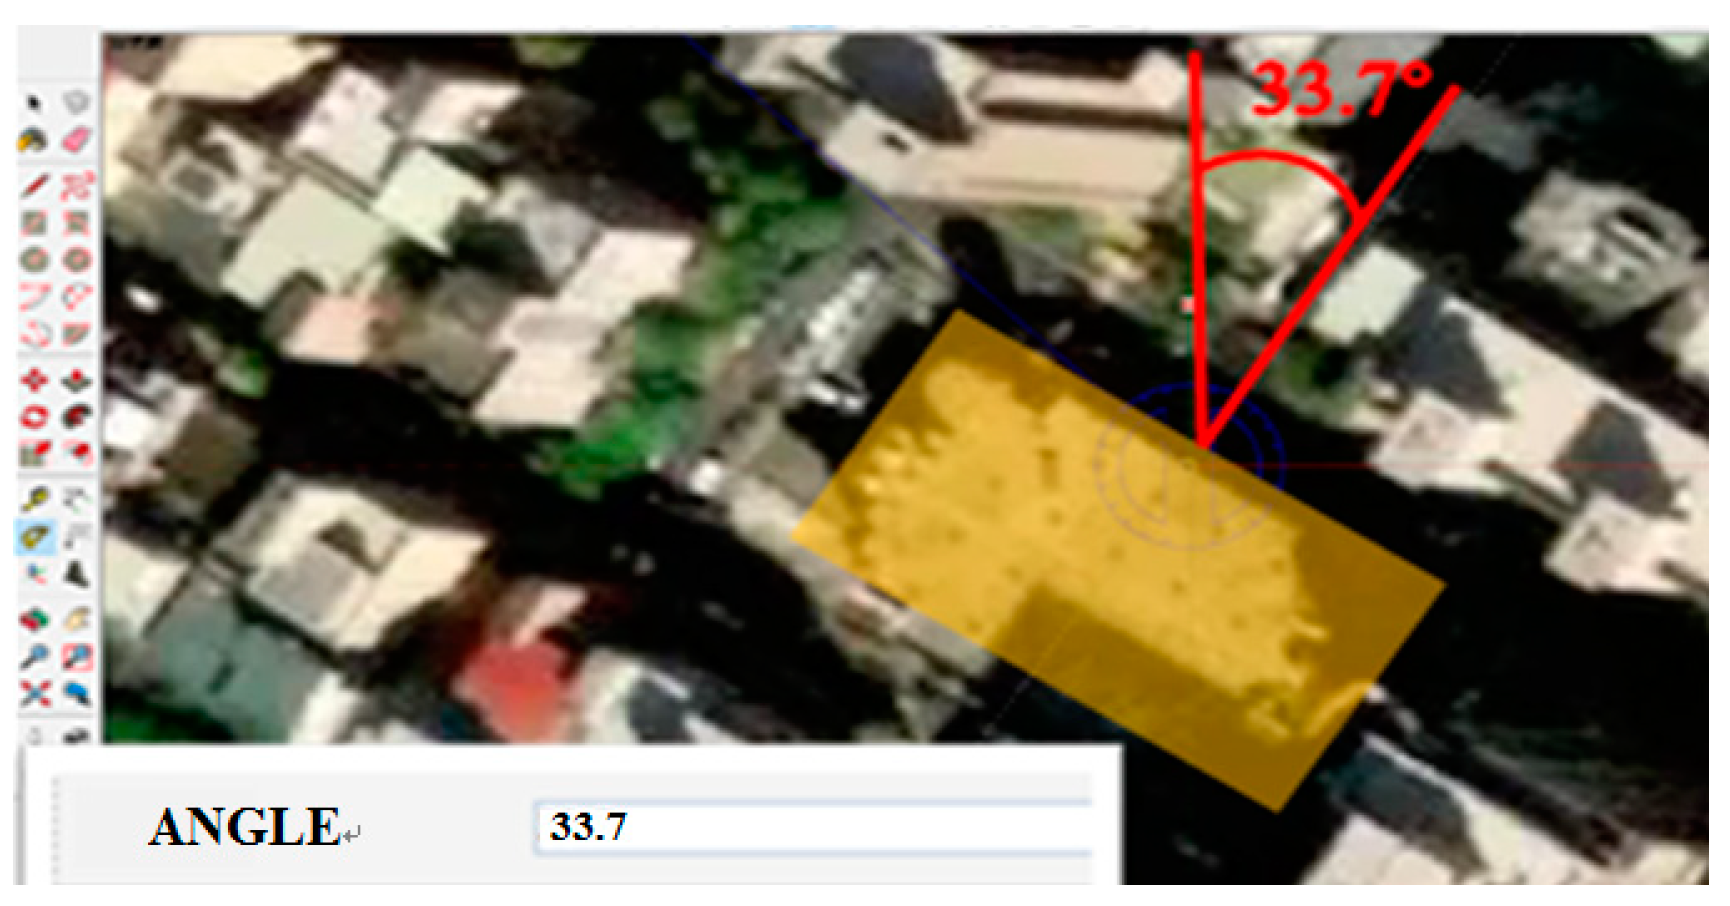
The angle between the market and geographical north was measured using SketchUP, after which a similar angle was set in IES VE (Figure 2).
3.2.1. Sunlight Analysis
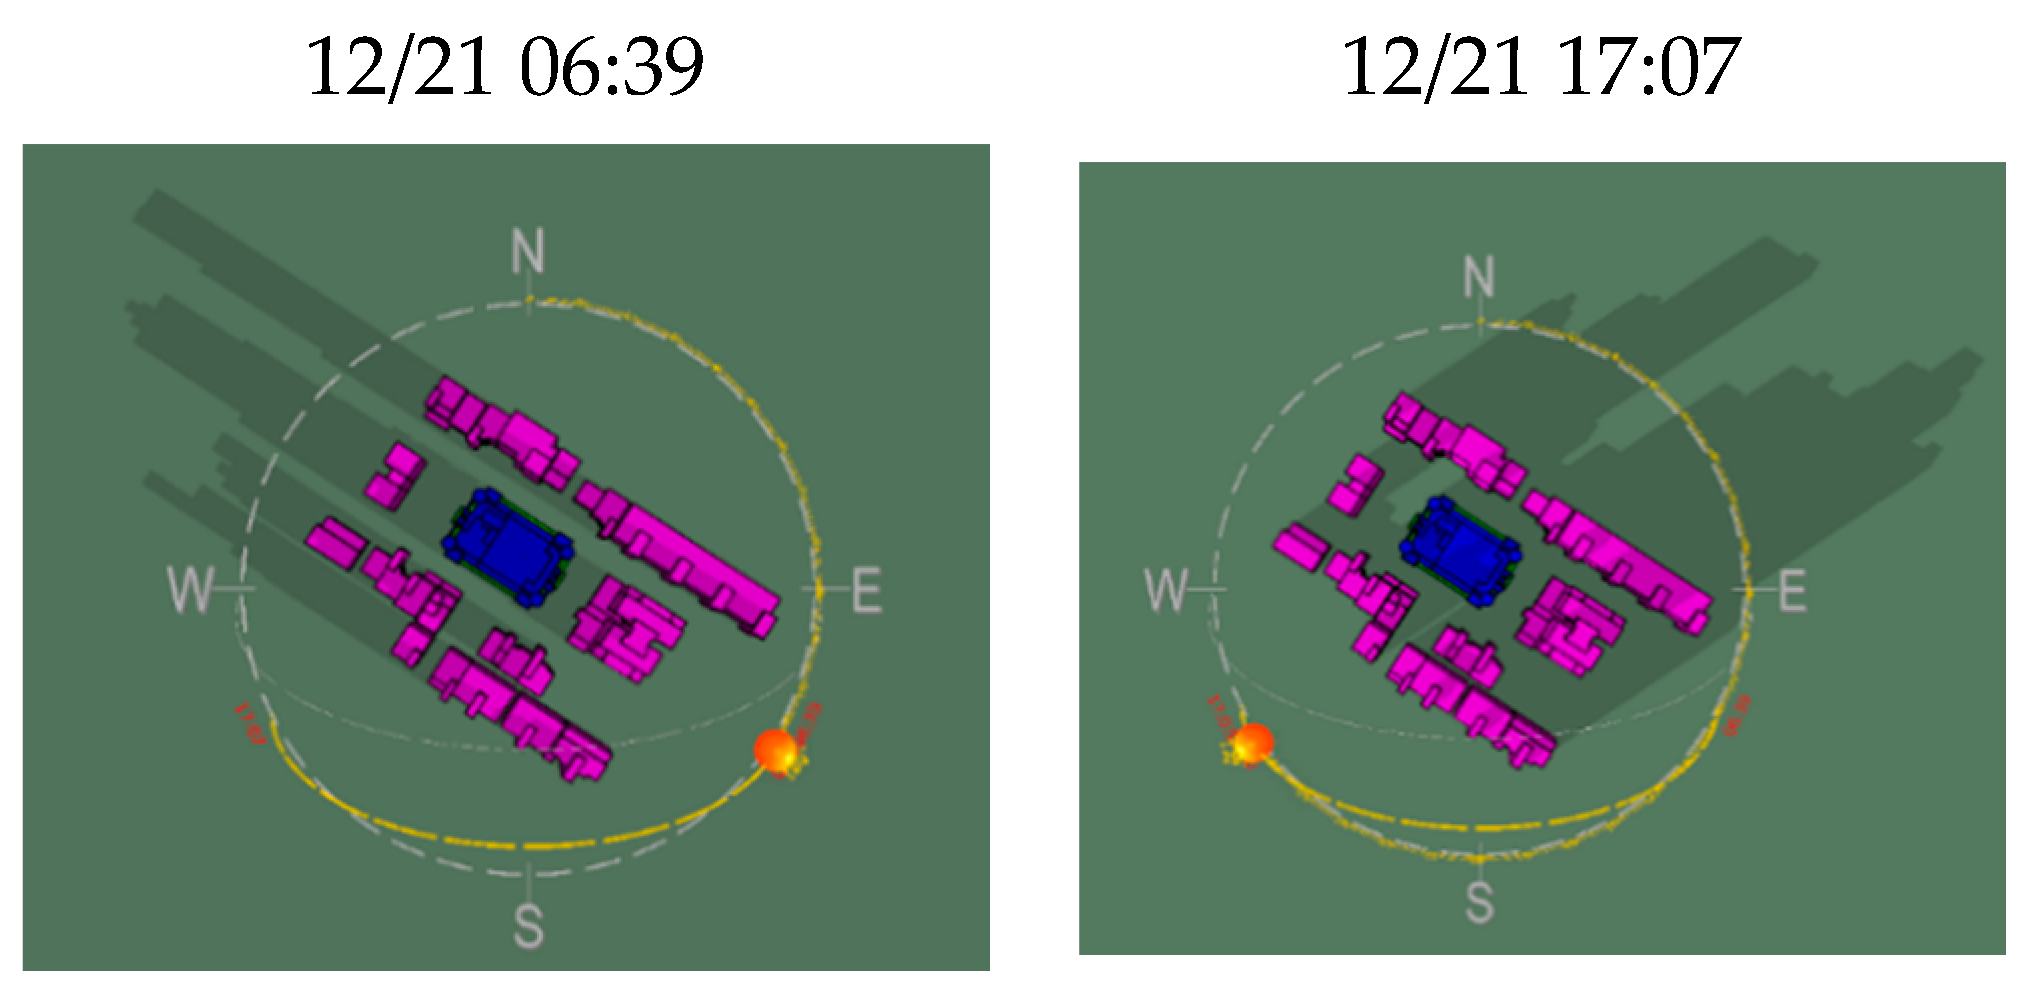
Sunlight was simulated to analyze the sunlight and shadow trajectory during winter solstice; furthermore, the sunlight trajectory during sunrise at 06:39 and sunset at 17:07 during winter solstice on 21 December were observed. The sunlight analysis revealed the azimuth that was subjected to the greatest influence by the shadow caused by sunlight on the buildings (Figure 3).
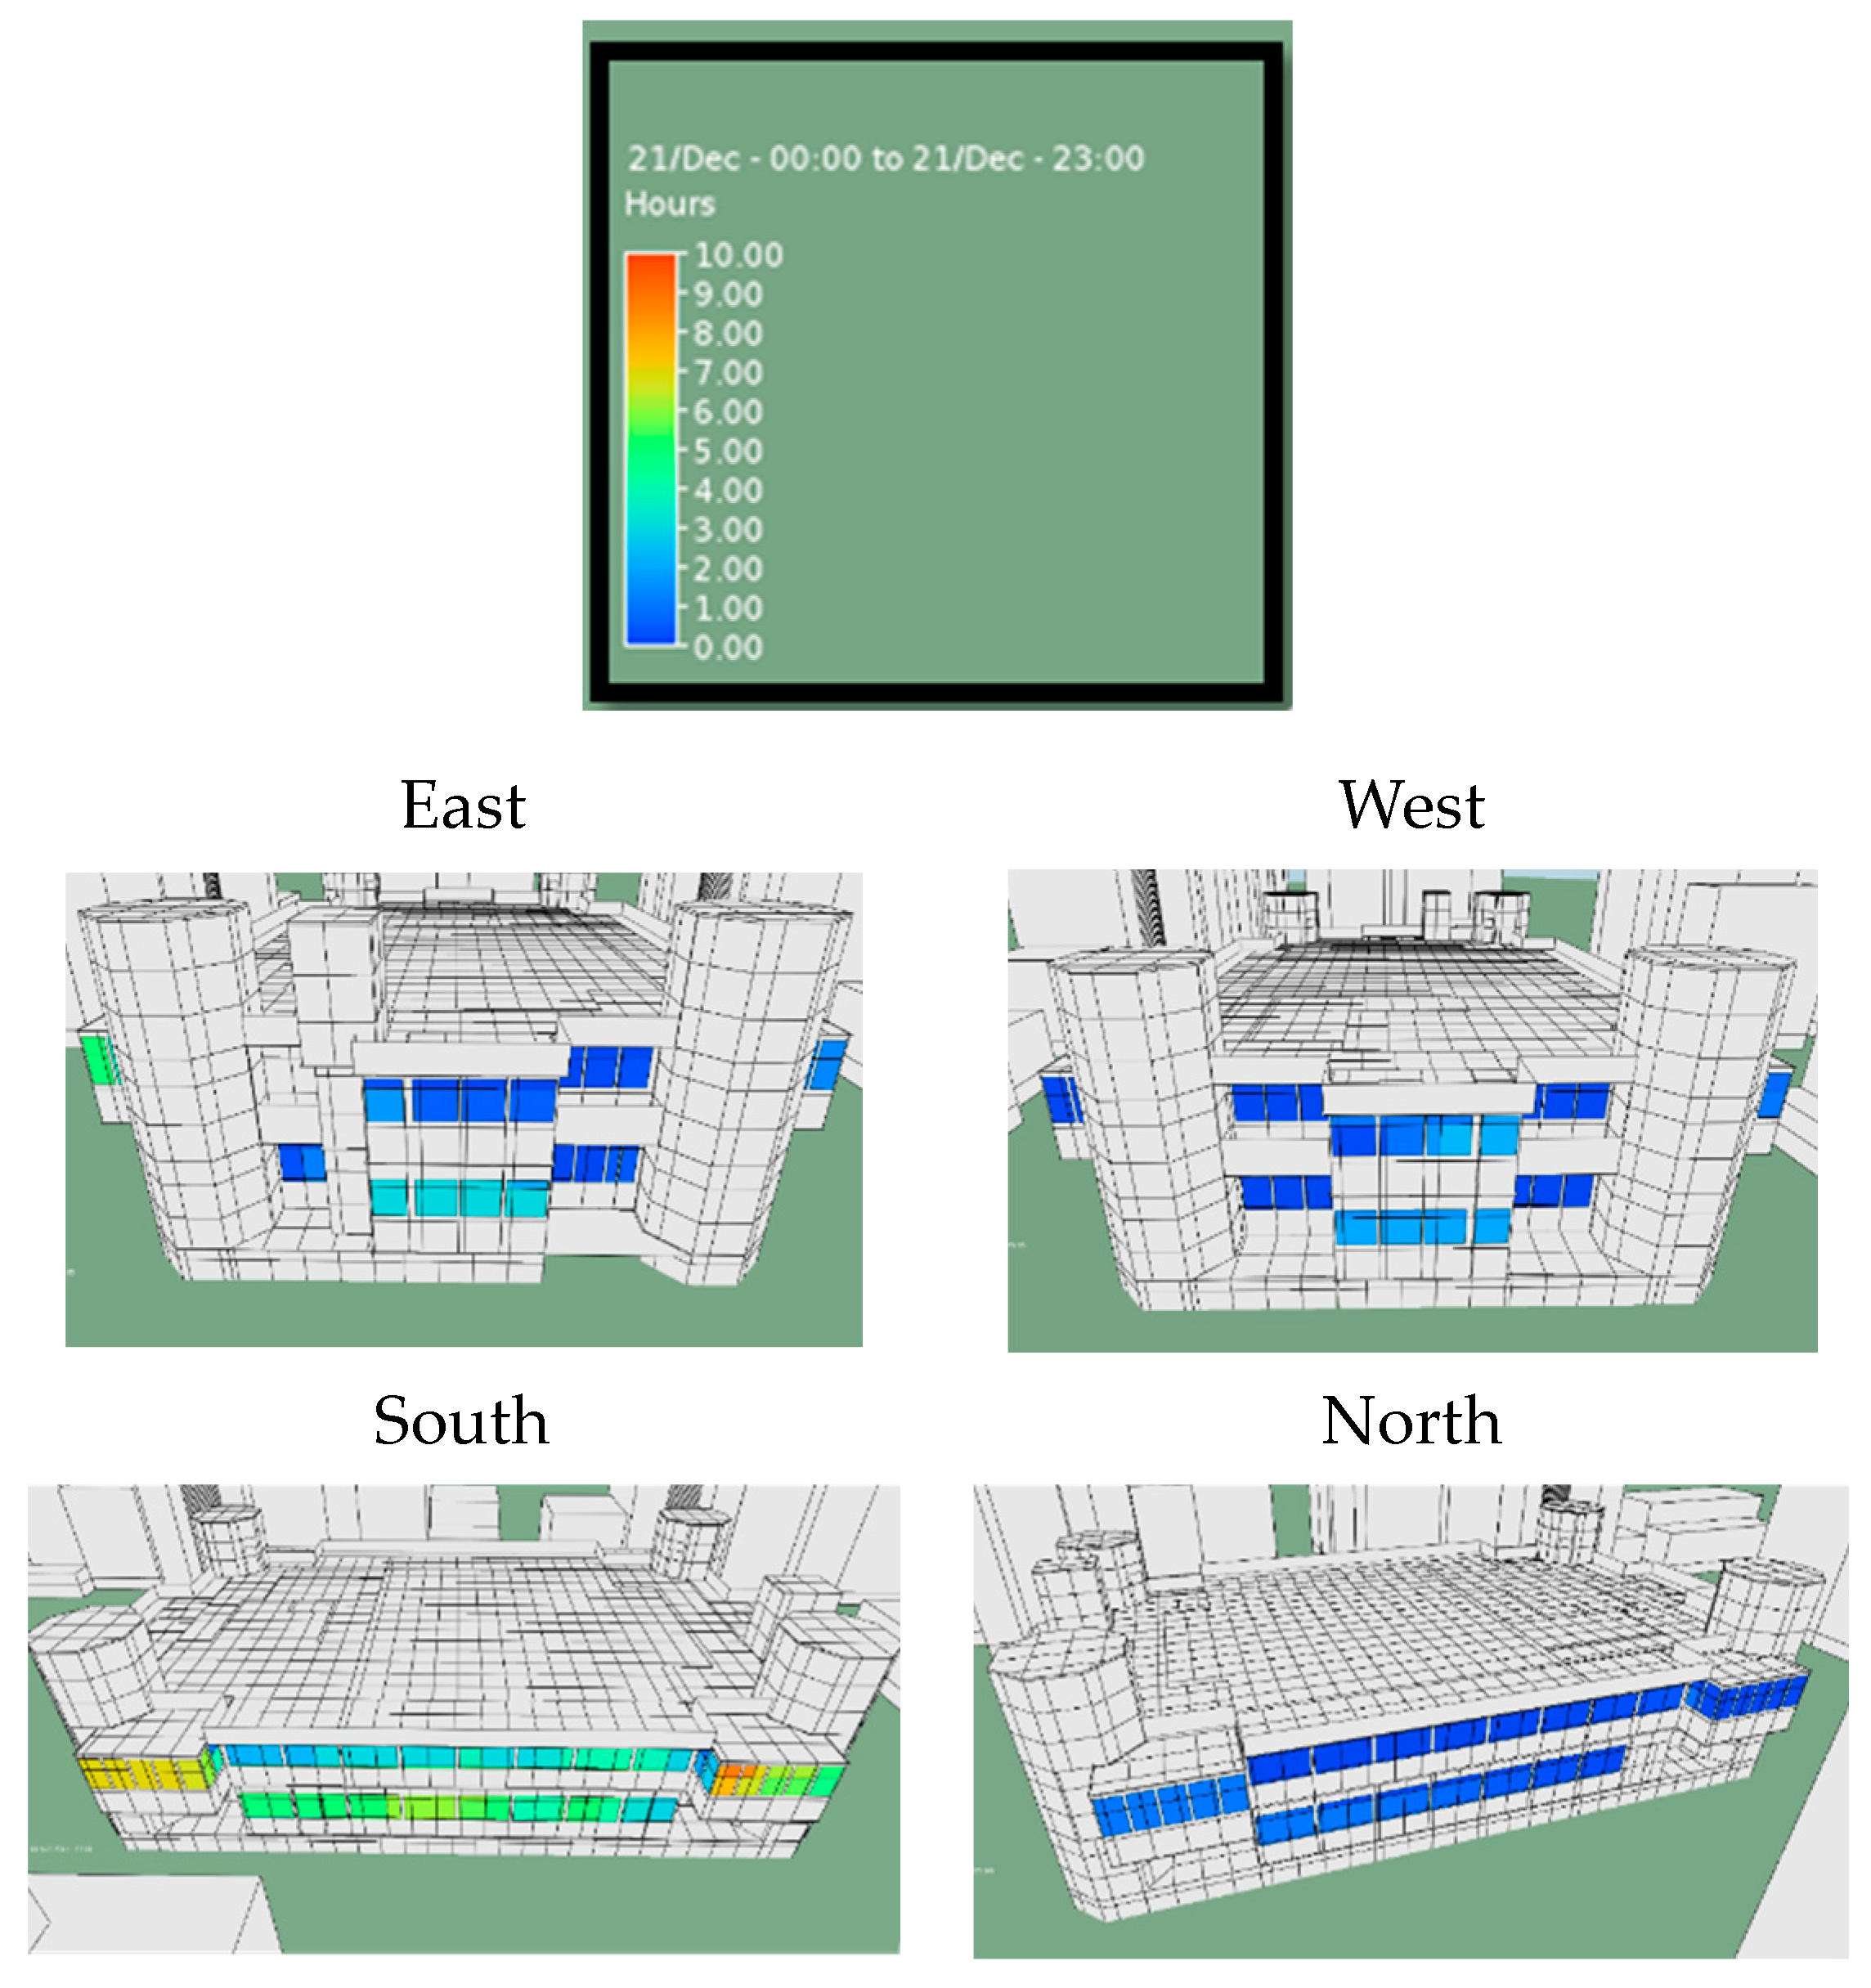
The total daylight time through the window during winter solstice was simulated to determine whether the adjacent rooms had more than 1 h of effective daylighting (Figure 4).
Figure 4 shows that only the south side of the market had sufficient daylight, whereas only a few areas in the rest of the market had more than 1 h of effective sunshine. The analysis results were used to explore the relationship of the market with its adjacent buildings, and could serve as a reference for subsequent reconstruction design.
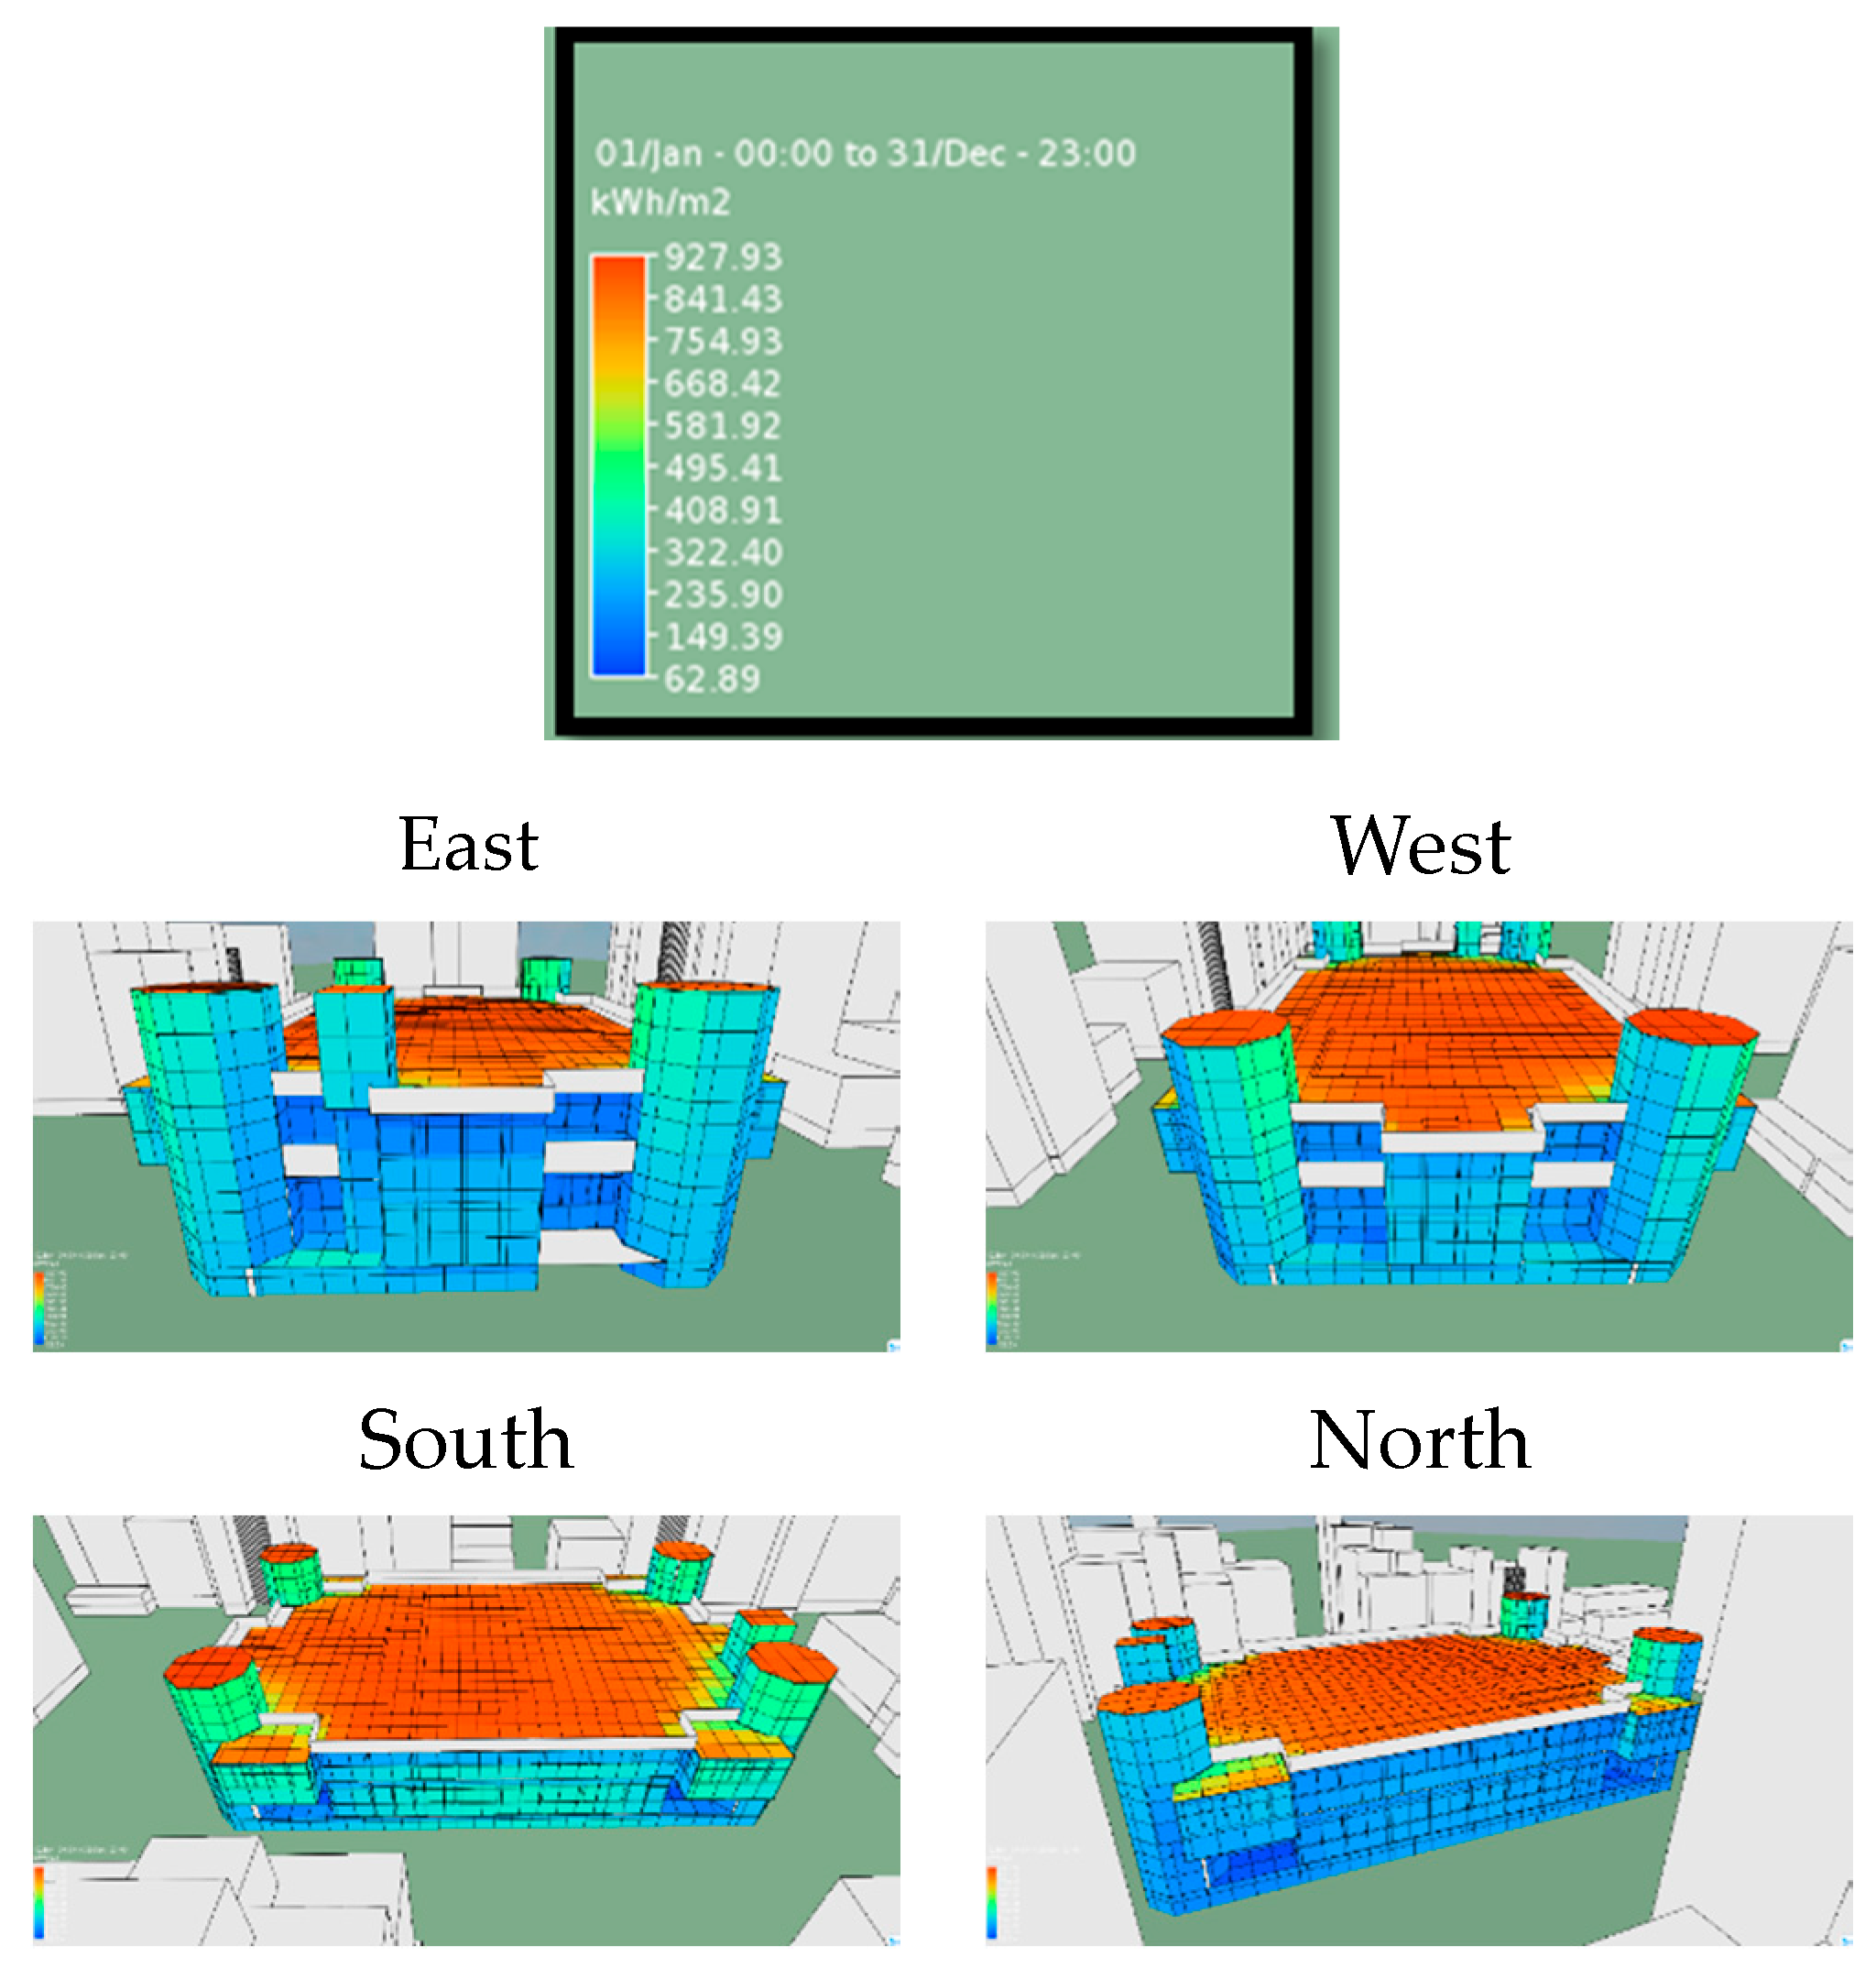
3.2.2. Solar Radiation Analysis
The longer a building is exposed to sunlight, the higher the solar radiation in its envelope. This, in turn, generates heat storage and results in increased temperatures. Accordingly, the analysis results revealed the amount of heat radiation in the envelope of the building (Figure 5).
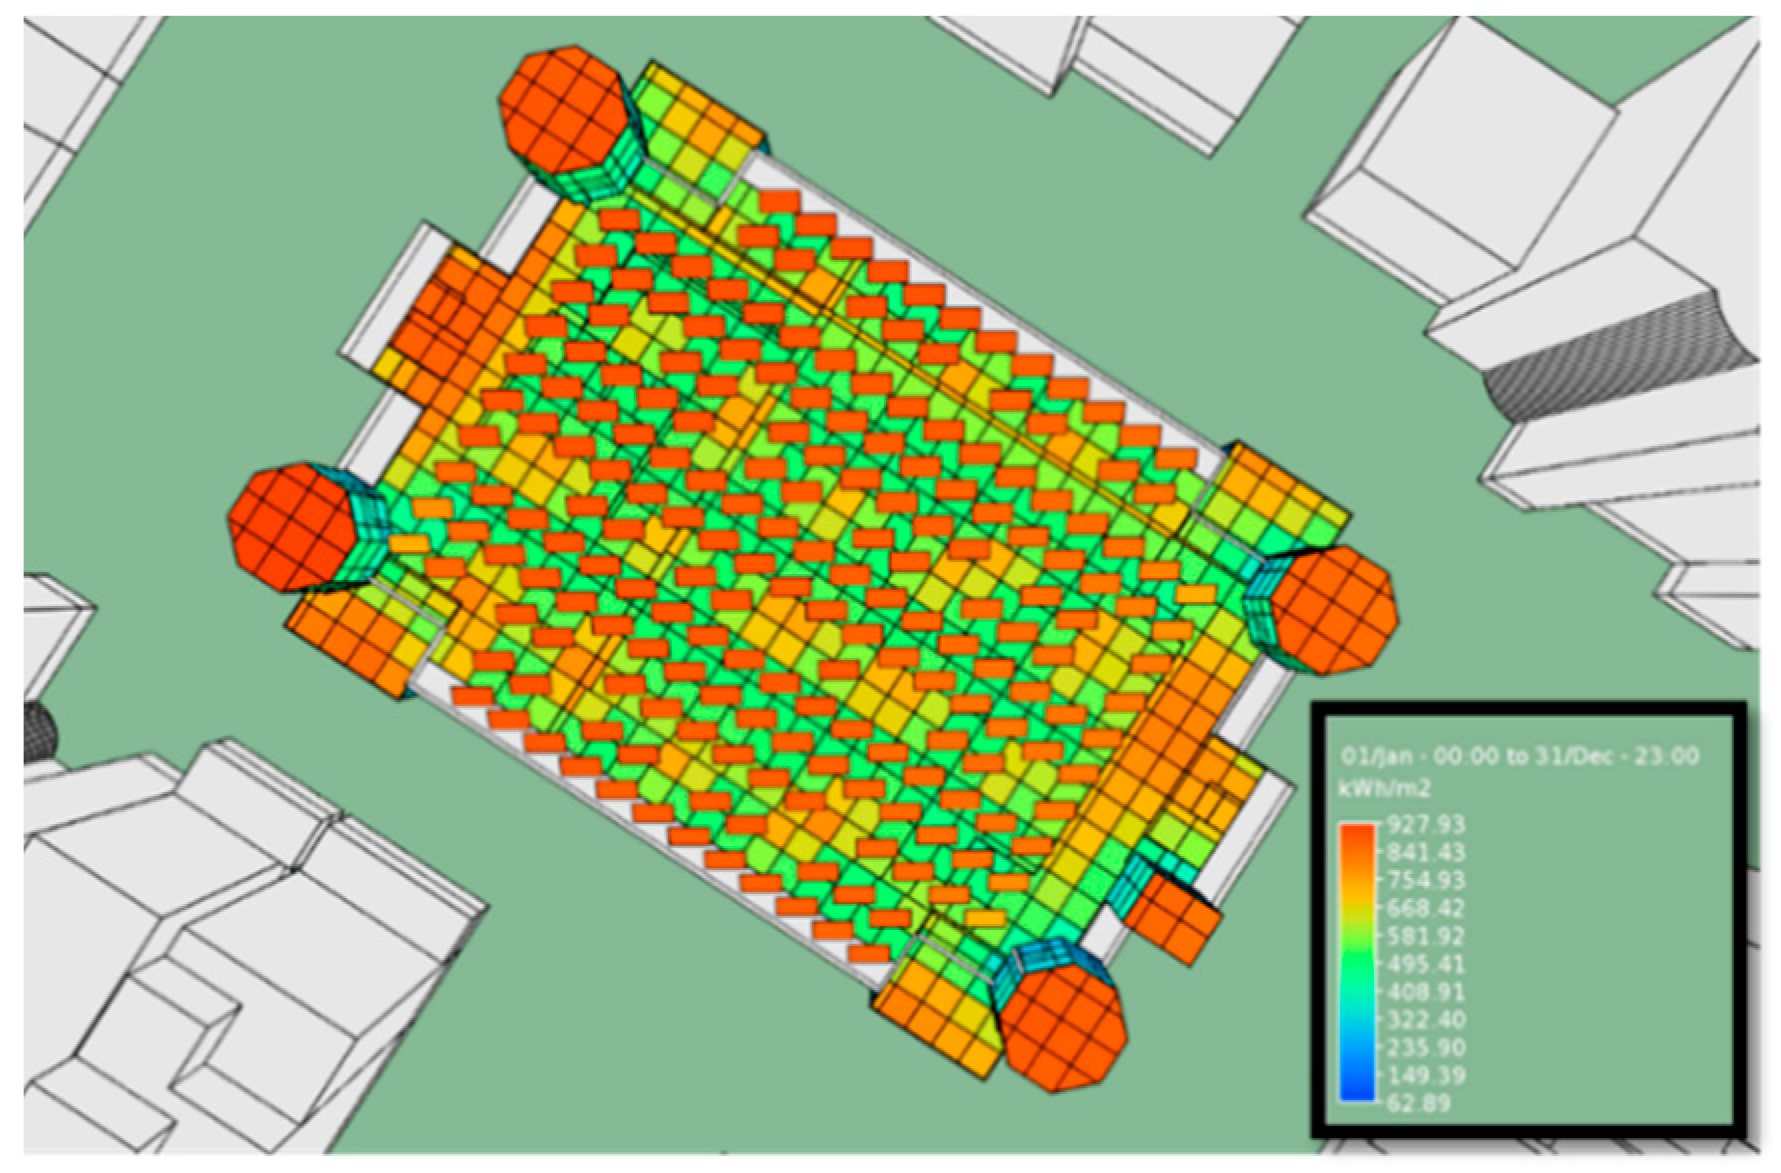
Figure 5 shows that shades on the surrounding buildings could help reduce solar radiation in various areas of the market. However, the rooftop was still susceptible to high solar radiation; thus, a PV system was installed on the market rooftop in the simulation to solve the energy consumption factor (Figure 6).
The energy generation of the installed monocrystalline solar PV panels was simulated through IES VE, the preset parameters of which were subsequently employed. Under the assumption that the rooftop space was fully utilized, 193 monocrystalline solar panels were deployed, and the simulated power generation per month was obtained (Table 7). In terms of the relationship between power generation and electricity, the measurement unit of electricity is kWh, and 1000 kWh = 1 MWh. If the generated power was converted into electricity and effectively used in the market, its energy consumption would be reduced.
Furthermore, the simulation revealed that the total solar radiation of the roof reduced by 432 kWh/m2 after the installation of the solar panels, and thus indoor heat storage was also reduced.
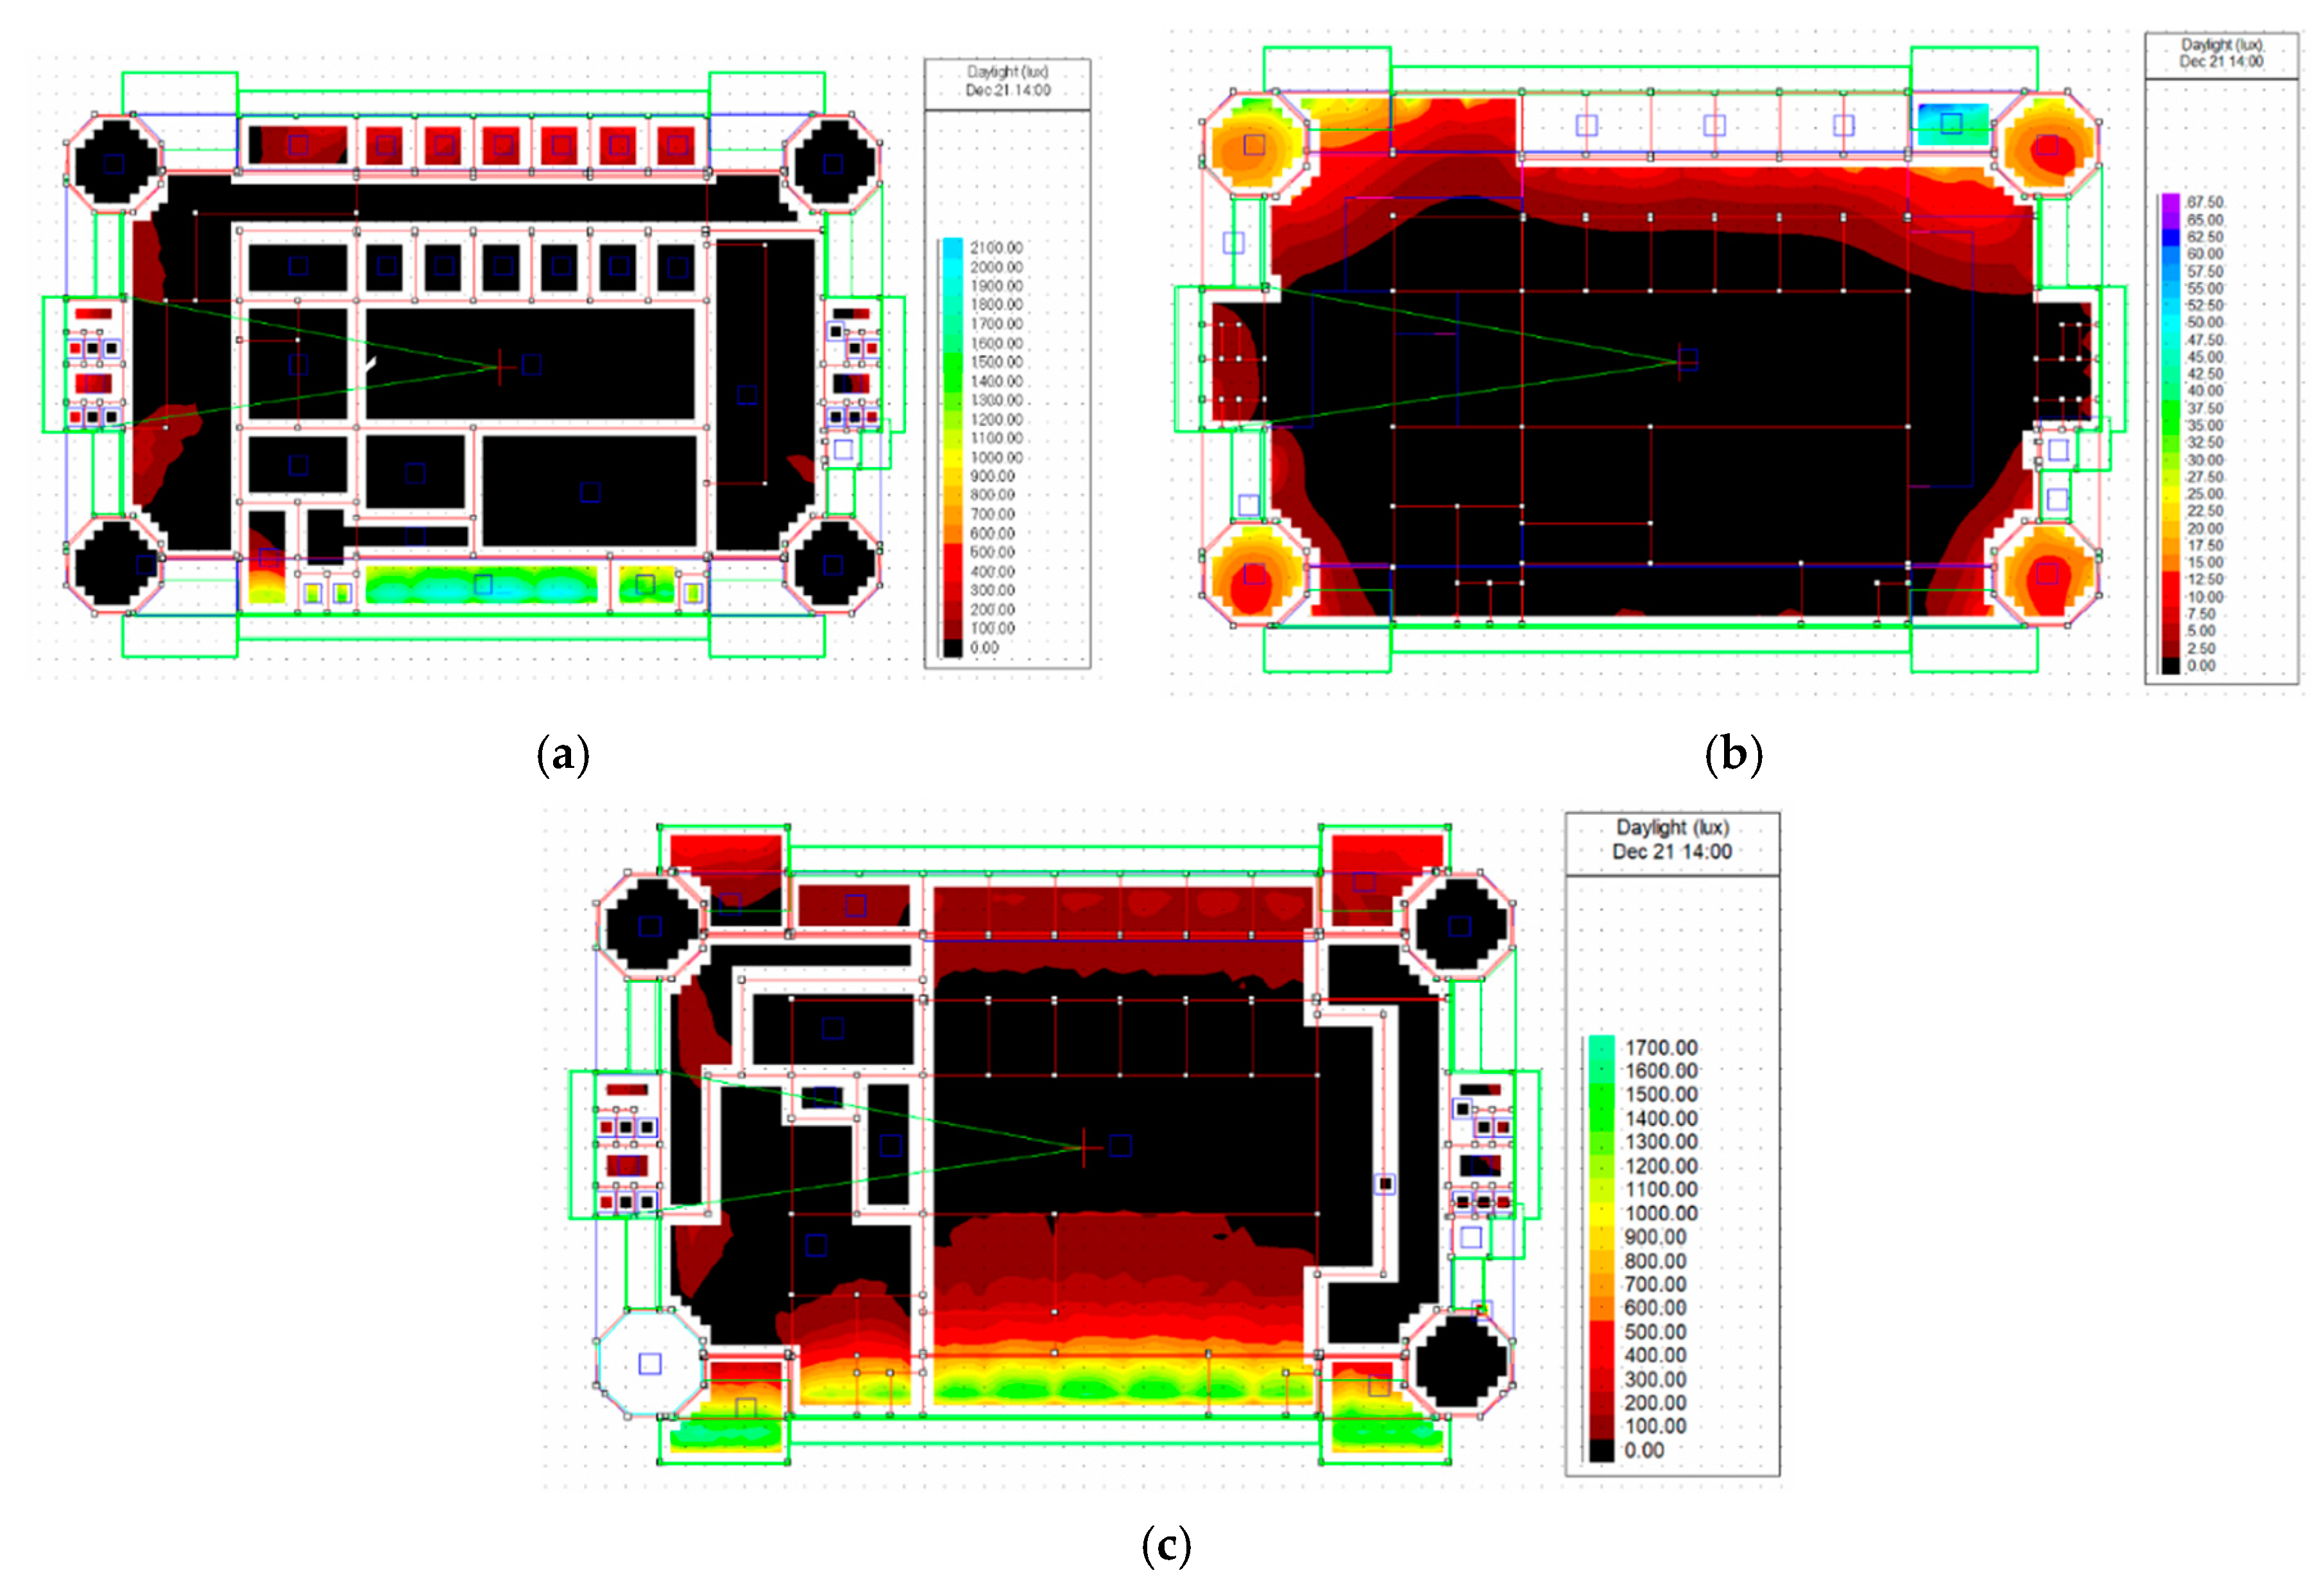
3.2.3. Indoor Natural Daylighting Analysis
The analyzation below was focused on the natural daylighting of the common space in the market (Figure 7). We intended to analyze the performance of solar illuminance at better sunshine hours, arbitrarily set at around 14:00, under the shortest sunshine condition—winter solstice.
Figure 7 demonstrates excessive illuminance at some areas near the windows, thus, this study suggested that the installation of sunshades should be considered. However, the natural daylighting within the building was insufficient and led to uneven natural daylighting, requiring artificial lighting to provide sufficient light. An onsite investigation revealed that artificial lighting equipment has been installed in the common market space; however, onsite examination of illuminance using measuring instruments (e.g., illuminance meter) was required to determine whether the artificial lighting meets the national illumination standards. Accordingly, this study provided the natural daylighting status to serve as a reference for subsequent reconstruction design.
3.2.4. Indoor and Outdoor Airflow Condition Analysis
- Outdoor airflow condition analysis
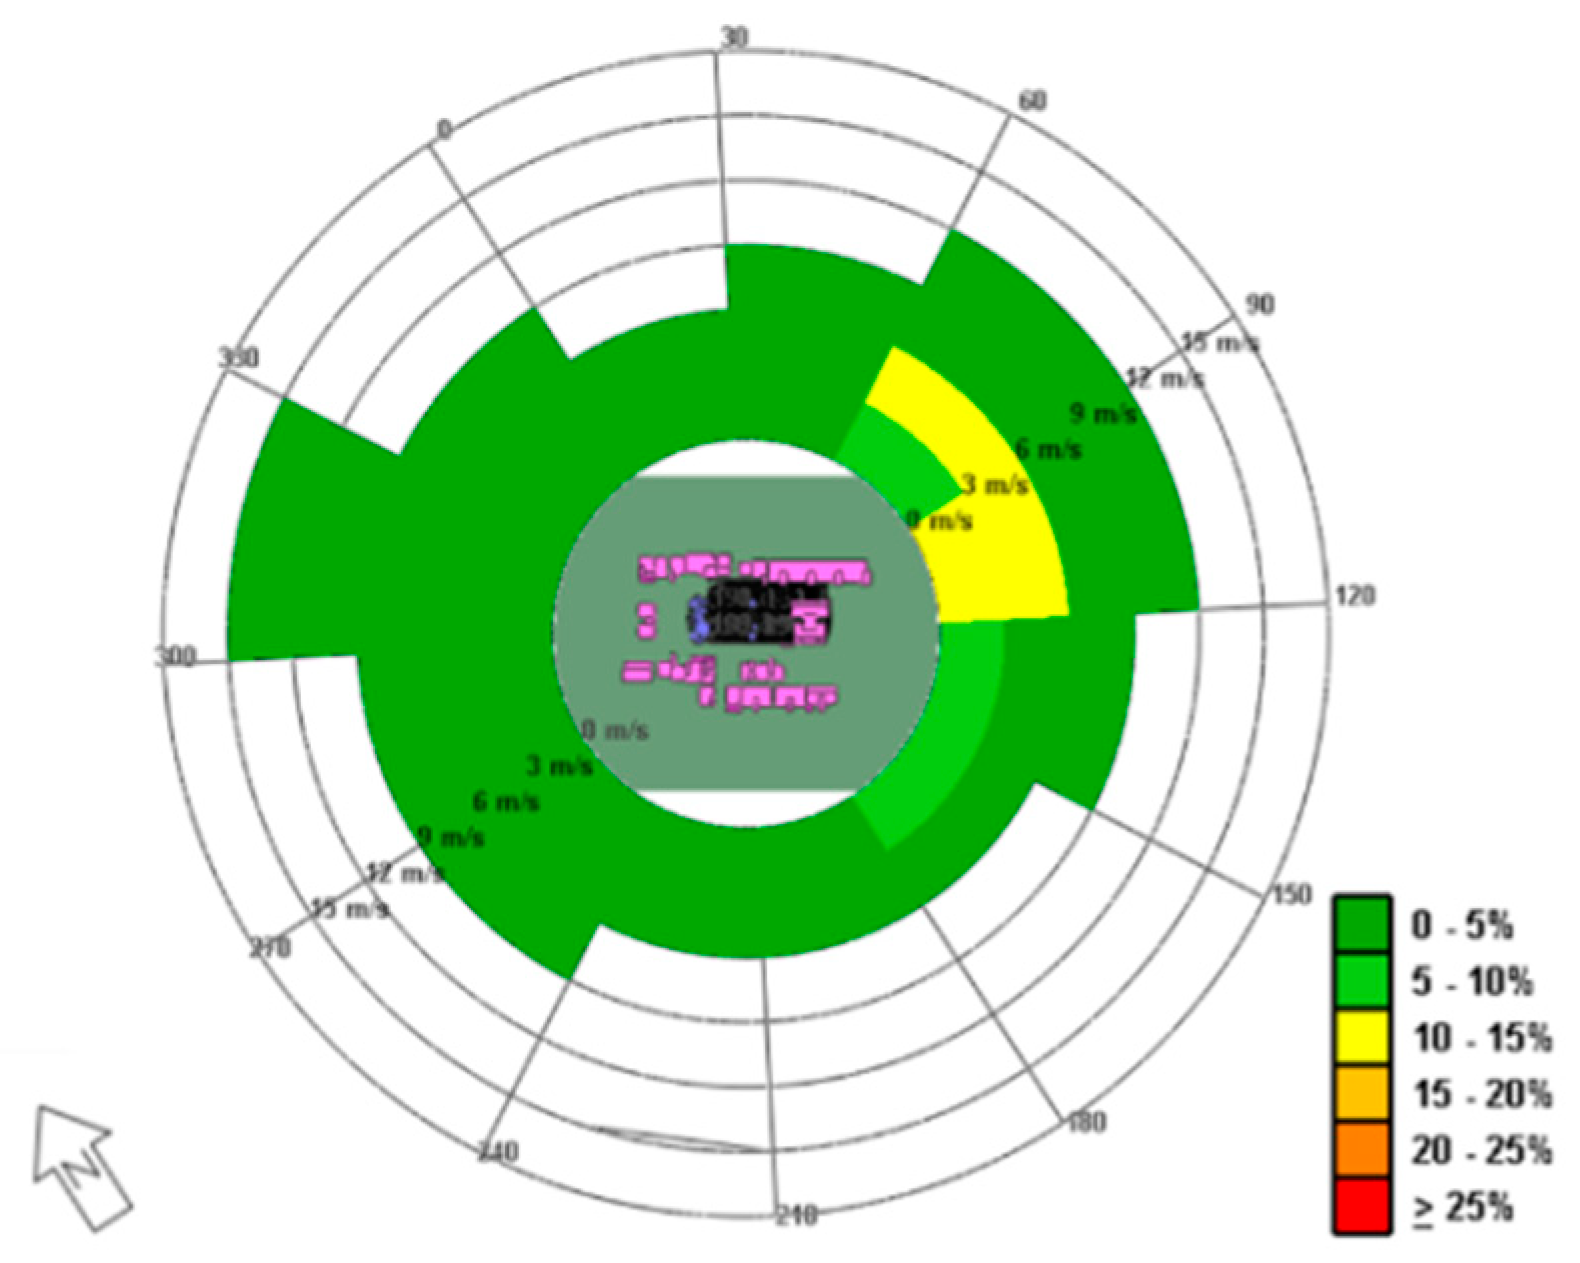
A wind rose plot illustrates the distribution of wind velocity in a specific area. In this study, the year-round wind rose plot of the market was extracted according to market’s geographical location. The average wind velocity and wind direction throughout the year can be observed based on the annual average wind rose plot in Figure 8 which serves as a reference for subsequent outdoor CFD analysis.
Furthermore, this study explored the annual wind velocity and direction, the maximum wind velocity and direction of outdoor wind in the area, and whether the pedestrian-level wind 1.5 m from the ground was less than 5 m/s.
Figure 8 shows the maximum wind velocity and wind direction in the area. The figure indicates that 10% to 15% of the wind with an average velocity of 3 m/s originates from the geographic north (90°) in a year. The outdoor airflow condition was analyzed accordingly (Figure 9).
The analysis of the velocity and direction of annual wind (Figure 9) demonstrated that wind velocity near the building is often nearly zero, and only some areas have a mild breeze. Neither a wind velocity of more than 5 m/s nor vortex flow was observed in these areas.
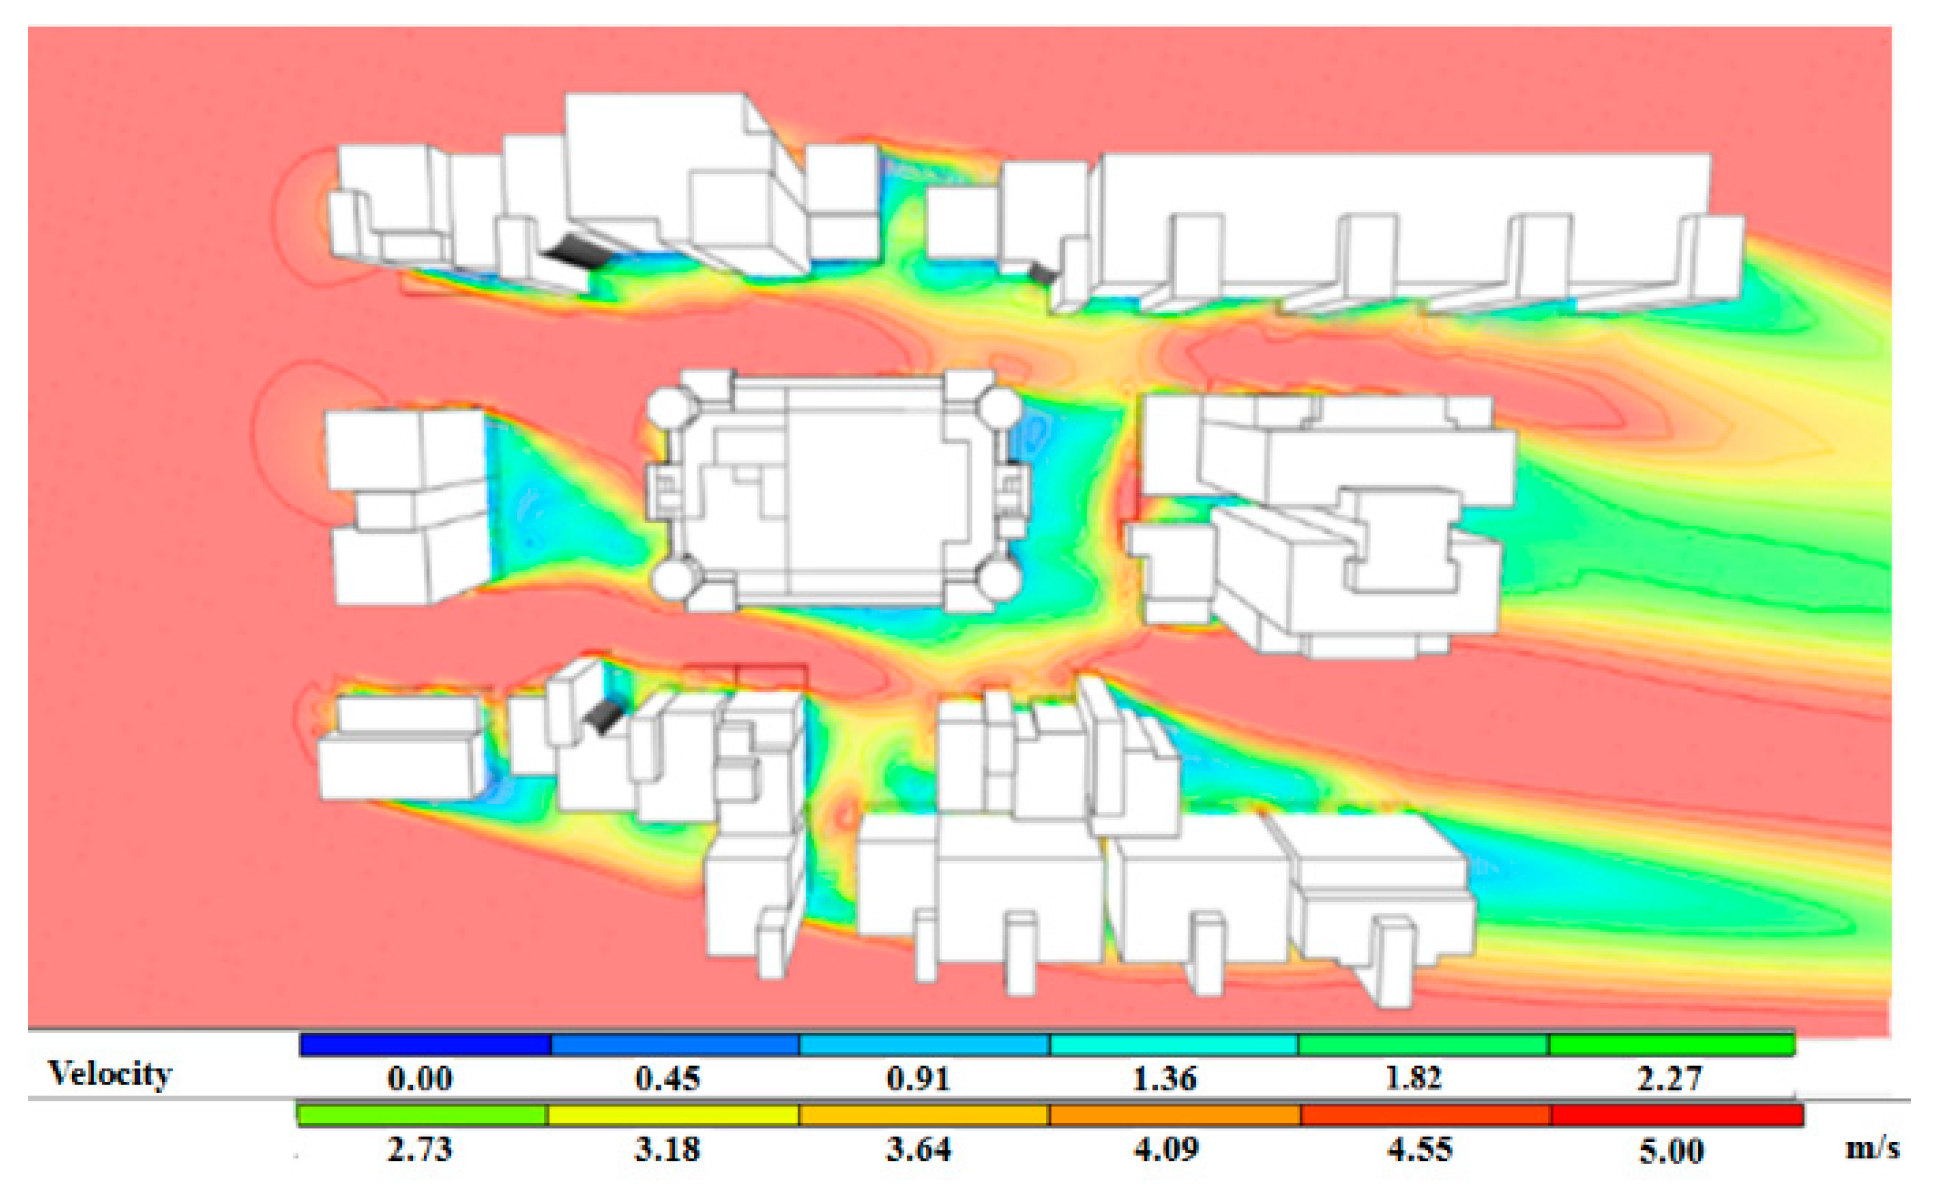
Subsequently, the maximum wind velocity and direction in the area was analyzed. According to Figure 8, wind with an average velocity of 15 m/s originates at an angle of 315° from geographic north. The outdoor airflow condition was then analyzed accordingly (Figure 10).
Based on the analysis of the maximum velocity and direction of wind (Figure 10), the wind velocity near the building mostly exceeded 5 m/s, whereas the areas shielded by buildings had a more comfortable wind velocity. However, this generated a vortex flow that caused the accumulation of pollutants. Due to the limited number of approaches to improve existing buildings, if their designs cannot be modified, windbreak facilities such as ground plants and windscreens can be installed around them to improve flow field distribution.
- 2.
- Indoor airflow condition analysis
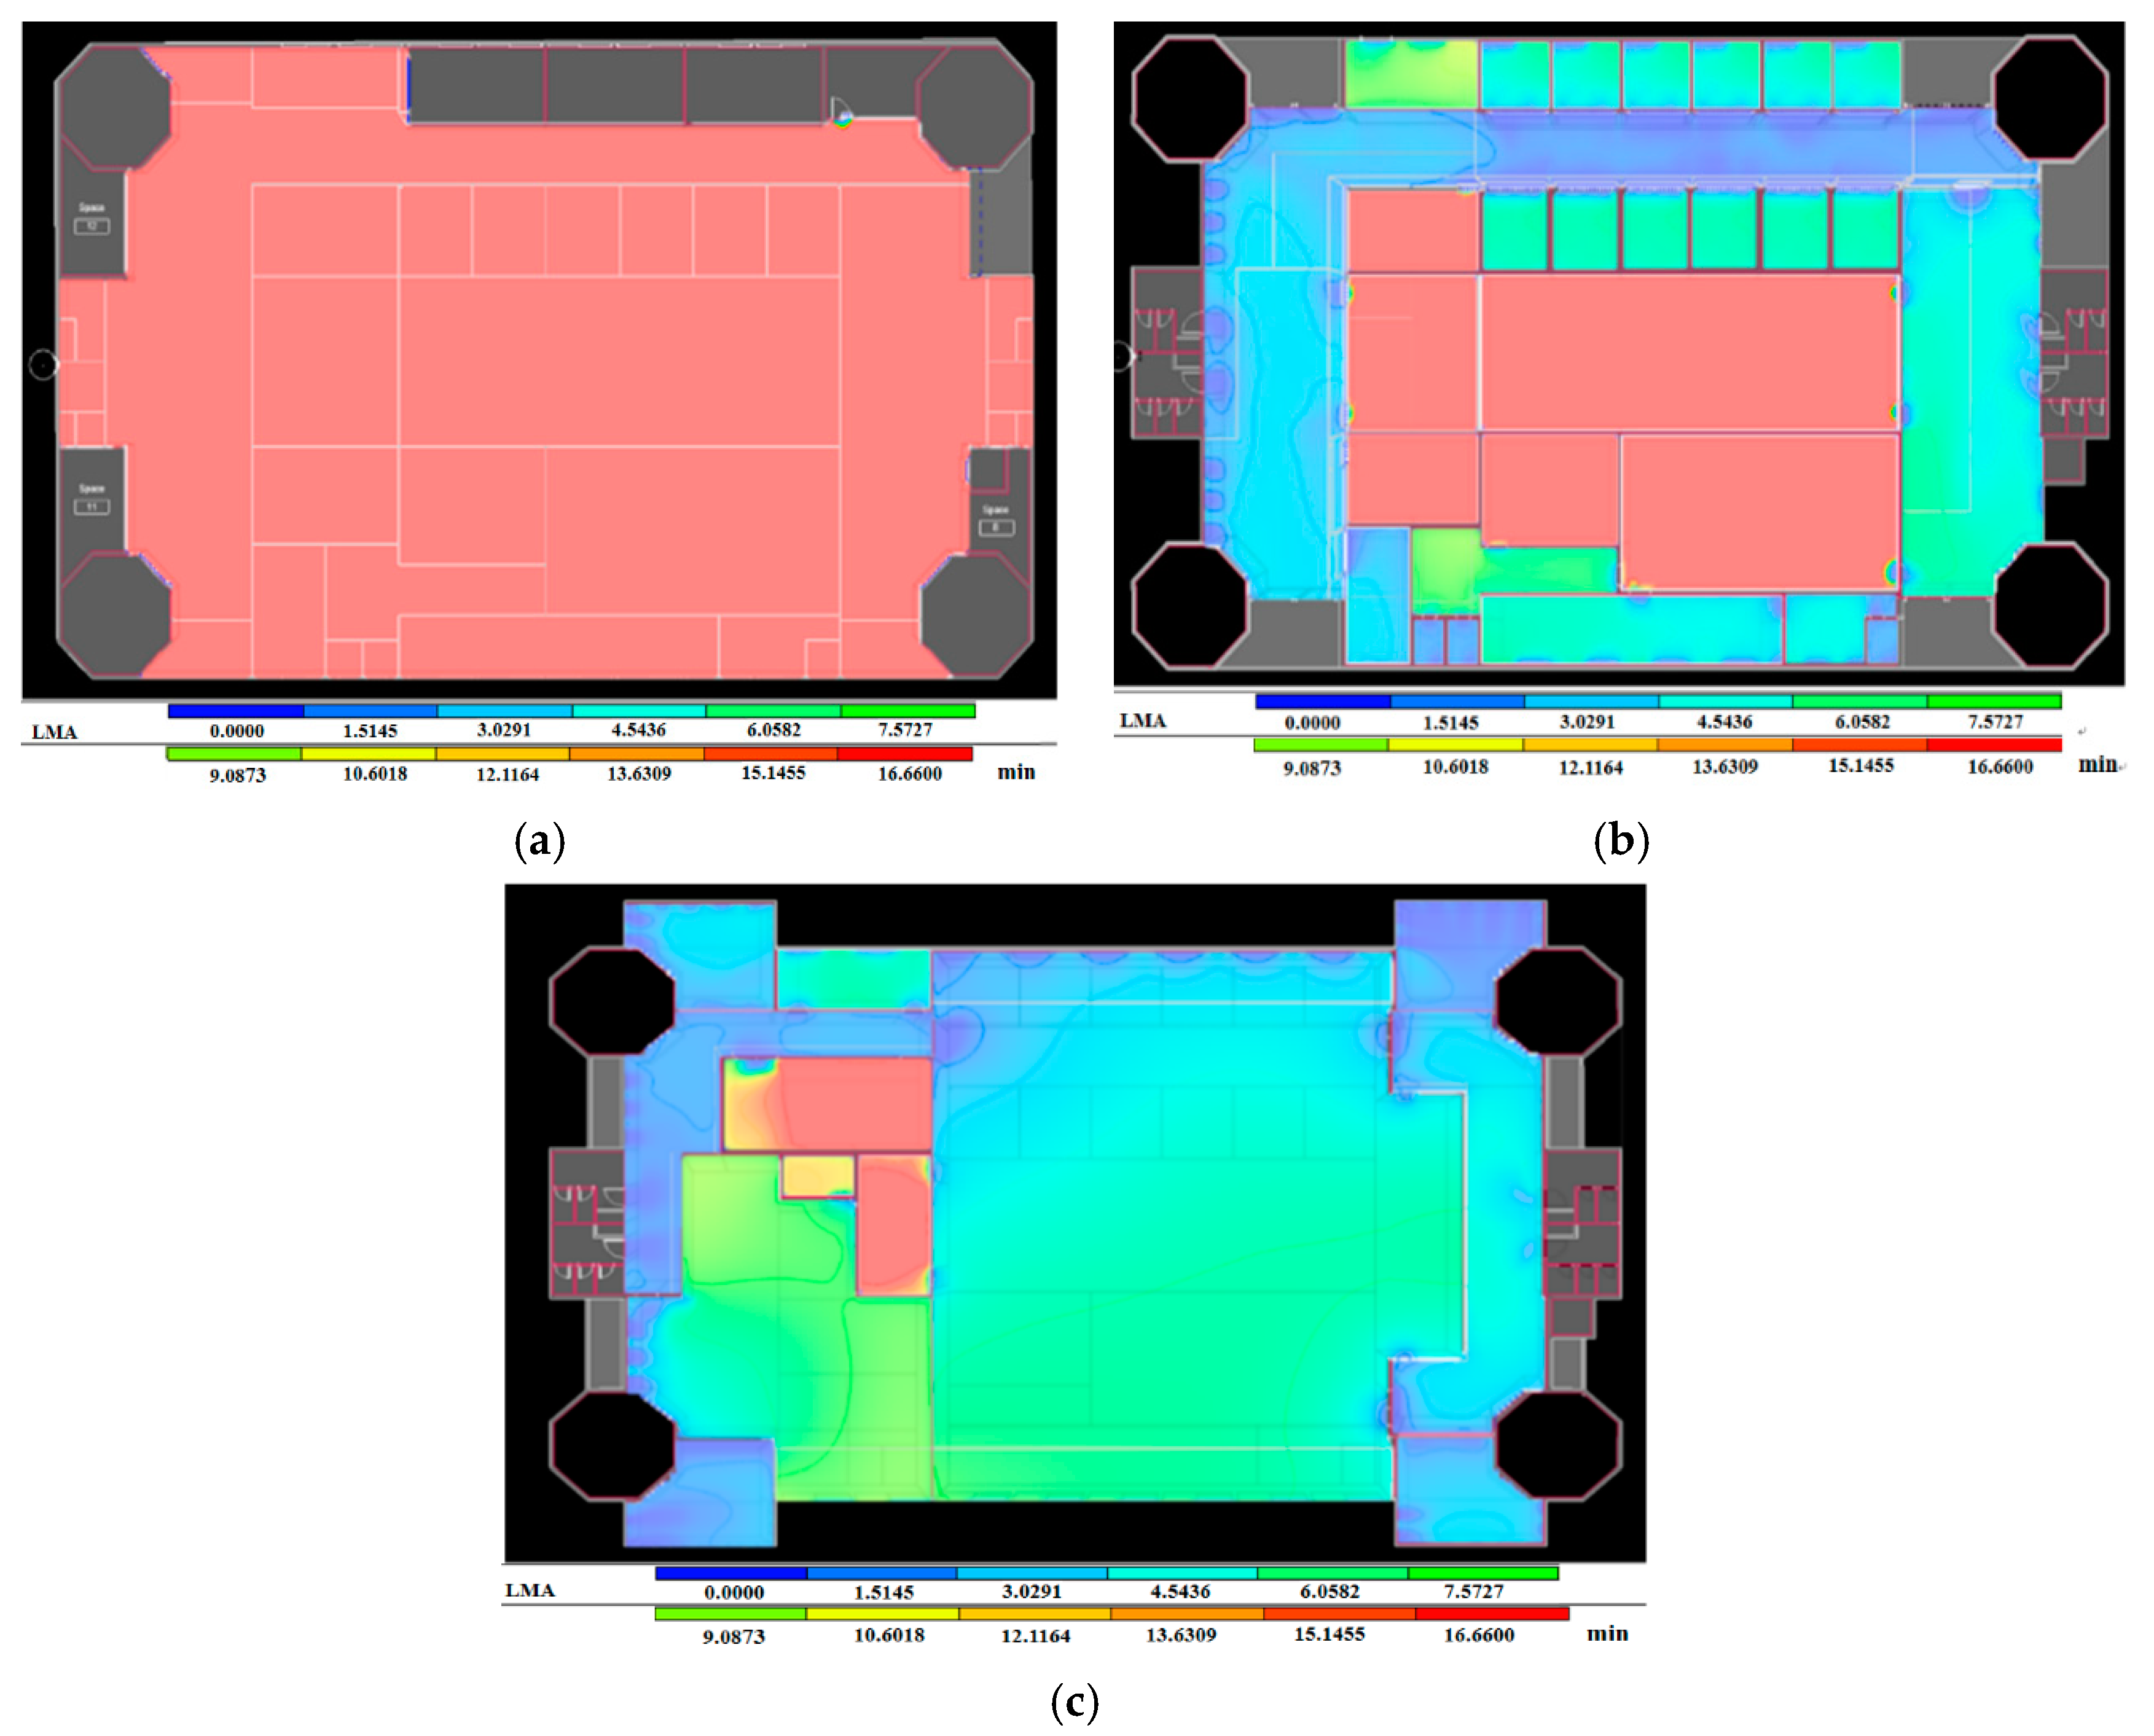
Next, the indoor wind velocity and distribution of the age of air in the market’s indoor spaces were investigated in an indoor airflow condition analysis. The analysis conditions were to turn off the indoor air-conditioning system and open all doors and windows. The indoor CFD of the outdoor annual wind with average velocity of 3 m/s originating from the geographic north as well as that with average velocity of 15 m/s originating from 315° from the geographic north were analyzed, and their indoor airflow conditions were compared.
- Indoor CFD in the presence of outdoor annual average wind:
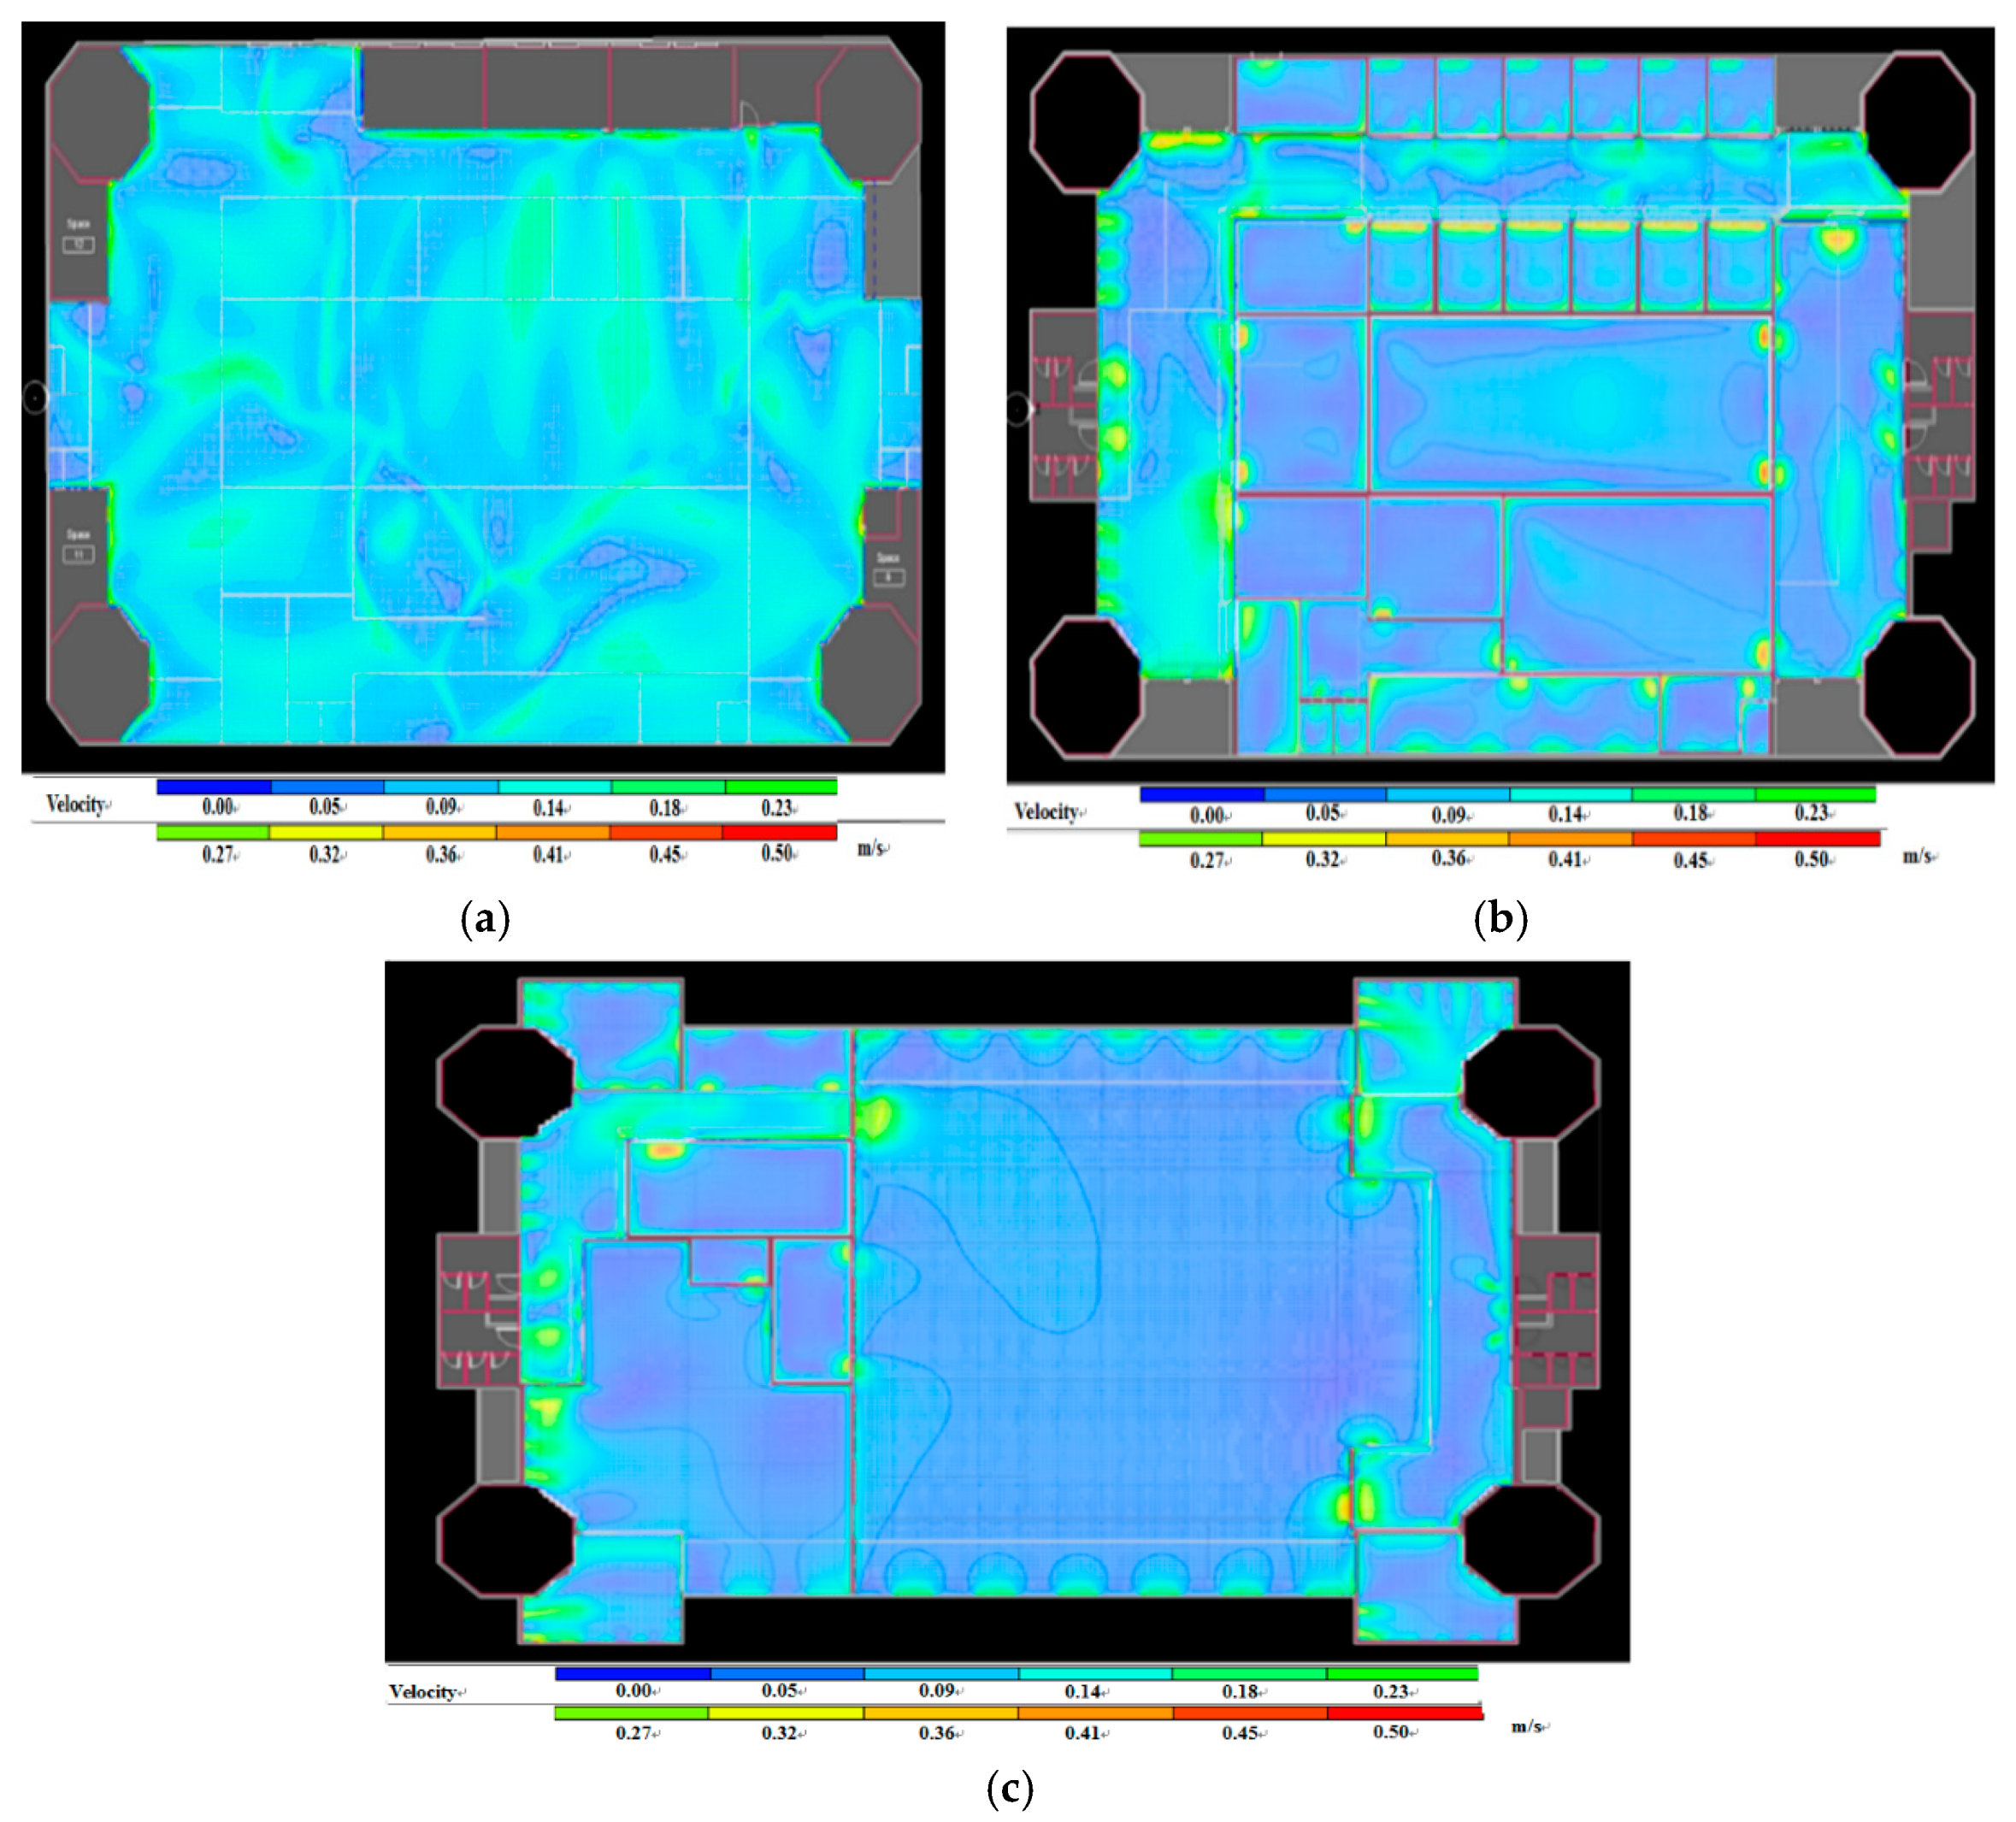
The analysis results of the indoor age of air simulation (Figure 11) showed that the red areas in the basement, first floor, and second floor spaces indicated old age and unfavorable quality of air in the presence of outdoor annual wind. More, the indoor wind velocity simulation (Figure 12) revealed that the deep blue areas in all the corresponding spaces had unfavorable air circulation, whereas the areas with other colors had more satisfactory ventilation. Overall, the results indicated that the spaces had unsatisfactory air circulation.
- Indoor CFD in the presence of outdoor wind with maximum velocity:
The simulation results are similar to the above wind with annual average.
To sum up, indoor airflow condition analysis demonstrated that in the presence of outdoor annual wind, most indoor spaces were poorly ventilated and the indoor air was retained for a long period. However, most spaces were still incapable of achieving improved ventilation in the presence of outdoor air with maximum velocity; thus, this study recommended improvement to indoor air circulation by using a mechanical ventilation approach. Appropriate ventilation equipment can be selected in subsequent reconstructions according to relevant demands.
3.2.5. PMV and PPD Analysis
The comfort levels of spaces frequented by people were determined by analyzing the spatial types of supermarkets, vendors, offices, classrooms, activity centers, and libraries, as well as the PMV and PPD during summer and winter solstices. Additionally, body comfort level during summer and winter solstices were explored under conditions of open windows and turned-off air-condition.
- 1.
- Summer solstice PMV and PPD: According to the simulation analysis results for summer solstice PMV (Figure 13), the PMV of activity spaces in the basement, on the first and second floor were between −1 and 2. The yellow and green areas within the space had relatively favorable comfort levels, whereas the remaining areas in orange had less favorable comfort levels.
According to the analysis results of the summer solstice PPD simulation (Figure 14), among the activity spaces in the basement, and on the first and second floor, supermarkets, vendors, and activity centers had mild and moderate activities, and thus, a relatively high PPD. Conversely, the remaining spaces with static activities had relatively low PPD.
- 2.
- PMV and PPD during winter solstice: the simulated plotting is neglected for paper length consideration. However, according to the analysis results of the winter solstice PMV simulation, the PMV of activity spaces was between −1 and 0. Only the activity center on the second floor had a greater PMV (close to 2) because of its high level of activity; most of the remaining spaces had a negative PMV. More, the PPD simulation shows that the supermarkets in the basement and the activity center on the second floor had relatively higher PPD, whereas the remaining spaces had relatively lower PPD. A more distinct observation was that the basement PMV was approximately 0 but its PPD was higher than that of the other spaces, which may be related to the space’s level of ventilation.
Analysis of the PMV and PPD during winter and summer solstices revealed that for the same levels of activity, the PMV was inclined toward positive values during summer solstice and negative values during winter solstice. However, the PPD during summer solstice was relatively high, yet was approximately 0 during winter solstice. The analysis results provided information on body discomfort or dissatisfaction, which can in turn be used to improve the environment and enhance people’s environmental satisfaction.
3.2.6. Analysis of the Building’s Cold Room Load
To maintain a comfortable indoor temperature for humans, the cold room load data were simulated, which represented the power that the air conditioner had to reach to maintain the indoor temperature. Xindian Central Public Retail Market is a decades-old building that uses RC structure, which is prone to heat storage, as its exterior wall material, and its windows are also normal glass without any special functions. Thus, replacing the exterior wall and window materials (four kinds of combination shown in Figure 15) can effectively reduce the energy consumption of the building’s air-conditioning system. This study used plastic steel wall boards with low thermal conductivity to reduce the generation of heat gain. Moreover, LowE glass was used as the window material to effectively block heat conduction and convection, thereby achieving the goal of energy saving.
The curves in Figure 15 represent the day-to-night energy consumption during the hottest days selected from each month using IES VE; thus, the energy consumption at the head and tail of the curves of each month is the lowest. According to Figure 15, the cool room load of the combination of RC and normal glass was significantly different from that of the plastic steel wall board plus LowE glass. Through perfecting the heat insulation of the building’s exterior casing, the air-conditioning system can achieve the required temperature without excessive energy consumption.
3.2.7. Annual Energy Consumption Analysis
The analyzed data for cold loading and weather conditions of the TMY were incorporated into the annual energy consumption for simulation analysis, which yielded the energy consumption of the building throughout the year (Figure 16).
According to Figure 16, the cold room air conditioner consumed far more energy than any other equipment. Therefore, improving this shortcoming would achieve significant energy saving.
Through adding monocrystalline solar PV panels and replacing the exterior wall and window materials based on the aforementioned optimization suggestions, this study explored the relevant effects on and differences in annual energy consumption. The following four scenarios were analyzed:
- Scenario 1: Annual energy consumption of an RC exterior wall with normal window glass (current combination).
- Scenario 2: Annual energy consumption of a plastic steel wall board with LowE window glass (exterior casing optimization).
- Scenario 3: Annual energy consumption of an RC exterior wall with normal window glass and solar PV panels (heat insulation on the rooftop and use of thermal radiation to generate renewable energy).
- Scenario 4: Annual energy consumption of a plastic steel exterior wall board with LowE window glass and solar PV panels (exterior casing optimization, heat insulation on the rooftop, and the use of thermal radiation to generate renewable energy) presents the consolidated data based on the aforementioned analysis results.
Table 8 presents the consolidated data based on the aforementioned analysis results.
A comparison of scenario 1 and 2 before and after the exterior wall optimization of the building revealed an energy consumption difference of 9.73 MWh, which was equivalent to saving 9727 units of electricity. According to Taiwan Power Company statistics, the average household uses 3636 units of electricity a year, and the electricity saved after optimizing the building’s exterior wall was adequate for nearly three households.
A comparison of item scenario 1 and 3 before and after the installation of the solar PV panels showed an energy consumption difference of 184.55 MWh, which was equivalent to 184,546 units of electricity and was sufficient for nearly 50 households. Additionally, the energy consumption in scenario 4 was further reduced by 500 units of electricity compared with the sole deployment of solar PV panels in scenario 3.
3.2.8. Analysis of Annual EUI per Unit Area
Calculating the EUI of Xindian Central Public Retail Market first required the total floor area of the market, which is 3195.08 m2. According to data from the annual energy consumption analysis, the total annual energy consumption of the building was obtained by adding the various energy consumption values of the building using an RC exterior wall and normal window glass, which yielded a sum of 887,783.40 kWh/year. Using the total floor area and total energy consumption, the EUI was calculated to be 277.86 kWh/m2·year.
Xindian Central Public Retail Market is a complex building containing spaces such as supermarkets, hypermarkets, and offices. According to the EUI statistic data in the Technical Manual for Building Energy Conservation Application by the Taiwan’s Bureau of Energy [45], the average and maximum EUI values of a hypermarket are 218.20 kWh/m2·year and 301.80 kWh/m2·year, respectively. In this study, the EUI of retail stores was selected as the comparison standard based on the type of market. The EUI of Xindian Central Public Retail Market exceeds the average EUI of a hypermarket by 59.66 kWh/m2·year, namely 27% higher than the average value, but still falls within the maximum EUI range of retail stores. Accordingly, the current power consumption level can be determined and further improved through calculating and comparing EUI values in retrofitting.
4. Results and Discussion
- Consolidation of the analysis results
Table 9 consolidates the analysis results. Optimization plans were not available to all items because of the constraints of existing environmental conditions, and only analytical evaluations are provided for the reference of subsequent research. Meanwhile, Xindian Central Public Retail Market faces the problem of insufficient daylighting because sunlight is unable to penetrate indoors, resulting in uneven daylight distribution in the market. However, the installation of artificial lighting equipment will lead to another problem, namely greater energy consumption. Therefore, the energy consumption analysis of green buildings is not affected by a single factor but a series of interlocking ones.
- 2.
- Limitations of the meteorological data
The weather stations used in this study were not the closest ones to Xindian Central Public Retail Market. Additionally, because of the difficulty of acquiring meteorological data and limited meteorological data formats accepted by the software selected for this study, the TMY3 of the Taipei Weather Station was chosen as the meteorological data for this study because it is relatively new public meteorological data.
- 3.
- Limitations of the optimization plans
Due to the limitations of the existing environment (e.g., sunlight, natural daylighting, and outdoor airflow conditions), shielding provided by surrounding buildings, indoor layout distribution, orientations and relative positions of the analyzed building and its surrounding buildings, and other uncontrollable factors, optimization plans could not be provided for all nine analyzed items, and only analytical evaluations are provided.
The optimization plans used were also limited to the simulation that could be analyzed by the software. Such optimization analyses were provided by software in the past without changing the structure, layout, and equipment of buildings. Based on the market’s original uses, suggestions were proposed through adopting optimization plans with methods that are easily available and immediately effective.
5. Conclusions
This study used green BIM model to explore the energy efficiency performance and comfort level of the Xiedian Central Public Market; the market was located around the old-building neighborhood and had maintained an important part of the local residents’ daily life. The green BIM analysis in this study contained the evaluation and simulation of nine items, including building sunlight, solar radiation, natural daylighting, indoor and outdoor air flow conditions, PMV, PPD, building cooling load, and EUI. Subsequently, the optimization plans were proposed for several analyzed items.
According to the results of the green BIM analysis, the cold room air conditioner consumed far more energy than the other equipment. Therefore, improving this shortcoming would achieve significant energy saving. The analysis revealed that reducing the energy consumption of the building’s envelope through improving the heat insulation of the rooftop (e.g., adding monocrystalline solar PV panels) and exterior walls yielded the greatest efficiency. The market’s annual energy consumption before and after the improvement was 526.51 and 341.43 MWh, respectively, yielding about 35% greater energy efficiency. For people’s environmental satisfaction and comfort, analysis of the PMV and PPD revealed that at the same levels of activity, the PMV was inclined toward positive values during summer solstice and negative values during winter solstice. Mostly, the PMV was between the value of −1 and +2 (meaning slightly cool and warm). However, the PPD during summer solstice was relatively high, yet it was approximately 0 during winter solstice, indicating that people were more uncomfortable when it was hot in this old traditional market. Moreover, the results also showed problems of poor ventilation and insufficient sunlight inside the market, and the energy consumption per unit area EUI was 27% higher than the average value, leaving considerable room for improvement. This research facilitates understanding the old market’s current problems; the design content can be adjusted according to the analysis results if subsequent reconstruction or retrofit is planned. The introduction and application of green BIM approach will give us a better chance to promote the comfort level of human environment, and facilitate the accomplishment of sustainable architecture.
Finally, for future research, the specific green certification and assessment system, such as LEED or EEWH, can be applied to the market to conduct deep quantitative and overall evaluations in waste reduction, water resource use, sewage and garbage improvement and even biodiversity indicators. Furthermore, the advanced, comprehensive, and complicated analysis such as hourly calculations on natural daylighting and so on, can be simulated for acquiring more beneficial information in energy consumption and corresponding improvement strategies.
Author Contributions
Conceptualization, P.-H.L.; methodology, P.-H.L.; validation, P.-H.L. and Y.-H.L.; investigation, Y.-H.L. and W.-L.L.; resources, P.-H.L. and C.-C.C.; data curation, P.-H.L., C.-C.C. and Y.-H.L.; writing- preparation, P.-H.L. and Y.-H.L.; writing-review and editing, P.-H.L.; visualization, P.-H.L., Y.-H.L. and W.-L.L.; supervision, P.-H.L.; project administration, P.-H.L.; funding acquisition, P.-H.L. and C.-C.C.
Funding
This research was supported and funded by Central Region Office, Ministry of Economic Affairs, Taiwan, grant number 106-01-07.
Conflicts of Interest
The authors declare no conflicts of interest.
References
- Furr, J.E.; Kibert, N.C.; Mayer, J.T.; Sentman, S.D. Green Building and Sustainable Development: The Practical Legal Guide, 1st ed.; American Bar Association: Chicago, IL, USA, 2009. [Google Scholar]
- Lin, H.T. Evaluation System and Indicators of Green Building Communities: Evaluation Indicator System of “Ecological Community”; Research Project Report for the Architecture and Building Research Institute; Ministry of the Interior: Taipei, Taiwan, 1997.
- Ministry of Interior. Green Building Evaluation Manual: Overseas version, 1st ed.; Ministry of Interior: Taipei, Taiwan, 2017.
- Indoor Environmental Quality and LEED v4. Available online: https://www.usgbc.org/articles/indoor-environmental-quality-and-leed-v4 (accessed on 12 October 2018).
- Lu, Y.; Wu, Z.; Chang, R.; Li, Y. Building Information Modeling (BIM) for green buildings: A critical review and future directions. Autom. Constr. 2017, 83, 134–148. [Google Scholar] [CrossRef]
- Akcamete, A.; Akinci, B.; Garrett, J.H. Potential Utilization of Building Information Models for Planning Maintenance Activities. In Proceedings of the International Conference on Computing in Civil and Building Engineering, East Midlands Conference Centre, Nottingham, UK, 30 June–2 July 2010; pp. 151–157. [Google Scholar]
- Becerik-Gerber, B.; Jazizadeh, F.; Li, N.; Calis, G. Application areas and data requirements for BIM-enabled facilities management. Constr. Eng. 2012, 138, 431–442. [Google Scholar] [CrossRef]
- Teicholz, P. (Ed.) BIM for Facility Managers, 1st ed.; John Wiley & Sons: Hoboken, NJ, USA, 2013. [Google Scholar]
- Eastman, C.; Teicholz, P.; Sacks, R.; Liston, K. BIM Handbook: A Guide to Building Information Modeling for Owners, Managers, Designers, Engineers and Contractors, 1st ed.; John Wiley & Sons: Hoboken, NJ, USA, 2011. [Google Scholar]
- Zou, Z.; Wang, Y. Framework of Spatial Decision Support System for Large-Scale Public Building Evacuation. In Proceedings of the WRI Global Congress on Intelligent Systems, Washington, DC, USA, 19–21 May 2009; pp. 352–356. [Google Scholar]
- Jung, Y.; Joo, M. Building Information Modelling (BIM) Framework for Practical Implementation. Autom. Constr. 2011, 20, 126–133. [Google Scholar] [CrossRef]
- Howard, J.L. The Federal Commitment to Green Building: Experiences and Expectations, 1st ed.; Office of The Federal Environmental Executive: Washington, DC, USA, 2003.
- McLennan, J.F. The Philosophy of Sustainable Design: The Future of Architecture, 1st ed.; Ecotone Publishing: Seattle, WA, USA, 2004. [Google Scholar]
- Kibert, C.J. Sustainable Construction: Green Building Design and Delivery, 1st ed.; John Wiley & Sons: Hoboken, NJ, USA, 2012. [Google Scholar]
- Krygiel, E.; Nies, B. Green BIM: Successful Sustainable Design with Building Information Modeling, 1st ed.; Wiley Publishing: Indianapolis, IN, USA, 2008. [Google Scholar]
- McGraw-Hill Construction. Green BIM: How Building Information Modelling is Contributing to Green Design and Construction: SmartMarket Report, 1st ed.; McGraw-Hill Construction: New York, NY, USA, 2010. [Google Scholar]
- Wong, J.K.W.; Zhou, J. Enhancing environmental sustainability over building life cycles through green BIM: A review. Autom. Constr. 2015, 57, 156–165. [Google Scholar] [CrossRef]
- Wong, K.-D.; Fan, Q. Building information modelling (BIM) for sustainable building design. Facilities 2013, 31, 138–157. [Google Scholar] [CrossRef]
- Schlueter, A.; Thesseling, F. Building information model based energy/exergy performance assessment in early design stages. Autom. Constr. 2009, 18, 153–163. [Google Scholar] [CrossRef]
- Shrivastava, S.; Chini, A. Using building information modeling to assess the initial embodied energy of a building. Int. J. Constr. Manag. 2012, 12, 51–63. [Google Scholar] [CrossRef]
- Kim, H.; Anderson, K. Energy modeling system using building information modeling open standards. J. Comput. Civ. Eng. 2012, 27, 203–211. [Google Scholar] [CrossRef]
- Schade, J.; Olofsson, T.; Schreyer, M. Decision-making in a model-based design process. Constr. Manag. Econ. 2011, 29, 371–382. [Google Scholar] [CrossRef]
- Wong, A.K.; Wong, F.K.; Nadeem, A. Attributes of building information modelling implementations in various countries. Archit. Eng. Des. Manag. 2010, 6, 288–302. [Google Scholar] [CrossRef]
- Chang, S.; Lee, B.C.; Chen, P.Y.; Wu, I.C. Visual REQ calculation tool for green building evaluation in Taiwan. In Proceedings of the 28th International Symposium on Automation and Robotics in Construction, Seoul, Korea, 29 June–2 July 2013. [Google Scholar]
- Basbagill, J.; Flager, F.; Lepech, M.; Fischer, M. Application of life-cycle assessment to early stage building design for reduced embodied environmental impacts. Build. Environ. 2013, 60, 81–92. [Google Scholar] [CrossRef]
- Knight, D.; Addis, B. Embodied carbon dioxide as a design tool―A case study. Proc. Instit. Civ. Eng. 2011, 164, 171–176. [Google Scholar] [CrossRef]
- Welle, B.; Rogers, Z.; Fischer, M. BIM-Centric Daylight Profiler for Simulation (BDP4SIM): A methodology for automated product model decomposition and recomposition for climate-based daylighting simulation. Build. Environ. 2012, 58, 114–134. [Google Scholar] [CrossRef]
- Asl, M.R.; Zarrinmehr, S.; Bergin, M.; Yan, W. BPOpt: A framework for BIM-based performance optimization. Energy Build. 2015, 108, 401–412. [Google Scholar] [Green Version]
- Lin, P.H. The Study of Public Retail Markets towards Green Building and Comfort Environment; Research Report for Central Region Office, Ministry of Economic Affairs: Taichung, Taiwan, 2018.
- Jin, W.; Ullah, I.; Ahmad, S.; Kim, D. Occupant Comfort Management Based on Energy Optimization Using an Environment Prediction Model in Smart Homes. Sustainability 2019, 11, 997. [Google Scholar] [CrossRef]
- Fanger, P.O. Thermal Comfort: Analysis and Applications in Environmental Engineering, 1st ed.; Danish Technical Press: Copenhagen, Denmark, 1970; 224p. [Google Scholar]
- Olesen, B.W.; Parsons, K.C. Introduction to thermal comfort standards and to the proposed new version of EN ISO 7730. Energy Build. 2002, 34, 537–548. [Google Scholar] [CrossRef]
- International Organization for Standardization. Ergonomics of the Thermal Environment-Analytical Determination and Interpretation of Thermal Comfort Using Calculation of the PMV and PPD Indices and Local Thermal Comfort Criteria, 3rd ed.; International Standardization Organization: Geneva, Switzerland, 2005. [Google Scholar]
- Albatayneh, A.; Alterman, D.; Page, A.; Moghtaderi, B. The Impact of the Thermal Comfort Models on the Prediction of Building Energy Consumption. Sustainability 2018, 10, 3609. [Google Scholar] [CrossRef]
- ASHRAE Handbook. American Society of Heating, Refrigerating and Air-Conditioning Engineers, 1st ed.; ASHRAE: Atlanta, GA, USA, 2009. [Google Scholar]
- Succar, B. Building information modelling framework: A research and delivery foundation for industry stakeholders. Autom. Constr. 2009, 18, 357–375. [Google Scholar] [CrossRef]
- IES. Possilpark Health Centre: Operational Performance Review. Available online: http://www.iesve.com/consulting/projects/projectdetail?building=PossilparkHealth-Centre–Operational-Performance-Review&id=5820 (accessed on 12 October 2017).
- Habibi, S. Smart innovation systems for indoor environmental quality (IEQ). J. Build. Eng. 2016, 8, 1–13. [Google Scholar] [CrossRef]
- Ho, M.C. Construction and Research of Hourly Typical Meteorological Data TMY3 for Taiwan Building Energy Simulation Analysis; Collaborative Research Report for the Architecture and Building Research Institute; Ministry of the Interior: Taipei, Taiwan, 2013.
- Zielinska-Dabkowska, K.M.; Xavia, K. Protect Our Right to Light. Nature 2019, 568, 451–453. [Google Scholar] [CrossRef]
- Taiwan Ministry of Interior. Building Technical Regulations, 1st ed.; Ministry of Interior: Taipei, Taiwan, 2017.
- Lin, T.P. Influence of Heat Insulation and Heat Storage Effect of Building’s Exterior Wall on Indoor Environmental Temperature; Commissioned Research Report for the Architecture and Building Research Institute; Ministry of the Interior: Taipei, Taiwan, 2014.
- Ministry of Economic Affairs. Chinese National Standard (CNS) 12112, 1st ed.; Ministry of Economic Affairs: Taipei, Taiwan, 2012.
- Sandberg, M.; Sjoberg, M. The Use of Moments for Assessing Air Quality in Ventilated Rooms. Build. Environ. 1983, 18, 187–197. [Google Scholar] [CrossRef]
- Ministry of Economic Affairs. Technical Manual for Building Energy Conservation Application, 1st ed.; Ministry of Economic Affairs: Taipei, Taiwan, 2013.
Figure 1.
Revit model for Xindian Central Public Retail Market.

Figure 2.
Angle between the market and geographical north measured by SketchUP.

Figure 3.
Simulation of sunlight changes during winter solstice.

Figure 4.
Effective daylighting hours of adjacent rooms during winter solstice.

Figure 5.
Cumulative total solar radiation in all directions throughout the year.

Figure 6.
A solar photovoltaic (PV) system was installed on the rooftop of the market.

Figure 7.
Natural daylighting analysis of the common space: (a) in the basement; (b) on the first floor; (c) on the second floor.
Figure 7.
Natural daylighting analysis of the common space: (a) in the basement; (b) on the first floor; (c) on the second floor.

Figure 8.
Average wind rose plot and numerical reference of Xindian District, New Taipei City.

Figure 9.
Outdoor airflow simulation of annual wind (m/s).

Figure 10.
Outdoor airflow condition simulation of maximum wind (m/s).

Figure 11.
Indoor age of air simulation: (a) in the basement; (b) on the first floor; (c) on the second floor (min).
Figure 11.
Indoor age of air simulation: (a) in the basement; (b) on the first floor; (c) on the second floor (min).

Figure 12.
Indoor wind velocity simulation: (a) in the basement; (b) on the first floor; (c) on the second floor (m/s).
Figure 12.
Indoor wind velocity simulation: (a) in the basement; (b) on the first floor; (c) on the second floor (m/s).

Figure 13.
Indoor PMV simulation during summer solstice: (a) in the basement; (b) on the first floor; (c) on the second floor.
Figure 13.
Indoor PMV simulation during summer solstice: (a) in the basement; (b) on the first floor; (c) on the second floor.

Figure 14.
Indoor PPD (%) simulation during summer solstice: (a) in the basement; (b) on the first floor; (c) on the second floor.
Figure 14.
Indoor PPD (%) simulation during summer solstice: (a) in the basement; (b) on the first floor; (c) on the second floor.

Figure 15.
Comparison of cold room load results (x-axis denotes month, y-axis represents kilowatt).

Figure 16.
Annual energy consumption analysis.


Table 1.
Predicted mean vote (PMV) index.
| Comfort Level of the Body’s Perception of Cold and Heat in an Environment | Cold and Heat Status |
|---|---|
| +3 | Hot |
| +2 | Warm |
| +1 | Slightly warm |
| 0 | Neutral |
| −1 | Slightly cool |
| −2 | Cool |
| −3 | Cold |
Table 2.
Green energy analysis application of each software package.
| Software | Green Energy Analysis Applications |
|---|---|
| Autodesk Revit | Energy analysis |
| Cooling load simulation | |
| Autodesk Flow Design | Airflow condition simulation |
| Wind direction and outdoor airflow condition simulation and analysis | |
| Ecotect Analysis (Discontinued) | Sunlight and shadow simulation |
| Envelope heat radiation | |
| Climate data maps | |
| Autodesk Insight 360 | Energy consumption simulation |
| Shadow analysis | |
| Envelope heat radiation | |
| Cooling load simulation | |
| Autodesk Vasari | Wind rose plots |
| Indoor airflow condition simulation | |
| Envelope heat radiation | |
| Green Building Studio | Ventilation and airflow analysis |
| Overall energy consumption analysis of buildings | |
| Carbon emission calculation and analysis | |
| Water resource usage | |
| IES VE | Sunlight and shadow simulation |
| Envelope heat radiation | |
| Climate data map | |
| Cooling load | |
| Energy consumption simulation | |
| Indoor airflow condition simulation analysis | |
| Daylight simulation | |
| Personnel evacuation simulation |
Table 3.
Internal heat source of the space template. (SOURCE: ASHRAE 90.1 2010).
| Template Code | Equipment (W/M2) | Lighting (W/M2) | Person (M2/Person) | |
|---|---|---|---|---|
| Classroom | A | 10.76 | 10.35 | 1.43 |
| Conference | B | 10.76 | 13.24 | 8.24 |
| Corridor | C | 2.15 | 7.10 | X |
| Library | D | 16.15 | 10.01 | 9.29 |
| Office (1) | E | 16.15 | 10.55 | 12.13 |
| Office (2) | F | 16.15 | 10.55 | 18.58 |
| Sale area (1) | G | 5.38 | 18.08 | 33.33 |
| Sale area (2) | H | 5.38 | 18.08 | 6.19 |
| Stairway | I | 10.76 | 7.43 | X |
| Toilet | J | 5.38 | 10.55 | X |
| Warehouse | K | 2.15 | 6.24 | X |
Table 4.
Indoor load of the various spaces at the market case.
| Location | Template Code | Floor | Number | Area (M2) | Equipment (W) | Lighting (W) | Person | Note |
|---|---|---|---|---|---|---|---|---|
| Sale area | G | B1F | 5 | 1000 | 5380.00 | 18,080.00 | 30 | Approximately 20~30 persons |
| H | 1F | 55~60 | 24 | 129.12 | 433.92 | 3.89 | Approximately 1~5 persons | |
| H | 1F | 61~66 | 10 | 53.80 | 180.80 | 1.62 | Approximately 1~5 persons | |
| H | 1F | 34 | 12 | 64.56 | 216.96 | 1.94 | Approximately 1~5 persons | |
| Office | F | 1F | 24 | 25 | 403.75 | 263.75 | 1.65 | Approximately 1~2 persons |
| F | 1F | 25 | 19 | 306.85 | 200.45 | 1.02 | Approximately 1~2 persons | |
| E | 1F | 27~29 + 36~39 + 67 | 182 | 2939.30 | 1920.10 | 15 | Approximately 15 persons | |
| F | 2F | 70 | 20 | 323.00 | 211.00 | 1.08 | ||
| Classroom | A | 2F | 71 | 42 | 451.92 | 734.70 | 29.37 | Approximately 30 persons |
| Conference | B | 2F | 74 + 83 | 577 | 6208.52 | 7639.48 | 70.02 | Approximately 70 persons |
| Library | D | 2F | 72 + 73 | 151 | 2438.65 | 1511.51 | 16.25 | Approximately 10~20 persons |
| Corridor | C | 1F | 14 | 227 | 488.05 | 1611.70 | X | |
| C | 1F | 42 | 113 | 242.95 | 802.30 | X | ||
| C | 2F | 69 | 59 | 126.85 | 418.90 | X | ||
| Stairway | I | 1F–3F | ALL | 88 | 946.88 | 653.84 | X | |
| Toilet | J | 1F–3F | ALL | 78 | 419.64 | 822.90 | X | |
| Warehouse | K | 1F | 32 | 19 | 40.85 | 118.56 | X | |
| K | 1F | 23 | 45 | 96.75 | 280.80 | X | ||
| K | 1F | 33 | 136 | 292.40 | 848.64 | X | ||
| K | 2F | 95, 96, 98 | 28 | 60.20 | 174.72 | X |
Table 5.
Operating hours of each unit in the market case.
| Location | Floor Number | Number | Operating Hours |
|---|---|---|---|
| Sale area | B1F | 5 | Monday~Sunday, 08:00~22:30 |
| 1F | 55~60 | Tuesday~Sunday, 10:00~20:00 | |
| 1F | 61~66 | Tuesday~Sunday, 10:00~20:00 | |
| 1F | 34 | Tuesday~Sunday, 10:00~20:00 | |
| Office | 1F | 24 | Monday~Friday, 08:00~12:00, 13:30~17:30 |
| 1F | 25 | Monday~Friday, 08:00~12:00, 13:30~17:30 | |
| 1F | 27~29 + 36~39 + 67 | Monday~Friday, 08:00~12:00, 13:30~17:30 | |
| 2F | 70 | Monday~Friday, 08:00~12:00, 13:30~17:30 | |
| Classroom | 2F | 71 | Tuesday~Saturday, 08:00~12:00, 13:00~17:00, 18:00~21:00 |
| Conference | 2F | 74 + 83 | Tuesday~Saturday, 08:00~12:00, 13:00~17:00, 18:00~21:00 |
| Library | 2F | 72 + 73 | Tuesday~Saturday, 08:30~21:00; Sunday~Monday, 08:30~17:00 |
Table 6.
Annual energy use intensity (EUI) per unit area for all buildings.
| Building Use Classification | Annual EUI Per Unit Area | |||||
|---|---|---|---|---|---|---|
| Main Category | Subcategory | Statistical Samples (Number of Buildings) | Average (kWh/m2·yr) | Minimum (kWh/m2·yr) | Maximum (kWh/m2·yr) | Standard Deviation |
| Government agencies | Central agencies(General administration) | 29 | 114.10 | 36.60 | 189.80 | 46.50 |
| Local agencies(General administration) | 23 | 87.10 | 37.70 | 134.40 | 25.40 | |
| Schools | General university | 62 | 84.40 | 45.70 | 123.40 | 20.00 |
| University of science and technology | 58 | 69.00 | 33.00 | 99.40 | 18.80 | |
| Senior high school | 42 | 65.40 | 30.40 | 107.00 | 21.00 | |
| Vocational high school | 17 | 59.30 | 30.40 | 98.40 | 23.70 | |
| Office buildings | 132 | 149.80 | 79.20 | 225.00 | 34.10 | |
| Hotels | International tourist hotel | 51 | 207.60 | 117.60 | 299.20 | 53.80 |
| General tourist hotel | 14 | 198.80 | 106.80 | 264.00 | 49.70 | |
| General hotel | 9 | 195.60 | 172.90 | 223.60 | 17.60 | |
| Department malls | Shopping center | 17 | 223.80 | 141.30 | 301.00 | 50.70 |
| Department store | 58 | 331.10 | 209.10 | 483.90 | 77.90 | |
| Hypermarket (General) | 74 | 218.20 | 138.40 | 301.80 | 43.80 | |
| Hypermarket (Without refrigeration) | 9 | 214.00 | 137.40 | 375.10 | 85.40 | |
| Compound shopping center | 21 | 209.60 | 106.40 | 356.20 | 74.90 | |
Table 7.
Monthly power generation (MWh) of the simulated PV system.
| Date | Generated Elec. (PVS) (MWh) |
|---|---|
| 1–31 January | −1.55 |
| 1–28 February | −2.28 |
| 1–31 March | −2.32 |
| 1–30 April | −2.55 |
| 1–31 May | −2.92 |
| 1–30 June | −2.97 |
| 1–31 July | −4.10 |
| 1–31 August | −3.70 |
| 1–30 September | −3.19 |
| 1–31 October | −2.75 |
| 1–30 November | −1.99 |
| 1–31 December | −1.58 |
| Summed total | −31.89 |
(Note: Negative values denote power generation, positive values denote energy consumption).
Table 8.
Comparison of the four optimization plans for annual energy consumption analysis.
| Items | Cold Room Load (MWh) | Difference with Current Status (MWh) |
|---|---|---|
| 1. RC exterior wall with normal window glass (current combination) | 526.51 | X |
| 2. Plastic steel wall board with LowE window glass | 516.79 | 9.73 |
| 3. RC exterior wall with normal window glass and solar PV panels | 341.97 | 184.55 |
| 4. Plastic steel wall board with LowE window glass and solar PV panels | 341.43 | 185.08 |
Table 9.
Summary of energy consumption analysis results.
| Analyzed Items | Energy Consumption Assessment Results | Optimization Plans |
|---|---|---|
| Sunlight | Only the south side of the market receives effective sunshine of more than 1 h during winter solstice. The remaining areas of the market are obstructed by shadow trajectories and surrounding buildings, and they receive less than 1 h of effective sunshine. | None |
| Solar radiation | The rooftop of the market receives the highest amount of solar radiation (up to 928 kWh/m2). | Install solar PV panels on the rooftop; the simulated total power generation is 31,887 units of electricity, and the roof is partially isolated from solar radiation of 432 kWh/m2. |
| Natural daylighting | The south side of the market receives excessive illumination, whereas the internal illumination of the market is inadequate. | Install sunshades at the south side of the market and artificial lighting equipment indoors. |
| Outdoor airflow conditions | The wind velocity near the market is approximately 0 in the presence of outdoor annual wind, whereas outdoor wind at maximum velocity is prone to producing vortex flow. | None |
| Indoor airflow conditions | Unfavorable indoor air circulation in the presence of outdoor annual wind, leading to excessively old air. | Install mechanical ventilation. |
| PMV and PPD | High PMV and PPD values in areas with high levels of activity. | None |
| Building cooling load | With an RC exterior wall and normal window glass, the market yields a cold room load up to 550 kW. | Install plastic steel wall boards outside the RC exterior wall and replace the window glass with LowE glass will yield a cold room load up to 450 kW, which is 100 kW lower than the original value. |
| Annual energy consumption analysis | The current status of the market and three other optimization plans were subjected to annual energy consumption analysis. | The optimization plan involving the rooftop heat insulation has the greatest effect on annual energy conservation. |
| EUI | The EUI of the market is 277.86 kWh/m2·year, which is 59.66 kWh/m2·year more than the average EUI of retail stores; however, it still falls within the maximum EUI range of retail stores. | None |
© 2019 by the authors. Licensee MDPI, Basel, Switzerland. This article is an open access article distributed under the terms and conditions of the Creative Commons Attribution (CC BY) license (http://creativecommons.org/licenses/by/4.0/).
Share and Cite
MDPI and ACS Style
Lin, P.-H.; Chang, C.-C.; Lin, Y.-H.; Lin, W.-L. Green BIM Assessment Applying for Energy Consumption and Comfort in the Traditional Public Market: A Case Study. Sustainability 2019, 11, 4636. https://doi.org/10.3390/su11174636
AMA Style
Lin P-H, Chang C-C, Lin Y-H, Lin W-L. Green BIM Assessment Applying for Energy Consumption and Comfort in the Traditional Public Market: A Case Study. Sustainability. 2019; 11(17):4636. https://doi.org/10.3390/su11174636
Chicago/Turabian StyleLin, Pao-Hung, Chin-Chuan Chang, Yu-Hui Lin, and Wei-Liang Lin. 2019. "Green BIM Assessment Applying for Energy Consumption and Comfort in the Traditional Public Market: A Case Study" Sustainability 11, no. 17: 4636. https://doi.org/10.3390/su11174636
Note that from the first issue of 2016, this journal uses article numbers instead of page numbers. See further details here.