Article

Evaluation of Dust Concentration During Grinding Grain in Sustainable Agriculture

by
Paweł Sobczak
1,
Jacek Mazur
1,*,
Kazimierz Zawiślak
1,
Marian Panasiewicz
1,
Wioletta Żukiewicz-Sobczak
2,
Jolanta Królczyk
3 and
Jerzy Lechowski
4
1
Department of Food Engineering and Machines, University of Life Sciences in Lublin, 20-612 Lublin, Poland
2
Department of Public Health, Pope John Paul II State School of Higher Education in Biala Podlaska, 21-500 Biala Podlaska, Poland
3
Faculty of Mechanical Engineering, Opole University of Technology, 45-271 Opole, Poland
4
Department of Biochemistry and Toxicology, University of Life Sciences, 20-950 Lublin, Poland
*
Author to whom correspondence should be addressed.
Sustainability 2019, 11(17), 4572; https://doi.org/10.3390/su11174572
Submission received: 22 July 2019 / Revised: 13 August 2019 / Accepted: 20 August 2019 / Published: 22 August 2019
(This article belongs to the Special Issue Sustainable Production in Food and Agriculture Engineering)

Abstract

:
This work analyses the organic dust concentration during a wheat grinding process which was carried out using two types of grinders: A hammer mill and a roller mill. DustTrak II aerosol monitor was used to measure the concentration of the dust PM10 (particles with the size smaller than 10 μm), PM4.0, and PM1.0. An increase of the grain moisture to 14% resulted in the reduction in PM10 when grinding grain using the hammer mill. An inverse relationship was obtained when grain was ground using the roller mill. A smaller amount of the fraction below 0.1 mm was observed for larger diameter of the holes in the screen and smaller size of the working gap in the roller mill. For both mills, the obtained concentration of the PM10 fraction dust exceeded the acceptable level. To protect farmers health, it is necessary to use dust protection equipment or to modify the grinding technology by changing the grain moisture content and/or the grinding parameters.

1. Introduction

Management and processing of agricultural goods in a sustainable agriculture farm is of particular importance in terms of further use of these products. In agricultural holdings, straight after harvest, cereals usually have a higher moisture content than the one necessary for successful storage. This is the result of varied harvest periods. Installation of a specialized drying facility is one of the ways to lower the moisture content, however, this generates additional costs and entails higher energy consumption [1,2]. There are approaches to reduce costs of drying by using the heat produced by combustion of pellets derived from by-products of agricultural processing, e.g., Straw, rapeseed oil cakes, soybean hulls [3,4]. Moreover, technologies are also developed for processing agricultural goods, including cereals, directly after harvesting without drying [5]. In most cases such raw materials are used directly as livestock fodder. Grinding cereals and other seeds is the key production step in animal fodder production. Several factors, including moisture content and the type of raw material, its hardness and brittleness, as well as chemical composition influence the course, efficiency and effectiveness of grinding. In addition to physical properties, the milling process is determined by both structural and operating characteristics of a grinder. One of the consequences of using this group of machines is their wear, which also affects the degree of fragmentation of raw material. Among the elements of grinding machines that are affected by use wear; one should mention hammers, screens, and rollers. Irrespective of the milling method, organic dust is produced when cereal raw materials are ground. For health reasons, of particular importance is the continuous monitoring of aerosol concentration in the air and the use of equipment protecting against dust. Dust is one of the main harmful factors occurring in the work environment of farmers. Harmful influence of dust on the human body may cause many diseases, including pneumoconiosis and cancer. According to the data from the literature of the subject [6]; a human inhales daily approximately 12.3 m3 of air, which is a mixture of gas and particles of liquids as well as solids. Dust suspended in the air is a mixture with varied chemical composition and physical characteristics. Organic dust present in the air with a particle diameter greater than 10 μm quickly settles on surface and is called deposited dust. At the same time, smaller fractions are suspended in the air. PM10 fraction refers to particles with the size smaller than 10 μm, while PM1.0 to the particles with the diameter smaller than 1 μm. Dust with dimensions smaller than 10 µm (PM10) enters the respiratory system and those with particle size smaller than 1 µm, may penetrate alveoli and thus enter bloodstream and all other systems [7,8,9]. As evidenced by studies, dangerous mycotoxins enter the human body together with inhaled organic dust [10,11]. The presence of dust during the grinding process is very common. Primarily, particles of a greater size are present (PM10), but there are also those with smaller particle size (PM2.5). As the result of their further spread, and frequently mutual collision, their additional fragmentation takes place, which increases the amount of fine fraction PM2.5 and very fine fraction PM1.0. Therefore, a PM4.0 fraction concentration might be a good determinant of dust contamination in its initial phase.
The European Commission takes into account mainly dust particles of PM10 and PM2.5 fraction [12]. According to the data from 2018, it is estimated that in Poland’s agriculture and waste disposal there is approx. 16% with PM10 particulate size and approx. 15.2% with PM2.5 particulate size in the overall amount of generated dusts [13]. According to the data of the World Health Organization [14]; for a PM10 acceptable level of 24 h continuous concentration of dust is 50 µg·m−3, while in the case of PM2.5 the acceptable level is 25 µg·m−3. According to epidemiological research [12], it is difficult to identify the threshold values of dust concentration below which no adverse effects on human organism are observed. Many research works were performed on the harmfulness of suspended particulate matter on the human body [15,16,17,18]. In the research by Zwoździak et al. [19] concentration of PM10, PM2.5, and PM1 at school was examined by comparing it with the results of the children examined using a spirometer. The average concentration of PM10 was equal to 115.2 µg·m−3, while that of PM2.5 was 46.4 µg·m−3. A short-term cause and effect relationship was documented between the concentration of PM2.5 fraction inside the school and the change of values of the parameters measured in spirometry.
Health statistics show that most of occupational diseases reported in Polish farmers is caused by pathogens present in organic dusts. In Poland, lung diseases are more common in farmers than in the rest of the population, just as in other countries. Therefore, the problem is serious, and there is a need to take appropriate preventive measures [10,20,21,22].
The studies carried out were intended to assess concentration of organic dust produced during grinding grain in a hammer mill and roller mill, i.e., the most popular grinding devices in agricultural holdings. The test presented in the paper were carried out for the grain with three different levels of moisture content in order to assess the impact of moisture content on the level of dust contamination.

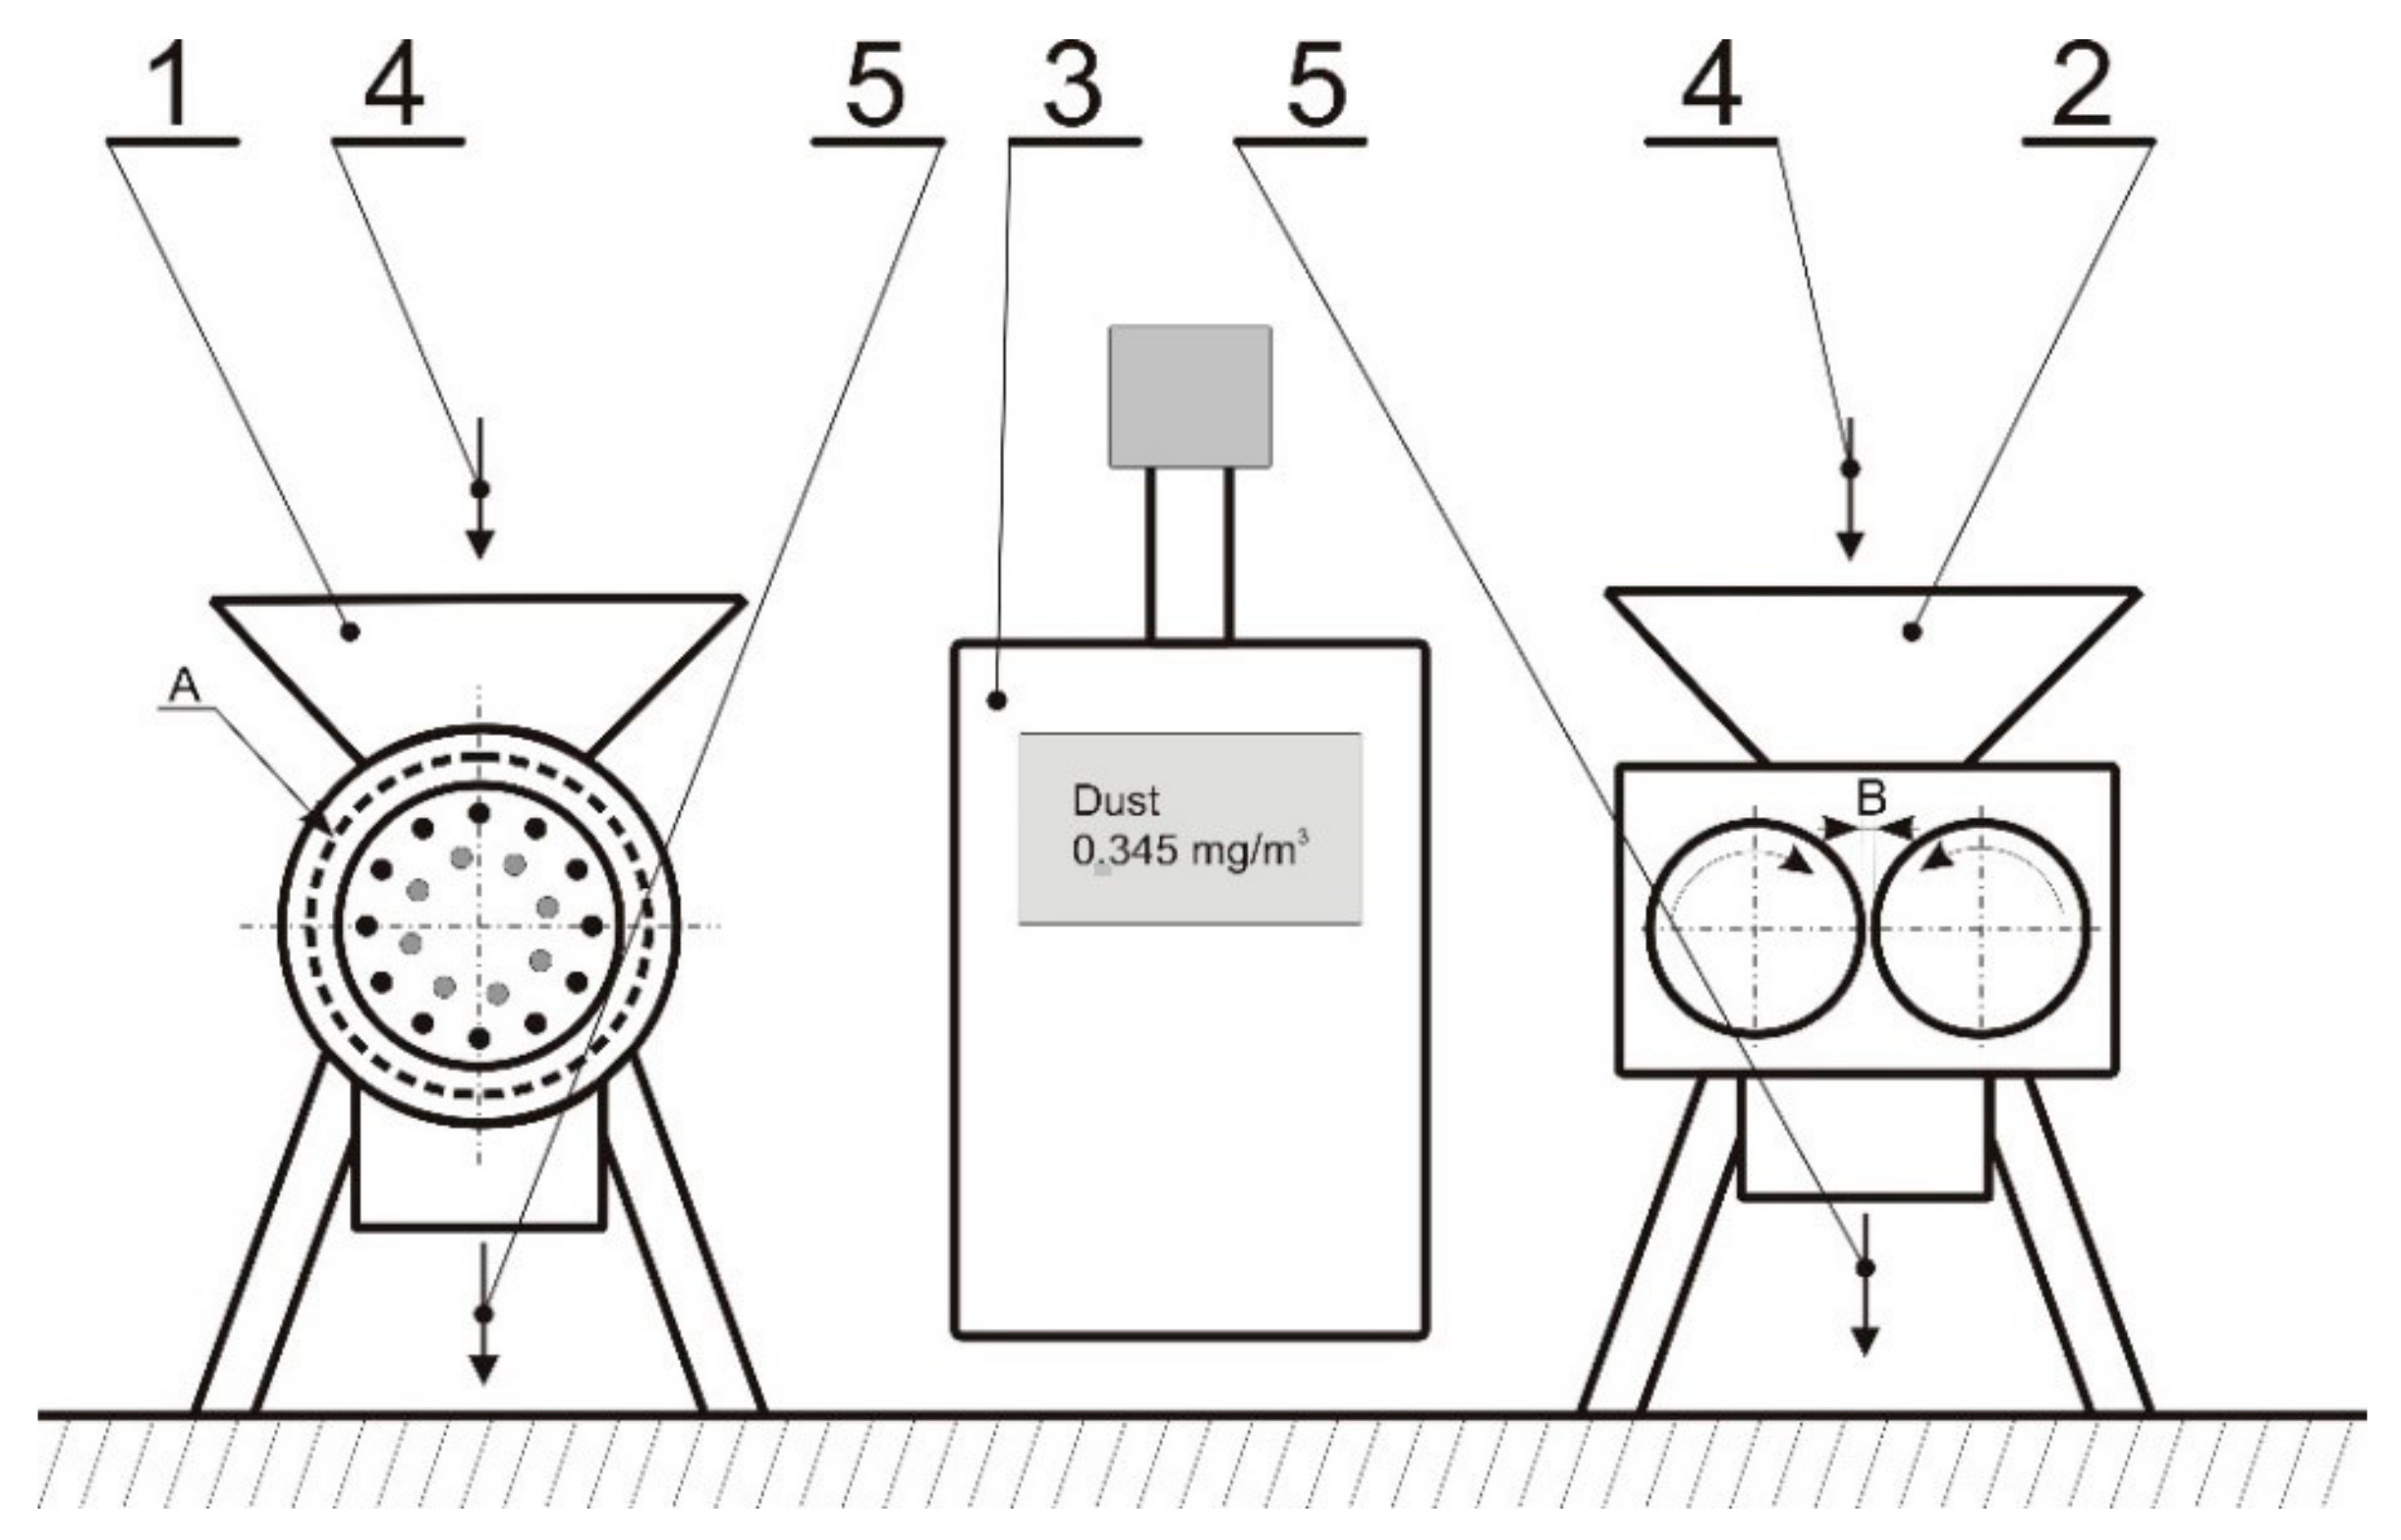
2. Materials and Methods

The test material was wheat of Zyta variety. The wheat grain is the typical kind of grain used in the farms. The initial moisture content of the wheat, the so-called storage humidity, was 9% [23]. The studies were carried out also on wheat with the moisture content of 14% and 18%. For this purpose, the test material was moistened to the desired moisture content by adding the appropriate amount of water and storing in cold storage conditions for 24 h in order to balance the moisture content. The quantity of water needed for moistening was calculated using the following formula:
M W = x 2 x 1 100 x 2 M N
where:
  • Mw—amount of water necessary for moistening,
  • MN—moistened grain mass,
  • X1—initial moisture content,
  • X2—desired moisture content.
The first moisture content (9%) it is mainly moisture of grain after drying or storage, moisture 14% this is a maximum safe moisture content for storage and 18% and more this is a moisture content of grain after harvesting. Some farmers processed the grain immediately after harvesting. The wheat grain is the typical kind of grain used in the farms.
Grinding was performed using two different types of mills, i.e., A hammer mill with interchangeable screens and a roller mill with the diameter of rollers equal to 200 mm. In the hammer mill three different screens with mesh with the diameter of openings respectively: φ = 3, φ = 5 and φ = 8 mm were used, while in the case of the roller mill three different working gaps were set, i.e., 0.4, 0.7, and 1.0 mm. The operating parameters of machines are different according to the destination of the ground grain. The disintegration at holes at screen size of 3 mm is typical feed for pigs, 5 mm is typical for poultry and 8 mm is designed for hens in the hammer mill. The size of gap was set according to the same destiny of feed in roller mill.
Concentration of organic dust, as measured using a DustTrak II monitor, with which three interchangeable size-selective inlets were used, allowing the measuring of the concentration of dust with particulate matter size: PM10, PM4.0 and PM1.0. The duration of the measurement was set to 1 min. During this time, 30 measurements were made, i.e., one every 2 s. The device used to measure the dust concentration was installed at a distance of 1 m from the grinding mill, at an employee head height, i.e., 1.5 m above the ground. Each time the device was set in the same place. The measurements were taken at the same distance from the milling device, thus simulating the typical position of personnel handling the grinder (Figure 1). Additionally, a control test was also made by measuring dust concentration in the room when grinding process was not taking place. In the discussed study, the PM4.0 was used instead of the typical value of PM2.5, taking into account a phenomenon typically occurring during the process of dynamic milling that is mutual collision of particles and resulting from it gradual formation of a certain quantity of finer particles [24,25,26].
The obtained wheat middlings were analyzed on sieves in order to determine the finest fraction, i.e., with the size smaller than 0.1 mm, as well as the average particle size. The study was performed on a Retsch sieve separator in accordance with PN-R-64798: 2009 standard [27].
Designations presented in Table 1 were used for descriptive purposes in this work.

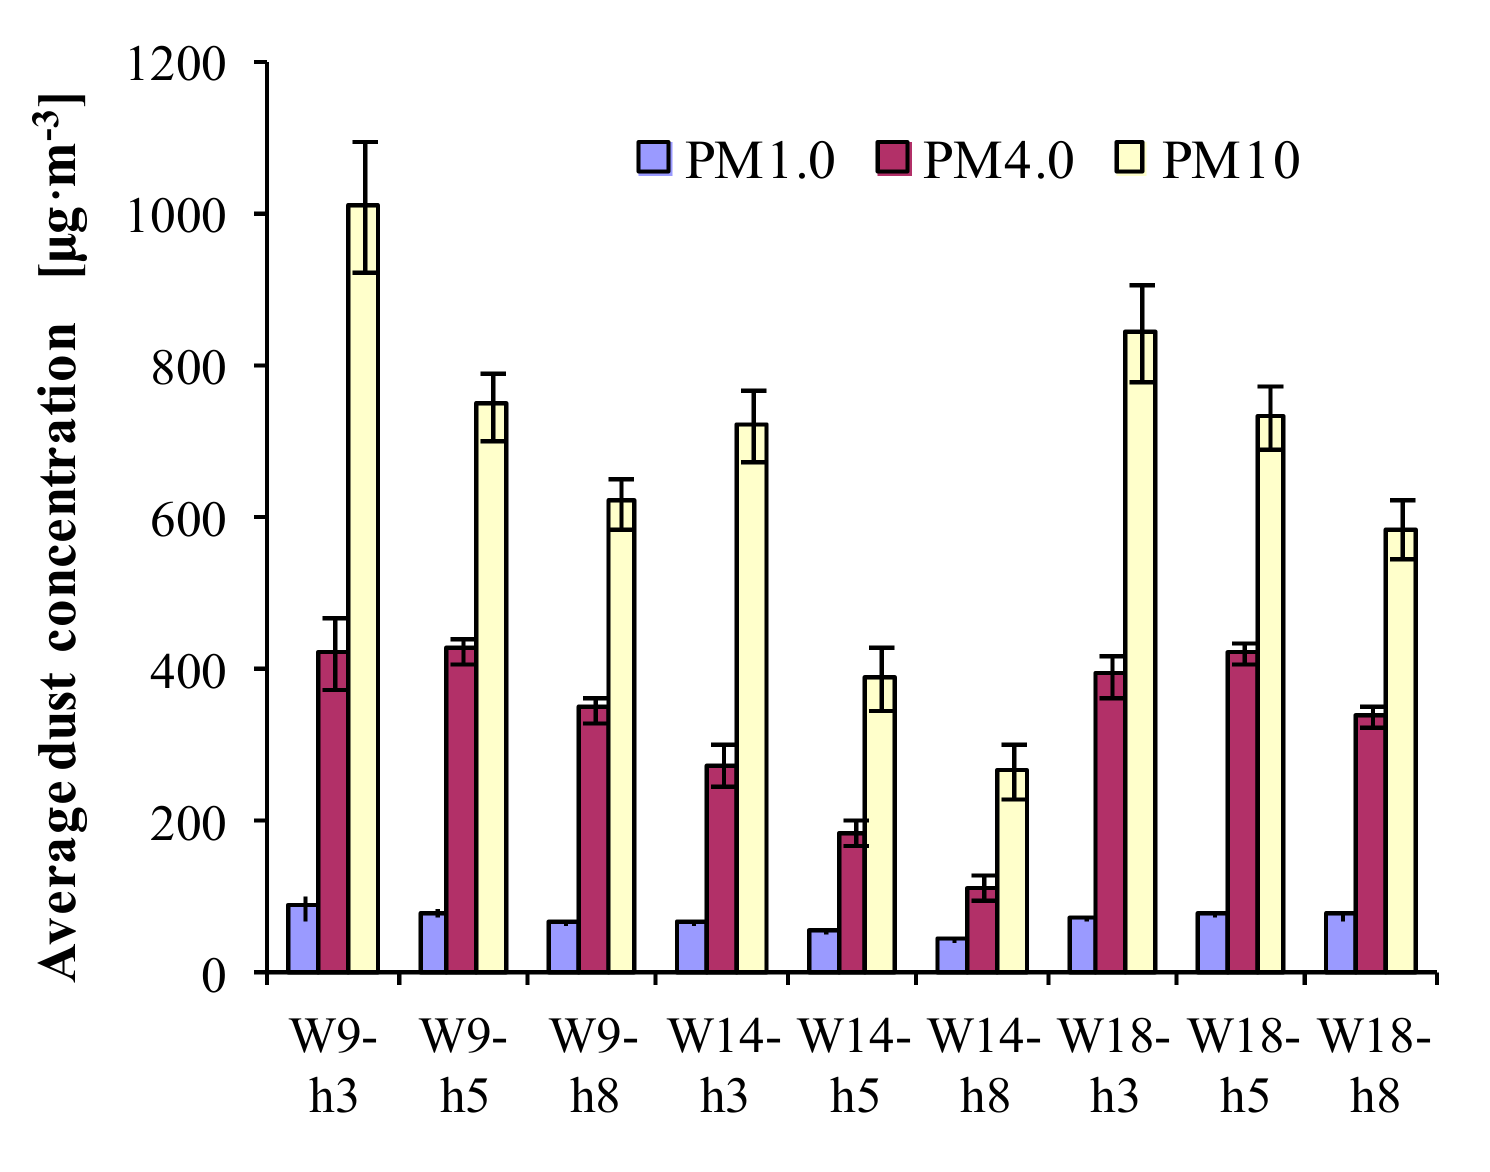
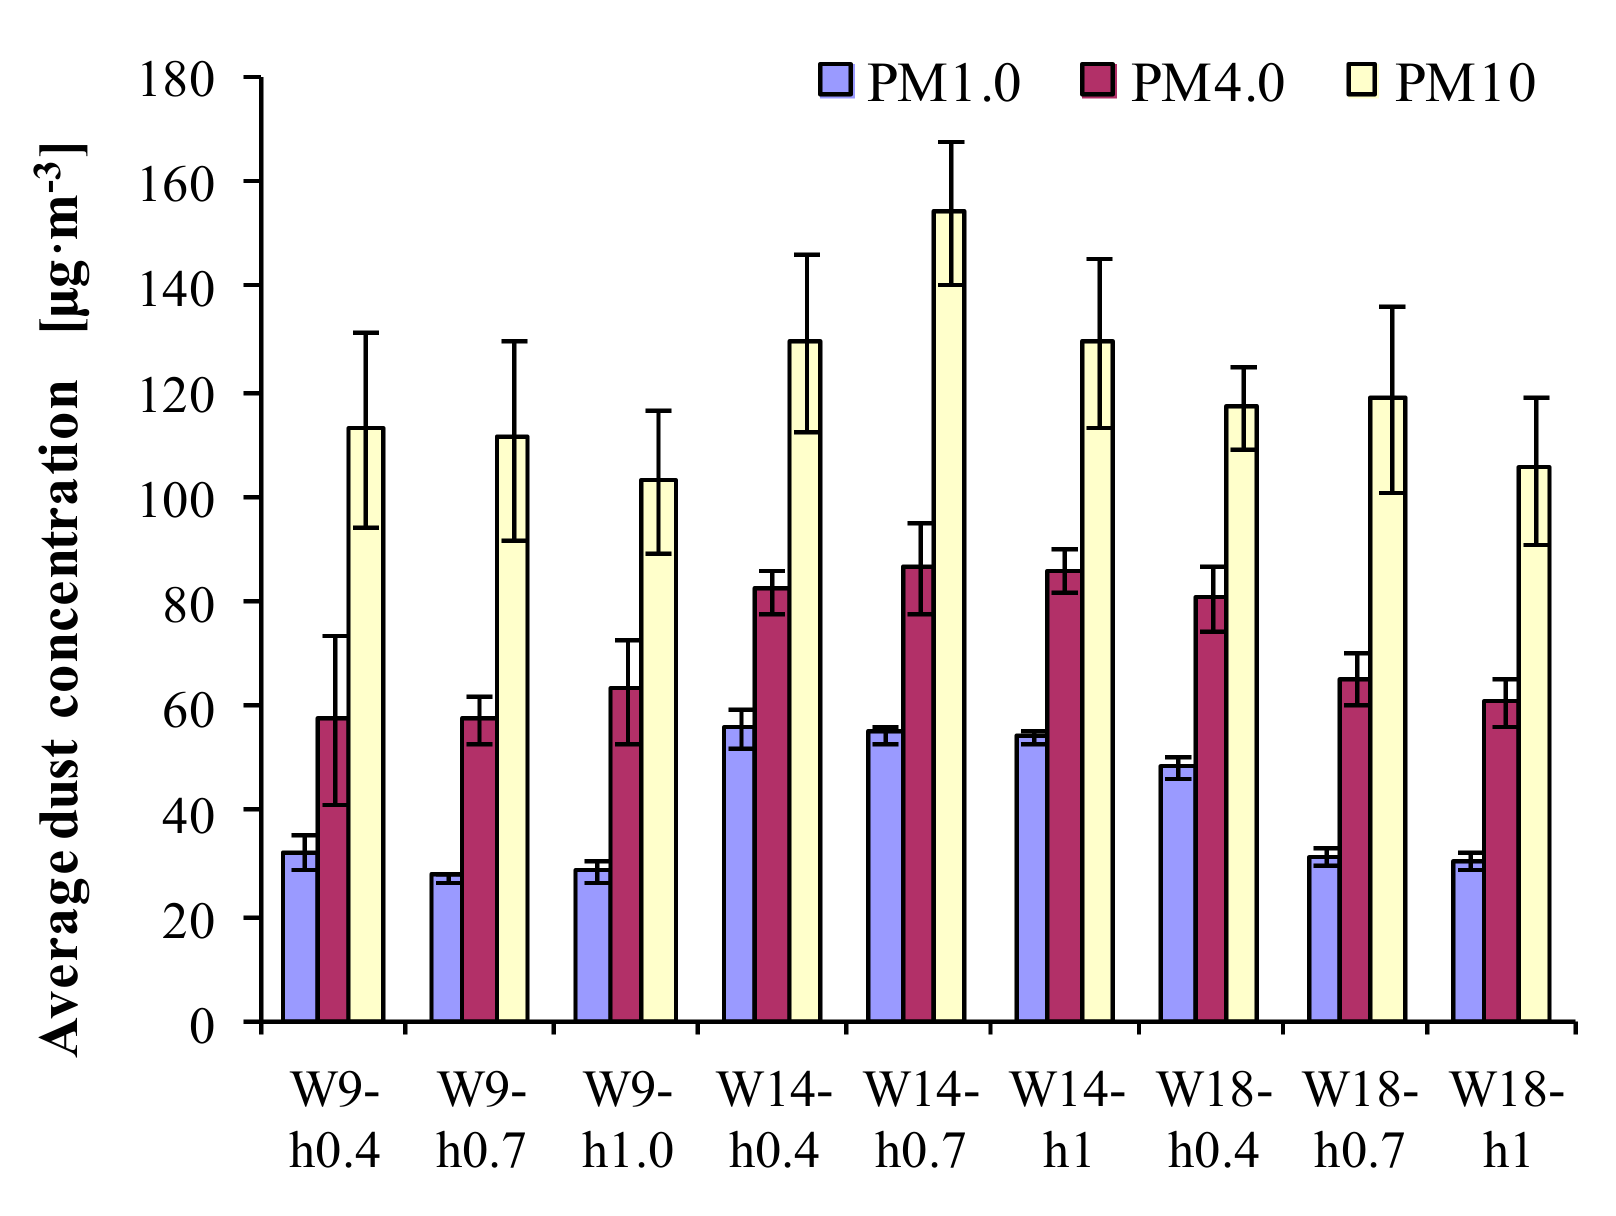
3. Results and Discussion

Prior to the commencement of the research on the grinding process the average concentration of organic dust in the room was determined. The concentrations were as follows: For PM1.0—26 μg·m−3, for PM4.0—35 μg·m−3, and for PM10—53 μg·m−3. The same analysis was also performed 5 min after completion of the grinding process and turning off the machinery. The concentration of dust was as follows: For PM1.0—42 μg·m−3, for PM4.0—328 μg·m−3, and for PM10—101 μg·m−3.
The average values of organic dust concentration in the course of grinding with the hammer mill are shown in Figure 2, while Figure 3 presents the corresponding values in the case of the roller mill. In addition, in Table 2, Table 3 and Table 4 respectively, the maximum and minimum concentration of dust particulates during the grnding process is shown.
In the case of the hammer mill, at a constant moisture content, a significant decrease of concentration of the organic particulate matter of the PM10 fraction was observed for increased diameter of screen openings. In the case of the roller mill, a similar trend can be observed for increased working gap, however, only for the raw material with the moisture content of 9%. It should be noted that in this case the trend is noticeable, though not confirmed statistically. Additionally, in the case of the hammer mill, for the moisture content of 9% and 14%, a tendency can be observed of lowering the concentration of PM1.0 fraction with the increase of the diameter of screen openings, although statistical analysis does not confirm the importance of these differences at 0.05 significance level. In the case of the roller mill, a similar relationship was noted for the raw material with the moisture content of 18% and increased size of the working gap between the rollers. For a particulate matter of the PM4.0 fraction produced in the course of grinding using the hammer mill, a decrease of dust concentration was observed for larger mesh openings in the case of moisture content of 14%. A similar tendency is noticeable for the roller mill for the increased size of the working gap in the case of the raw material with the moisture content of 18%.
When grinding in the hammer mill, for each of the tested sizes of mesh openings in the screen, the highest value of organic dust concentration of PM10 fraction was measured for the grain with initial moisture content of 9%, while the lowest concentration characterized the grain with an initial moisture content of 14%. The highest value of concentration of the PM10 fraction was recorded for the moisture content of 9% and the screen openings size equal to 3 mm (1102 μg·m−3), while the lowest concentration was measured for the moisture content of 14% and the screen openings size of 8 mm (263 μg·m−3). In the case of the PM4.0 fraction, the highest concentrations of organic dust was observed for the raw material with the initial moisture content of 9% and 18%. It reached a similar value both for the openings with the diameter of 3 as well as 5 mm (approx. 420 μg·m−3). For all tested initial moisture contents, the use of screens with the openings size of 8 mm resulted in the decrease of concentration of the organic dust by approx. 24% (to the level of approx. 340 μg·m−3). In the case of the very fine particulate matter PM1.0, the highest value of concentration was recorded for the input material with moisture content of 9% and the screen openings size of 3 mm (84 μg·m−3). For the entire range of tested moisture content of the input material, the lowest value of the PM1.0 fraction concentration was observed for grain with the moisture content of 14% (42 μg·m−3). Using the roller mill reduced the amount of produced PM10, PM4.0, and PM1.0 dust as compared to the amount obtained during grinding of the raw material in the hammer mill. In this case, for all examined mill gaps between the rollers, the highest value of the PM10 fraction concentration was measured for grain with the input moisture content of 14%. The highest concentration was equal to 155 μg·m−3 for the gap of 0.7 mm, followed by the gaps of 0.4 and 1 mm (approximately 129 μg·m−3). The lowest value of dust concentration of the PM10 fraction was recorded during grinding grain with the initial moisture content of 9% for the mill gap of 1 mm; this value was 103 μg·m−3. When grinding grain using the roller mill the concentration of dust of the PM4.0 fraction was also the highest for the input material with the moisture content of 14% (87 μg·m−3 for the mill gap of 0.7 mm). In contrast, the lowest concentration of organic dust of the PM4.0 fraction was recorded during grinding grain with the moisture content of 9% (the lowest concentration of 57 μg·m−3 was measured for the mill gap of 0.7 mm). For the roller mill the highest concentration of the finest particulate matter of the PM1.0 fraction was recorded for the initial humidity of 14%, and mill gap of 0.4 mm (52 μg·m−3). As in the above described variants, considering the analyzed mill gaps, also in the case of the finest particulate matter the lowest values of organic dust concentration were observed for grain with the initial moisture content of 9% (the lowest concentration equal to 28 μg·m−3 was measured for the gap of 0.7 mm). In the research by Dacarro [28], the average concentration of organic dust of 790 μg·m−3 was obtained during the grinding stage of grain processing in mills, while the highest concentration of inhaled dust was obtained at the cleaning stage, when it was equal to 2763 μg·m−3, with the concentration of dust of the smallest particulate size (respirable dust) was, respectively: 321 and 1400 μg·m−3.
The use of the roller mill, instead of the hammer mill in the process of grinding grain with moisture content of 9%, resulted in an average reduction of the PM10 fraction by approx. 724%, the PM4.0 fraction by approx. 671%, and the PM1.0 fraction by 256%, and these were the largest decreases registered among the analyzed moisture content levels. For grain with the moisture content of 14% which is characterized by the lowest dynamics of the decrease these values were, respectively: PM10—337%, PM4.0—223%, and PM1.0—98%. Moreover, in the case of the last one even an approx. 22% increase in the amount of PM1.0 fraction was recorded for the roller mill with the mill gap of 1 mm in comparison to the amount of dust produced by the hammer mill with the screen openings with the diameter of 8 mm.
Concentration of organic dust originating from the production of industrial fodder was determined in the research by Sobczak [29], when concentration of this type of dust was measured at various stages of production. The research showed that the highest average concentration was recorded during grinding grain, and for the PM10 fracture it was equal to 1250 μg·m−3, however, neither the machinery nor the grinding parameters were provided. In the study presented here, the maximum instantaneous concentration of the organic dust for the PM10 fraction was equal to 1200 μg·m−3, and it was recorded while grinding grain using the hammer mill with the screen openings with the diameter of 3 mm and input material moisture content of 9%. In addition, the research done by Karpaciński [30] confirms the high concentration of organic dust in grain processing plants. This study was performed in Canadian mills, where the determined concentration of dust was higher than 10,000 μg·m−3, which is significantly above the acceptable level. Concentration of organic dust in grain milling industry and herbal plants during the packing stage is much lower, and amounts approximately to 100 μg·m−3 for dust of the PM1.0 fraction [31,32].
Table 5 shows the average size of particles after the grinding process, and the share of the finest fraction (below 0.1 mm). The average size of particles depended on grain moisture content and the choice of grinding method. The highest amount of the fine fraction was obtained during grinding grain using the hammer mill with the screen of 3 mm mesh size and the material moisture content of 9%. In this case, the share of the finest fraction was equal to 3.98%. Analogously, when using the roller mill with the smallest tested mill gap, i.e., 0.4 mm, the amount of the finest dust fraction was equal to 2.78%. When grinding grain with higher moisture content the amount of the finest fraction decreased. The average size of particles obtained during grinding grew with the increase of grain moisture content. The largest average size of particles was obtained after grinding grain in the roller mill with the mill gap between the rollers of 1 mm and grain moisture content of 18%. For the hammer mill, the largest average size of particles was obtained when grinding grain with the moisture content of 18% and using the screen with the mesh having the diameter of the openings equal to 8 mm. A research was conducted analyzing the average particle size and production of fine fraction below 0.2 mm when using a roller mill for grinding hard and soft grain into flour. Sprouted grain with balanced moisture content of 12% was used as the soft grain [21]. The study showed that grinding sprouted grain produced greater amount of fine fraction, which might result from the bonding strength of starch molecules present in germinated material. In the study presented here, the change of moisture content, and therefore the change of grain hardness, had an opposite effect, which was caused by lack of enzymatic reactions that take place during germination.

4. Conclusions

The average concentration of organic dust during wheat grinding depends on the type of the milling machinery and the moisture content of the input material. The highest concentration of organic dust was recorded when grinding the raw material with the lowest tested moisture content, i.e., 9%, which can be related to the hardness and at the same time brittleness of grain that during the grinding process breaks more easily into small fractions. An increase of grain moisture to 14% resulted in the reduction in particulate matter concentration (PM10) inhaled by employees when grinding grain using the hammer mill. An inverse relationship was obtained when grain was ground using the roller mill, which may be the result of different construction of working parts. For both the mills, the obtained concentration of the PM10 fraction dust was high, and in every case, it exceeded the acceptable level, which for most European countries is 100 μg·m−3 [33]. However, when comparing both types of the mills, statistically smaller concentration of organic dust was produced when grinding using the roller mill. The sieve analysis revealed that the amount of the finest fraction, i.e., below 0.1 mm, was smaller when grinding using the roller mill as compared with the hammer mill. The amount of the finest fraction depends on the size of the openings in the screen mesh, i.e., the larger the diameter of the holes in the screen, the smaller the amount of the fraction below 0.1 mm. Similar is the relationship with the width of the mill gap in the roller mill, i.e., the smaller the gap, the higher the share of the finest fraction. In some cases, instantaneous maximum concentration of organic dust during the process of grinding grain exceeded even ten times the accepted limit values. Having in mind the health safety of farmers, it is necessary to use dust protection equipment or to modify the grinding technology by changing the grain moisture content or choosing appropriate grinding parameters.

Author Contributions

All authors contributed equally to this paper.

Funding

This research received no external funding.

Conflicts of Interest

The authors declare no conflict of interest.

References

  1. Amantea, R.P.; Fortes, M.; Ferreira, W.R.; Santos, G.T. Energy and exergy efficiencies as design criteria for grain dryers. Dry. Technol. 2018, 36, 491–507. [Google Scholar] [CrossRef]
  2. Lutfy, O.F.; Noor, S.B.M.; Abbas, K.A.; Marhaban, M.H. Some control strategies in agricultural grain driers: A review. J. Food Agric. Environ. 2008, 6, 74–85. [Google Scholar]
  3. Niedziółka, I.; Szpryngiel, M.; Kachel-Jakubowska, M.; Kraszkiewicz, A.; Zawiślak, K.; Sobczak, P.; Nadulski, R. Assessment of the energetic and mechanical properties of pellets produced from agricultural biomass. Renew. Energy 2015, 76, 312–317. [Google Scholar] [CrossRef]
  4. Kraszkiewicz, A.; Kachel-Jakubowska, M.; Niedziółka, I.; Zaklika, B.; Zawiślak, K.; Nadulski, R.; Sobczak, P.; Wojdalski, J.; Mruk, R. Impact of various kinds of straw and other raw materials on physical characteristics of pellets. Rocz. Ochr. Środowiska 2017, 19, 270–287. [Google Scholar]
  5. Zawiślak, K. Przetwarzanie Ziarna Kukurydzy na cele Paszowe. In Rozprawy Naukowe; Akademia Rolnicza w Lublinie: Lublin, Poland, 2006; pp. 1–95. Available online: http://yadda.icm.edu.pl/yadda/element/bwmeta1.element.agro-article-2e48e26a-bef0-41d8-b73f-ecd603e23ba6.
  6. Mahajan, S.P. Air Pollution Control Commonwealth of Learning; Ramachandra, T.V., Ed.; Capital Publishing Company: New Delhi, India, 2006. [Google Scholar]
  7. Kuskowska, K.; Dmochowski, D. Analiza rozkładu stężeń pyłu zawieszonego frakcji PM10, PM2.5 i PM1.0 na różnych wysokościach Mostu Gdańskiego. Zesz. Nauk. SGSP 2016, 53, 101–119. [Google Scholar]
  8. Frąk, M.; Majewski, G.; Zawistowska, K. Analysis of the quantity of microorganisms adsorbed on particulate matter PM10. Sci. Rev.–Eng. Environ. Sci. 2014, 64, 140–149. [Google Scholar]
  9. Warren, K.J.; Wyatt, T.A.; Romberger, D.J.; Ailts, I.; West, W.W.; Nelson, A.J.; Nordgren, T.M.; Staab, E.; Heires, A.J.; Poole, J.A. Post-Injury and Resolution Response to Repetitive Inhalation Exposure to Agricultural Organic Dust in Mice. Safety 2017, 3, 10. [Google Scholar] [CrossRef] [PubMed]
  10. Żukiewicz-Sobczak, W.; Cholewa, G.; Krasowska, E.; Chmielewska-Badora, J.; Zwoliński, J.; Sobczak, P. Grain dust originating from organic and conventional farming as a potential source of biological agents causing respiratory diseases in farmers. Postepy Dermatol. I Alergol. 2013, 6, 358–364. [Google Scholar] [CrossRef]
  11. Niculita-Hirzel, H.; Hantier, G.; Storti, F.; Plateel, G.; Roger, T. Frequent Occupational Exposure to Fusarium Mycotoxins of Workers in the Swiss Grain Industry. Toxins 2016, 8, 370. [Google Scholar] [CrossRef]
  12. European Environment Agency. EEA 2017. Air Quality of Europe; EEA: København, Denmark, 2017; ISSN 1977-8449. Available online: https://www.eea.europa.eu/publications/air-quality-in-europe-2017. (accessed on 26 February 2019).
  13. Klimat dla Polski – Polska dla klimatu: 1988-2018-2050. Available online: www.kobize.pl/pl/fileCategory/id/1/opracowania (accessed on 26 February 2019).
  14. WHO. WHO Air Quality Guidelines for Particulate Matter, Ozone, Nitrogen Dioxide and Sulfur Dioxide; Global Update 2005; WHO: Geneva, Switzerland, 2006; Available online: http://whqlibdoc.who.int/hq/2006/WHO_SDE_PHE_OEH_06.02_eng.pdf (accessed on 26 February 2019).
  15. Ashmore, M.R.; Dimitroulopoulou, C. Personal exposure of children to air pollution. Atmos. Environ. 2009, 43, 128–141. [Google Scholar] [CrossRef]
  16. Chen, C.; Zhao, B. Review of relationship between indoor and outdoor particles: I/O ratio, infiltration factor and penetration factor. Atmos. Environ. 2011, 45, 275–288. [Google Scholar] [CrossRef]
  17. Grahame, T.J.; Schlesinger, R.B. Evaluating the health risk from secondary sulfates in Eastern North American regional ambient air particulate matter. Toxicology 2005, 17, 15–27. [Google Scholar] [CrossRef] [PubMed]
  18. Pawłowski, L. How heavy metals affect sustainable development. Rocz. Ochr. Środowiska (Annu. Set Environ. Prot.) 2011, 13, 51–64. [Google Scholar]
  19. Zwoździak, A.; Sówka, I.; Fortuna, M.; Balińska-Miśkiewicz, W.; Willak-Janc, E.; Zwoździak, J. Wpływ stężeń pyłów (PM1, PM2.5, PM10) w środowisku wewnątrz szkoły na wartości wskaźników spirometrycznych u dzieci. Rocz. Ochr. Środowiska (Annu. Set Environ. Prot.) 2013, 15, 2022–2038. [Google Scholar]
  20. Żukiewicz-Sobczak, W.; Cholewa, G.; Krasowska, E.; Chmielewska-Badora, J.; Zwoliński, J.; Sobczak, P. Rye grains and the soil derived from under the organic and conventional rye crops as a potential source of biological agents causing respiratory diseases in farmers. Postępy Dermatol. I Alergol. 2013, 6, 373–380. [Google Scholar] [CrossRef] [PubMed]
  21. Dziki, D.; Laskowski, J. Study to analyze the influence of sprouting of the wheat grain on the grinding process. J. Food Eng. 2010, 96, 562–567. [Google Scholar] [CrossRef]
  22. Hameed Hassoon, W.; Dziki, D. The Study of Multistage Grinding of Rye. In Proceedings of the IX International Scientific Symposium; Farm Machinery and Processes Management in Sustainable Agriculture, Lublin, Poland, 22–24 November 2017. [Google Scholar] [CrossRef]
  23. Polski Komitet Normalizacyjny. PN-EN ISO 712:2009. Ziarno Zbóż i Przetwory Zbożowe. Oznaczanie Wilgotności; Polski Komitet Normalizacyjny: Warszawa, Poland, 2009. [Google Scholar]
  24. Shieh, J.Y.; Ku, C.H.; Christiani, D.C. Respiratory effects of the respirable dust (PM4.0). Epidemiology 2004, 15, 4–166. [Google Scholar] [CrossRef]
  25. De Lima Gondim, F.; Lima, Y.C.; Melo, P.O.; dos Santos, G.R.; Serra, D.S.; Araújo, R.S.; de Oliveira, M.L.M.; Lima, C.C.; Cavalcante, F.S.A. Exposure to PM4.0 from the combustion of cashew nuts shell in the respiratory system of mice previously exposed to cigarette smoke. Int. J. Recent Sci. Res. 2017, 8, 16762–16769. [Google Scholar] [CrossRef]
  26. Josino, J.B.; Serra, D.S.; Gomes, M.D.M.; Araújo, R.S.; de Oliveira, M.L.M.; Cavalcante, F.S.Á. Changes of respiratory system in mice exposed to PM4.0 or TSP from exhaust gases of combustion of cashew nut shell. Environ. Toxicol. Pharmacol. 2017, 56, 1–9. [Google Scholar] [CrossRef]
  27. Polski Komitet Normalizacyjny. PN-R-64798:2009. Pasze–Oznaczanie Rozdrobnienia; Polski Komitet Normalizacyjny: Warszawa, Poland, 2009. [Google Scholar]
  28. Dacarro, C.; Grisoli, P.; Del Frate, G.; Villani, S.; Grignani, E.; Cottica, D. Micro-organisms and dust exposure in an Italian grain mill. J. Appl. Microbiol. 2004, 98, 163–171. [Google Scholar] [CrossRef]
  29. Sobczak, P.; Zawiślak, K.; Żukiewicz-Sobczak, W.; Wróblewska, P.; Adamczuk, P.; Mazur, J.; Kozak, M. Organic dust in feed industry. Pol. J. Environ. Stud. 2015, 24, 5–2177. [Google Scholar] [CrossRef]
  30. Karpaciński, E.A. Exposure to inhalable flour dust in Canadian flour mills. Appl. Occup. Environ. Hyg. 2003, 18, 1022–1030. [Google Scholar] [CrossRef] [PubMed]
  31. Buczaj, A. Poziom zapylenia w wybranych zakładach przemysłu zbożowego w województwie lubelskim. Inżynieria Rol. 2011, 1, 7–13. [Google Scholar]
  32. Zawiślak, K.; Sobczak, P.; Kozak, M.; Mazur, J.; Panasiewicz, M.; Żukiewicz-Sobczak, W.; Wojdalski, J.; Mieszkalski, L. Microbiological analysis and concentration of organic dust in an herb processing plant. Pol. J. Environ. Study 2019, 28, 1–7. [Google Scholar] [CrossRef]
  33. Directive 2008/50/EC of the European Parliament and of the Council of 21 May 2008 on ambient air quality and cleaner air for Europe OJ L. Off. J. Eur. Union 2008, 152, 1–44.
Figure 1. The layout of the dust measuring station: 1—hammer mill, 2—roller mill, 3—DustTrak II dust monitor, 4—inlet of the raw material prior to grinding, 5—outlet of the raw material after grinding, A—screen with interchangeable mesh with circular openings, B—adjustable working gap between the rollers.
Sustainability 11 04572 g001
Figure 2. The distribution of organic dust concentration during grinding using the hammer mill in relation to the moisture content and the size of the openings in the screen.
Sustainability 11 04572 g002
Figure 3. Distribution of organic dust concentration during grinding using the roller mill depending on the moisture content and the size of the working gap between the rollers.
Sustainability 11 04572 g003
Table 1. Description of the designations used in this work.
DesignationDescriptionDesignationDescription
W9-h3Grain moisture content of 9%, the diameter of openings in the screen of the mill equal to 3 mmW9-h0.4Grain moisture content of 9%, the working gap between rollers of the mill equal to 0.4 mm
W9-h5Grain moisture content of 9%, the diameter of openings in the screen of the mill equal to 5 mmW9-h0.7Grain moisture content of 9%, the working gap between rollers of the mill equal to 0.7 mm
W9-h8Grain moisture content of 9%, the diameter of openings in the screen of the mill equal to 8 mmW9-h1Grain moisture content of 9%, the working gap between rollers of the mill equal to 1 mm
W14-h3Grain moisture content of 14%, the diameter of openings in the screen of the mill equal to 3 mmW14-h0.4Grain moisture content of 14%, the working gap between rollers of the mill equal to 0.4 mm
W14-h5Grain moisture content of 14%, the diameter of openings in the screen of the mill equal to 5 mmW14-h0.7Grain moisture content of 14%, the working gap between rollers of the mill equal to 0.7 mm
W14-h8Grain moisture content of 14%, the diameter of openings in the screen of the mill equal to 8 mmW14-h1Grain moisture content of 14%, the working gap between rollers of the mill equal to 1 mm
W18-h3Grain moisture content of 18%, the diameter of openings in the screen of the mill equal to 3 mmW18-h0.4Grain moisture content of 18%, the working gap between rollers of the mill equal to 0.4 mm
W18-h5Grain moisture content of 18%, the diameter of openings in the screen of the mill equal to 5 mmW18-h0.7Grain moisture content of 18%, the working gap between rollers of the mill equal to 0.7 mm
W18-h8Grain moisture content of 18%, the diameter of openings in the screen of the mill equal to 8 mmW18-h1Grain moisture content of 18%, the working gap between rollers of the mill equal to 1 mm
Table 2. Statistical analysis of dust concentration PM1.0 during grinding.
MillMoisture Content of the Raw Material [%]Screen [mm]Max. [μg·m−3]Min. [μg·m−3]Dusts Average [μg·m−3]Dusts—S.D.Homogeneous Group
Hammer mill-Control503338.74.4
93121698414.3
5826977.53.7d
8775965.34c
143715763.64.4c
5665155.92.9b
8493942.22b
183776369.43.6
5837277.72.6d
89266745.5d
Roller mill-Control392527.13a
90.4392832.33.2
0.7292627.70.9a
1362628.62a
140.4685156.23.8
0.7585254.91.6b
1565254.21b
180.4524348.61.9
0.7382931.61.9
1342830.71.6a
Table 3. Statistical analysis of dust concentration PM4.0 during grinding.
MillMoisture Content of the Raw Material [%]Screen [mm]Max. [μg·m−3]Min. [μg·m−3]Dusts Average [μg·m−3]Dusts—S.D.Homogeneous Group
Hammer mill-Control140106120.47.5b
93530344421.646.9d
5463404423.615.5d
8375307345.817.1c
143354234272.226.7
5213156183.115.6
813181110.715b
183445342391.528.9
545139142115d
835929633513.6c
Roller mill-Control553741.93.7
90.41054257.715.8
0.7654957.64.5
1844863.19.5a
140.4907582.34.1
0.71047486.88.7
1947886.23.9
180.49468816.1
0.7755665.45
1695361.34.6a
Table 4. Statistical analysis of dust concentration PM10 during grinding.
MillMoisture Content of the Raw Material [%]Screen [mm]Max. [mg·m−3]Min. [mg·m−3]Dusts Average [mg·m−3]Dusts—S.D.Homogeneous Group
Hammer mill-Control294158200.330.4
9312008321011.987.7
5837670746.643.8c
8698552620.332.9
143795647720.948.1c
5460297387.240
8314184262.835.7
1831020702842.363.5
5811637730.941c
8667525583.239.4
Roller mill-Control865468.88.8a
90.416078113.118.7
0.71578011118.7
115090102.813.6a,b
140.4165106129.316.9b
0.7178134154.513.5
1161100129.616.1
180.4129104117.48
0.71448611918
112872105.314b
Table 5. The average size of particles and the share of the finest fraction in ground middlings from hammer and roller mill.
Hammer millW9-h3W9-h5W9-h8W14-h3W14-h5W14-h8W18-h3W18-h5W18-h8
The share particles smaller than 0.1 mm [%]3.981.080.61.99 0.510.311.780.340.06
The average size of particles [mm]0.5630.9751.0940.6511.0671.3090.6091.1061.693
Roller millW9-h0.4W9-h0.7W9-h1W14-h0.4W14-h0.7W14-h1W18-h0.4W18-h0.7W18-h1
The share particles smaller than 0.1 mm [%]2.781.571.71.260.460.240.380.220.14
The average size of particles [mm]1.0031.3341.9421.9282.5212.8772.7752.9552.997

