Efficiency Evaluation of Atmospheric Pollutants Emission in Zhejiang Province China: A DEA-Malmquist Based Approach

1
Department of Public Course Teaching, Ningbo Polytechnic, Ningbo 315800, Zhejiang, China
2
School of International Business & Languages, Ningbo Polytechnic, Ningbo 315800, Zhejiang, China
3
Institue of Environmental Economics Research, Ningbo Polytechnic, Ningbo 315800, Zhejiang, China
*
Author to whom correspondence should be addressed.
Sustainability 2019, 11(17), 4544; https://doi.org/10.3390/su11174544
Submission received: 30 June 2019
/
Revised: 7 August 2019
/
Accepted: 16 August 2019
/
Published: 21 August 2019
Abstract
:In order to sustainably and reasonably evaluate the characteristics and efficiency of regional atmospheric environment, this paper calculated the atmospheric environmental efficiency and regional differences, which is based on the non-radial directional distance function DEA model, among 11 cities in Zhejiang Province from 2006 to 2016 in both static and dynamic dimensions. Compared with existing researches, the atmospheric environmental efficiency evaluation system constructed in this paper not only considered the development of regional economy, but also focused on the air quality output so as to constrain the emission of atmospheric pollutants. The results showed that the average value of the static efficiency of atmospheric environment in Zhejiang was 0.6824 over the past ten years, and there was still about 32 percentage difference from the production frontier. The room for improvement in pollution reduction and control was still huge. The pure technical efficiency was the main factor to impede the improvement of atmospheric environment’s static efficiency in Zhejiang. Meanwhile the dynamic efficiency of atmospheric environment in Zhejiang reached an average annual rate of 7.60%, with a cumulative increase of 93.28%. As well, there were significant urban differences in the growth rate, of which Hangzhou was the fastest, followed by Ningbo and Jiaxing. The improvement of atmospheric environmental efficiency was mainly driven by technological advancement and scale efficiency expansion. The distribution of 11 cities in the four high and low environmental efficiency matrices was relatively uniform, and there was no “Matthew Effect” of H/H or L/L polarization. In the future, Zhejiang needs to formulate corresponding measures to control the atmospheric pollution by fully considering the actual conditions at different cities, and effectively strengthen the environmental management exchanges and collaboration within the province to enhance the overall atmospheric environment efficiency.
1. Introduction
Sustainable atmospheric environmental efficiency evaluation is an important prerequisite for realizing regional pollutant emission reduction and policy formulation and is also a critical link to improve the level of regional environmental management [1]. In China, where industrialization and urbanization are advancing, the deterioration of the air environment represented by smog pollution has hindered the construction of ecological civilization and the high-quality development of the economy. Therefore, how to maintain an effective control of atmospheric pollution and achieve simultaneous and coordinate the improvement of environment with development of economy is of great significance [2,3].
In 1998, the Organization for Economic Co-operation and Development (OECD) first proposed the use of eco-efficiency to reflect the level of environmental performance of production units and apply them to environmental management and decision-making processes [4]. Subsequently, the study of the regional environmental sustainability level from the perspective of efficiency has attracted the attention of many scholars and corporate decision makers [5,6,7,8]. In order to effectively curb the increasingly serious air pollution problem, an increasing numbers of scholars over recent years have begun to pay attention to research areas on economy and management such as air pollution control and atmospheric environmental efficiency. In 2012, Wang Qi and other scholars took the lead in using the ultra-efficient DEA model to evaluate the efficiency of air pollution control [9]. The evaluation of atmospheric environmental efficiency stems from the deepening and expansion of environmental efficiency evaluation in the atmospheric field and is intended to explore the air pollution cost of economic development [10,11,12]. From the perspective of evaluation indicators, the DEA analysis framework based on input-output indicators can be divided into two categories. The first always views atmospheric pollutant emission as an undesired output indicator [11,13], while labor, capital, energy and other factors are considered as input indicators. It is intended to increase expected output while reducing unintended output and resource input [9]. For example, in some empirical studies, CO2 emissions are often taken as output objects of pollutants [14,15,16], while SO2, NOx, and smoke & dust are included in undesired output indicators gradually [13,17,18,19]. On the contrary, many scholars hold the view that air pollutant emissions are used as input indicators and GDP as an indicator of economic output. Considering that the emission of atmospheric pollutants cannot be completely avoided in the process of economic activities, to some extent, the pollutant itself is also an input, so it is reasonable to regard it as an input variable [10]. For instance, Wang Bo’s comparative study found that when pollutants are used as input variables, the constraints are more stringent and the decision-making unit is more likely to improve [20]. Therefore, many scholars often use atmospheric pollutant emissions as input indicators in empirical research to conduct empirical measures of atmospheric environmental performance [21,22], atmospheric environmental efficiency [11,19,23,24] and measure and analysis of atmospheric pollution emission efficiency [25,26,27]. From the evaluation method, the environmental efficiency measure based on the data envelopment analysis (DEA) method and its improved model is widely used [28,29,30]. After Charnes et al. proposed the DEA method in 1978 [31], from the traditional radial framework to the non-radial framework considering slack variables, different scholars have proposed improved models such as the SBM (Slacks-Based Measure)-DEA model [32,33], Super-SBM model [10,34,35], and non-radial directional distance function (NRDDF) DEA model [11,25]. These models focus on the combination of static efficiency and dynamic efficiency analysis in empirical measures. The Malmquist productivity index [36,37,38] and the Luenberger productivity index method [25,39] are used to decompose the technical efficiency, technological progress and scale efficiency index of dynamic efficiency in detail. From the research object and scale, considering the continuity and availability of data, the macroscopic research of the national level [1,15] and provincial level [2,8,19,40,41] has received widespread attention from scholars. In the meantime, research area has gradually turned to the empirical analysis of the mesoscopic aspects of specific objects such as major industrial provinces [25], the Yangtze River Economic Zone [10], and a certain province [42], but in-depth comparative studies at the city level are still few, this will not be conducive to the sustainable development of urban air environment management.
Overall, this paper selects Zhejiang Province, an important economic province in the southeastern coastal areas, and also one of the key areas of environmental protection and pollution prevention and control, as the research object to build a new atmospheric environmental efficiency evaluation system, which is in obtaining economic and air quality output while reducing the input of pollutants per unit of atmospheric environmental pollutants. Based on the non-radial DEA model of Malmquist index, the atmospheric environmental efficiency of Zhejiang Province and 11 cities between 2006–2016 is measured from static and dynamic dimensions. And from the single atmospheric pollutant perspective decomposition efficiency index, this paper obtains the factors affecting the atmospheric environment efficiency of different cities, and then provide reference for the optimization of air pollutant emission reduction and regional environmental strategy in Zhejiang Province.
Compared with the existing research results, the main contributions of this paper are as follows: (1) The non-radial DEA method has outstanding advantages in studying atmospheric environmental efficiency and is widely used, but more attention is paid to economic indicators (GDP) in the selection of indicators. As the output impact of air quality has been neglected, this paper constructs a new atmospheric environmental efficiency evaluation system, which is to reduce the input of pollutants per unit of atmospheric environmental pollutants while obtaining economic and air quality output; (2) Combining the static atmospheric environmental efficiency assessment with the dynamic environmental efficiency assessment can effectively and systematically identify the environmental efficiency levels and the variance in different cities, and contribute to the establishment of local atmospheric environmental governance strategies and sustainable development systems; (3) Compared with national large-scale research, the evaluation of urban atmospheric environmental efficiency in typical areas can meet the specific implementation of the “National---Provincial---City level ” air pollution control plan, and provide evidence for atmospheric environment control at the city-level.
2. Method and Model
2.1. The Input and Output Indicators
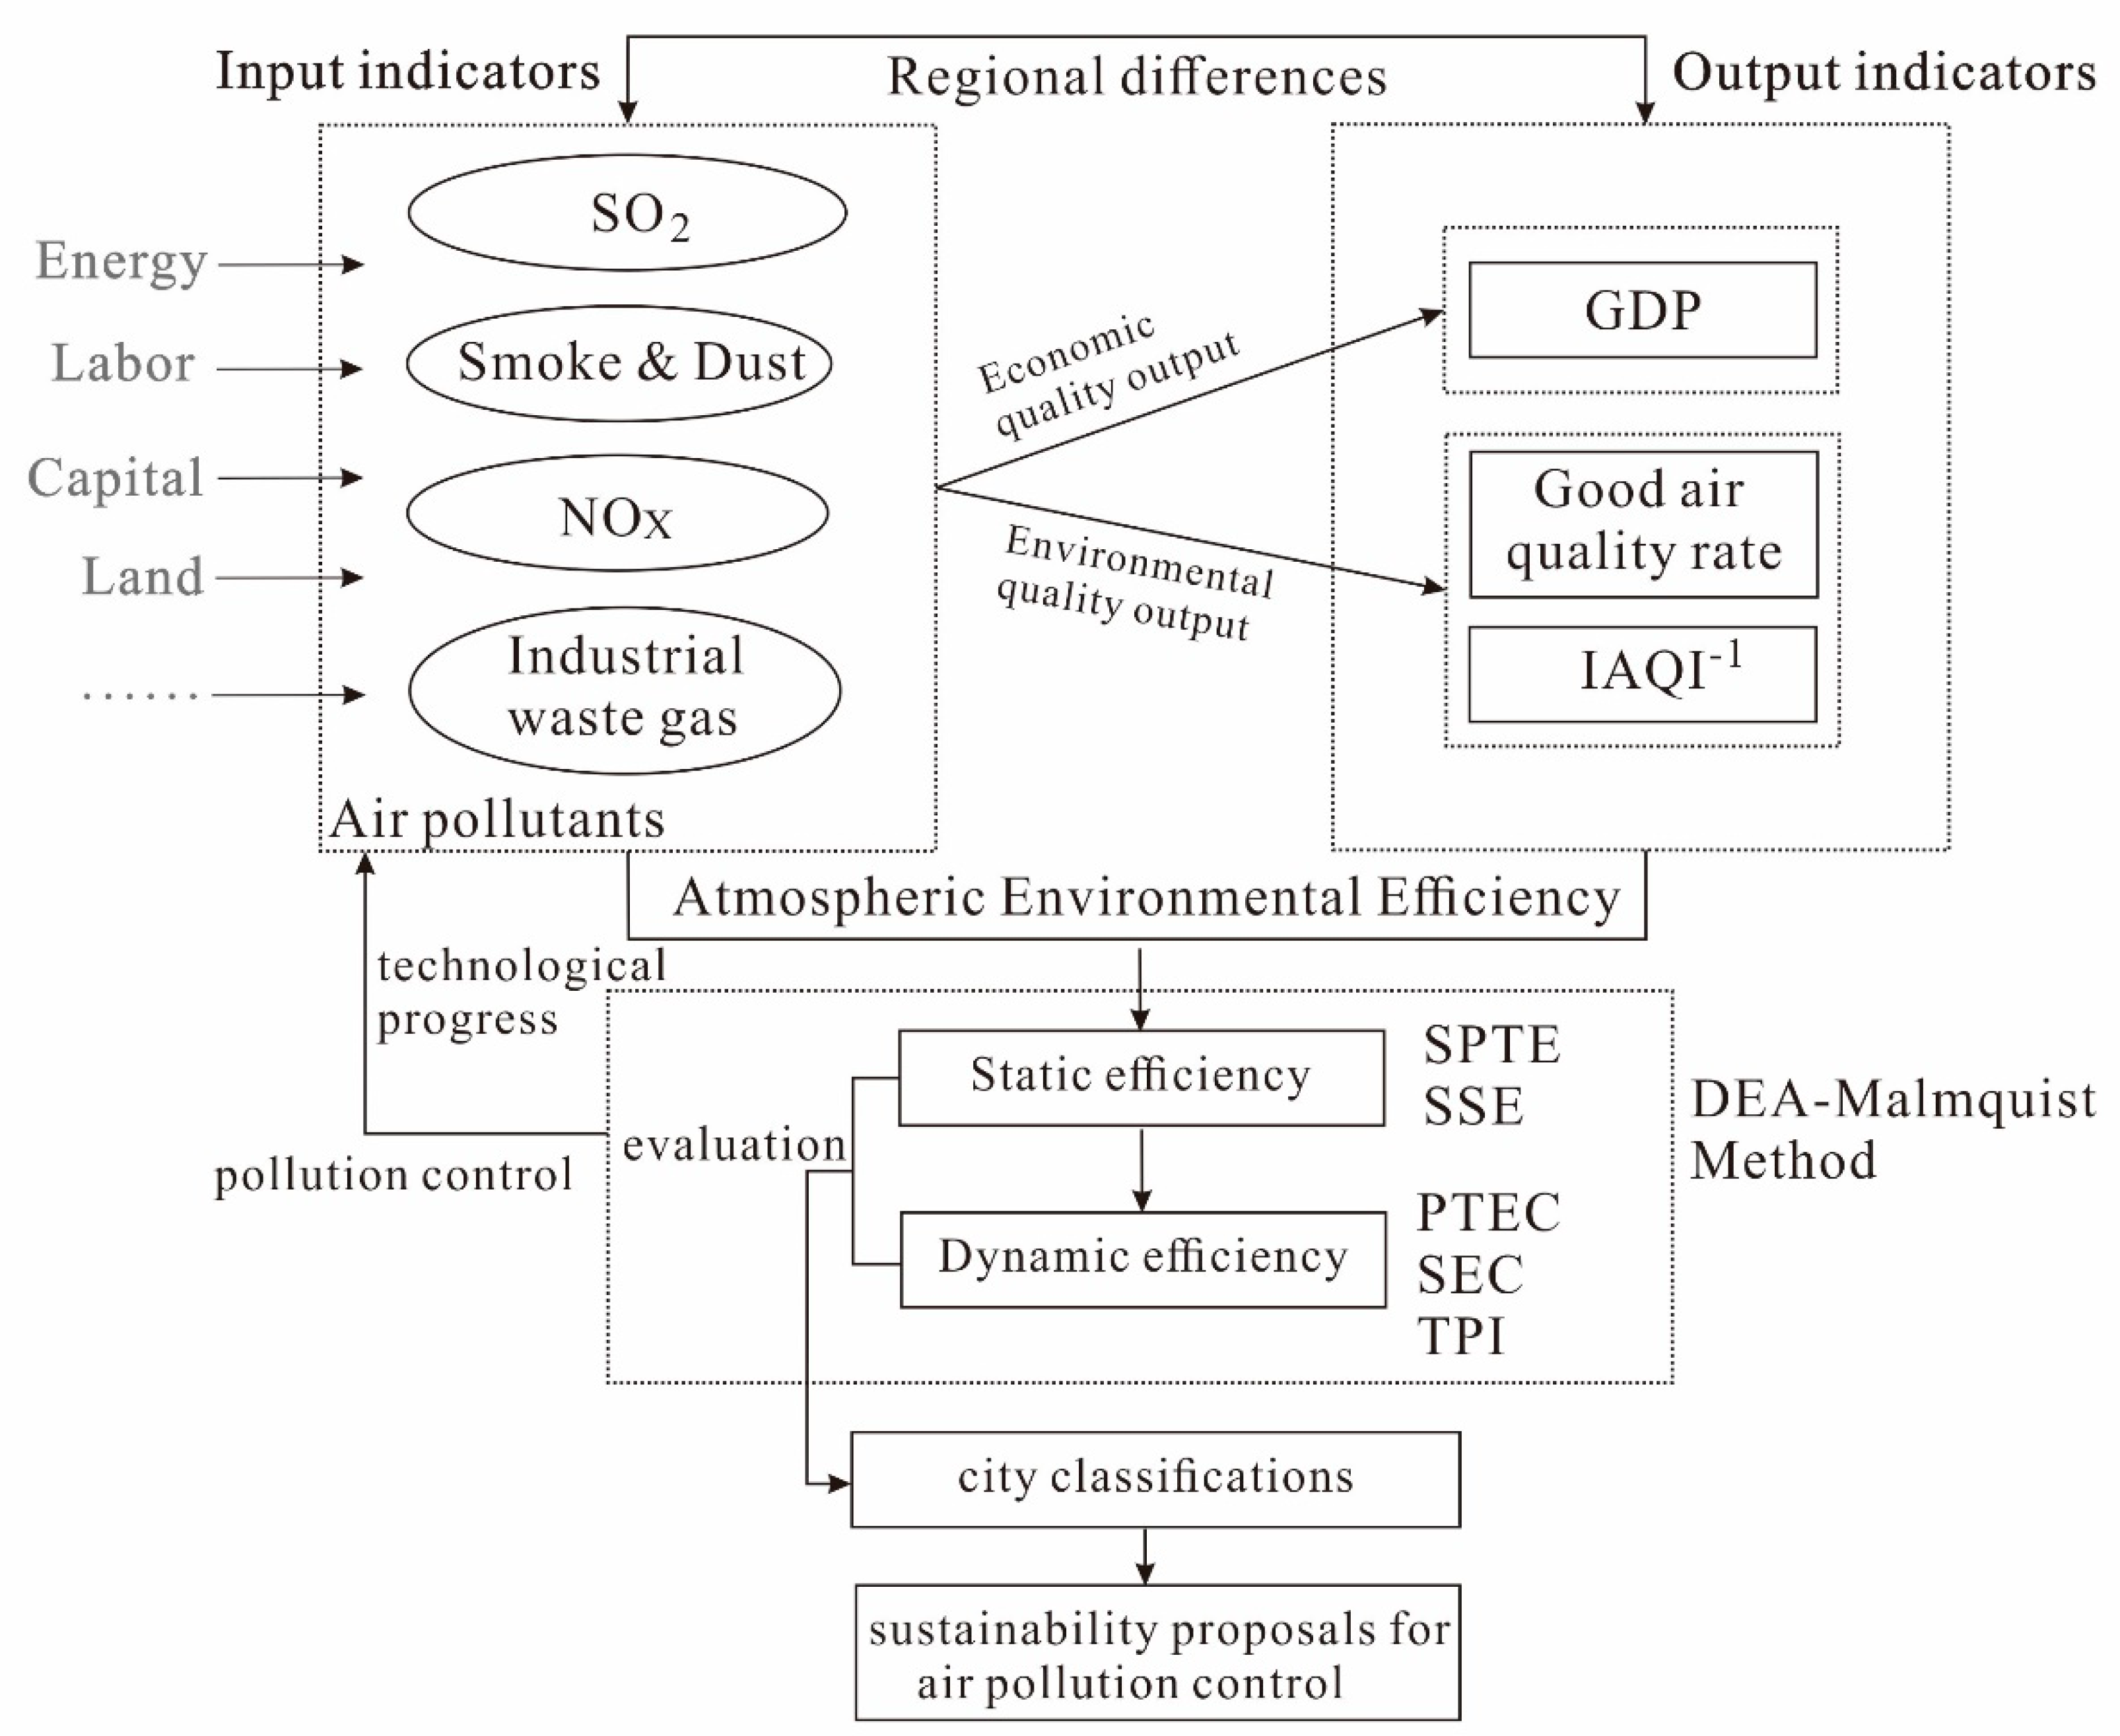
Previous studies have shown that environmental efficiency refers to the environmental cost of economic development [9,12]. Atmospheric environmental efficiency refers to the atmospheric environmental cost (pollutant emissions) that regional producers use in economic activities by using various factors for a certain period of time. The assessment of atmospheric environmental efficiency reflects the input and output relationship among regional air pollution emissions, economic and environmental benefits. Here, the DEA method is used to solve the problem, and the Sulfur dioxide emissions (SO2), smoke & dust emissions, Nitrogen oxides emissions (NOx), and total industrial exhaust emissions are taken as input indicators (Table 1). The urban Gross Domestic Product (GDP, the key index to measure area economy development), good air quality rate, and urban environmental air quality index (IAQI) [43,44,45] are used as output indicators. Among the output indicators, the good air quality rate and the IAQI index are the most direct factors for measuring air environmental benefits. The good air quality rate refers to the number of days per year that meet the secondary National Ambient Air Quality Standards (GB3095-2012). IAQI is an alternative Nemerow index and reflects both maximum and average values of concentrations of pollutants relative to their objective air quality standard [43,44]. To maintain the positiveness of the output indicators (the greater the output value, the better the system efficiency), the reciprocal form of IAQI is chosen as the actual calculation of ambient air quality.
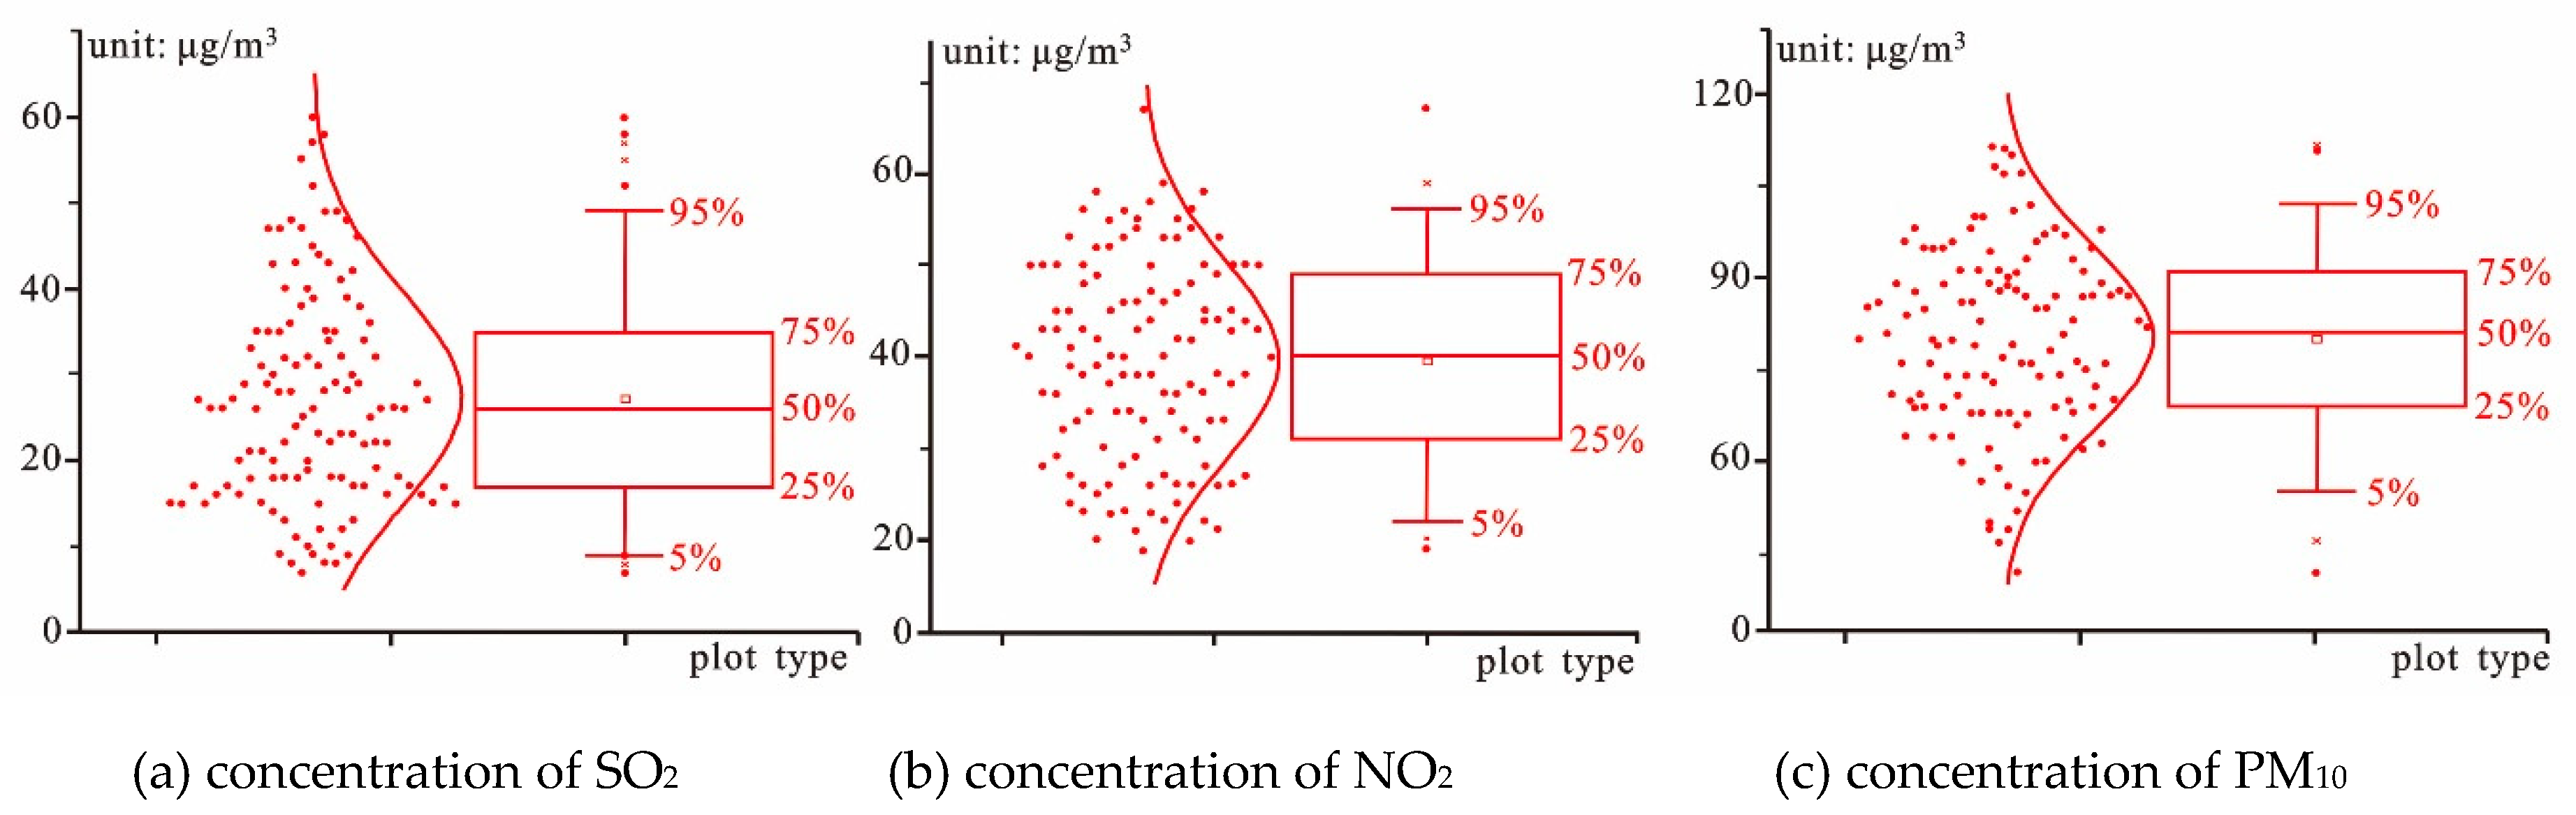
Note: IAQI’s urban air quality comprehensive index is calculated based on the annual average mass concentration of three conventional pollutants of SO2, NO2 and PM10 (taking into account that PM2.5 is mainly included in the monitoring scope after 2012, the monitoring time varies from city to city. The data is missing, so it is not included in the calculation index), their scatter plot distribution shown in Figure 1. As well, they are evaluated by the secondary standard limit of Ambient Air Quality Standard (GB3095-2012). The specific calculation process is based on the references [43,44,45].
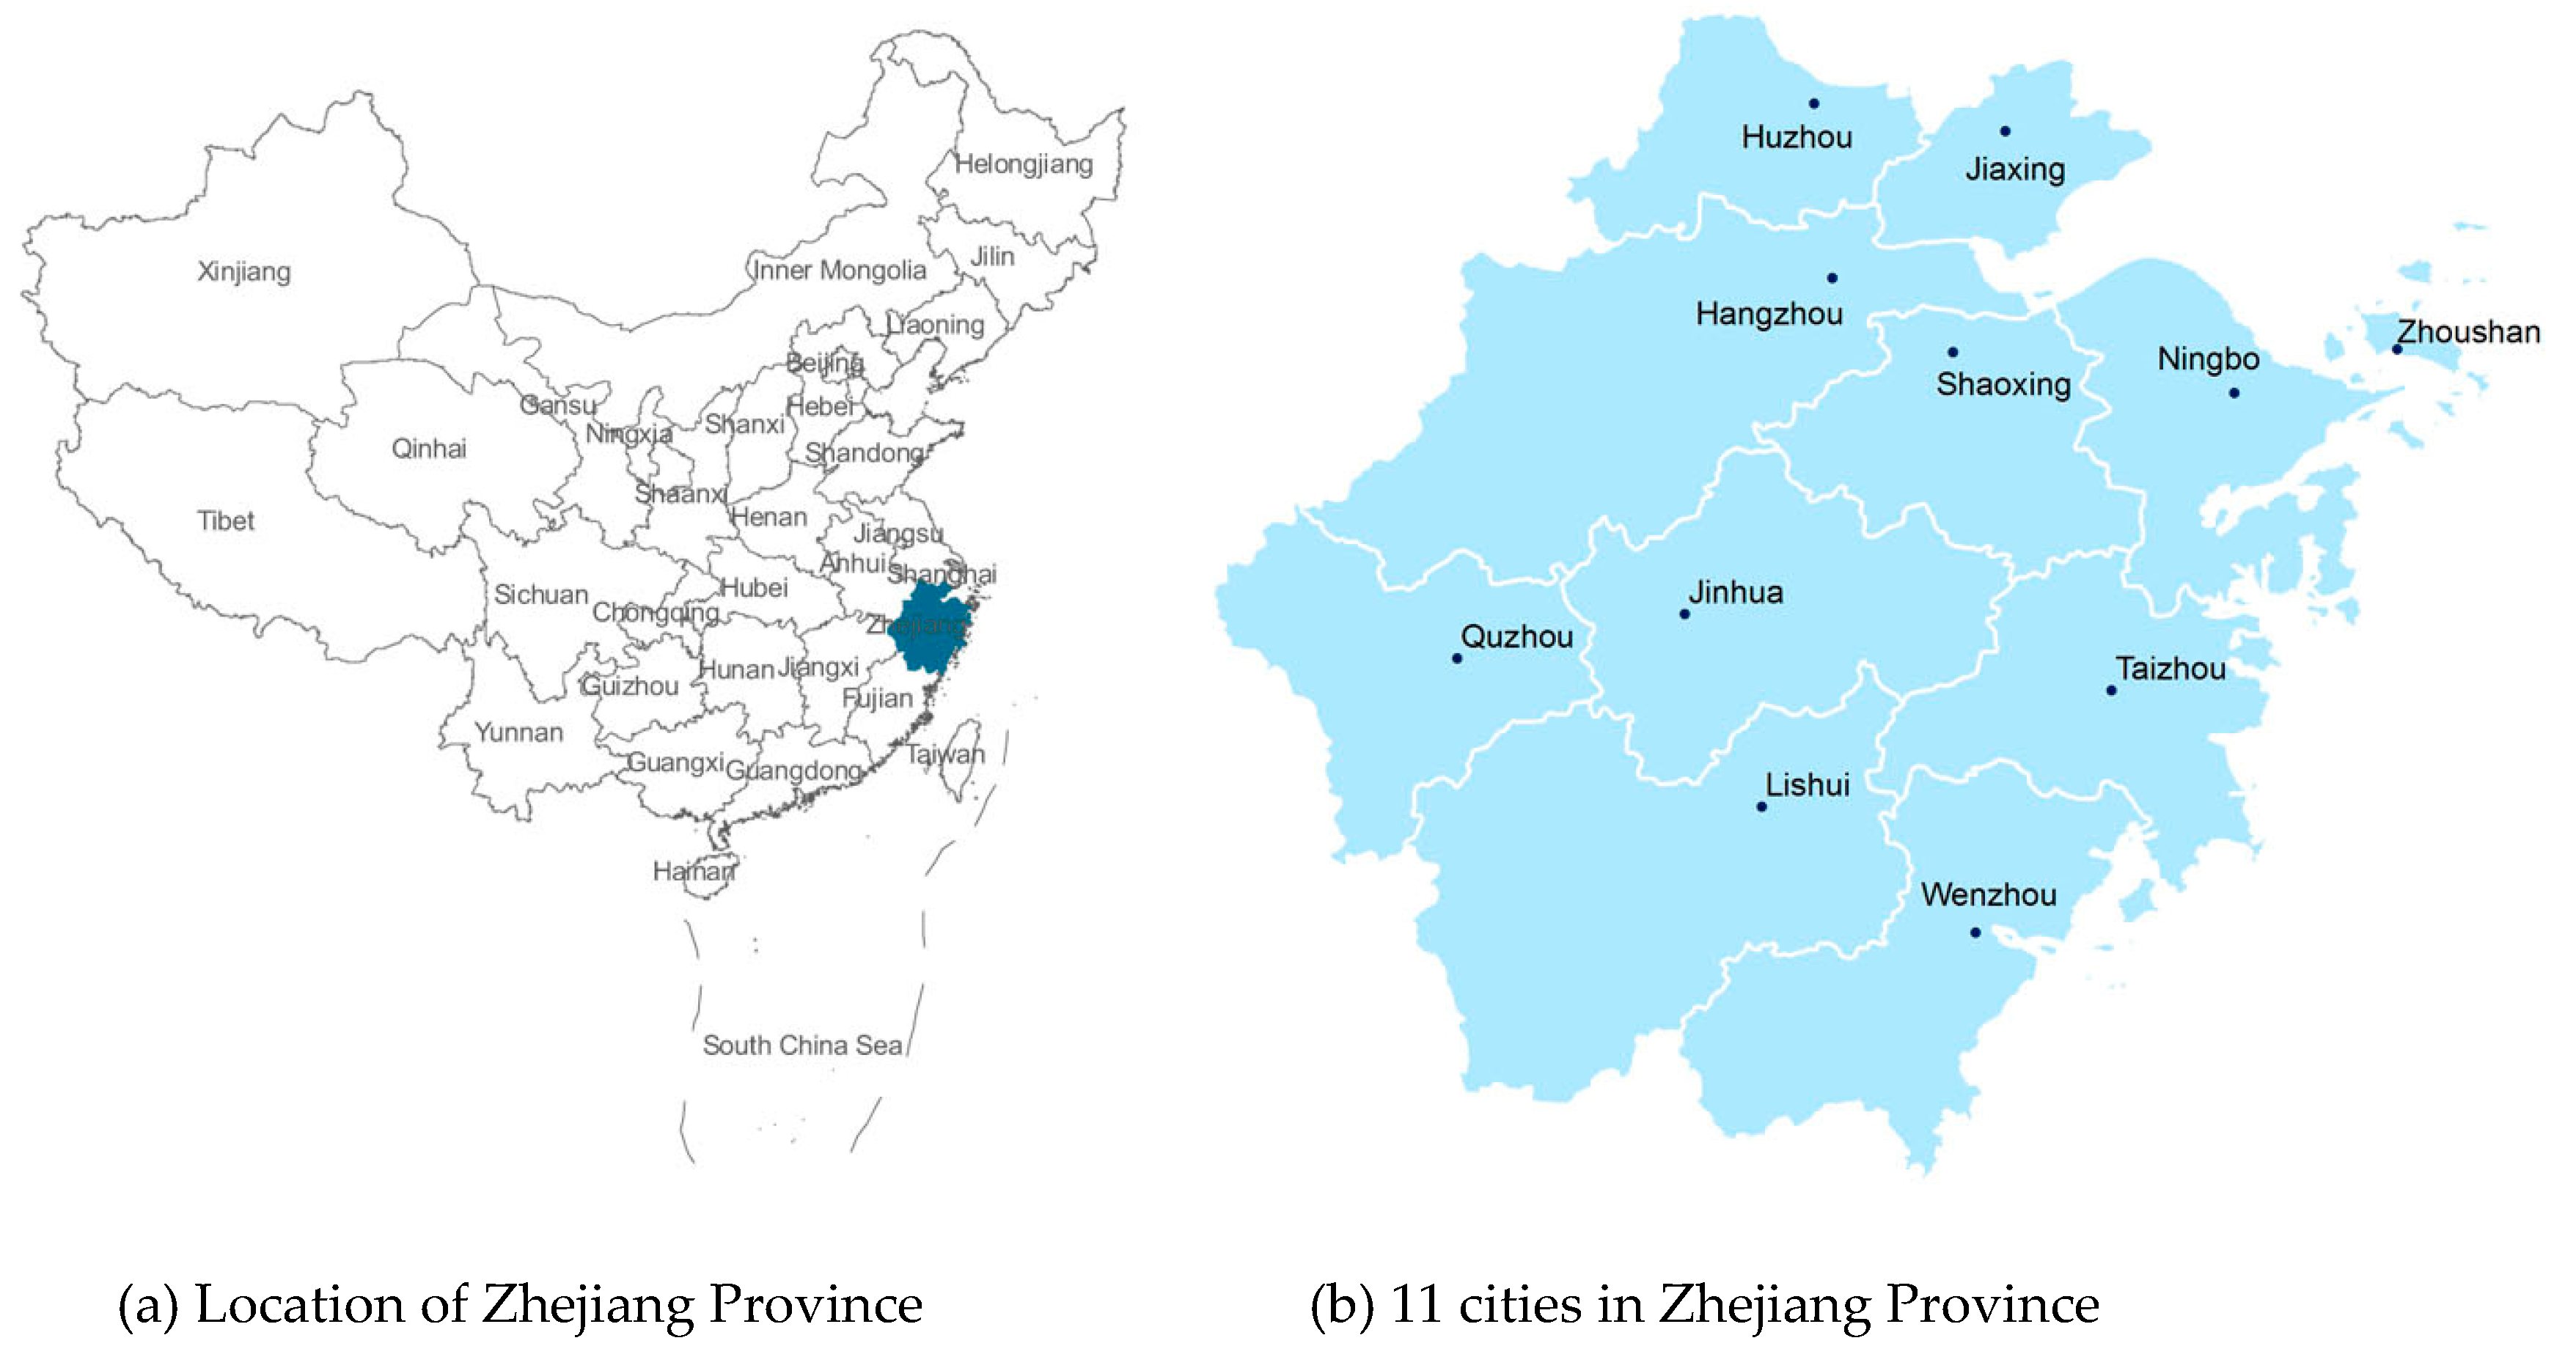
Based on the availability of indicators’ data, 11 prefecture-level cities in Zhejiang Province were selected as the decision-making units of the study (Figure 2), with time spans from 2006 to 2016. The indicator data mainly comes from the Zhejiang Statistical Yearbook (2007–2017) [46], Zhejiang Natural Resources and Environment Statistical Yearbook (2007–2017) [47], Zhejiang Environmental Quality Report (2001–2005, 2006–2010 and 2011–2016) [48], few additional data are available on Zhejiang and 11 cities’ Environmental Quality Bulletin, as well as related official government websites.
2.2. Non-Radial DEA Model Based on Malmquist Index
Data Envelopment Analysis (DEA) is often used to evaluate the efficiency of Decision-Making Units (DMU) with multiple inputs and multiple outputs [31].
The principle of the method is mainly to determine the relatively effective production frontier surface by means of mathematical programming and statistical data by keeping the input or output of the decision unit unchanged. Each decision unit is further projected onto the production front surface, and their relative effectiveness is evaluated by comparing the degree to which the decision unit deviates from the front surface. The DEA method measures relative efficiency, and there is no need to dimensionless process the data before applying it. The most basic DEA models are the CCR model and the BCC model. Among them, the CCR model is based on the assumption that the production process is a constant scale income, that is, when the input amount increases in equal proportion, the output should increase in equal proportion. The CCR model calculates the efficiency value of the decision unit through the following linear programming:
In actual production, there may be a state of increasing returns to scale or diminishing returns to scale. In order to analyze the change in the scale return of the decision unit, the efficiency value can be calculated by the following BBC model under the assumption that the scale returns are variable:
The technical efficiency defined by the above two equations is input-oriented efficiency, which mainly measures the difference between the actual input cost of a decision unit and the minimum input cost that can be achieved under the same output. Output-oriented DEA primarily measures the difference between the actual output of a decision-making unit and the maximum output that can be achieved, given the input. The output-oriented CCR model and the BCC model are planned as follows. The technical efficiency value can be obtained by calculating :
The traditional DEA models such as the traditional CCR model [31] and the BCC model [49] have two obvious shortcomings. Firstly, the efficiency evaluation is based on the radial measure, that means the input or output is required to be reduced or expanded in the same proportion. When there is input or output slack, the efficiency value will be biased. Secondly, the two models can only measure the overall efficiency of the decision-making unit from the static dimension, and cannot process the panel data to obtain the dynamic efficiency change trend of the decision-making unit. Therefore, we select the non-radial measure DEA model based on the Malmquist index to solve the above two problems [50,51]. As well, static efficiency analysis and dynamic efficiency change analysis were adopted to reveal the characteristics and trends of efficiency variation of decision-making units (Figure 3).
2.2.1. Non-Radial Measure DEA Model
Suppose there are decision-making units, if which has inputs, outputs. The token is used to represent the i-th input of the j-th decision-making unit, and is used to represent the l-th output of the j-th decision-making unit. We introduce the following non-radial DEA model based on slack variables to calculate the efficiency of the k-th decision-making unit:
where the , are the slack vectors of input and output, is the environmental efficiency of the k-th decision-making unit, is the efficiency of the i-th input, that is, the environmental efficiency of the i-th air pollutant by the k-th decision-making unit. The total environmental efficiency is obtained by the mean of the environmental efficiency of each air pollutant. According to the model, the static efficiency of the atmospheric environment (ST) in each city can be obtained by calculating . It is mainly used to measure the relative effectiveness of each city in the atmospheric environment and sustainable development. As well, it can be further decomposed into the efficiency of various single pollutants.
In the above model, let ,, then we can think of as a virtual DMU. Since the and are the slack vectors of input and output, so we have: ,, that means the input of the virtual DMU is not higher than the input of the k-th decision-making unit, and the output is not lower than the output of the k-th decision-making unit. For ∀i, is greater than 0 known by the model, when , are 0 and for ∀i, is 1, the k-th decision-making unit is DEA effective. The virtual DMU , , constructed by the optimal solution, is the effective target value of the evaluated DMU.
In addition, the above model is carried out under the assumption of constant returns to scale (CRS), and the obtained efficiency is the comprehensive efficiency (T). If the constraint of is added, the model is carried out under the assumption of variable returns to scale (VRS), and the obtained efficiency is pure technical efficiency (SPTE). Further, we can separate scale efficiency (SSE), and thus judge the technical effectiveness and scale effectiveness of air pollution control in each city [25]. The specific model is run in MATLAB software, n is 11 cities, m is 4 input indicators, and s is 3 output indicators.
2.2.2. Malmquist Productivity Index Model Method and Decomposition
The above method Equation (1) is based on static dimensions, and its efficiency index can only reflect the relative effectiveness of different decision-making units in the same period. However, the measurement of the change trend of decision-making efficiency between different periods needs to be realized by dynamic analysis. This paper introduces the Malmquist Productivity Index for the measurement of dynamic efficiency [38,52]. Refer to the Malmquist Productivity Index constructed by Caves et al. [50] as a measure of total factor productivity (T) change from period to period :
where denotes the validity of the period when the DMU uses the technology of the period as a reference, denotes the validity of the period when the DMU uses the technology of the period as a reference.
When the Malmquist index is greater than 1, it indicates that the total factor productivity (T) from period t to period t + 1 has a positive growth. Thus, Equation (2) can be further decomposed into:
where represents the technical efficiency change index (TEC), if TEC > 1, it indicates that the technical efficiency of the decision-making unit is continuously improving and approaching the production front, otherwise the existing technology cannot be fully utilized. The represents the technology progress change index (TPI). If TPI > 1, it indicates that the air pollution control of the decision-making unit has technological innovation or progress, and if TPI < 1, it indicates that the air pollution control of the decision-making unit has technological retrogression.
According to Fare et al. [36], in the case of variable returns to scale (VRS), technical efficiency change (TEC) can be further decomposed into pure technical efficiency change index (PTEC) and scale efficiency change index (SEC). Therefore, Equation (3) eventually can be decomposed into:
which is: T = PTEC × SEC × PTI
2.2.3. Non-Radial Measure DEA Model Based on Malmquist Index
In the DEA measure modal based on the Malmquist index, the distance function is the efficiency value of the DMU [7,53], which can be obtained by the following four linear programming models:
In each model, if we increase the constraint of variable scale returns, we can further obtain the total factor productivity change index (T), technical efficiency change (TEC), the pure technical efficiency change index (PTEC), and the scale efficiency change index (SEC).
3. Results
3.1. Static Efficiency of Atmospheric Environment in Zhejiang and its Reginal Difference
Based on Equation (4), the static results of atmospheric environmental efficiencies in 11 cities in Zhejiang Province from 2006 to 2016 were calculated with DEA model. The results were show in the Table 2 and Figure 4.
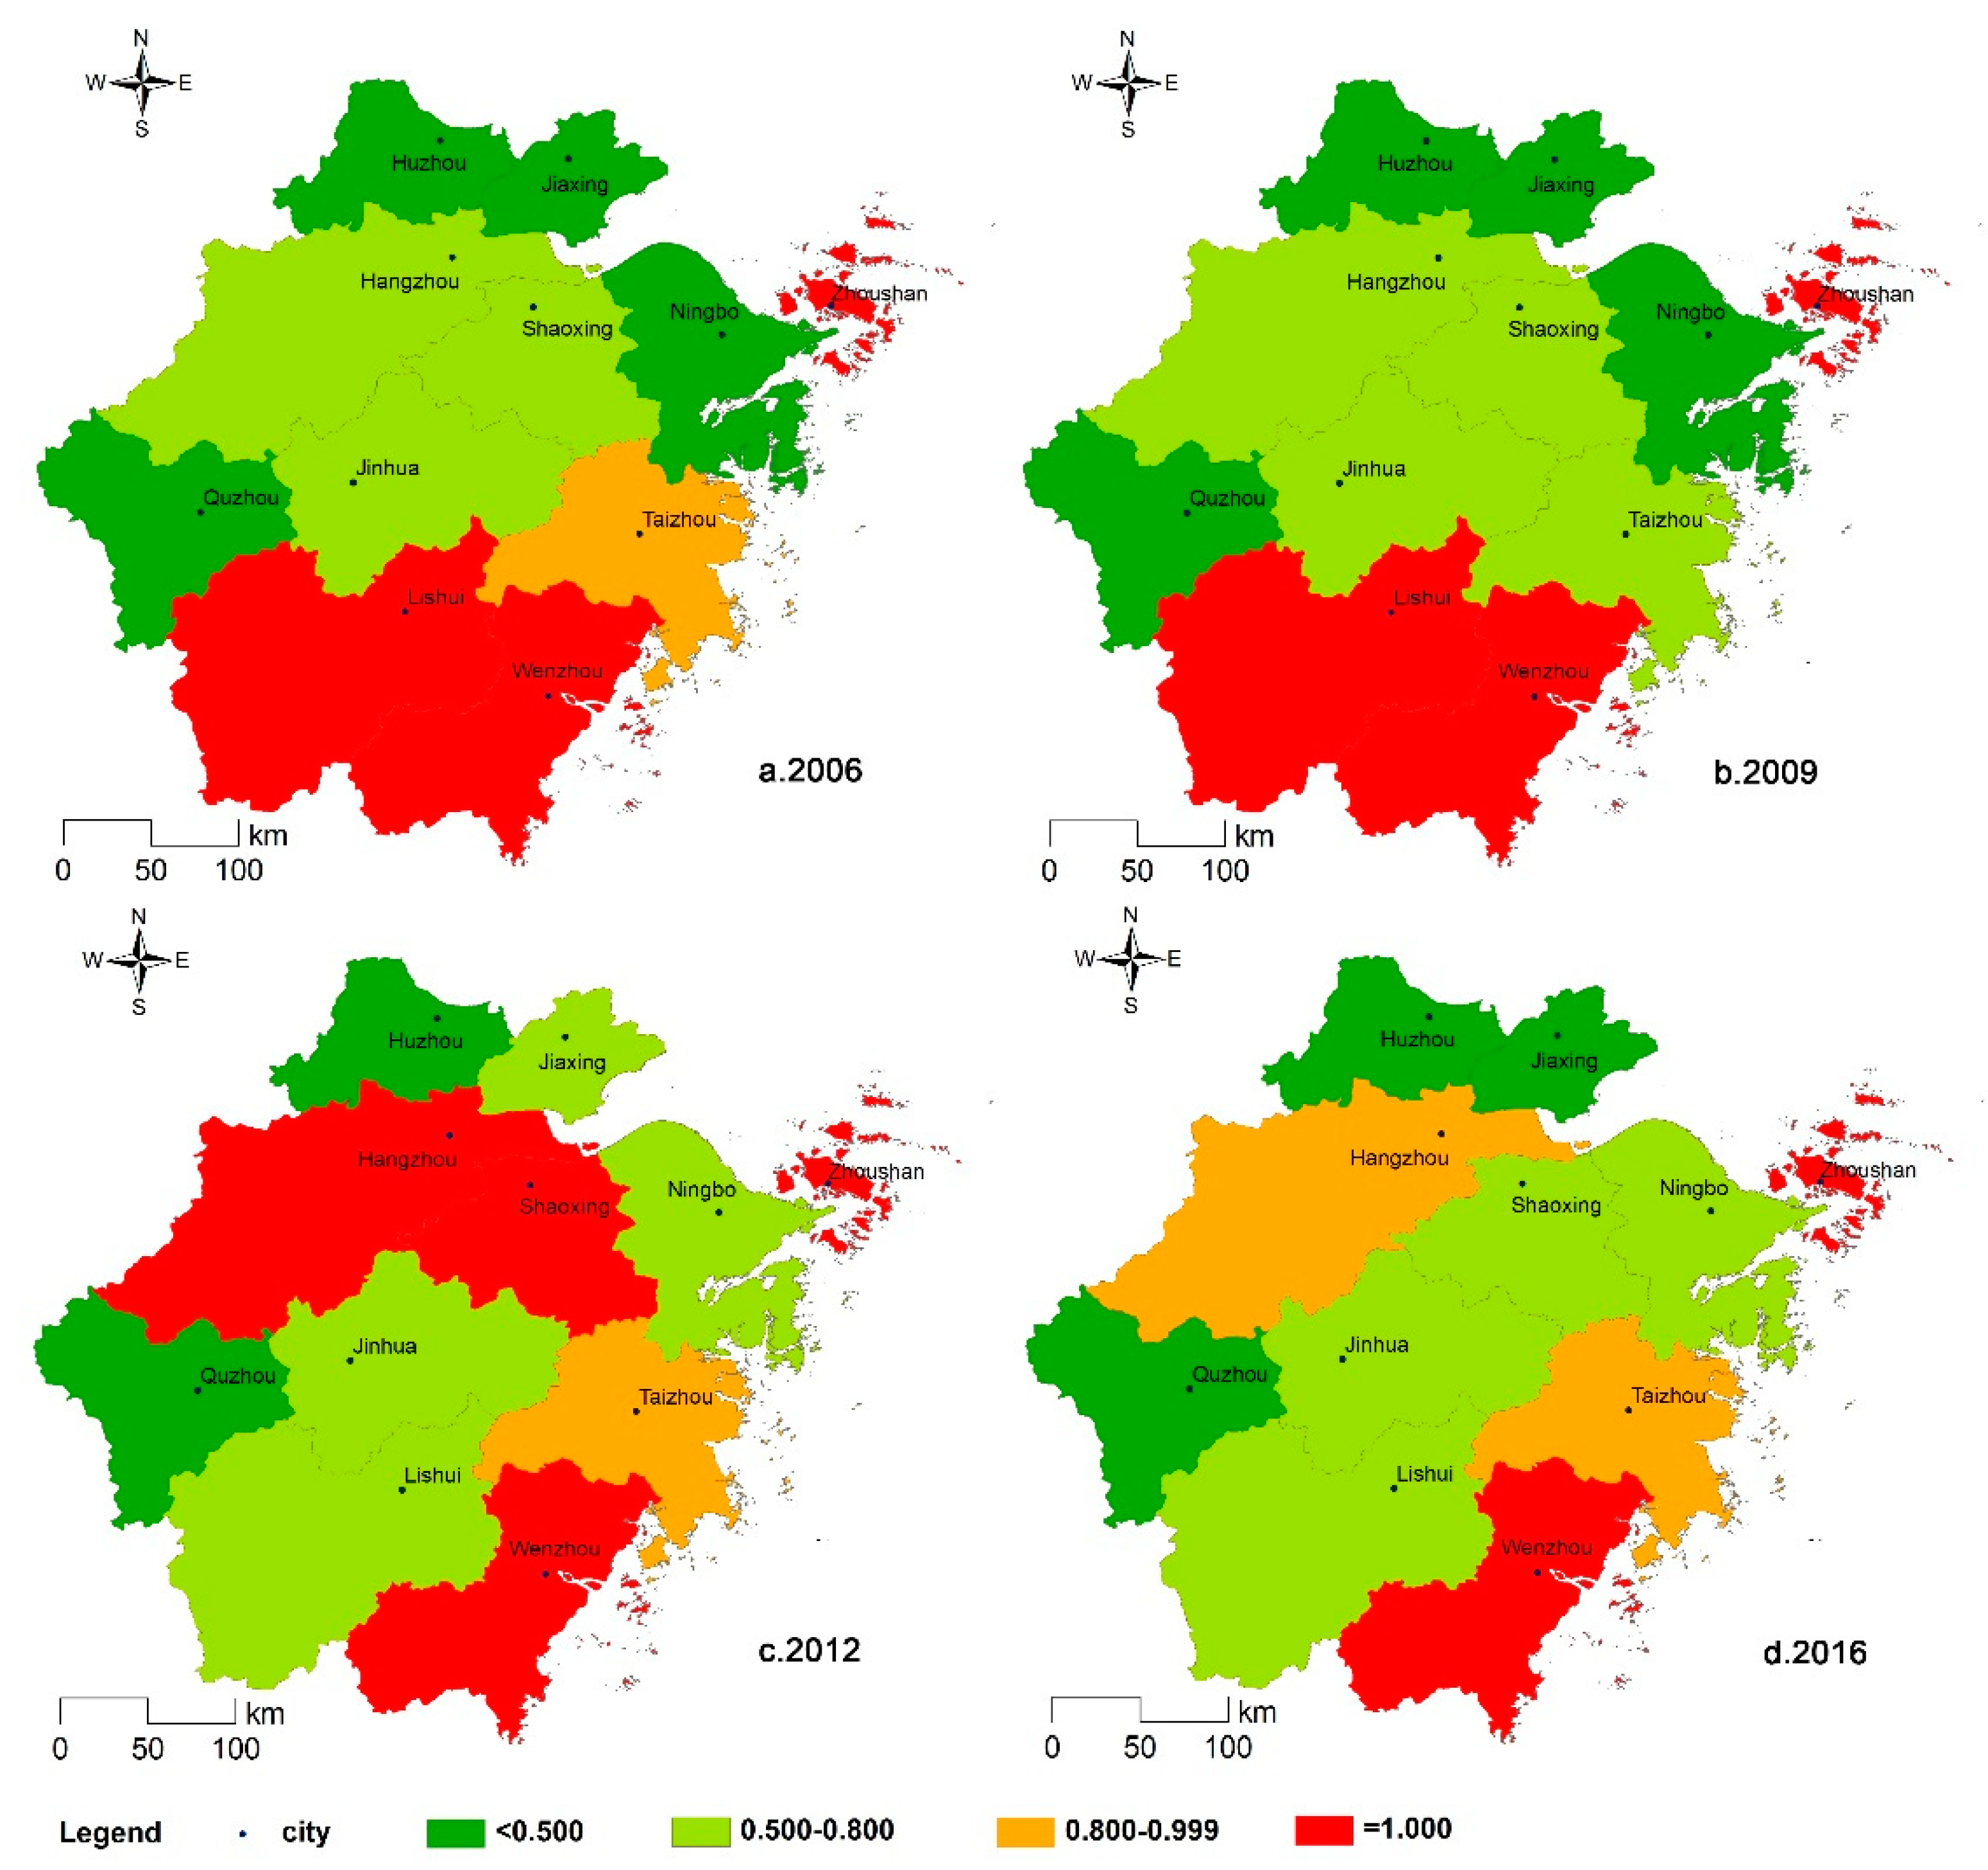
From the above Table 2, it is shown that the total average value of atmospheric environmental static efficiencies in the 11 cities was 0.6768, and still has around 32.32% improvement potential comparing to the production frontier, which indicates that there is a long way to go in the control and management of atmospheric pollution. Of the overall efficiencies of the 11 cities, Zhoushan is the only city to reach production frontier. Therefore, there is much the other 10 cities can do in the management of atmospheric pollution. The reginal differences were shown in the Figure 4. Zhoushan has the highest efficiency and this is closely related to Zhoushan’s unique geography, climate, and underdeveloped heavy industry. Besides, the air quality of Zhoushan is also ranked top of all Chinese cities. Except Zhoushan, the cities with ST above 0.8 include Wenzhou, Taizhou and Lishui. However, Quzhou and Huzhou have relatively low total static efficiency and both are below 0.4. In the perspective of air pollutants, the emission of NOx has the highest efficiency 0.7249, followed by SO2 with an efficiency of 0.7151. Both efficiency of smoke & dust and industrial waste gas are below the average value, reaching 0.6395 and 0.6446 respectively. The atmospheric environmental static efficiencies of the above four pollutants also have reginal differences (Figure 4). For instance, Hangzhou, Wenzhou and Zhoushan have relatively higher efficiencies of SO2 while Jiaxing, Quzhou and Huzhou have lower efficiencies. Taizhou, Wenzhou and Zhoushan have relatively higher efficiencies of smoke and dust, while Quzhou, Huzhou and Jinhua have lower efficiencies. The static efficiency of NOx is higher in Lishui, Wenzhou and Zhoushan, while lower in Ningbo, Quzhou and Huzhou. The efficiency of industrial waste gas is higher in Zhoushan, Wenzhou and Taizhou while lower in Quzhou, Huzhou and Ningbo.
Atmospheric environmental static efficiency was further divided into pure technical efficiency (SPTE) and scale efficiency (SSE), and the results were shown in the Table 3. The average value of SPTE from 2006 to 2016 in the 11 cities in Zhejiang is 0.7790, while the average value of SSE is 0.8895. Among all the air pollutants, SPTE of NOx is the highest, reaching 0.8261, and followed by SO2 reaching 0.7970. SPTE of smoke & dust is the lowest. SSE are all above 0.8. The SSE of SO2 is highest reaching 0.9150, followed by NOx (0.8923), smoke & dust (0.8804), and industrial waste gas (0.8741). Both the pure technical factor and scale factor of environmental efficiency can be improved, and pure technical factor has more potential to be improved. Most cities have higher SSE than SPTE except Hangzhou, Ningbo, Wenzhou, Zhoushan, Taizhou. In the perspective of reginal difference, the deviation of the environmental efficiencies among cities is significant, especially SPTE of which the standard deviation is 0.2270. In the perspective of every single pollutant, the standard deviation of SPTE is larger than that of SSE. Also, the SSE in most cities have been approaching production frontier. However, compared with the production frontier, Ningbo has much to do in terms of SSE. With the lowest overall SSE, Ningbo is very good at the SSE of smoke and dust. In our additional research, the SSE in Ningbo is close to or even achieving efficiency frontiers during 2011–2015. This indicates that Ningbo should pay more attention to control and manage the other pollutants including SO2, NOx, and industrial waste gas. Besides, Wenzhou and Zhoushan have been closely approaching the production frontier in both SPTE and SSE. Hangzhou has reached the production frontier in the aspect of SPTE but has much to do to improve SSE of industrial waste gas and smoke & dust.
3.2. Evolution of Atmospheric Environment Dynamic Efficiency in Zhejiang Province
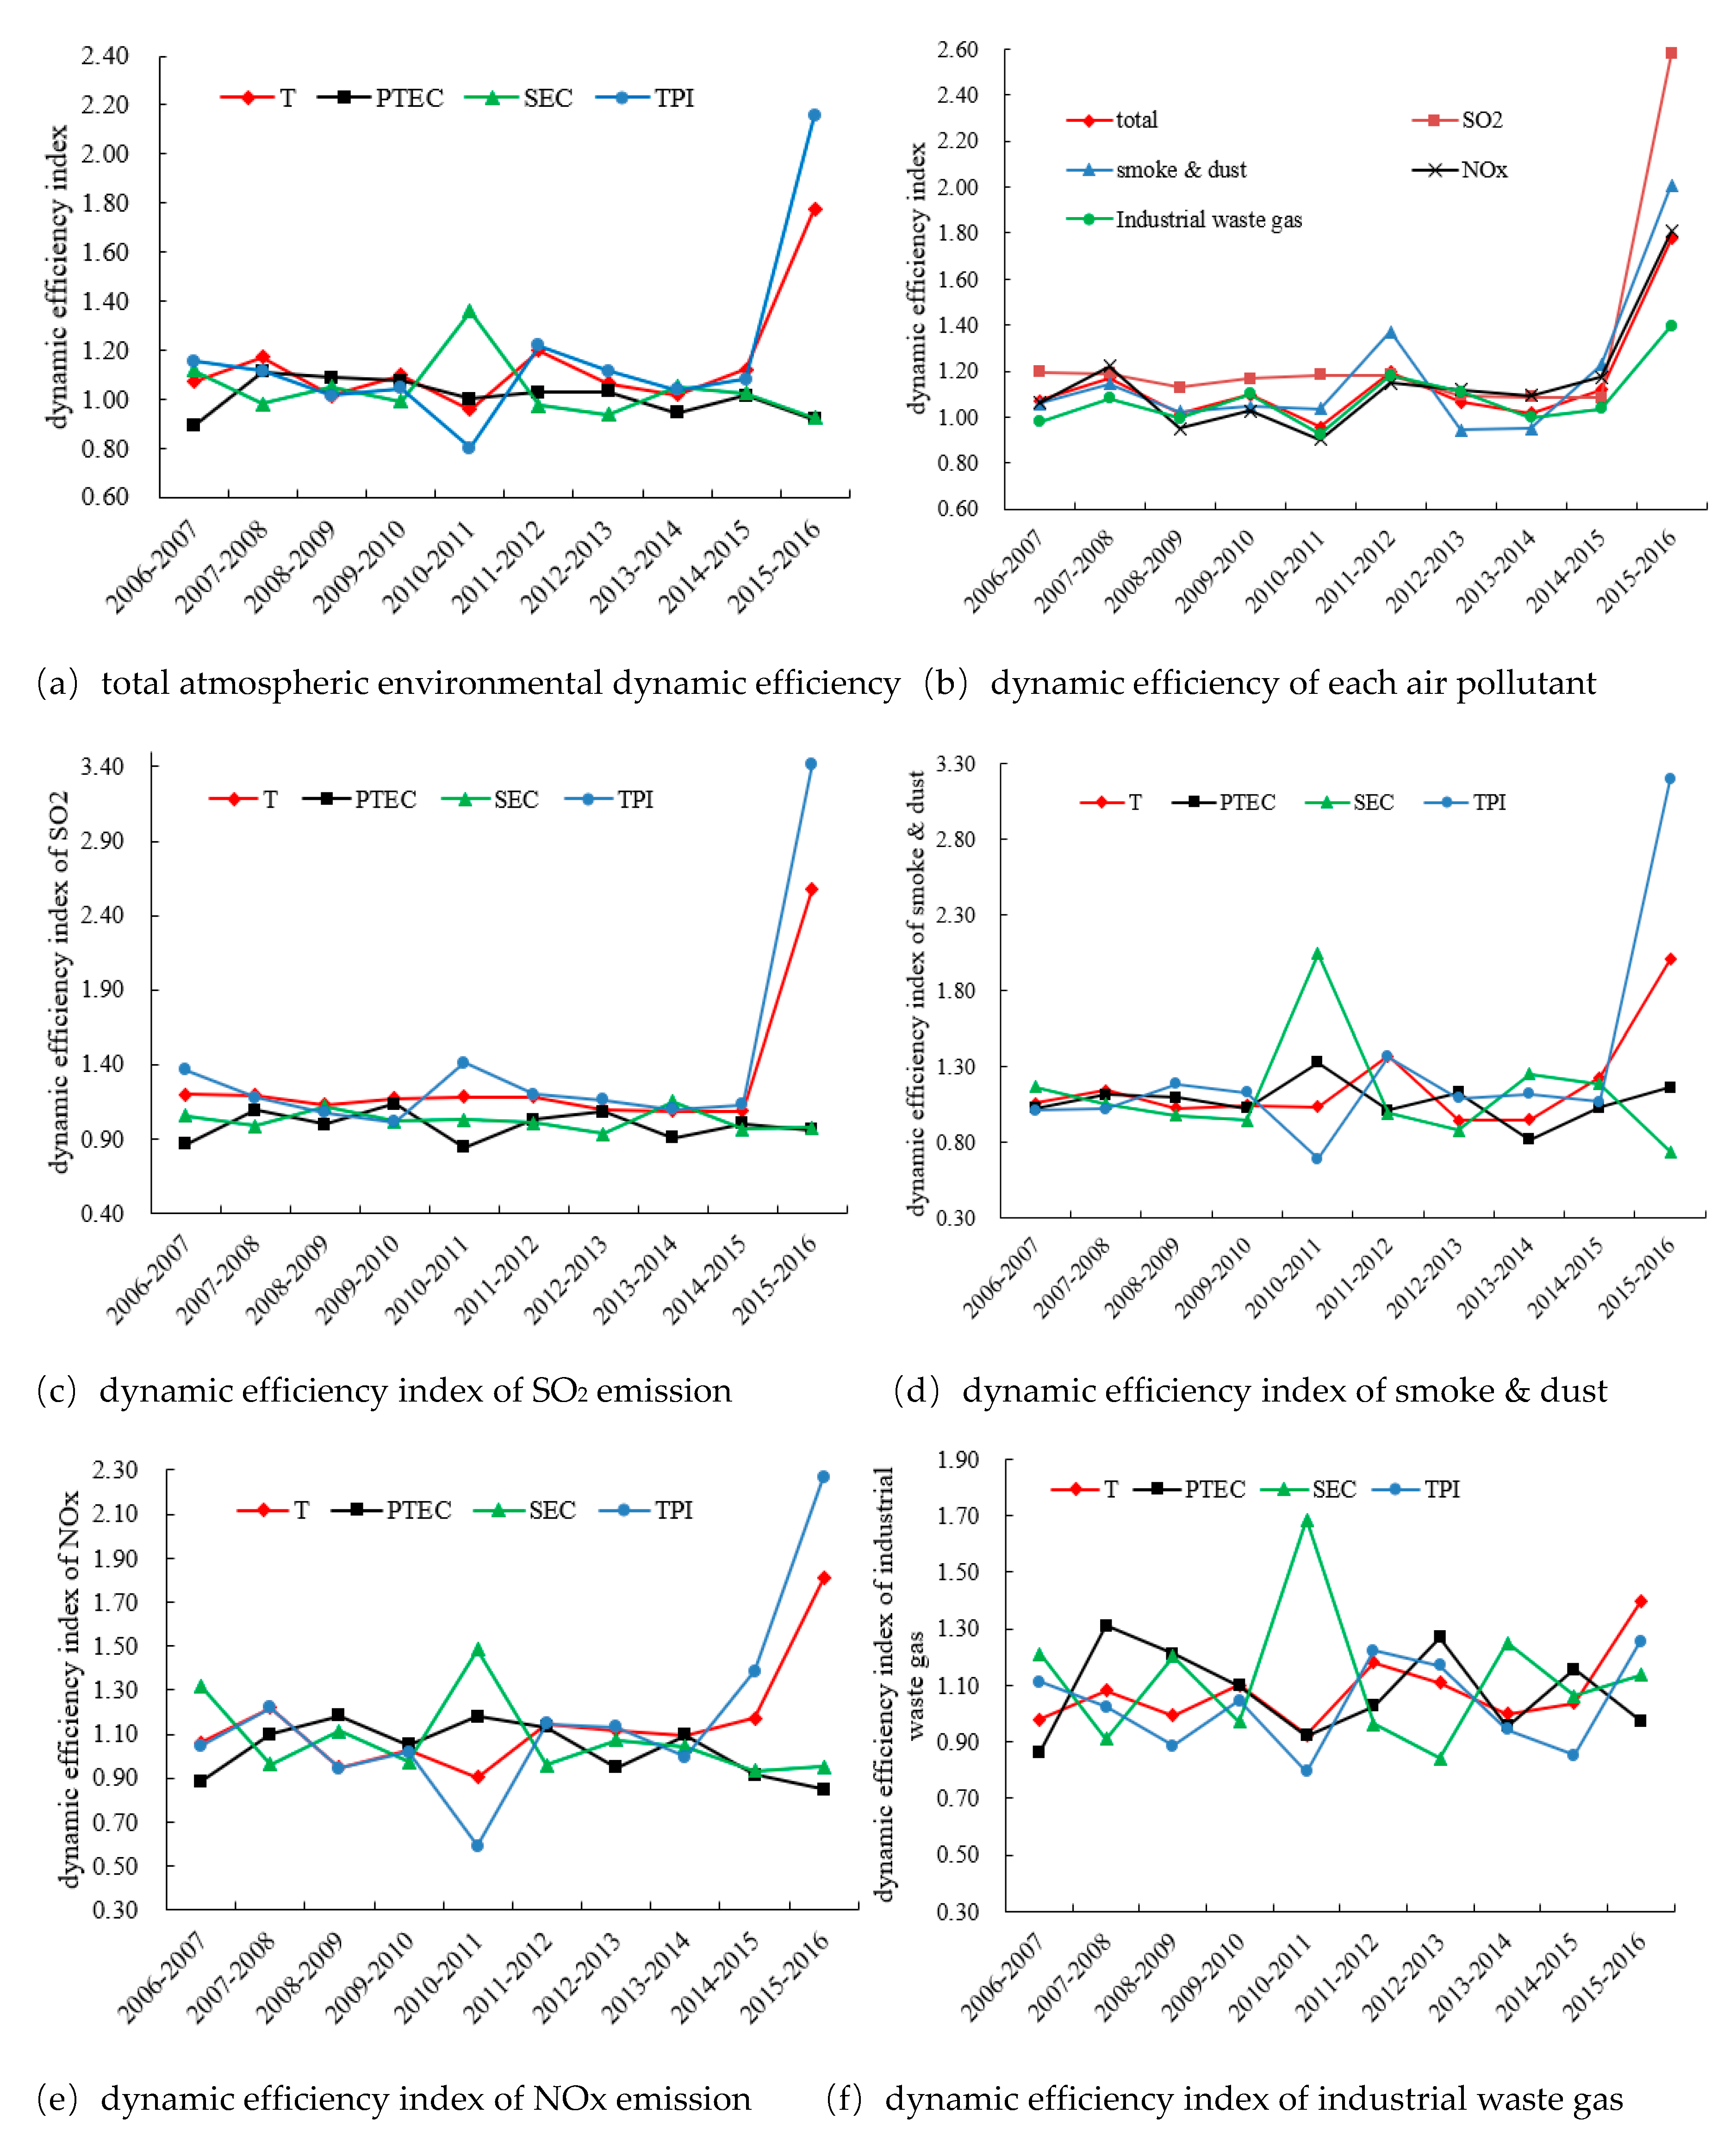
In order to clarify the dynamic evolution process of atmospheric environmental efficiency in various cities of Zhejiang Province, the non-radial DEA model of the Malmquist index [49] was used to measure the total factor productivity (T) of each city, which was decomposed into three parts: Pure technical efficiency changes (PTEC), scale efficiency change index (SEC) and technology progress change index (TPI). Figure 5 shows the total factor productivity and decomposition index of the atmospheric environmental efficiency of the whole and single air pollutants in various cities of Zhejiang Province.
For the dynamic efficiency of the overall atmospheric environment in Zhejiang Province (Figure 5a), during the decade of 2006–2016, except for the decline in 2010–2011, the remaining years showed an overall upward trend (T > 1), with the largest increase in 2015–2016; which reflected that Zhejiang Province has significantly improved the overall efficiency of atmospheric environmental governance (Figure 5b) during the “13th Five-Year Plan” period. In contrast, pure technical efficiency and scale efficiency are both volatile (Figure 5a). In 2010–2011, the scale efficiency increased the most, and the pure technical efficiency increased slightly. In the past ten years, in addition to a certain degree of decline in 2010–2011, the technological progress index has also shown a growth trend, with the largest increase in 2015–2016, which indicates that the improvement of atmospheric environmental efficiency in Zhejiang Province in 2006–2016 is mainly attributed to technological advances, changes in production technology and the improvement of atmospheric environmental efficiency promoted by increasingly advanced environmental governance technologies. This can also be reflected in the efficiency of individual pollutants. The environmental management efficiency of the three major pollutants increased significantly during 2015–2016 (Figure 5b~e).
For SO2 emission (Figure 5c), the total factor productivity (T) maintains a growth trend, in which pure technical efficiency and scale efficiency are also volatile, while the technological progress index has been growing. For smoke & dust (Figure 5d), the technology advancement index has only dropped significantly in 2010–2011, and the rest of the year has increased, However, because the scale efficiency decline in 2012–2013 is higher than the growth of pure technology efficiency and technological progress index, the decline of pure technical efficiency in 2013–2014 is higher than the growth of scale efficiency and technological progress index, therefore, the overall indicators of smoke & dust in these two periods have different degrees’ decline. For NOx emission (Figure 5e), the overall indicator has declined in the period of 2008–2009 and 2010–2011, respectively, because of a decline in scale efficiency and technological progress index and the sharp decline in the technological progress index. As for industrial emissions, the efficiencies of T, PTEC, SEC and TPI have fluctuated during this decade. It can also be seen from Figure 5c~f that 2010–2011 is a special period. In addition to the significant increase in the technological progress index of SO2, the technological progress index of smoke & dust, NOx and industrial waste gas has fallen sharply. Although the scale efficiency of pollution prevention and control has been greatly improved in order to make up for the technical deficiencies, the comprehensive environmental efficiency of NOx and industrial waste gas are still at a reduced level. With the implementation of major policies of The 13th Five-Year Plan for the Prevention and Control of Air Pollution in Zhejiang Province and The 13th Five-Year Plan for the Prevention and Control of Industrial Pollution in Zhejiang Province, Zhejiang Province has strengthened the investment in the reduction and treatment of atmospheric pollutants and the upgrading of technological transformation. As a result, the efficiency of the atmospheric environment has increased significantly since 2015–2016. In addition, through the environmental efficiency changes of various atmospheric pollutants in Figure 5b, the efficiency of SO2 emission has been in a stable high value state that is greater than 1, which is related to the importance of SO2 governance by governments at all levels after the 11th Five-Year Plan. The control efficiency of other pollutants fluctuated sharply, and it showed an alternating ups and downs with time, and the overall variation characteristics were similar.
The specific annual decomposition indices of major pollutants are further listed, as shown in Table 4. For the dynamic efficiency growth index, SO2 emission has the highest annual Malmquist index, with an average annual growth rate of 24.20%, followed by smoke & dust (15.07%), NOx (12.94%), and industrial waste gas (7.28%). In terms of pure technical efficiency change, industrial waste gas (6.87%), smoke & dust (6.59%) and NOx (2.62%) have slightly increased, while SO2 (−1.40%) has declined to some extent, but the total annual average technology change efficiency is increasing. For the change of scale efficiency, all four pollutants have increased; for the technological progress index, the technological progress index of SO2 has been greatly improved, smoke & dust and NOx have also increased moderately, and the technology progress Index of the annual average of industrial waste gas has increased slightly. The contribution rates of the three decomposition indices to the dynamic efficiency of air pollution prevention and control in Zhejiang Province are as follows: Technological progress index (13.55%), scale efficiency change (3.46%), and pure technical efficiency change (0.65%). The improvement of environmental efficiency is mainly caused by the "two-wheel driving" of technological progress and scale expansion effect. The effect of pure technical efficiency is less affected, and the effect on various pollutants is different, so it can be neglected. This is different from the single-wheel drive mode; the growth of air pollution emission efficiency in China’s major industrial provinces depends entirely on environmental technology advancement found by Wang K.L. et al. [25]. In addition, the decomposition index of the four major pollutants is also different. For SO2 emission, the technological progress index increases significantly, while the pure technical efficiency decreases slightly. For smoke & dust and NOx, the pure technical efficiency and scale efficiency increase slightly, while the pure technical efficiency increase moderately. Considering that the static efficiency of smoke & dust is not high, the technical level and management level should be emphasized in the treatment of smoke dust. For industrial waste gas, the technological progress index has a slight increase. Therefore, in the improvement of atmospheric environmental efficiency in Zhejiang Province, we should pay attention to the synergy between pure technological efficiency change, scale efficiency changes and technology progress change index. In the process of eliminating backward production capacity, adjusting industrial structure and increasing environmental construction, we must also optimize production network structure, innovative enterprise management mode and optimize resource allocation.
3.3. Regional Differences in the Dynamic Evolution of Atmospheric Environmental Efficiency in Different Cities of Zhejiang Province
Due to the inconsistent industrial structure, energy structure and industrialization of different cities, there are regional differences in the dynamic evolution of atmospheric environmental efficiency. Table 5 shows the results of annual dynamic efficiency calculations of atmospheric environment in cities of Zhejiang Province. It can be seen that the total efficiency of air pollution prevention and control in cities of Zhejiang Province increased during 2006–2016. The fastest growth rate is in Hangzhou (1.2147), followed by Ningbo (1.2059) and Wenzhou (1.1993), and the slowest is Quzhou (1.0538). Combined with static overall efficiency, Hangzhou’s overall static efficiency ranks 5th (0.7808), and Ningbo ranks 8th (0.5211). As the main industrial and economically developed cities in Zhejiang Province, these two cities still have a large room for improvement in the atmospheric environment efficiency. From the perspective of single pollutants, SO2 > smoke & dust > NOx > industrial waste gas, in which the average dynamic efficiency of SO2 is the fastest, at 1.2894, the dynamic efficiency levels of other pollutants are small, and both static efficiency and dynamic efficiency of industrial waste gas are at a low level.
By decomposing the total factor dynamic efficiency (T), the differences between cities are further compared from the pure technical efficiency (PTEC), scale efficiency change index (SEC) and technology progress change index (TPI). The results are shown in Table 5. It can be seen that for the total factor dynamic efficiency (T), the annual dynamic efficiency in 11 cities is greater than 1, and the total efficiency of the atmospheric environment is advanced. For pure technical efficiency, the pure technical efficiency change index of Ningbo, Jiaxing, Shaoxing, Taizhou and Lishui is greater than 1, which is a forward trend; Hangzhou, Wenzhou and Zhoushan are 1.0000, showing a steady development trend; only Huzhou, Jinhua and Quzhou are less than 1, which is a downward trend, which means that the three cities have not fully utilized the resources and technology potential, and there are still some problems in the management of polluting enterprises involved in gas emissions. For scale efficiency, except for Lishui which is slightly less than 1, and Zhoushan is 1.0000, the rest of the cities are greater than 1. In addition, the technical progress index of all cities is greater than 1, showing a significant progress. In fact, this is an important factor in promoting overall efficiency growth. This also indicates that Zhejiang Province has relied on environmental technology advancement and eliminated backward production capacity in the past decade. It has achieved good results in promoting industrial upgrading and transformation.
4. Discussions and Policy Implications
4.1. Classification of Atmospheric Pollution Efficiency in Different Cities
To effectively identify advantages and disadvantages of different cities on atmospheric pollution reduction, referring to methods from Kapelko [39], Wang, K.L. [25], etc., respectively, from 2006 to 2016 it sets the global average boundaries of static efficiency and dynamic efficiency by marking H for values that are greater than the average, L for values that are less than the average. We classify the environmental performance of air pollution in 11 cities in Zhejiang Province advantages and disadvantages into following four types: H/H represents static efficiency and dynamic efficiency are higher than total average value; L/L represents static efficiency and dynamic efficiency are lower than total average value; H/L represents static efficiency is higher, while dynamic efficiency is lower than total average value; and L/H represents static efficiency is lower, while dynamic efficiency is higher than total average. Result is showing in Table 6 as below.
From the perspective of overall efficiency classification, three cities (Hangzhou, Wenzhou and Zhoushan) belong to H/H regions. Not only do they have higher static efficiency, but also improving rapidly, which brings into full play of the leading demonstration role of atmospheric environmental efficiency. Three cities (Huzhou, Jinhua, and Quzhou) belong to L/L regions, as they have low static efficiency and dynamic efficiency, which is lack of potential pursuance. Three cities (Shaoxing, Taizhou, Lishui) belong to H/L regions. They have high level of current static efficiency, but since they have lower dynamics, they have a higher risk of being passed by other cities. Two cities (Ningbo, Jiaxing) belong to L/H regions. Even though they have low static efficiency, dynamics are fast with great future potentiality. Overall, these four types of cities are relatively uniformed, doesn’t appear the urban feature with H/H or L/L concentration of atmospheric environmental efficiency, which have no significant polarization of the “Matthew Effect” [25].
From the aspect of SO2 environmental efficiency, Zhoushan, Wenzhou belongs to H/H. Huzhou, Quzhou, Lishui belongs to L/L. Hangzhou, Shaoxing, Jinhua belongs to H/L. The rest of the cities belongs to L/H. In the environmental efficiency of smoke & dust, Ningbo, Wenzhou and Zhoushan belongs to H/H. Taizhou, Lishui belongs to H/L. Hangzhou belongs to L/H, while the rest of them belongs to L/L. In the environmental efficiency of NOX, Hangzhou, Wenzhou, Zhoushan belongs to H/H. Ningbo, Jiaxing belongs to L/H. Huzhou, Quzhou belongs to L/L, and the rest of them belongs to L/H. Through the environmental efficiency of industrial waste gas, Hangzhou, Wenzhou, Shaoxing, Taizhou belongs to H/H. Ningbo, Quzhou belongs to L/L. Jiaxing, Huzhou belongs to L/H, and rest of them belongs to H/L. Overall, there is a large difference of single pollutant among cities, and there is no obvious of convergence trend. In the future, to narrow the overall environmental efficiency gap between cities, it is necessary to enhance exchanges and cooperation, share advanced technologies and management experience in emission reduction and pollution control with each other.
4.2. Differentiation Strategy Formulation of Regional Air Pollution Emission Reduction
Based on the analysis above, Zhejiang province should take the actual situations of different cities fully into consideration, and formulate differentiated air pollution precautions. Pattern 1, for H/H type cities (such as Hangzhou, Wenzhou, Zhoushan): We should continue to maintain the high efficiency of atmospheric environmental governance, pay attention to the high-quality development of economy and the steady improvement of air quality. To achieve effective control of air pollution through the cultivation of green, intelligent, innovative and other modern production factors. Pattern 2, for H/L type cities (such as Shaoxing, Taizhou and Lishui): It is necessary to strengthen the effective improvement of dynamic efficiency, accelerate the transformation and upgrading of economic development mode, and improve the level of atmospheric environment management through the improvement of pure technical efficiency and the introduction and update of new technologies and equipment of enterprises. Pattern 3, for L/H type cities (such as Ningbo, Jiaxing): It is necessary to further dig deep the potential of air pollution reduction, strictly manage and implement precautions and share of air pollution reduction. For instance, during the period of economic structure transformation, the proportion of industrial output in GDP of Ningbo has been declining in recent years, but industrial emissions keep growing. We need to increase investment in human, financial and technological pollution control, accelerate the effective control of the total amount of pollutants, and strive to move towards H/H type cities as soon as possible. Pattern 4, for L/L type cities (such as Huzhou, Jinhua and Quzhou): It is necessary to speed up the technology introduction, make up for the shortcomings of low technical efficiency, actively eliminate outdated production capacity, strictly prevent the polluting industries or enterprises from moving in, and strengthen the environmental assessment examination and approval of gas-related polluting enterprises.
4.3. Sustainability Proposals for Air Pollution Control
Pay attention to the positive effect of the improvement of pure technical efficiency on the improvement of atmospheric environment efficiency. From the results of Table 2 above, it can be seen that the average pure technical efficiency of atmospheric environmental efficiency in Zhejiang Province is less than that of scale efficiency at the provincial level in terms of the overall or single pollutant. It means that the improvement of pure technical efficiency is of positive significance to the overall improvement of atmospheric environmental efficiency and sustainable development in Zhejiang Province. Specifically, efforts can be made in the following aspects: 1) Increase the support of enterprise’s scientific and technological innovation and deepen the prevention and control of industrial pollution. For instance, it is necessary to speed up the transformation of ultra-low fuel gas emissions in the power industry, cancel the desulfurization bypass of sintering machines and pellet production equipment in the iron and steel industry, and effectively reduce the emissions of sulfur dioxide, nitrogen oxides, smoke and dust in key industries. 2) Intensify the transformation of clean exhaust gas from industrial boilers. All coal-fired boilers shall adopt desulfurization and dust removal measures except those listed as obsolete objects. Coal-fired boilers with steam capacity of more than 20 tons/hour shall be installed in on-line monitoring facilities and connected with monitoring centers of environmental protection departments. In order to reduce the emission of industrial waste gas, not only the existing industrial boilers with long service time, high pollution and low efficiency can be replaced by energy-saving and environmental-friendly boiler, but also clean energy sources such as coal to gas and coal to electricity to replace coal combustion.
Strengthen exchanges and cooperation between cities to improve the efficiency of the overall atmospheric environment control. In order to narrow the gap of atmospheric environmental efficiency among cities, it is necessary to strengthen the exchange and cooperation of environmental management among cities and share advanced pollution control technology and management experience. Take Hangzhou, the capital of Zhejiang Province as an example, the city makes full use of the spillover effect of technology to promote the efficiency of atmospheric environment in relatively backward cities. Furthermore, each city relies on optimize the regional industrial layout and guide the rational distribution of key industries in the province.
In addition, all 11 cities in Zhejiang Province should speed up the implementation of the "Releasing Cage for New Birds" Plan [54], which means that to speed up the elimination of heavy pollution and backward production capacity in urban built-up areas and promote the banning and renovate of "small and scattered" backward enterprises (workshops) which have great negative atmospheric impact, and enhance the overall efficiency of prevention and control in atmospheric environment.
5. Conclusions
To improve the efficiency of air pollution emission and tap the potential of air pollution emission reduction is an important way to improve China’s air environment quality and reduce and eliminate the occurrence of haze weather. Based on the non-radial directional distance function DEA model, this paper calculated the atmospheric environmental efficiency and regional differences of Zhejiang Province and its 11 cities during 2006 to 2016 from the static and dynamic dimensions. The results showed that the average static efficiency of Zhejiang atmospheric environment is 0.6768, about 32.3% room for improvement from the production standard. It still has huge potential for pollution reduction and control. Pure technical efficiency is the main factor that restricts the static efficiency improvement of atmospheric environment in Zhejiang province.
From 2006 to 2016, the dynamic efficiency of atmospheric environment in Zhejiang province achieved an average annual rate of 13.13%, accumulated increase of 203.51%, and the growth rate differentiate significantly among cities: Hangzhou is the fastest, followed by Ningbo and Wenzhou. The contribution of the four main atmospheric pollutants in the overall efficiency improvement is in the order of: SO2 > smoke & dust > NOX > industrial waste gas. The improvement of atmospheric environmental efficiency is mainly influenced by “dual motivations” of technological progress and scale efficiency.
Among the four types of "static-dynamic efficiency" high and low efficiency matrix, the distribution quantity of 11 cities is relatively uniformed, without polarization of the "Matthew Effect" of H/H and L/L. In the future, differentiated air pollution prevention measures should be formulated to effectively improve the efficiency of atmospheric environment, taking full account of the actual conditions of different cities. In addition, the research framework of this paper can also provide reference for the city scale atmospheric environmental management and sustainable development in other regions.
Author Contributions
Y.-Y.L. and L.D. designed the study, analyzed the data, and wrote the manuscript. Y.H., S.-S.Y. ang Y.-D.H. collected the data and coordinated the data-analysis. B.W. and L.D. revised the manuscript. All authors reviewed the manuscript and approved the final version.
Funding
This research was funded by the Major Humanities and Social Science Projects of Colleges in Zhejiang Province in 2017–2018 (Grant No. 2018QN035).
Conflicts of Interest
The authors declare no conflict of interest.
References
- Wang, K.; Wei, Y.M.; Huang, Z. Environmental efficiency and abatement efficiency measurements of China’s thermal power industry: A data envelopment analysis-based materials balance approach. Eur. J. Oper. Res. 2018, 269, 35–50. [Google Scholar] [CrossRef]
- Li, Y.; Chiu, Y.H.; Lu, L.C.; Chiu, C.R. Evaluation of energy efficiency and air pollutant emissions in Chinese provinces. Energ. Effic. 2019, 12, 963–977. [Google Scholar] [CrossRef]
- Wu, Y.; Tam, V.W.; Shuai, C.Y.; Shen, L.Y.; Zhang, Y.; Liao, S.J. Decoupling China’s economic growth from carbon emissions: Empirical studies from 30 Chinese provinces (2001–2015). Sci. Total Environ. 2019, 656, 576–588. [Google Scholar] [CrossRef] [PubMed]
- Camarero, M.; Castillo, J.; Picazo-Tadeo, A.J.; Tamarit, C. Eco-efficiency and convergence in OECD countries. Environ. Resource Econ. 2013, 55, 87–106. [Google Scholar] [CrossRef]
- Reinhard, S.; Lovell, C.A.K.; Thijssen, G.J. Environmental efficiency with multiple environmentally detrimental variables; estimated with SFA and DEA. Eur. J. Oper. Res. 2000, 121, 287–303. [Google Scholar] [CrossRef]
- Ma, L.H.; Hsieh, J.C.; Chiu, Y.H. A Study on the Effects of Energy and Environmental Efficiency at China’s Provincial Level. Energies 2019, 12, 591. [Google Scholar] [CrossRef]
- Ilahi, S.; Wu, Y.; Raza, M.A.A.; Wei, W.; Imran, M.; Bayasgalankhuu, L. Optimization Approach for Improving Energy Efficiency and Evaluation of Greenhouse Gas Emission of Wheat Crop using Data Envelopment Analysis. Sustainability 2019, 11, 3409. [Google Scholar] [CrossRef]
- Wang, S.; Wang, H.; Zhang, L.; Dang, J. Provincial Carbon Emissions Efficiency and Its Influencing Factors in China. Sustainability 2019, 11, 2355. [Google Scholar] [CrossRef]
- Wang, Q.; Li, M.Q. Study on air pollution abatement efficiency of China by using DEA. Environ. Sci.-China 2012, 32, 942–946. (In Chinese) [Google Scholar]
- Wang, K.L.; Shi, L.J.; Liu, L.; Du, Y.; Meng, X.R.; Yang, B.C. Study on the temporal-spatial heterogeneity and driving factors of air environmental efficiency for Yangtze River Economic Zone. Res. Environ. Yangtza Basin 2018, 27, 453–462. (In Chinese) [Google Scholar]
- Wang, K.L.; Meng, X.R.; Yang, B.C.; Cheng, Y.H. Study on the heterogeneity, dynamic evolution and cause recognition of China’s regional air environmental efficiency. Stat. & Inf. Forum 2017, 32, 55–63. (In Chinese) [Google Scholar]
- Teng, X.; Lu, L.C.; Chiu, Y.H. Considering Emission Treatment for Energy-Efficiency Improvement and Air Pollution Reduction in China’s Industrial Sector. Sustainability 2018, 10, 4329. [Google Scholar] [CrossRef]
- Lee, T.; Yeo, G.T.; Thai, V.V. Environmental efficiency analysis of port cities: Slacks-based measure data envelopment analysis approach. Transport Policy 2014, 33, 82–88. [Google Scholar] [CrossRef]
- Zofío, J.L.; Prieto, A.M. Environmental efficiency and regulatory standards: the case of CO2 emissions from OECD industries. Resourc. Energ. Econ. 2001, 23, 63–83. [Google Scholar] [CrossRef]
- Zhang, J.; Zeng, W.; Wang, J.; Yang, F.; Jiang, H.Q. Regional low-carbon economy efficiency in China: analysis based on the Super-SBM model with CO2 emissions. J. Clean. Prod. 2017, 163, 202–211. [Google Scholar] [CrossRef]
- Iftikhar, Y.; Wang, Z.; Zhang, B.; Wang, B. Energy and CO2 emissions efficiency of major economies: A network DEA approach. Energy 2018, 147, 197–207. [Google Scholar] [CrossRef]
- Wang, K.L.; Meng, X.R.; Yang, B.C.; Cheng, Y.H. Study on the atmospheric environmental performance of China’s regional economic development. J. Quant. Tech. Econ. 2016, 33, 59–76. (In Chinese) [Google Scholar]
- He, Q.; Han, J.; Guan, D.; Mi, Z.F.; Zhao, H.Y.; Zhang, Q. The comprehensive environmental efficiency of socioeconomic sectors in China: An analysis based on a non-separable bad output SBM. J. Clean. Prod. 2018, 176, 1091–1110. [Google Scholar] [CrossRef] [Green Version]
- Zhang, S.H.; Ren, H.T.; Zhou, W.J.; Yu, Y.D.; Chen, C.C. Assessing air pollution abatement co-benefits of energy efficiency improvement in cement industry: A city level analysis. J. Clean. Prod. 2018, 185, 761–771. [Google Scholar] [CrossRef] [Green Version]
- Wang, B.; Zhang, Q. Analysis of various firm productive efficiency with environmental constraints. Syst. Eng. Theory Pract. 2002, 1, 1–8. (In Chinese) [Google Scholar]
- Wang, K.L.; Yang, L.; Meng, X.R. Spatial differences, dynamic evolution and driving mechanism of China’s air environmental performance—An empirical analysis based on provincial panel data during 2006–2014. J. Shanxi Univ. Financ. Econ. 2016, 38, 357–364. [Google Scholar]
- Miao, Z.; Baležentis, T.; Tian, Z.; Shao, S.; Geng, Y.; Wu, R. Environmental Performance and Regulation Effect of China’s Atmospheric Pollutant Emissions: Evidence from “Three Regions and Ten Urban Agglomerations”. Environ. Resour. Econ. 2019. [Google Scholar] [CrossRef]
- Wang, K.L.; Wang, D.D.; Meng, X.R. Heterogeneous technology, technology gap and China’s regional air environmental efficiency. East China Econ. Manage. 2017, 31, 48–55. (In Chinese) [Google Scholar]
- Xie, H.; Shen, M.; Wei, C. Technical efficiency, shadow price and substitutability of Chinese industrial SO2 emissions: a parametric approach. J. Clean. Prod. 2016, 112, 1386–1394. [Google Scholar] [CrossRef]
- Wang, K.L.; Meng, X.R.; Yang, L.; Yang, B.C.; Wang, J.M.; Cheng, Y.H. The regional differences, changing trends and causes decomposition of atmospheric pollution emissions efficiency of China’s major industrial provinces. China Environ. Sci. 2017, 37, 888–898. (In Chinese) [Google Scholar]
- Wang, K.L.; Meng, X.R.; Yang, B.C.; Cheng, Y.H. Regional differences and influencing factors of China’s air pollution emission efficiency considering technological heterogeneity. China Popul. Resour. Environ. 2017, 27, 101–110. (In Chinese) [Google Scholar]
- Perkins, R.; Neumayer, E. Fostering environment efficiency through transnational linkages? Trajectories of CO2 and SO2, 1980–2000. Environ. Plan. A 2008, 40, 2970–2989. [Google Scholar] [CrossRef]
- Hu, J.L.; Wang, S.C. Total-factor energy efficiency of regions in China. Energ. policy 2006, 34, 3206–3217. [Google Scholar] [CrossRef]
- Li, L.B.; Hu, J.L. Ecological total-factor energy efficiency of regions in China. Energ. Policy 2012, 46, 216–224. [Google Scholar] [CrossRef]
- Zhang, R.; Lu, C.C.; Lee, J.H.; Feng, Y.; Chiu, Y.H. Dynamic Environmental Efficiency Assessment of Industrial Water Pollution. Sustainability 2019, 11, 3053. [Google Scholar] [CrossRef]
- Charnes, A.; Cooper, W.W.; Rhodes, E. Measuring the efficiency of decision-making units. Eur. J. Oper. Res. 1978, 2, 429–444. [Google Scholar] [CrossRef]
- Tone, K. A slacks-based measure of efficiency in data envelopment analysis. Eur. J. Oper. Res 2001, 130, 498–509. [Google Scholar] [CrossRef] [Green Version]
- Zhou, X.; Luo, R.; Yao, L.; Cao, S.; Wang, S.; Lev, B. Assessing integrated water use and wastewater treatment systems in China: A mixed network structure two-stage SBM DEA model. J. Clean. Prod. 2018, 185, 533–546. [Google Scholar] [CrossRef]
- Tone, K. A slacks-based measure of super-efficiency in data envelopment analysis. Eur. J. Oper. Res. 2002, 143, 32–41. [Google Scholar] [CrossRef] [Green Version]
- Fang, H.H.; Lee, H.S.; Hwang, S.N.; Chung, C.C. A slacks-based measure of super-efficiency in data envelopment analysis: An alternative approach. Omega 2013, 41, 731–734. [Google Scholar] [CrossRef]
- Fare, R.; Grosskopf, S.; Norris, M.; Zhang, Z.Y. Productivity growth, technical progress, and efficiency change in industrialized countries. Am. Econ. Rev. 1994, 84, 66–83. [Google Scholar]
- Huang, J.; Du, D.; Hao, Y. The driving forces of the change in China’s energy intensity: An empirical research using DEA-Malmquist and spatial panel estimations. Econ. Model. 2017, 65, 41–50. [Google Scholar] [CrossRef]
- Shah, A.A.; Wu, D.; Korotkov, V. Are Sustainable Banks Efficient and Productive? A Data Envelopment Analysis and the Malmquist Productivity Index Analysis. Sustainability 2019, 11, 2398. [Google Scholar] [CrossRef]
- Kapelko, M.; Horta, I.M.; Camanho, A.S.; Lansink, A.O. Measurement of input-specific productivity growth with an application to the construction industry in Spain and Portugal. Int. J. Prod. Econ. 2015, 166, 64–71. [Google Scholar] [CrossRef]
- Wang, B.; Wu, Y.R.; Yan, P.F. Environmental efficiency and environmental total factor productivity growth in China’s regional economies. Econ. Res. J. 2010, 45, 95–109. (In Chinese) [Google Scholar]
- Wang, J.N.; Xu, Z.C.; Hu, X.B.; Peng, X.C.; Zhou, Y. Analysis of environmental efficiencies and their changes in China based on DEA theory. China Environ. Sci. 2010, 30, 565–570. (In Chinese) [Google Scholar]
- He, W.; Liu, C.Y.; Guo, S.L. Empirical study on evaluation and determinants of atmospheric environmental efficiency of Tianjin. J. Arid Land Res. Environ. 2016, 30, 31–35. (In Chinese) [Google Scholar]
- Xia, T.Y.; Wang, J.Y.; Song, K.; Da, L.J. Variations in air quality during rapid urbanization in Shanghai, China. Landsc. Ecol. Eng. 2014, 10, 181–190. [Google Scholar] [CrossRef]
- Liu, X.; Heilig, G.K.; Chen, J.; Heino, M. Interactions between economic growth and environmental quality in Shenzhen, China’s first special economic zone. Ecol. Econ. 2007, 62, 559–570. [Google Scholar] [CrossRef]
- Ding, L.; Liu, C.; Huang, Y.L.; Chen, K.L.; Zeng, K.F. Spatial and Temporal Characteristics of Urban Ambient Air Quality and Its Main Influence Factors in Hubei Province. Econ. Geogr. 2016, 36, 170–178. (In Chinese) [Google Scholar]
- Zhejiang Provincial Bureau of Statistics. Zhejiang Statistical Yearbook; China Statistics Press: Beijing, China, 2018.
- Zhejiang Provincial Bureau of Statistics. Zhejiang Natural Resources and Environment Statistical Yearbook; China Statistics Press: Beijing, China, 2017.
- Zhejiang Environmental Monitoring Center. Zhejiang Environmental Quality Report; China Environmental Science Press: Beijing, China, 2016.
- Banker, R.D.; Thrall, R.M. Estimation of returns to scale using data envelopment analysis. Eur. J. Oper. Res. 1992, 62, 74–84. [Google Scholar] [CrossRef]
- Caves, D.W.; Christensen, L.R.; Diewert, W.E. Multilateral comparisons of output, input, and productivity using superlative index numbers. Econ. J. 1982, 92, 73–86. [Google Scholar] [CrossRef]
- Chen, Y.; Ali, A.I. DEA Malmquist productivity measure: New insights with an application to computer industry. Eur. J. Oper. Res. 2004, 159, 239–249. [Google Scholar] [CrossRef]
- Klumpp, M. Do Forwarders Improve Sustainability Efficiency? Evidence from a European DEA Malmquist Index Calculation. Sustainability 2017, 9, 842. [Google Scholar] [CrossRef]
- Zhu, J.; Zhou, D.; Pu, Z.; Sun, H. A Study of Regional Power Generation Efficiency in China: Based on a Non-Radial Directional Distance Function Model. Sustainability 2019, 11, 659. [Google Scholar] [CrossRef]
- Wu, B.; Xiao, D. A literature review of cluster firms’ relocation and the reflection on reginal governments’ policy of "releasing cage for new birds". Stud. Sci. Sci. 2011, 29, 84–90. (In Chinese) [Google Scholar]
Figure 1.
Scatter plot, distribution overlay, and box chart of the annual average concentration of SO2, NO2, and PM10, respectively.
Figure 1.
Scatter plot, distribution overlay, and box chart of the annual average concentration of SO2, NO2, and PM10, respectively.

Figure 2.
Study Area: Zhejiang Province and the 11 studied cities.

Figure 3.
Input-output indicator system and the analysis framework of this study.

Figure 4.
Distribution of total atmospheric environmental static efficiencies in Zhejiang Province in 2006, 2009 2012 and 2016, respectively.
Figure 4.
Distribution of total atmospheric environmental static efficiencies in Zhejiang Province in 2006, 2009 2012 and 2016, respectively.

Figure 5.
Total factor productivity and decomposition indicators of total atmospheric environmental dynamic efficiencies in Zhejiang Province.
Figure 5.
Total factor productivity and decomposition indicators of total atmospheric environmental dynamic efficiencies in Zhejiang Province.


Table 1.
Descriptive statistical results of input and output variables from 2006 to 2016.
| Indicator | Variable/(unit) | Number of Samples | Average | Standard Deviation | Minimum | Maximum |
|---|---|---|---|---|---|---|
| Input Indicator | SO2/(10,000 tons) | 121 | 58146.26 | 37720.36 | 2232.89 | 213000.00 |
| Smoke & dust/(104 tons) | 121 | 28608.12 | 16704.42 | 2654.94 | 74036.99 | |
| NOx/(Ton) | 121 | 60031.28 | 55996.23 | 6203.00 | 277988.20 | |
| Industrial Waste Gas/(108 cubic meters) | 121 | 1971.34 | 1505.06 | 155.49 | 6486.95 | |
| Output Indicator | GDP/(108 yuan) | 121 | 2812.30 | 2249.76 | 335.20 | 11313.72 |
| Good air quality rate/(%) | 121 | 89.11 | 9.46 | 59.70 | 100.00 | |
| IAQI−1 | 121 | 1.05 | 0.26 | 0.65 | 2.03 |
Table 2.
Static calculation results of atmospheric environmental efficiencies in 11 cities in Zhejiang Province from 2006 to 2016.
Table 2.
Static calculation results of atmospheric environmental efficiencies in 11 cities in Zhejiang Province from 2006 to 2016.
| Cities | SO2 | Smoke & Dust | NOx | Industrial Waste Gas | ST |
|---|---|---|---|---|---|
| Hangzhou | 1.0260 | 0.5649 | 0.8200 | 0.7092 | 0.7808 |
| Ningbo | 0.5976 | 0.7349 | 0.3513 | 0.4314 | 0.5211 |
| Wenzhou | 0.9941 | 1.0192 | 1.0159 | 0.8983 | 0.9814 |
| Jiaxing | 0.4452 | 0.5064 | 0.5532 | 0.4581 | 0.4886 |
| Huzhou | 0.4691 | 0.3100 | 0.3514 | 0.3236 | 0.3601 |
| Shaoxing | 0.7188 | 0.5628 | 0.9136 | 0.7957 | 0.7436 |
| Jinhua | 0.8151 | 0.3441 | 0.6962 | 0.6449 | 0.6234 |
| Quzhou | 0.4090 | 0.2166 | 0.3299 | 0.2300 | 0.2932 |
| Zhoushan | 1.0000 | 1.0000 | 1.0000 | 1.0000 | 1.0000 |
| Taizhou | 0.6919 | 1.1258 | 0.7039 | 0.8364 | 0.8243 |
| Lishui | 0.6990 | 0.6495 | 1.2388 | 0.7635 | 0.8285 |
| Average | 0.7151 | 0.6395 | 0.7249 | 0.6446 | 0.6768 |
| S.D. | 0.2148 | 0.2898 | 0.2915 | 0.2381 | 0.2271 |
Note: ST represents the total average value of atmospheric environmental static efficiency.
Table 3.
Pure technical efficiency and scale efficiency of four air pollutants’ environmental static efficiency in 11 cities in Zhejiang Province from 2006 to 2016.
Table 3.
Pure technical efficiency and scale efficiency of four air pollutants’ environmental static efficiency in 11 cities in Zhejiang Province from 2006 to 2016.
| Cities | Environmental Efficiency of SO2 | Environmental Efficiency of Smoke & Dust | Environmental Efficiency of NOx | Environmental Efficiency of Industrial Waste Gas | ST | |||||
|---|---|---|---|---|---|---|---|---|---|---|
| SPTE | SSE | SPTE | SSE | SPTE | SSE | SPTE | SSE | SPTE | SSE | |
| Hangzhou | 1.0000 | 1.0260 | 1.0000 | 0.5682 | 1.0000 | 0.8200 | 1.0000 | 0.7092 | 1.0000 | 0.7808 |
| Ningbo | 0.9047 | 0.7008 | 1.0066 | 0.6979 | 0.8275 | 0.4809 | 0.9030 | 0.4965 | 0.9104 | 0.5882 |
| Wenzhou | 1.0000 | 0.9941 | 1.0000 | 1.0175 | 1.0000 | 1.0159 | 1.0000 | 0.8983 | 1.0000 | 0.9814 |
| Jiaxing | 0.4484 | 0.9927 | 0.5183 | 0.9512 | 0.5569 | 0.9928 | 0.4621 | 0.9879 | 0.4964 | 0.9802 |
| Huzhou | 0.4834 | 0.9759 | 0.3120 | 0.9447 | 0.3622 | 0.9737 | 0.3269 | 0.9892 | 0.3711 | 0.9697 |
| Shaoxing | 0.7804 | 0.9343 | 0.6404 | 0.8694 | 0.9417 | 0.9729 | 0.8779 | 0.9176 | 0.8101 | 0.9270 |
| Jinhua | 0.8375 | 0.9758 | 0.3469 | 0.9637 | 0.7147 | 0.9749 | 0.6610 | 0.9751 | 0.6400 | 0.9745 |
| Quzhou | 0.5528 | 0.8379 | 0.4090 | 0.7632 | 0.5314 | 0.7946 | 0.4310 | 0.8071 | 0.4811 | 0.7936 |
| Zhoushan | 1.0000 | 1.0000 | 1.0000 | 1.0000 | 1.0000 | 1.0000 | 1.0000 | 1.0000 | 1.0000 | 1.0000 |
| Taizhou | 0.9410 | 0.7492 | 1.0188 | 1.0467 | 0.9498 | 0.7520 | 0.9432 | 0.8865 | 0.9632 | 0.8577 |
| Lishui | 0.8183 | 0.8787 | 0.7495 | 0.8619 | 1.2031 | 1.0372 | 0.8166 | 0.9484 | 0.8969 | 0.9310 |
| Average | 0.7970 | 0.9150 | 0.7274 | 0.8804 | 0.8261 | 0.8923 | 0.7656 | 0.8741 | 0.7790 | 0.8895 |
| S.D. | 0.1995 | 0.1046 | 0.2790 | 0.1420 | 0.2428 | 0.1600 | 0.2408 | 0.1461 | 0.2270 | 0.1200 |
Table 4.
Dynamic environmental efficiency of various pollutants and the growth rate of their decomposition index from 2006 to 2016.
Table 4.
Dynamic environmental efficiency of various pollutants and the growth rate of their decomposition index from 2006 to 2016.
| Efficiency Indicator | T | PTEC | SEC | TPI | |
|---|---|---|---|---|---|
| SO2 | average annual | 24.20 | −1.40 | 2.03 | 30.49 |
| cumulative value | 603.29 | −11.88 | 19.79 | 997.12 | |
| Smoke & Dust | average annual | 15.07 | 6.59 | 8.31 | 18.44 |
| cumulative value | 253.75 | 77.62 | 105.19 | 358.71 | |
| NOx | average annual | 12.94 | 2.62 | 6.85 | 11.28 |
| cumulative value | 198.90 | 26.21 | 81.55 | 161.69 | |
| Industrial waste gas | average annual | 7.28 | 6.87 | 10.25 | 1.91 |
| cumulative value | 88.20 | 81.81 | 140.71 | 18.54 | |
| Overall pollutants (%) | average annual | 13.13 | 0.65 | 3.46 | 13.55 |
| cumulative value | 203.51 | 6.02 | 35.76 | 213.79 | |
Table 5.
Results of dynamic atmospheric environmental efficiencies and its detail decomposition results in Zhejiang Province.
Table 5.
Results of dynamic atmospheric environmental efficiencies and its detail decomposition results in Zhejiang Province.
| Cities | SO2 | Smoke & Dust | NOx | Industrial waste gas | T | PTEC | SEC | TPI |
|---|---|---|---|---|---|---|---|---|
| Hangzhou | 1.2772 | 1.3152 | 1.1439 | 1.1569 | 1.2147 | 1.0000 | 1.0523 | 1.1908 |
| Ningbo | 1.3673 | 1.1864 | 1.2880 | 1.0333 | 1.2059 | 1.0158 | 1.0661 | 1.1997 |
| Wenzhou | 1.3210 | 1.2314 | 1.1735 | 1.1276 | 1.1993 | 1.0000 | 1.0012 | 1.1827 |
| Jiaxing | 1.3271 | 1.1598 | 1.1709 | 1.0937 | 1.1691 | 1.0420 | 1.0046 | 1.1690 |
| Huzhou | 1.1827 | 1.1233 | 1.0861 | 1.1017 | 1.1217 | 0.9829 | 1.0011 | 1.1838 |
| Shaoxing | 1.2779 | 1.1802 | 1.1407 | 1.0915 | 1.1399 | 1.0362 | 1.0290 | 1.1580 |
| Jinhua | 1.2016 | 1.1568 | 1.1568 | 1.0726 | 1.1215 | 0.9837 | 1.0051 | 1.1643 |
| Quzhou | 1.0579 | 1.1735 | 1.0743 | 1.0357 | 1.0538 | 0.9912 | 1.3048 | 1.1760 |
| Zhoushan | 1.6377 | 1.2798 | 1.1778 | 0.9951 | 1.1884 | 1.0000 | 1.0000 | 1.1884 |
| Taizhou | 1.3865 | 1.0631 | 1.1963 | 1.1097 | 1.1476 | 1.0233 | 1.0192 | 1.1521 |
| Lishui | 1.1465 | 1.1193 | 1.0372 | 1.0588 | 1.0687 | 1.0237 | 0.9647 | 1.1402 |
| Average | 1.2894 | 1.1808 | 1.1496 | 1.0797 | 1.1482 | 1.0090 | 1.0407 | 1.1732 |
Table 6.
High and Low classification of atmospheric environmental efficiency in 11 cities in Zhejiang Province.
Table 6.
High and Low classification of atmospheric environmental efficiency in 11 cities in Zhejiang Province.
| City | SO2 | Smoke & Dust | NOx | Industrial Waste Gas | Overall Classification |
|---|---|---|---|---|---|
| Hangzhou | H/L | L/H | H/H | H/H | H/H |
| Ningbo | L/H | H/H | L/H | L/L | L/H |
| Wenzhou | H/H | H/H | H/H | H/H | H/H |
| Jiaxing | L/H | L/L | L/H | L/H | L/H |
| Huzhou | L/L | L/L | L/L | L/H | L/L |
| Shaoxing | H/L | L/L | H/L | H/H | H/L |
| Jinhua | H/L | L/L | L/H | H/L | L/L |
| Quzhou | L/L | L/L | L/L | L/L | L/L |
| Zhoushan | H/H | H/H | H/H | H/L | H/H |
| Taizhou | L/H | H/L | L/H | H/H | H/L |
| Lishui | L/L | H/L | H/L | H/L | H/L |
© 2019 by the authors. Licensee MDPI, Basel, Switzerland. This article is an open access article distributed under the terms and conditions of the Creative Commons Attribution (CC BY) license (http://creativecommons.org/licenses/by/4.0/).
Share and Cite
MDPI and ACS Style
Lu, Y.-y.; He, Y.; Wang, B.; Ye, S.-s.; Hua, Y.; Ding, L. Efficiency Evaluation of Atmospheric Pollutants Emission in Zhejiang Province China: A DEA-Malmquist Based Approach. Sustainability 2019, 11, 4544. https://doi.org/10.3390/su11174544
AMA Style
Lu Y-y, He Y, Wang B, Ye S-s, Hua Y, Ding L. Efficiency Evaluation of Atmospheric Pollutants Emission in Zhejiang Province China: A DEA-Malmquist Based Approach. Sustainability. 2019; 11(17):4544. https://doi.org/10.3390/su11174544
Chicago/Turabian StyleLu, Ying-yu, Yue He, Bo Wang, Shuang-shuang Ye, Yidi Hua, and Lei Ding. 2019. "Efficiency Evaluation of Atmospheric Pollutants Emission in Zhejiang Province China: A DEA-Malmquist Based Approach" Sustainability 11, no. 17: 4544. https://doi.org/10.3390/su11174544
Note that from the first issue of 2016, this journal uses article numbers instead of page numbers. See further details here.