Tracking the Spatial–Temporal Evolution of Carbon Emissions in China from 1999 to 2015: A Land Use Perspective


1
The State Key Laboratory of Remote Sensing Science, Institute of Remote Sensing and Digital Earth, Chinese Academy of Sciences, Beijing 100101, China
2
University of Chinese Academy of Sciences, Beijing 100049, China
3
Department of Environmental Sciences, Policy and Management, University of California, Berkeley, CA 94720-3114, USA
4
Key Laboratory of Ecosystem Network Observation and Modeling, Institute of Geographical Sciences and Natural Resources Research, Chinese Academy of Sciences, Beijing 100101, China
*
Author to whom correspondence should be addressed.
Sustainability 2019, 11(17), 4531; https://doi.org/10.3390/su11174531
Submission received: 16 July 2019
/
Revised: 15 August 2019
/
Accepted: 18 August 2019
/
Published: 21 August 2019
(This article belongs to the Section Sustainable Urban and Rural Development)
Abstract
:China has been a leader in global carbon emissions since 2006. The question of how to reduce emissions while maintaining stable economic growth is a serious challenge for the country. To achieve this, it is of great significance to track the spatial and temporal evolution of carbon emissions in China during recent decades, which can provide evidence-based scientific guidance for developing mitigation policies. In this study, we calculated the carbon emissions of land use in 1999–2015 using the carbon emissions factor method proposed by the Intergovernmental Panel on Climate Change (IPCC). The Kuznets curve model was used to explore the influence of economic growth and urbanization on carbon emissions at the national and provincial levels. The results indicated that (1) China’s emissions increased from 927.88 million tons (Mt) in 1999 to 2833.91 Mt in 2015 at an average annual growth rate of 12.94%, while carbon sinks grew slightly, from 187.58 Mt to 207.19 Mt. Both emissions and sinks presented significant regional differences, with the Central and Southwest regions acting as the biggest emissions and sink contributors, respectively. (2) Built-up land was the largest land carrier for carbon emissions in China, contributing over 85% to total emissions each year; and (3) at the national level, the relationships between economic growth, urbanization, and carbon emissions presented as inverted U-shaped Kuznets curves, which were also found in the majority of the 30 studied provinces. While carbon emissions may be reaching a peak in China, given the disproportionate role of built-up land in carbon emissions, efforts should be devoted to limiting urbanization and the production of associated carbon emissions.

1. Introduction
Climate change is profoundly affecting human survival and development, becoming a major challenge all countries have to face [1]. Since the Industrial Revolution, a vastly increasing amount of human-induced greenhouse gas emissions, mainly carbon dioxide, has been acting as the most important anthropogenic factor for global climate change [2]. In response to climate change and sustainable development, the global community has developed a series of global emissions reduction agreements, such as the Kyoto Protocol and the Paris Agreement, since the end of the 20th century. China has experienced rapid industrialization and urbanization since joining the World Trade Organization (WTO) in 2001 [3]. The nation’s economy tripled between 2000 and 2014 [4], and it became the world’s second-largest economy in 2010. Coupled with remarkable economic growth, China has become the world’s largest carbon emitter since 2006 [5], accounting for nearly 63% of the increase in global carbon emissions during 2006–2013 [6]. Clearly, China plays a critical role in global carbon emissions abatement. As a responsible global power, the Chinese government has made ambitious commitments to reduce carbon emissions per unit of gross domestic product (GDP) by 40%–50% relative to 2005 levels by the year 2020 [7] and to peak its emissions prior to 2030 [8]. To realize these goals, the Chinese government has made climate change mitigation and sustainable development a top priority in its national planning.
An accurate and reliable carbon accounting is the benchmark for emissions reduction policies and targets [9]. Moreover, China has a vast territory and great regional disparities in terms of economic growth, natural resources, population, and lifestyles [10]. Consequently, there is an urgent need for China’s carbon emissions to be accurately quantified and well understood at the provincial level [11,12]. This will not only shed light on effectively achieving China’s national emissions reduction by developing more targeted emissions abatement policies at the provincial scale, but it is also of great significance for combating global climate change [6].
Land use acts as a coupled system linking human socioeconomic and natural ecological environments, providing an important and comprehensive perspective for conducting global environmental change, especially anthropogenic carbon emissions research [13]. On the one hand, as a natural driver of carbon sources and carbon sinks in terrestrial ecosystems, the transformation of land use types and management is an important factor contributing to the rapid growth of global carbon emissions. According to recent research, direct carbon emissions from land use and its changes during 1850–1998 accounted for about one-third of the total emissions from human activities in the same period, and their impact on the global carbon cycle should be taken seriously [13]. On the other hand, land use also serves as a socioeconomic space carrier for carbon emissions caused by human production and living (about two-thirds of the total anthropogenic carbon emissions) [14]. Comprehensively calculating the carbon emissions from land use at different scales and analyzing their driving forces can not only help to develop an in-depth understanding of the intrinsic mechanism affecting carbon emissions by human activities and natural processes through land use [15], but can also assist in guiding regional low-carbon development from the perspectives of land use planning and land development [16]. Therefore, research on the carbon effects of land use has attracted more and more research scholars, government policy-makers, and companies, as well as nongovernmental organizations (NGOs), during recent years.
Previous studies have mainly focused on carbon emissions taking place on a single land use type, such as emissions from agricultural land [17] or built-up land [18]. A comprehensive carbon emissions estimation system based on land use remains poorly documented at the provincial level in China. Moreover, due to data limitation, little research has calculated provincial carbon emissions of land use on a consecutive time series basis, which is considered to be of great significance for the development of carbon reduction policies and their timely adjustment [19]. China has won global attention for its tremendous progress in economic development since the implementation of reform and opening-up policies in 1978, with the population urbanization rate rising from 17.9% in 1978 to 57.96% in 2017 [20]. The rapid development of urbanization has obviously posed a dilemma between economic improvement and ecological conservation [21]. For decades, China has relied on a development pathway characterized by high carbon emissions intensity [22]. In light of this, the Chinese government has recently pledged a new development model by accelerating the optimization and upgrading of the economic structure, enhancing the capability of scientific and technological innovation, and prioritizing green development [23]. However, it still remains questionable whether the further development of urbanization and economic growth can coexist with carbon emissions abatement. Although some scholars have sought to address this issue, most of them have focused on a few economically developed regions. For instance, Xu et al. [24] explored the impact of urbanization on carbon emissions in the Pearl River Delta region during 1990–2014. This was far from adequate to accurately reflect the real situation of interaction between carbon emissions and economic development and urbanization at the provincial scale in China.
In this study, we attempted to fill the knowledge gaps mentioned above. The specific objectives of this study were (1) to quantify the provincial carbon emissions/sinks in China during 1999–2015 from the land use perspective by establishing a comprehensive land use carbon emissions estimation system based on the Intergovernmental Panel on Climate Change (IPCC) assessment approach; (2) to characterize the spatial and temporal evolution of carbon emissions and carbon sinks at multiple scales, including national, regional, and provincial scales; (3) to quantitatively investigate the relationships between carbon emissions and economic development and urbanization at the national and provincial levels. The results of this study provide baseline data and scientific guidance for effectively achieving low-carbon economic development in China and other developing countries globally.
2. Materials and Methods
2.1. Data Description
In this study, land use data from 1999 to 2015 were retrieved from the China Land and Resources Almanac, the National Bureau of Statistics of China, and the Land Survey Sharing and Application Service Platform (http://tddc.mlr.gov.cn/to_Login). The major land use types included cropland, forest land, grassland, built-up land (subdivided into urban land, rural residential land, and industry–traffic land), water bodies, and unused land. Areas of forest land in 2005 and 2006 were not included because of data unavailability.
Other statistical data included the consumption of agricultural fertilizers, pesticide, plastic film for farm use, and agricultural diesel; effective irrigation areas; the total sown area of major farm crops; the planting areas of three types of rice (i.e., early season, late season, and in-season); and livestock and poultry production (including cattle, sheep, camels, horses, mules, donkeys, pigs, and poultry), all of which were collected from the National Bureau of Statistics of China [25]. The quantities of municipal solid waste going to sanitary landfills, composting, and burning during 2004–2015 were also obtained from the National Bureau of Statistics of China. Further, the amount of chemical oxygen demand (COD) in wastewater was collected from the China Statistical Yearbook on the Environment. Provincial end-of-year population and GDP were acquired from statistical yearbooks of corresponding provinces. Provincial urban population share was collected from the China Population and Employment Statistics Yearbook [26].
Moreover, provincial-level CO2 emissions caused by energy consumption and industrial processes (mainly cement production) were acquired from China Emissions Accounts and Datasets (CEADs, www.ceads.net). CEADs provides accurate and the latest emissions data in China at both the national and provincial scale using up-to-date measurement-based emissions factors, which are considered to be more accurate than IPCC default values [4,9,27,28]. The provincial-level carbon emissions inventories used in this study were compiled based on the latest energy data revision (2015) by the Chinese Statistics Bureau using the IPCC Sectoral Emissions Accounting Approach (in the format of 45 production sectors and two residential sectors).
Due to data limitations, we did not include Tibet, Taiwan, Hong Kong, and Macao in this study. The remaining 30 provinces were then divided into eight regions (namely Beijing–Tianjin, the North, the Northeast, the Central Coast, Central, the South Coast, the Southwest, and the Northwest) frequently used for comparability in carbon emissions analyses [10,29]. A detailed description of the provinces contained within each region is shown in Table 1, and the spatial distribution of eight Chinese regions is presented in Figure 1.
2.2. Carbon Emissions Estimation Method
The 2006 IPCC Guidelines for National Greenhouse Gas Inventories comprised four sources of carbon emissions, namely energy; industrial processes; agriculture, forestry, and other land use; and waste [30]. They provide a simple but effective framework for estimating large-scale carbon emissions and therefore have been adopted extensively worldwide. Previous studies have demonstrated that carbon emissions are closely associated with land use types and land surface characteristics and functions [14]. For instance, the carbon emitted by energy consumed by the construction industry is concentrated on urban land. In this study, we assigned these carbon emissions to different land use types based on the actual distributions of activities in China [14]. Table 2 shows the specific assignment of carbon emissions to the corresponding land use types.
2.2.1. Carbon Emissions of Built-Up Land
In this study, the carbon emissions of built-up land mainly comprised four parts: (1) carbon emissions from energy consumption (excluding the consumption from primary industry); (2) carbon emissions produced by industrial production (i.e., cement production); (3) methane (CH4) emitted by the enteric fermentation and manure management of domestic livestock, including mules, donkeys, pigs, and poultry; and (4) carbon emissions generated during the processing of wastewater and municipal solid waste. The specific calculation method can be expressed as follows:
where CEbuilt-up is the carbon emissions of built-up land; and CEenergy, CEcement, CElivestock, and CEwaste denote the carbon emissions contributed by energy consumed by nonprimary industries, cement production, domestic livestock, and residential and industrial wastewater and solid waste, respectively.
CEADs provides sectoral energy-related CO2 emissions in 30 Chinese provinces based on the combustion consumption data of 17 fossil fuels in 47 sectors and China’s updated survey values of emission factors [28]. Moreover, it also provides process-related CO2 emissions at the provincial level. Since cement production accounts for nearly three-quarters of total process-related carbon emissions in China, CEADs only involves cement production [4]. The emissions data have been widely used in related research in recent years [31,32,33]. In this study, we therefore adopted the calculation results from CEADs. Specifically, CEenergy is calculated as follows:
where CEnon-primary represents the amount of CO2 emissions produced by nonprimary industries, which was collected from CEADs. The constant value of 12/44 is the molecular weight ratio of C/CO2.
Similarly, CEcement can be calculated as follows:
where CEprocess denotes the amount of CO2 emissions generated by cement production, which was also collected from CEADs.
Livestock is one of the most important sources of CH4 emissions in the world [34]. CH4 emissions produced by livestock are mainly through animal enteric fermentation and manure management. In China, livestock husbandry is primarily composed of cattle, sheep, camels, horses, mules, donkeys, pigs, and poultry. Meanwhile, according to the actual situation in China, only mules, donkeys, pigs, and poultry are typically raised in rural residential areas for farming use or are raised in farming factories with large-scale feeding. In contrast, cattle, sheep, camels, and horses are usually raised on Chinese grasslands with grazing. Consequently, in this study, we attributed the carbon emissions of mules, donkeys, pigs, and poultry to built-up land. The CH4 emissions of the aforementioned four types of domestic livestock were estimated based on the approach of the IPCC [30] and Hu and Wang [35]. The specific formula for calculating the CH4 emissions of livestock can be expressed as
where CElivestock is the carbon emissions produced by domestic livestock, Ni denotes the quantity of four different types of livestock (i.e., mules, donkeys, pigs, and poultry), and βi is the corresponding CH4 emissions coefficient of livestock (see Table 3).
It is noted that according to the IPCC [36], the greenhouse effect of 1 ton of CH4 equals that generated by 6.8175 tons of carbon. In this study, for ease of calculation, we converted CH4 emissions to standard C equivalents unless stated otherwise.
Furthermore, the carbon emissions generated during the processing of municipal solid waste and wastewater were estimated following the method proposed by the IPCC [30] and Wang and Geng [37]. It is worth noting that there exist three processing modes for municipal solid waste in China, including sanitary landfills, burning, and composting. The specific calculation method can be expressed as follows:
In Equation (5), CEwaste is the carbon emissions from waste disposal; CElandfill, CEburn, and CEcompost are the carbon emissions of municipal solid waste processing by sanitary landfills, burning, and composting, respectively; while CEwastewater is carbon emissions from wastewater. In Equation (6), C1 and C2 represent CH4 emissions and CO2 emissions, respectively. In Equations (7) and (8), L is the amount of municipal solid waste going to sanitary landfills, DOC is the degradable organic carbon content (12.5%) [38], DOCf is the actual decomposition of degradable organic carbon in the process of landfilling (50%) [30], ρ represents sanitary landfilling CH4 correction factors (100%) [37], γ is the percentage of CH4 in the landfill gas volume (50%) [30], and (16/12) and (44/12) are the molecular weight ratios of CH4/C and CO2/C, respectively. In Equation (9), B is the amount of municipal solid waste going to burning, φ is the combustible carbon content (16.5%) [37], and ω is the omega oxidation factor (85%) [39]. In Equation (10), C is the amount of municipal solid waste going to composting, and DOCf* is the actual decomposition of degradable organic carbon in the process of composting (65%) [40]. In Equation (11), QCOD is the amount of chemical oxygen demand (COD) in wastewater, and VCOD is the maximal ability to release CH4 (0.25) [30].
2.2.2. Carbon Emissions of Cropland
It should be noted that the increased biomass of farm crops through absorbing CO2 from the atmosphere during the growing period will be released into the atmosphere in the short term. Therefore, the carbon sinks of cropland were not taken into account due to its short turnover [41,42]. In this study, the carbon emissions of cropland were principally composed of two parts, namely CH4 emissions from paddy fields and carbon emissions caused by agricultural production activities [16]. The specific calculation method can be expressed as follows:
where CEcropland is the carbon emissions of cropland, CErice denotes the carbon emissions from rice paddies, and CEfarm represents the carbon emissions generated by agricultural production activities.
Rice paddies constitute one of the fundamental sources of CH4 emissions in China [43]. Due to the differences in CH4 emission rates of various rice types (early rice, in-season, and late rice) in different provinces, it was necessary to separately calculate the emissions of different rice types in different provinces. Based on the CH4 emissions coefficients of three rice types in 30 Chinese provinces, which were measured by Min and Hu [44], this study calculated carbon emissions from rice paddies through Equation (13):
where CErice is the carbon emissions from rice paddies, Ri is the area of different rice types in 30 provinces, and τi is the coefficient of the corresponding rice type in each province.
The agriculture ecosystem is an open system. In order to keep it in balance and maintain a high level of productivity, multiple methods are required to invest in materials and energy such as manpower, water, fertilizers, and fossil fuels for various agricultural machinery in different stages of agricultural production. Undoubtedly, these processes are coupled with carbon emissions, albeit mainly in an indirect way. According to existing studies [17,45,46], carbon emissions from agricultural production activities in this study mainly include (1) the carbon emissions generated from the production and usage of fertilizers, pesticides, and agricultural plastic films; (2) the carbon emissions generated by direct or indirect consumption of fossil fuels (mainly agricultural diesel) due to the use of agricultural machinery; (3) the loss of soil organic carbon due to agricultural tillage; and (4) the carbon emissions from fossil fuels consumed by electrical energy used in the agricultural irrigation process.
Based on the IPCC [30], the carbon emissions of agricultural production activities could be computed by Equation (14):
where CEfarm is the carbon emissions from agricultural production activities, Ei is the carbon emissions produced by various emission sources, Ti is the consumption (amount) of different emissions sources, and δi is the corresponding emissions coefficient of one of several different emissions sources (shown in Table 4).
2.2.3. Carbon Emissions of Grassland
Traditionally, grassland is considered an important carbon sink type. However, the latest study by Fang et al. [50] showed that the Chinese grassland ecosystem actually served as a weak carbon source (−3.36 million tons (Mt) of carbon per year) from 2000 to 2010 based on intensive national-level field observations (4030 plots from grasslands) using consistent research designs and protocols, which provided the most accurate estimates on ecosystem carbon stocks, carbon sequestration, and ecosystem functioning in China. Therefore, in this study, we considered grassland to be a carbon source. Specifically, carbon emissions from grassland mainly include two components: (1) carbon released from the grassland ecosystem, including vegetation biomass, dead organic matter (DOM), and soil organic carbon (SOC); and (2) CH4 emissions produced by animals grazing on grasslands. The details are shown in Equation (15):
where CEgrassland is the carbon emissions of grassland in each province, CEecosystem is the carbon emissions from the grassland ecosystem, and CEgrazing is the carbon emissions from grazing.
With reference to previous studies [15,51,52], carbon emissions from the grassland ecosystem were estimated by using carbon emission factors and corresponding land area, which can be expressed as follows:
where CEecosystem denotes the carbon emitted by the grassland ecosystem, Gi is the area of grasslands in each province (ha), and EFgrassland is the carbon emissions factor of grasslands calculated by Fang et al. [50], with the value of 11.93 × 10⁻³ tC·ha−1·yr−1.
As stated, livestock, including cattle, sheep, camels, and horses are usually grazed on grasslands in China [53]. Consequently, CH4 emissions produced by enteric fermentation and manure management of the abovementioned livestock were calculated through Equation (17):
where CEgrazing is the carbon emissions produced by grassland livestock, Mi denotes the quantities of different livestock, and θi is the corresponding CH4 emissions coefficient of livestock (see Table 3).
2.2.4. Carbon Sink of Forest Land
Forests are a primary carbon sink type in China [41], sequestrating 163.4 Mt of carbon per year over the past decade [50]. According to existing research [54], carbon sinks are computed based on the scale of the sink body and the associated carbon sink factor. The specific calculation method can be expressed as follows:
where Csink is the total number of carbon sinks in forest land (TCS), Fi is the area of forest land in each province (ha), and SFforest is the carbon sink factor (0.87 tC·ha−1·yr−1), which was set following the latest research on the carbon sequestration of China’s forest ecosystem based on detailed field investigations in 7800 plots around the country [50].
2.2.5. Total and Net Carbon Emissions from Land Use
In this study, due to data limitations, the carbon emissions of water bodies and unused land were not taken into account. The total carbon emissions (TCE) from land use was the sum of the carbon emissions from built-up land, cropland, and grassland, which can be expressed as follows:
where CEtotal is the total carbon emissions from land use in each province; and CEbuilt-up, CEcropland, and CEgrassland are the carbon emissions of built-up land, cropland, and grassland, respectively.
Moreover, the net carbon emissions (NCE) from land use were calculated as the difference between total carbon emissions and carbon sinks, which can be expressed as follows:
where CEnet is the net carbon emissions, CEtotal is the total carbon emissions from land use, and Csink is the number of carbon sinks in forest land.
2.3. Carbon Emissions Intensity
In our previous study, three forms of carbon emissions intensity (CEI) were proposed [16], namely CEI per unit land area (LCEI), CEI per unit GDP (GCEI), and per capita carbon emissions (PCEI). These indices were used to quantify the carbon emissions intensity from the perspective of land, economic activity, and population, respectively. The specific calculation method is shown as follows:
where CEIland, CEIgdp, and CEIpop represent CEI per unit land area, CEI per unit GDP, and per capita carbon emissions, respectively. CEtotal is the total carbon emissions from land use. Area, GDP, and Pop denote the annual total land area of each province, annual gross domestic product, and annual provincial end-of-year population, respectively.
2.4. Kuznets Curve Model
According to the theory of the environmental Kuznets curve (EKC), at the early stages of economic development, regional environmental conditions deteriorate with economic growth due to the fact that people and governments pay more attention to jobs and income rather than the ecological environment [55]. However, the development of urbanization and economic growth is capable of reversing environmental degradation and further improving environment quality when economic development reaches a certain level [56]. This is because at this stage of development, the development mode of depending heavily on energy consumption and human labor transfers to an economy primarily driven by scientific and technological innovation [16].
In this study, urban population share (UPS) and per capita GDP (GDPPC) were adopted as two widely used quantitative indicators to represent the level of urbanization and economic growth [54]. We employed regression analyses to investigate whether the relationships between urbanization, economic growth, and carbon emissions accorded with the EKC hypothesis (i.e., inverted U-shaped curves) in China and its 30 provinces. The formula used is shown as follows:
where y represents total carbon emissions; x denotes per capita GDP or urban population share; and a, b, and c are the equation coefficients, which determine the curve relationships between carbon emissions and economic growth and urbanization. In detail, if the coefficient of x in the one-dimensional quadratic regression model is a positive value and the coefficient of x2 is negative, then an inverted U-shaped curve relationship is formed. The statistical analysis was performed using the SPSS software package (version 16.0) and was tested at a significance level of 95%.
3. Results
Based on the carbon estimation method illuminated in Section 2.2, the annual land use carbon emissions from 1999 to 2015 were calculated for China and its 30 provinces. To verify the reliability of emissions results in our study, we compared our emissions to estimates by six other authoritative research projects. As shown in Figure 2, the carbon emissions in our study were rather close to those estimated by the Emissions Database for Global Atmospheric Research (EDGAR) and the Carbon Dioxide Information Analysis Centre (CDIAC). The emissions calculated by the Global Carbon Budget (GCB) remained the largest among all calculation results until 2010, replaced by the Multi-Resolution Emissions Inventory for China (MEIC). Our estimation was slightly larger than emissions estimated by other sources in 2011 and 2012, while the EDGAR had the largest carbon estimation after 2012. In contrast, the U.S. Energy Information Administration (EIA) had the smallest carbon emissions estimation from 1999 to 2011, replaced by British Petroleum (BP) thereafter. It is noted that our estimate was larger than the emissions estimated by BP and the EIA due to the fact that BP and the EIA only include energy-related emissions. In general, the differences in carbon emissions between our study and most other research projects were rather small, which indicated that our estimate was reliable and highly consistent with many other authoritative results.
3.1. Temporal Changes in Land Use Carbon Emissions in China
At the national level, the total carbon emissions increased significantly during the period 1999–2015. From 1999 to 2014, the total carbon emissions tripled from 927.88 million tons (Mt) in 1999 to a peak of 2840.00 Mt in 2014 (Table 5), with an average annual growth rate of 13.74%. Emissions then started to decrease slightly, bottoming out at 2833.91 Mt in 2015. In terms of the temporal evolution pattern, carbon emissions in China during 1999–2015 could be divided into four stages: WTO accession (1999–2005), high economic growth (2005–2008), postfinancial crisis (2008–2011), and new normal (2011–2015) (Figure 3). Specifically, during the first stage, China’s total carbon emissions nearly doubled after China joined the WTO, with the annual growth rate increasing sharply from 2.08% in 2000 to 16.05% in 2005. Then, during the second stage, China’s emissions continued to grow with the rapid increase of the national economy, but at a decelerated rate. To be specific, the annual increase rate of emissions decreased from 10.16% in 2006 to 5.42% in 2008, the year during which the most serious financial crisis since the Great Depression of the 1930s hit the global economy [10]. Next, during the period of “postfinancial crisis”, emissions in China kept growing, with the annual growth rate also increasing from 5.92% in 2009 to 10.75% in 2011. This was highly related to economic recovery after the 2008 financial crisis [63]. Finally, during the “new normal” period, emissions in China gradually plateaued, with the annual growth rate decreasing from 1.52% in 2012 to −0.21% in 2015. This was largely due to China’s economic restructuring, which shifted the national focus from a high-quantity pattern with rapid growth to a focus on quality and efficiency [64]. Meanwhile, structural changes in industry and energy usage also contributed immensely to the flattening of carbon emissions in China [8].
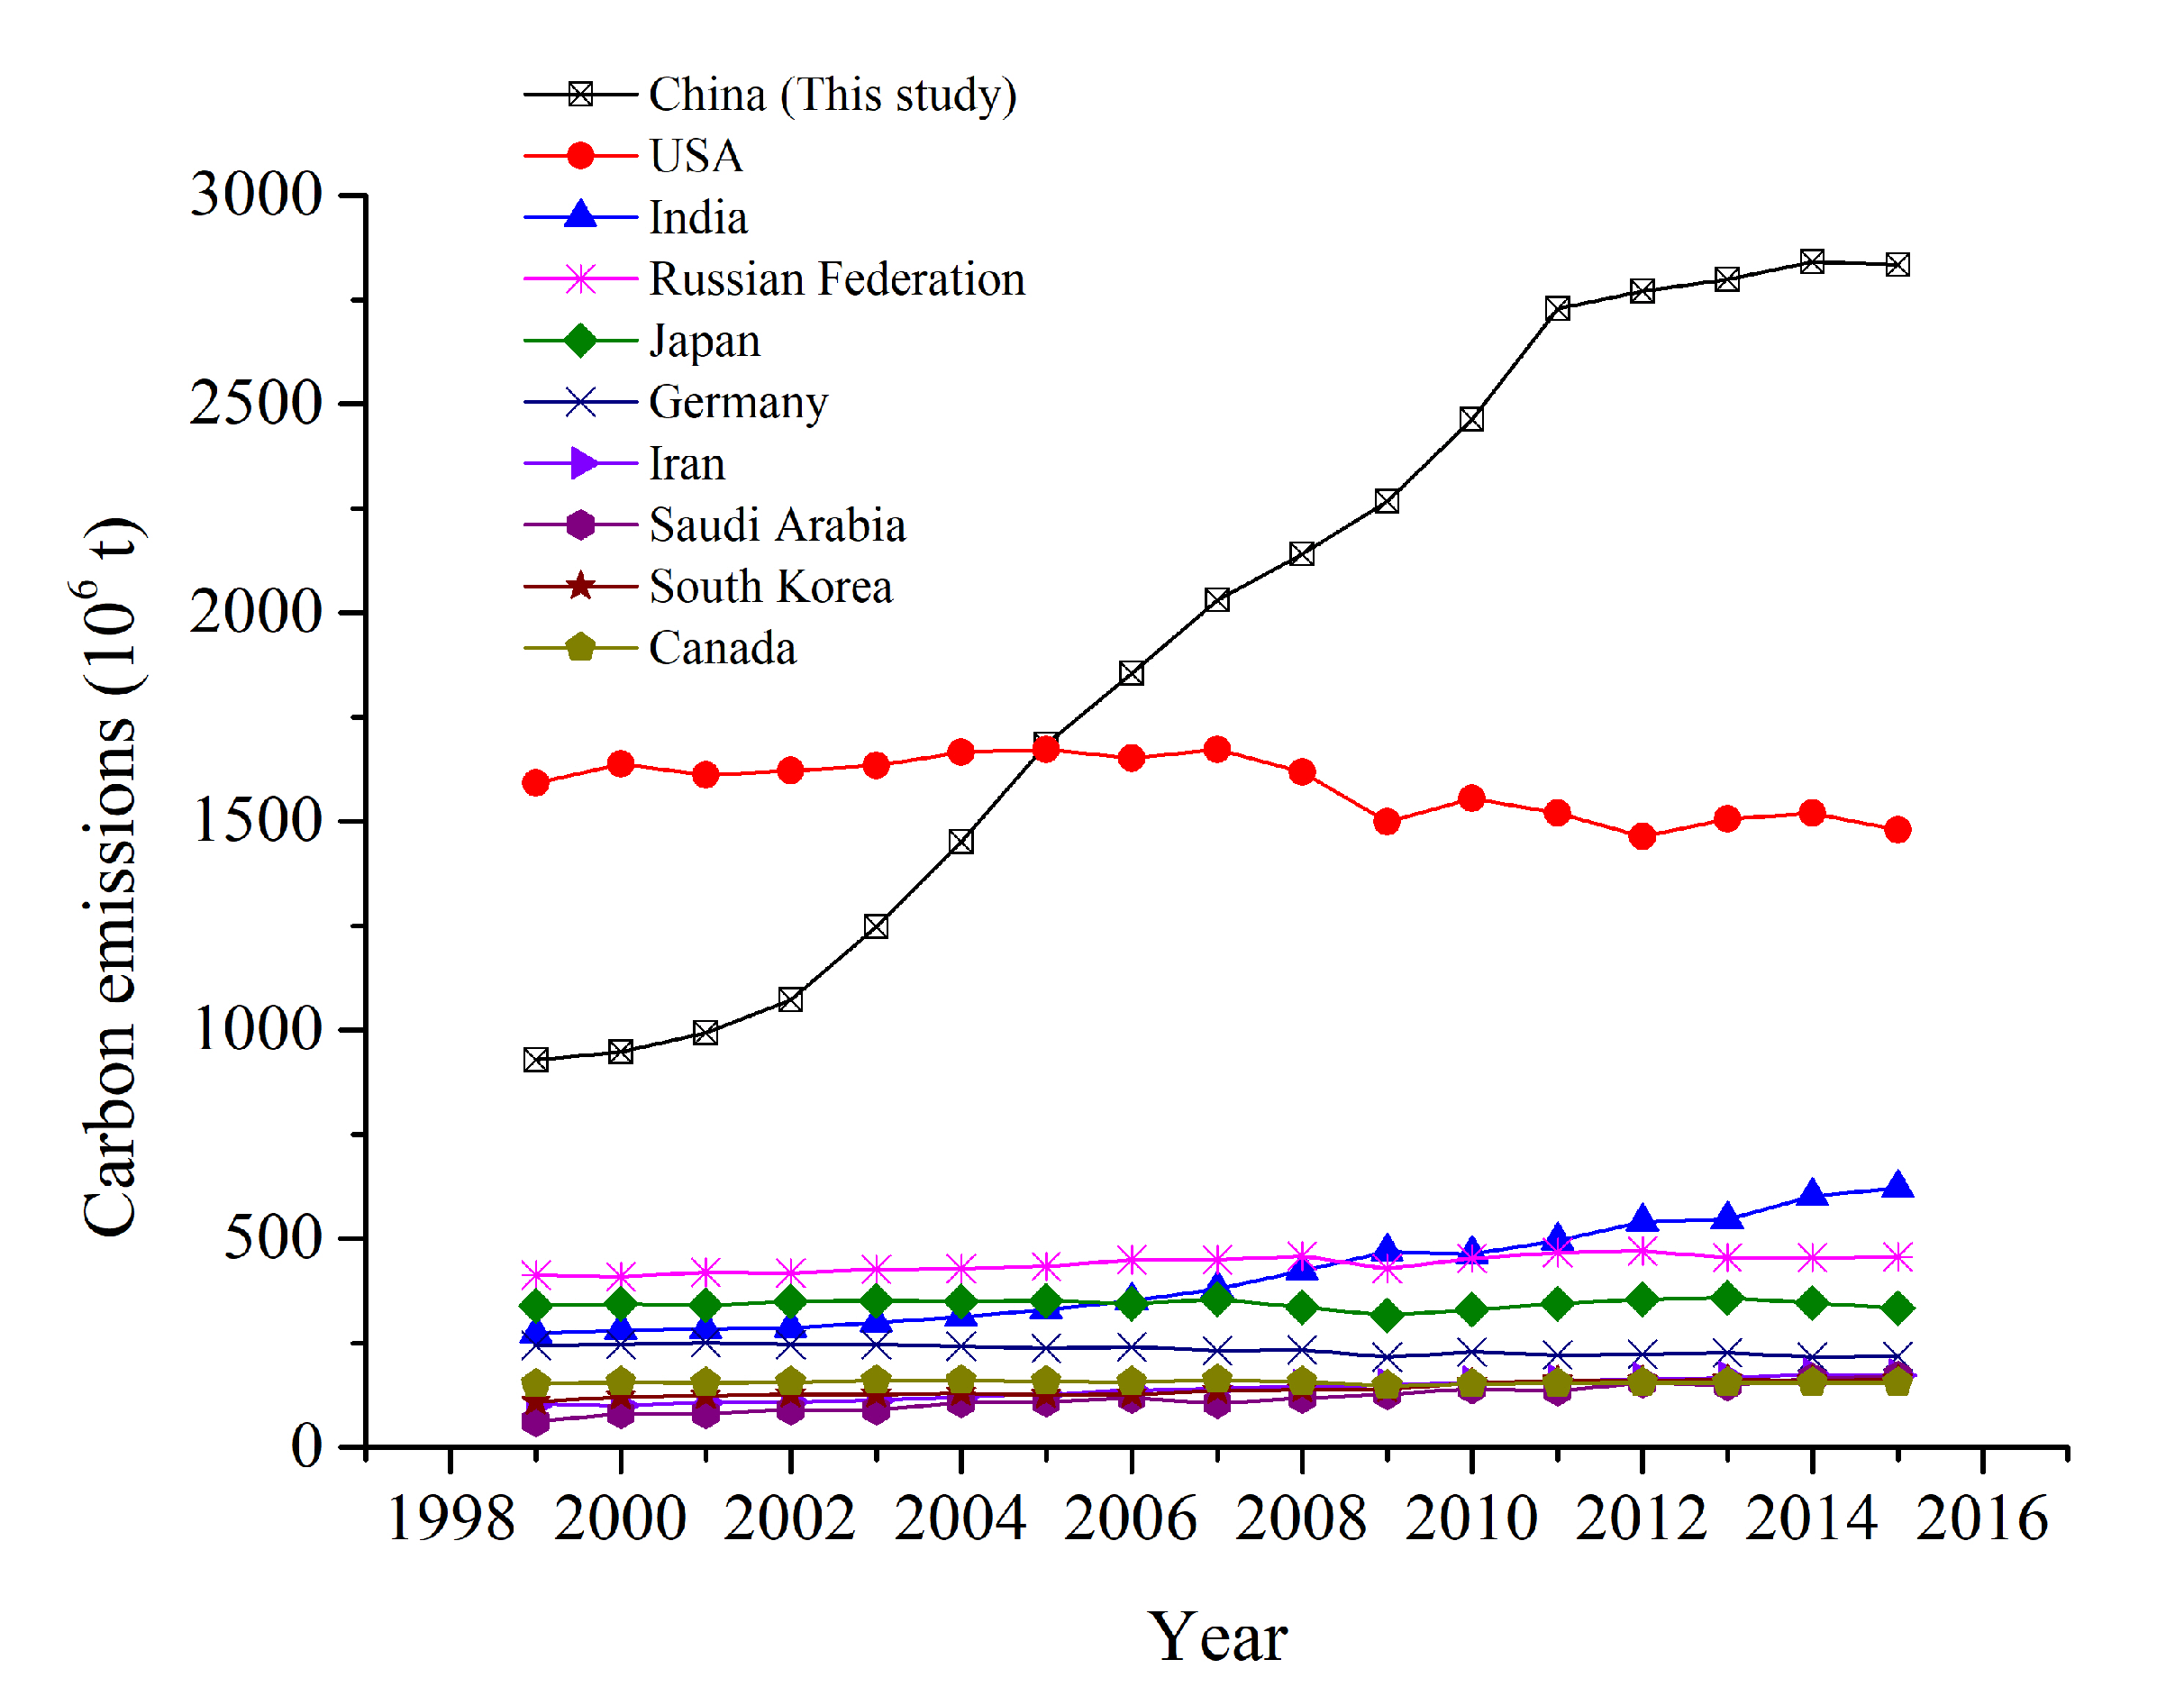
Figure 4 shows carbon emissions in China and in the other top nine carbon emitters in the world. It is clearly shown that China and the USA acted as the two leading countries in carbon emissions globally over the 17 years. However, in contrast to the sharp increase in carbon emissions in China from 1999 to 2015, emissions in the USA were maintained at a relatively stable level (about 1500 Mt per year). China replaced the USA to become the world’s largest emitter starting in 2006. Meanwhile, the other top eight carbon emitters in the world produced far fewer emissions compared to China and the USA, all below 500 Mt per year, except for India, whose emissions grew at an average annual increase rate of 8.05%.
In terms of land use types, built-up land contributed over 85% to total carbon emissions in China, with the ratio constantly rising each year up to 94.22% in 2015 (Table 5). Following built-up land, cropland contributed 13.43% to the total carbon emissions in 1999, with the ratio decreasing gradually to 5.42% in 2015. Moreover, grassland made a minimal contribution (0.36%–1.25%) to China’s total emissions over the 17 years.
In contrast to total emissions, total carbon sinks in China, contributed to predominantly by forest land, increased slightly during 1999–2015, with an overall increase rate of 10.46%. In detail, China’s carbon sinks peaked at 208.02 Mt in 2009 and then marginally decreased to 207.19 Mt in 2015. This was consistent with the remotely sensed observations by Piao et al. [65] and Chen et al. [66], which highlighted a greening China with great potential for carbon sequestration. A recent study by Lu et al. [67] demonstrated that the implementation of state-run ecological restoration projects in China was the primary driver of carbon sink increase from 2001 to 2010. Despite the increase in carbon sinks, the ratio of total carbon emissions to sink expanded from 4.95 to 13.68 between 1999 and 2015.
Furthermore, there was also a spike in the net carbon emissions over the 17 years, increasing from 740.30 Mt in 1999 to 2626.72 Mt in 2015, with an average annual growth rate of 15.93%. From the perspective of three forms of carbon emissions intensity, CEI per unit land area doubled from 420 t/km2 in 1999 to 970 t/km2 in 2015, increasing at an average annual rate of 8.39%. Contrastingly, CEI per unit GDP declined by 61.87% over the 17 years, from 1.15 t/104 yuan in 1999 to 0.44 t/104 yuan in 2015, which was mainly due to the fact that national GDP growth outpaced the growth of carbon emissions in the same period. In addition, this indicated enhanced carbon emissions efficiency in China.
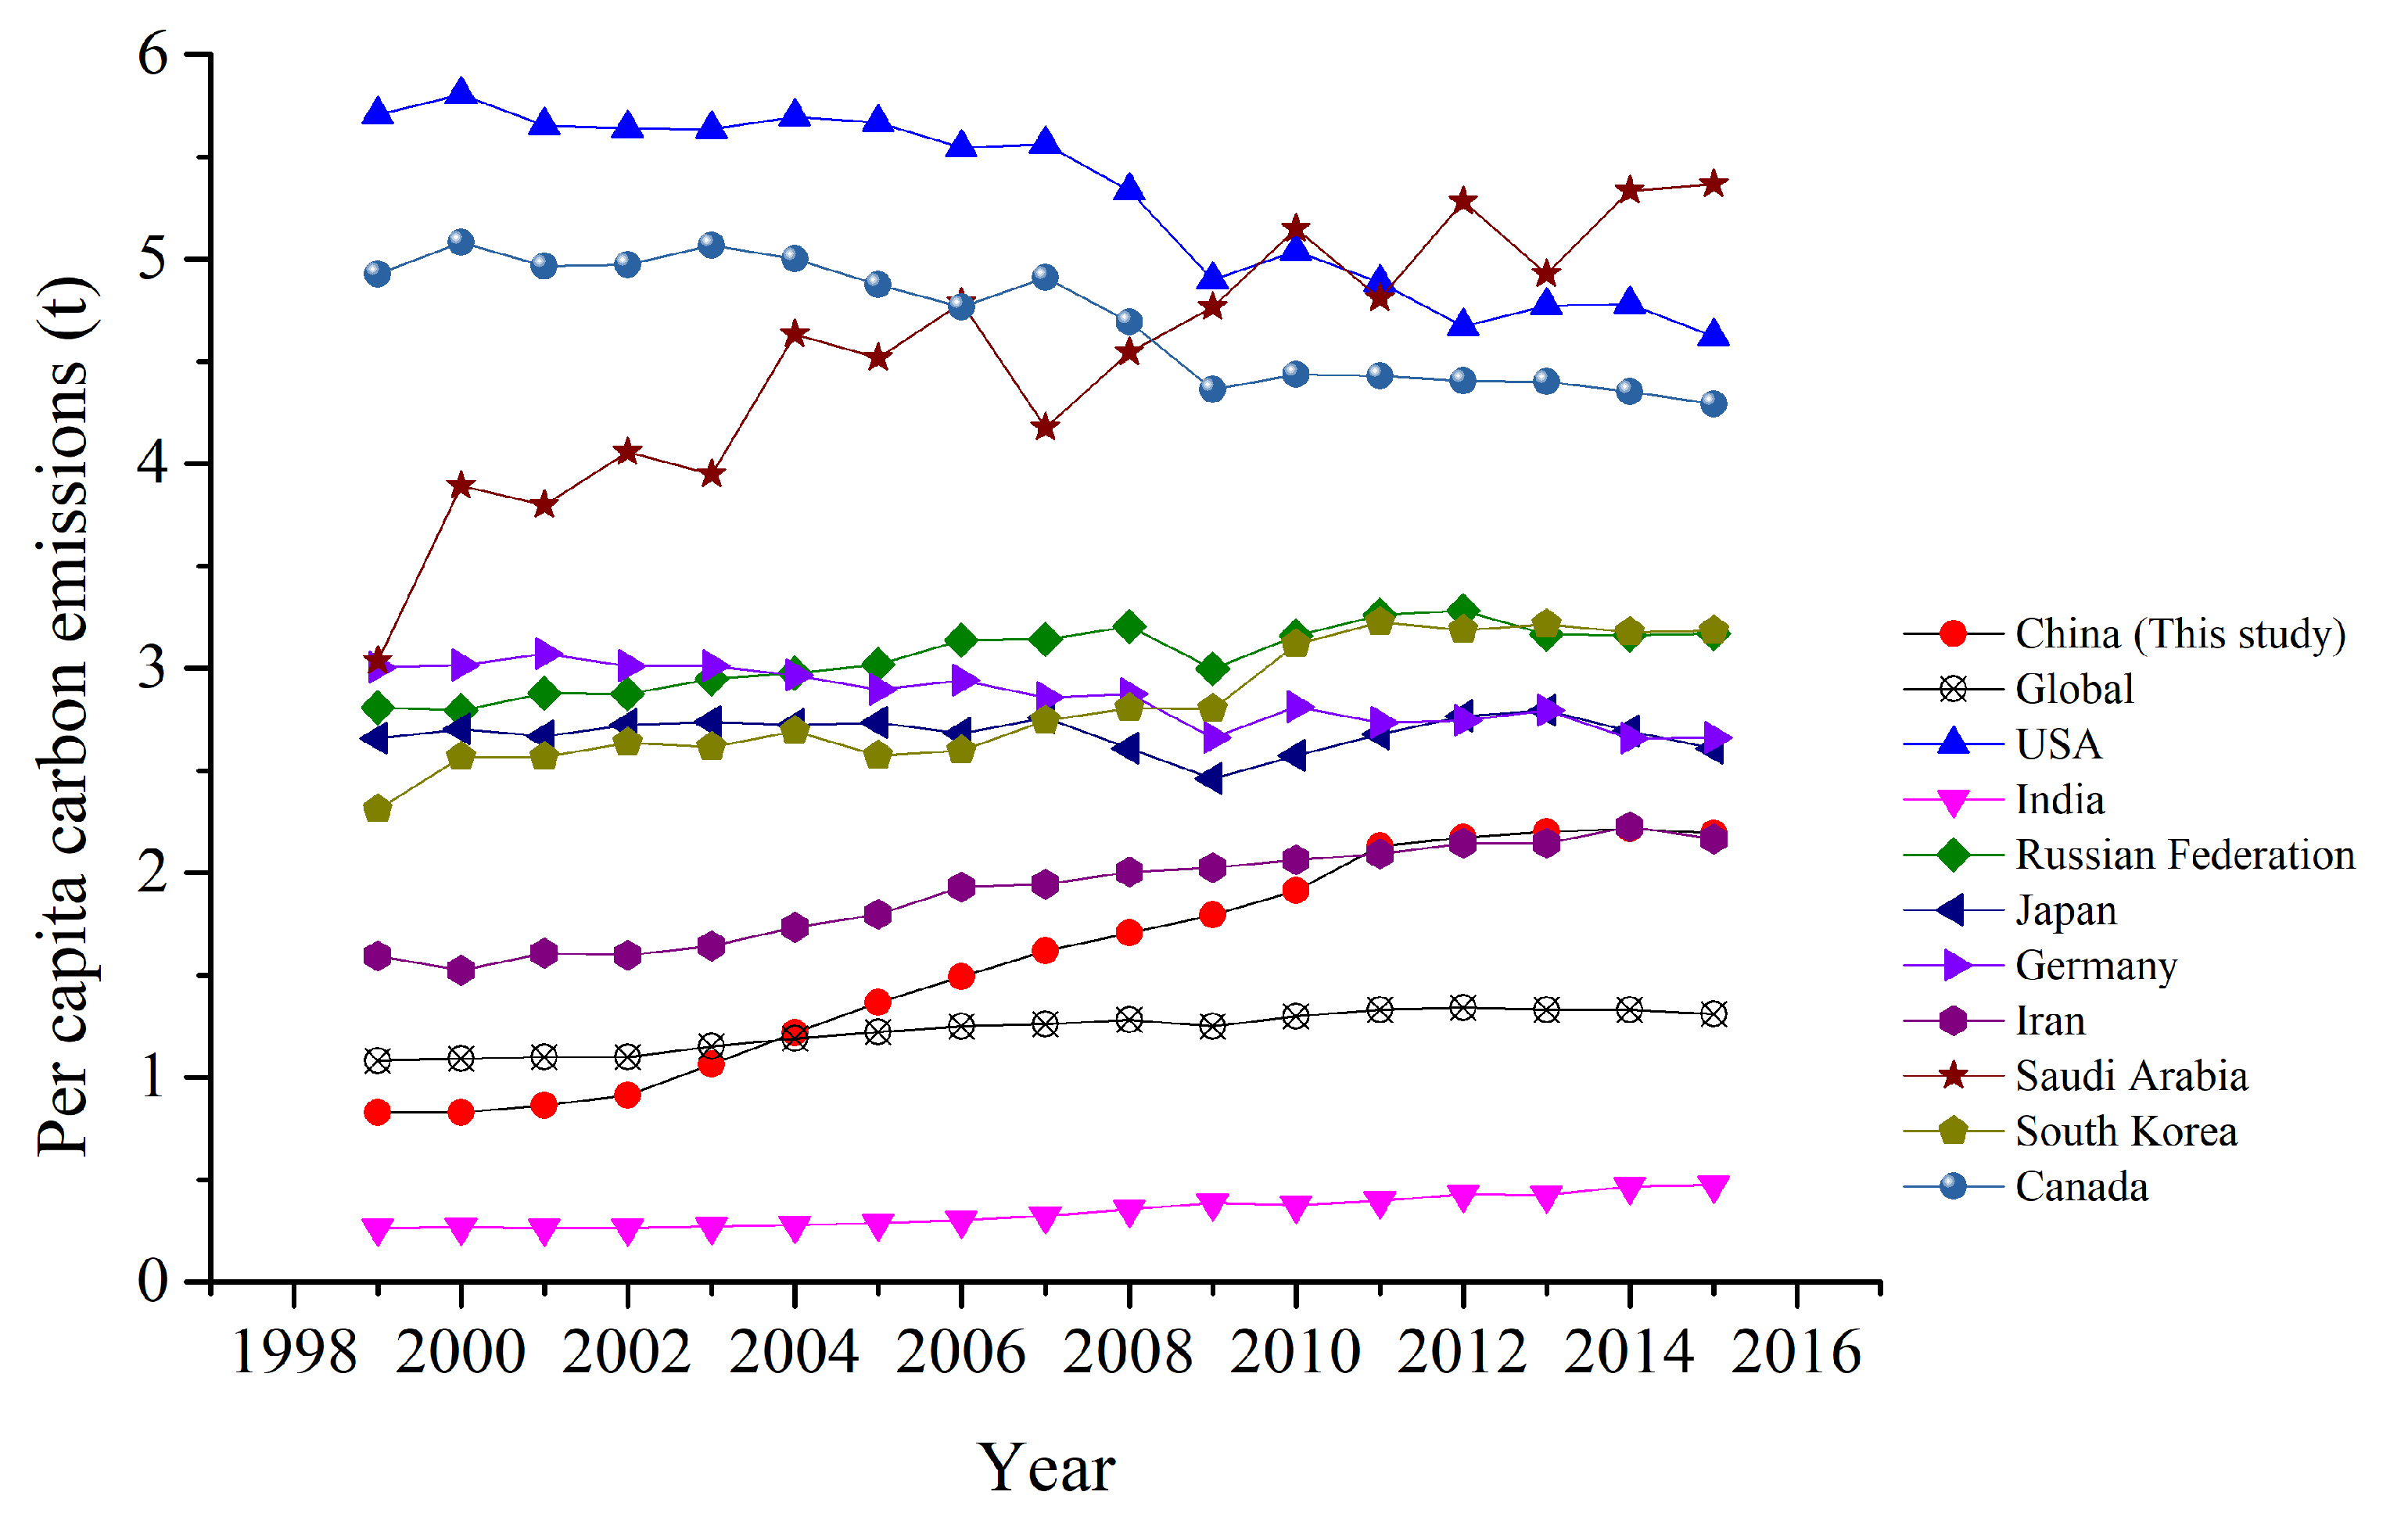
Besides, per capita carbon emissions in China nearly tripled during the period 1999–2015, increasing from 0.83 t in 1999 to 2.19 t in 2015 at an average annual rate of 10.33%. China’s per capita emissions surpassed the global average (about 1.23 t per year) starting in 2005 (Figure 5). Among the top 10 carbon emitters in the world, China had the second smallest per capita emissions from 1999 to 2010, accounting for only 14%–38% of per capita emissions (4.62–5.80 t) from the USA, which was the country having the largest per capita emissions globally before 2010. Meanwhile, as one of the two largest developing countries in the world in terms of population, India had per capita emissions ranging from 0.26 t in 1999 to 0.47 t in 2015, accounting for only 19%–32% of China’s over the 17 years. Differently from many other countries that underwent increasing trends in per capita emissions, the USA and Canada, two of the world’s leading countries in per capita emissions, experienced a decline in per capita emissions, at an average annual rate of 1.19% and 0.81%, respectively.
3.2. Regional Differences in Carbon Emissions
At the regional level, the annual carbon emissions for each of eight Chinese regions showed an increasing trend to different degrees over 1999–2015 (Figure 6a). Clearly, carbon emissions in China presented significant regional differences. To be specific, the Central region contributed the most carbon emissions (nearly a quarter) to China’s total emissions each year, with an average annual increase rate of 11.39%. Following the Central region, the North contributed the second most to the total carbon emissions in China, growing at an average annual rate of 15.42%, higher than the national average annual growth rate (12.84%). Moreover, the Central Coast region acted as the third largest contributor to China’s total emissions, but was replaced by the Northwest region after 2010. It is noted that although the Northwest did not start with high carbon emissions in 1999 (90.32 Mt), its emissions grew at the largest average annual rate (24.68%) among all eight regions, nearly twice the rate of the national average. The Southwest, Northeast, and South Coast regions held the fifth, sixth, and seventh places in China’s total emissions, with average annual growth rates of 11.91%, 9.25%, and 11.52%, respectively, all slightly lower than the national average. Ultimately, the Beijing–Tianjin region contributed the least in carbon emissions to total emissions in China, with the contribution rate decreasing from 3.55% in 1999 to a low point of 2.44% in 2015. Meanwhile, the Beijing–Tianjin region had the smallest average annual growth rate of carbon emissions (6.85%), nearly half of the national average.
Similarly, the annual carbon sinks for each of the eight regions also presented a generally increasing trend in the same period, but at a marginal growth rate per year, except for the Northeast and South Coast regions, which experienced a slight decrease in carbon sinks over the 17 years (Figure 6b). In accordance with carbon emissions, carbon sinks in China also showed distinct regional differences. In detail, annual carbon sinks in the Southwest region increased by 13.79% over the 17 years, from 54.74 Mt in 1999 to 62.28 Mt in 2015, acting as the largest contributor (28.92%–30.06%) to China’s total sinks. Besides, the Northwest region occupied the second place in carbon sink contribution (20.27%–22.70%) in the same period. Meanwhile, the Northwest region had the largest average annual growth rate (1.48%), over twice the rate of the national average (0.65%). Following the Southwest and Northwest regions, the Central region experienced a 2.00% increase in carbon sinks during the period 1999–2015 and contributed the third most to total sinks in China. Furthermore, the Northeast took up fourth place in contributing carbon sinks to the whole nation; however, it underwent a 2.92% decrease in the number of carbon sinks during the 17 years. The South Coast produced the fifth largest number of carbon sinks (approximately 17.00 Mt each year) in China, followed by the Central Coast, North, and Beijing–Tianjin regions. It was noticeable that in addition to the least carbon emissions in China, the Beijing–Tianjin region also generated the lowest number of carbon sinks (about 0.65 Mt annually) among all regions.
3.3. Spatiotemporal Changes in Provincial Carbon Emissions
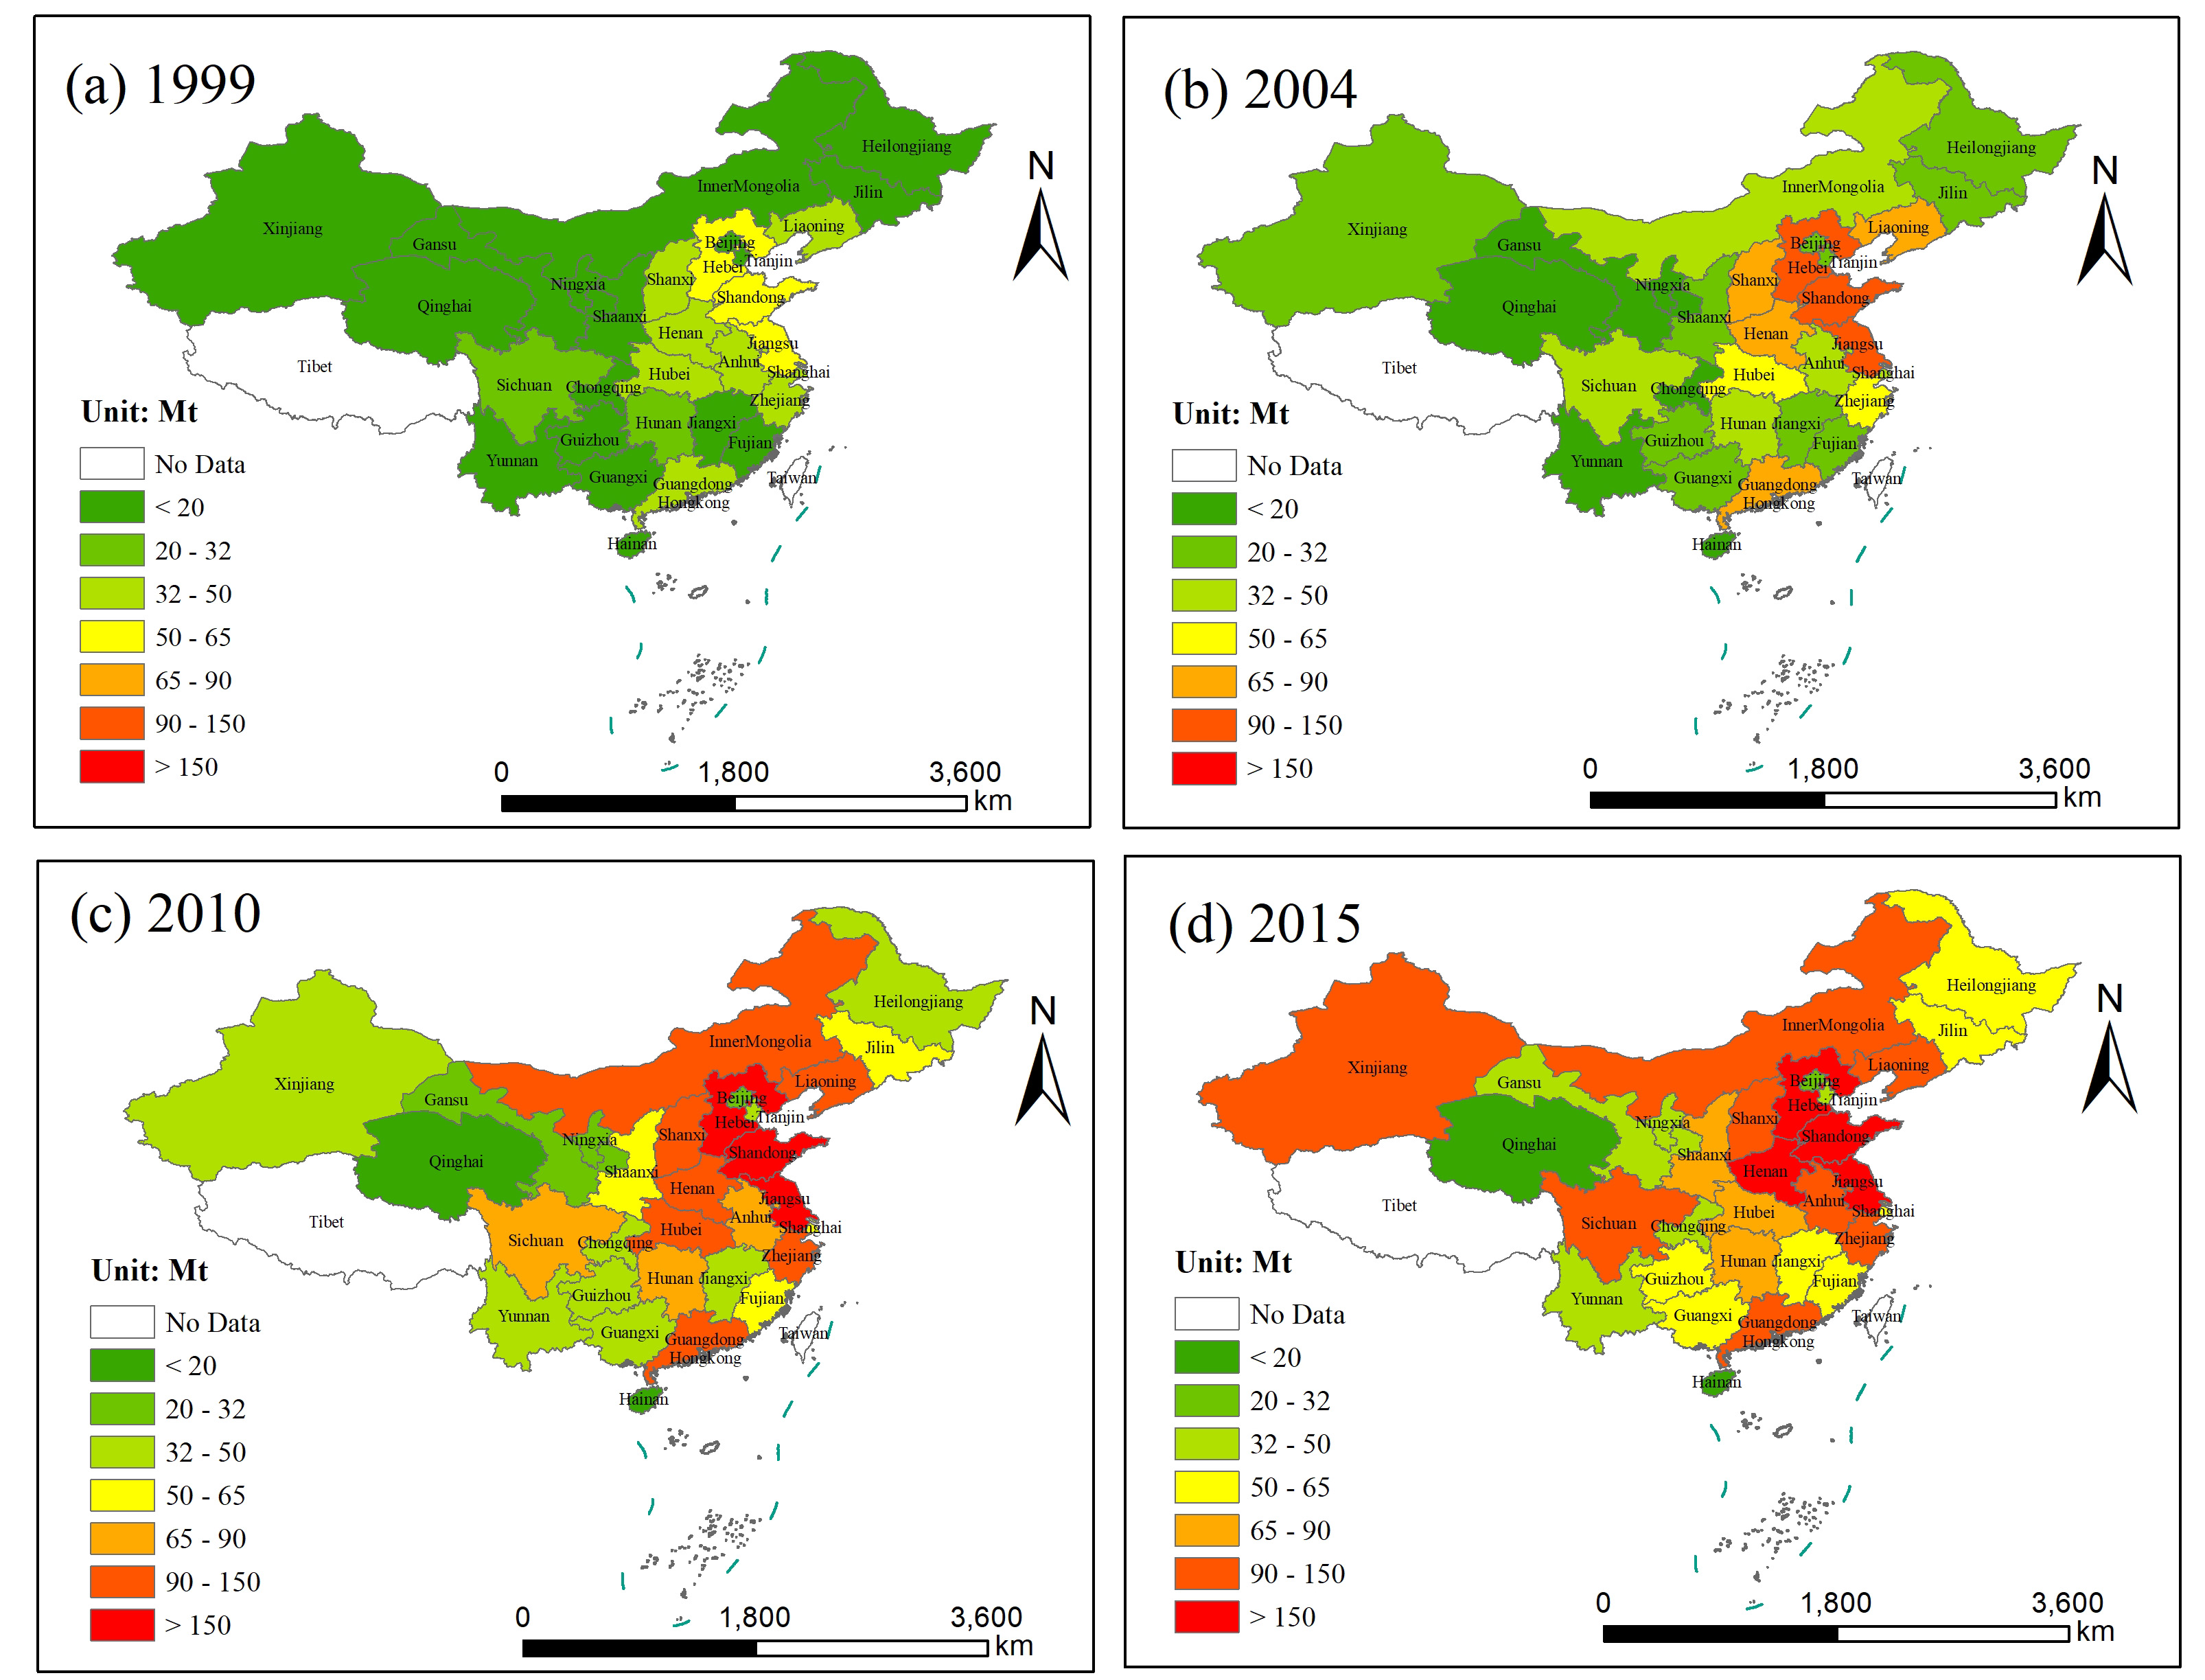
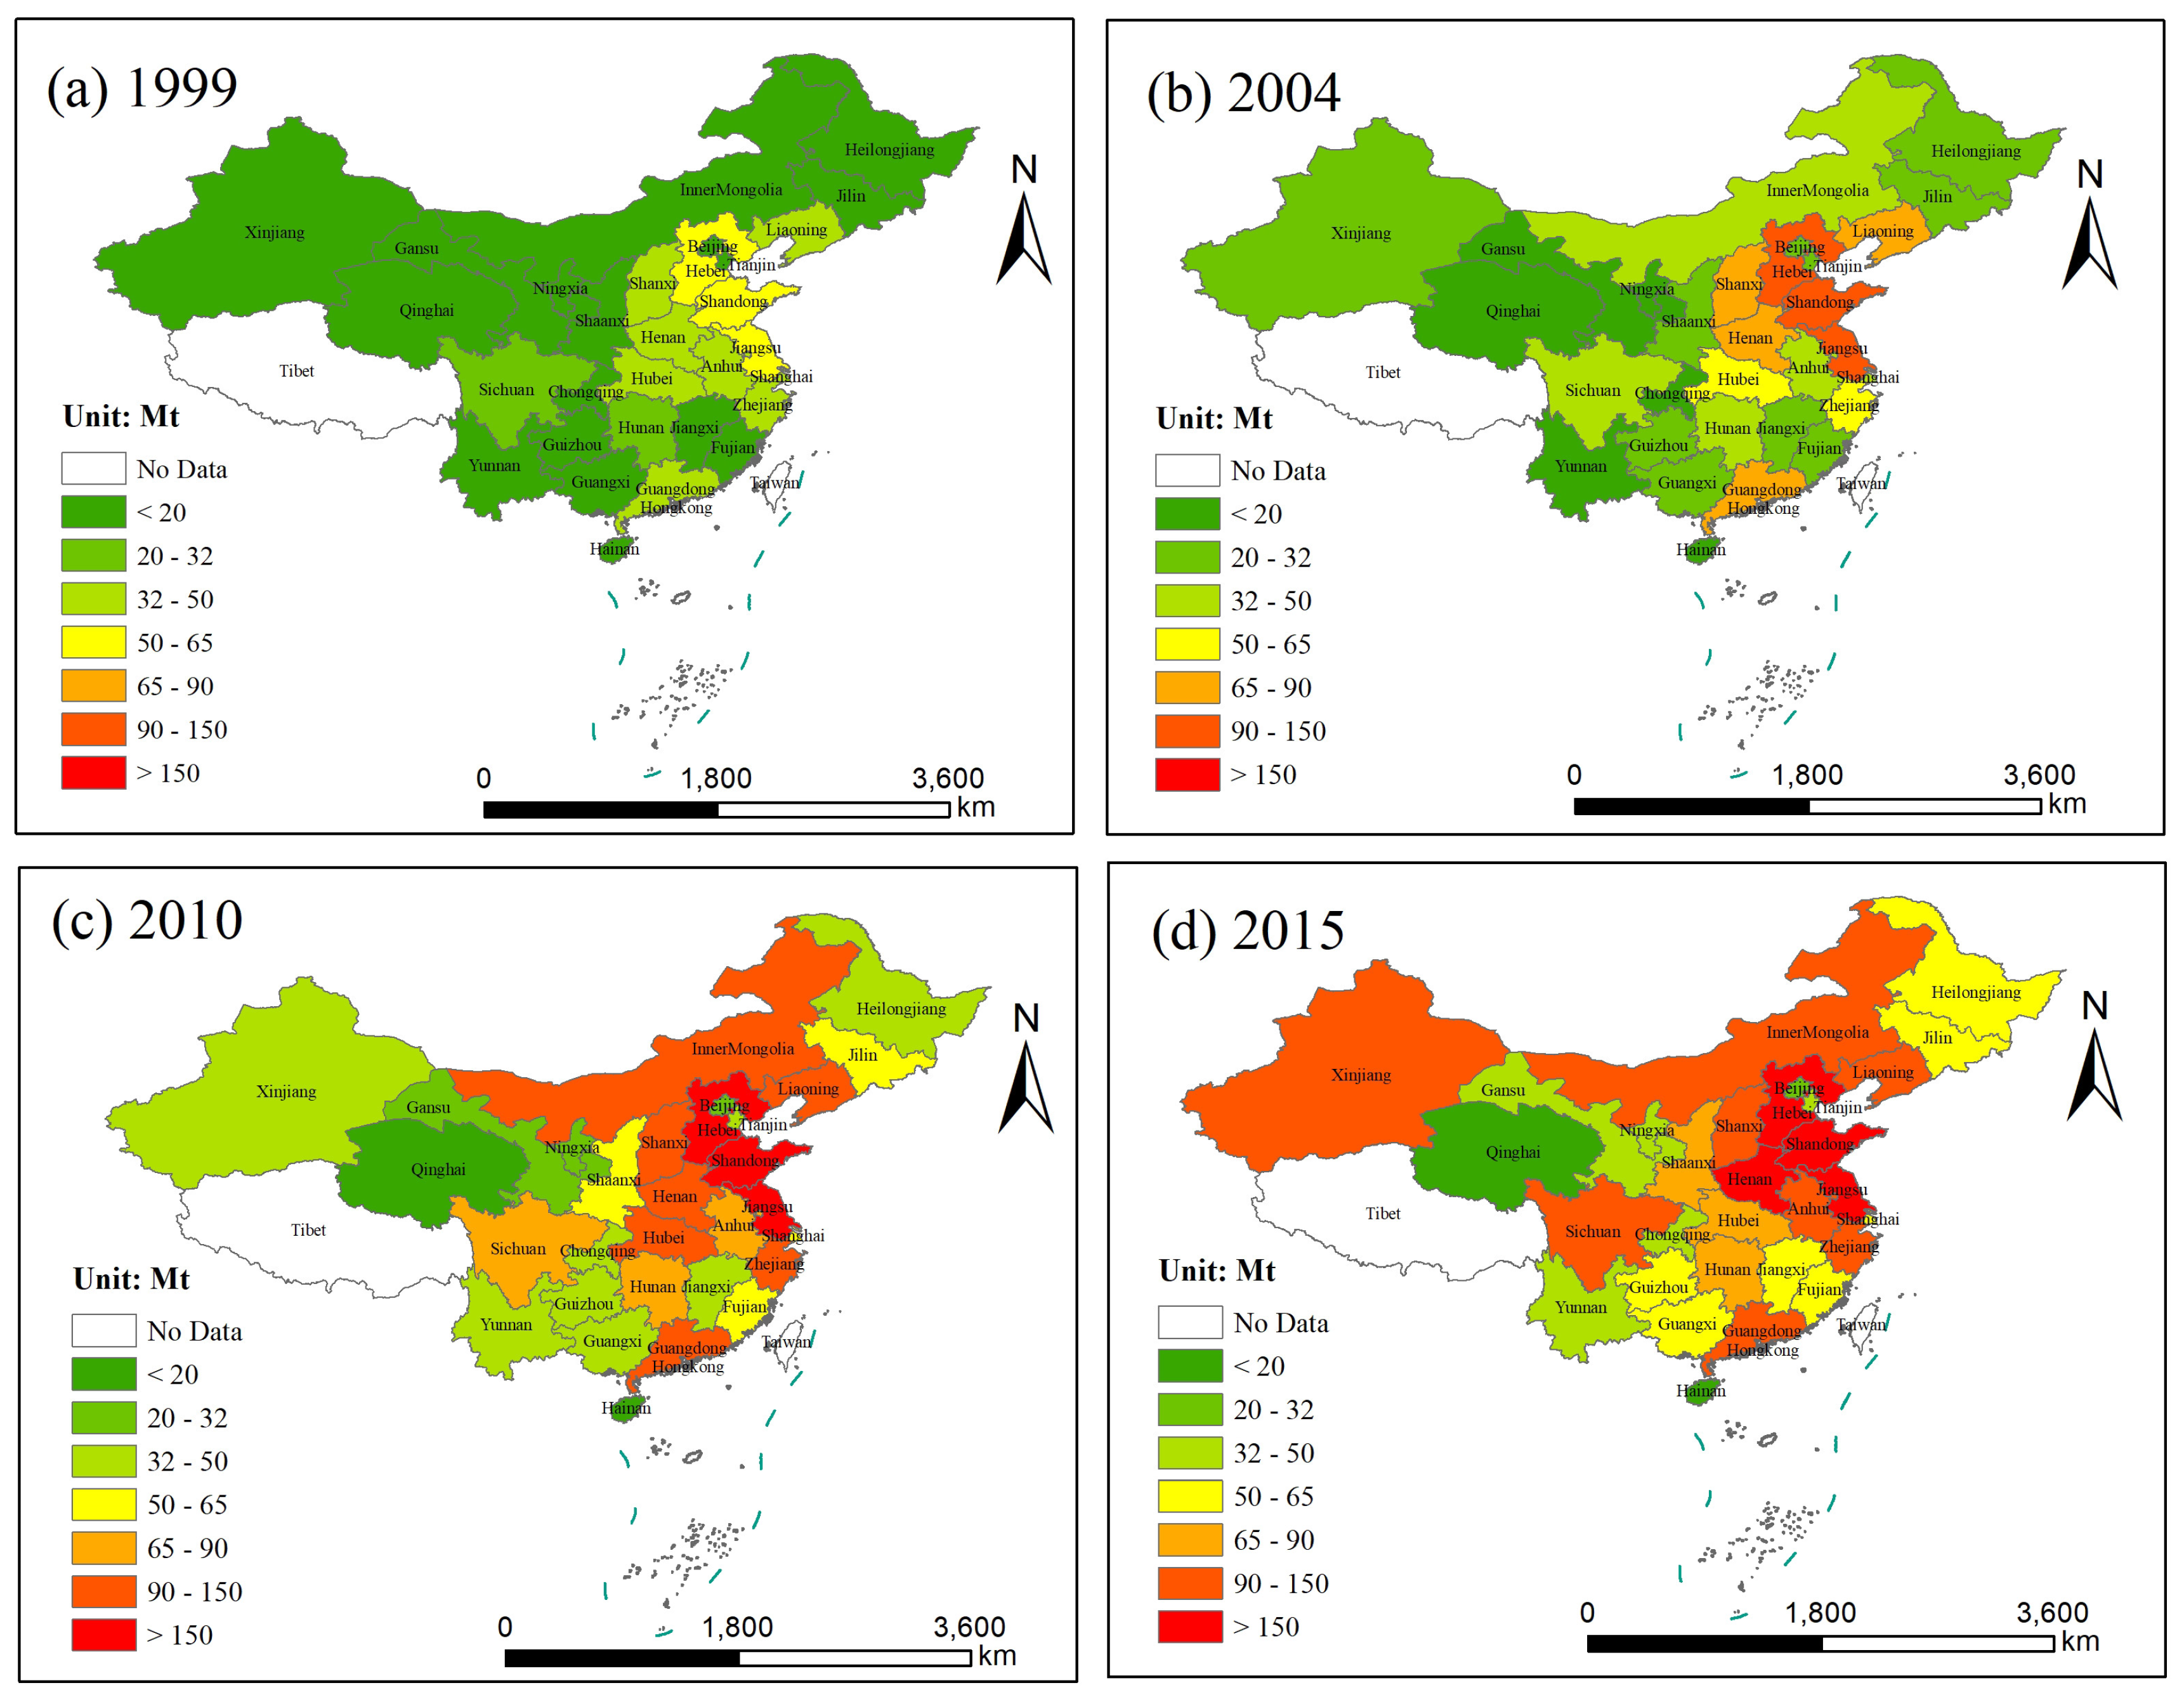
At the provincial level, carbon emissions presented distinct spatial and temporal variations, as shown in Figure 7 and Figure 8. Among all 30 provinces, Shandong produced the most carbon emissions cumulatively (2793.54 Mt) from 1999 to 2015 (Table 6), with an average annual growth rate of 17.20%. Following Shandong, Hebei, Jiangsu, Guangdong, and Henan constituted the top five provincial carbon emitters, which jointly contributed to 34.48% of total national emissions (33,048.05 Mt) during 1999–2015. Figure 8 shows the provincial carbon emissions in a spatially explicit manner. Clearly, it is noted that high emissions were mainly concentrated in eastern, northern, and coastal provinces. Our results indicate that the regional imbalance in carbon emissions was quite prominent in China.
In our study, different land use types contributing to carbon emissions in 30 provinces were also analyzed, as illustrated in Figure 9 and Table 7. It is shown that built-up land was the dominant carbon source type in all provinces. In particular, built-up land in Beijing, Tianjin, and Shanghai accounted for 98.14%, 97.33%, and 96.71%, respectively, of the provincial total carbon emissions in 1999, slightly increasing to 99.25%, 99.06%, and 98.91%, respectively, in 2015. This was largely related to the highly developed urbanization of these regions. In terms of carbon sinks, forest land was the only sink type in our study. The carbon sinks produced by Yunnan, Heilongjiang, and Inner Mongolia altogether contributed 30.08% to total national sinks (187.58 Mt) in 1999. Meanwhile, in 2015, the three provinces with the highest numbers of carbon sinks were Inner Mongolia, Yunnan, and Sichuan. In addition, Shanghai, Tianjin, and Beijing were the regions generating the lowest number of carbon sinks.
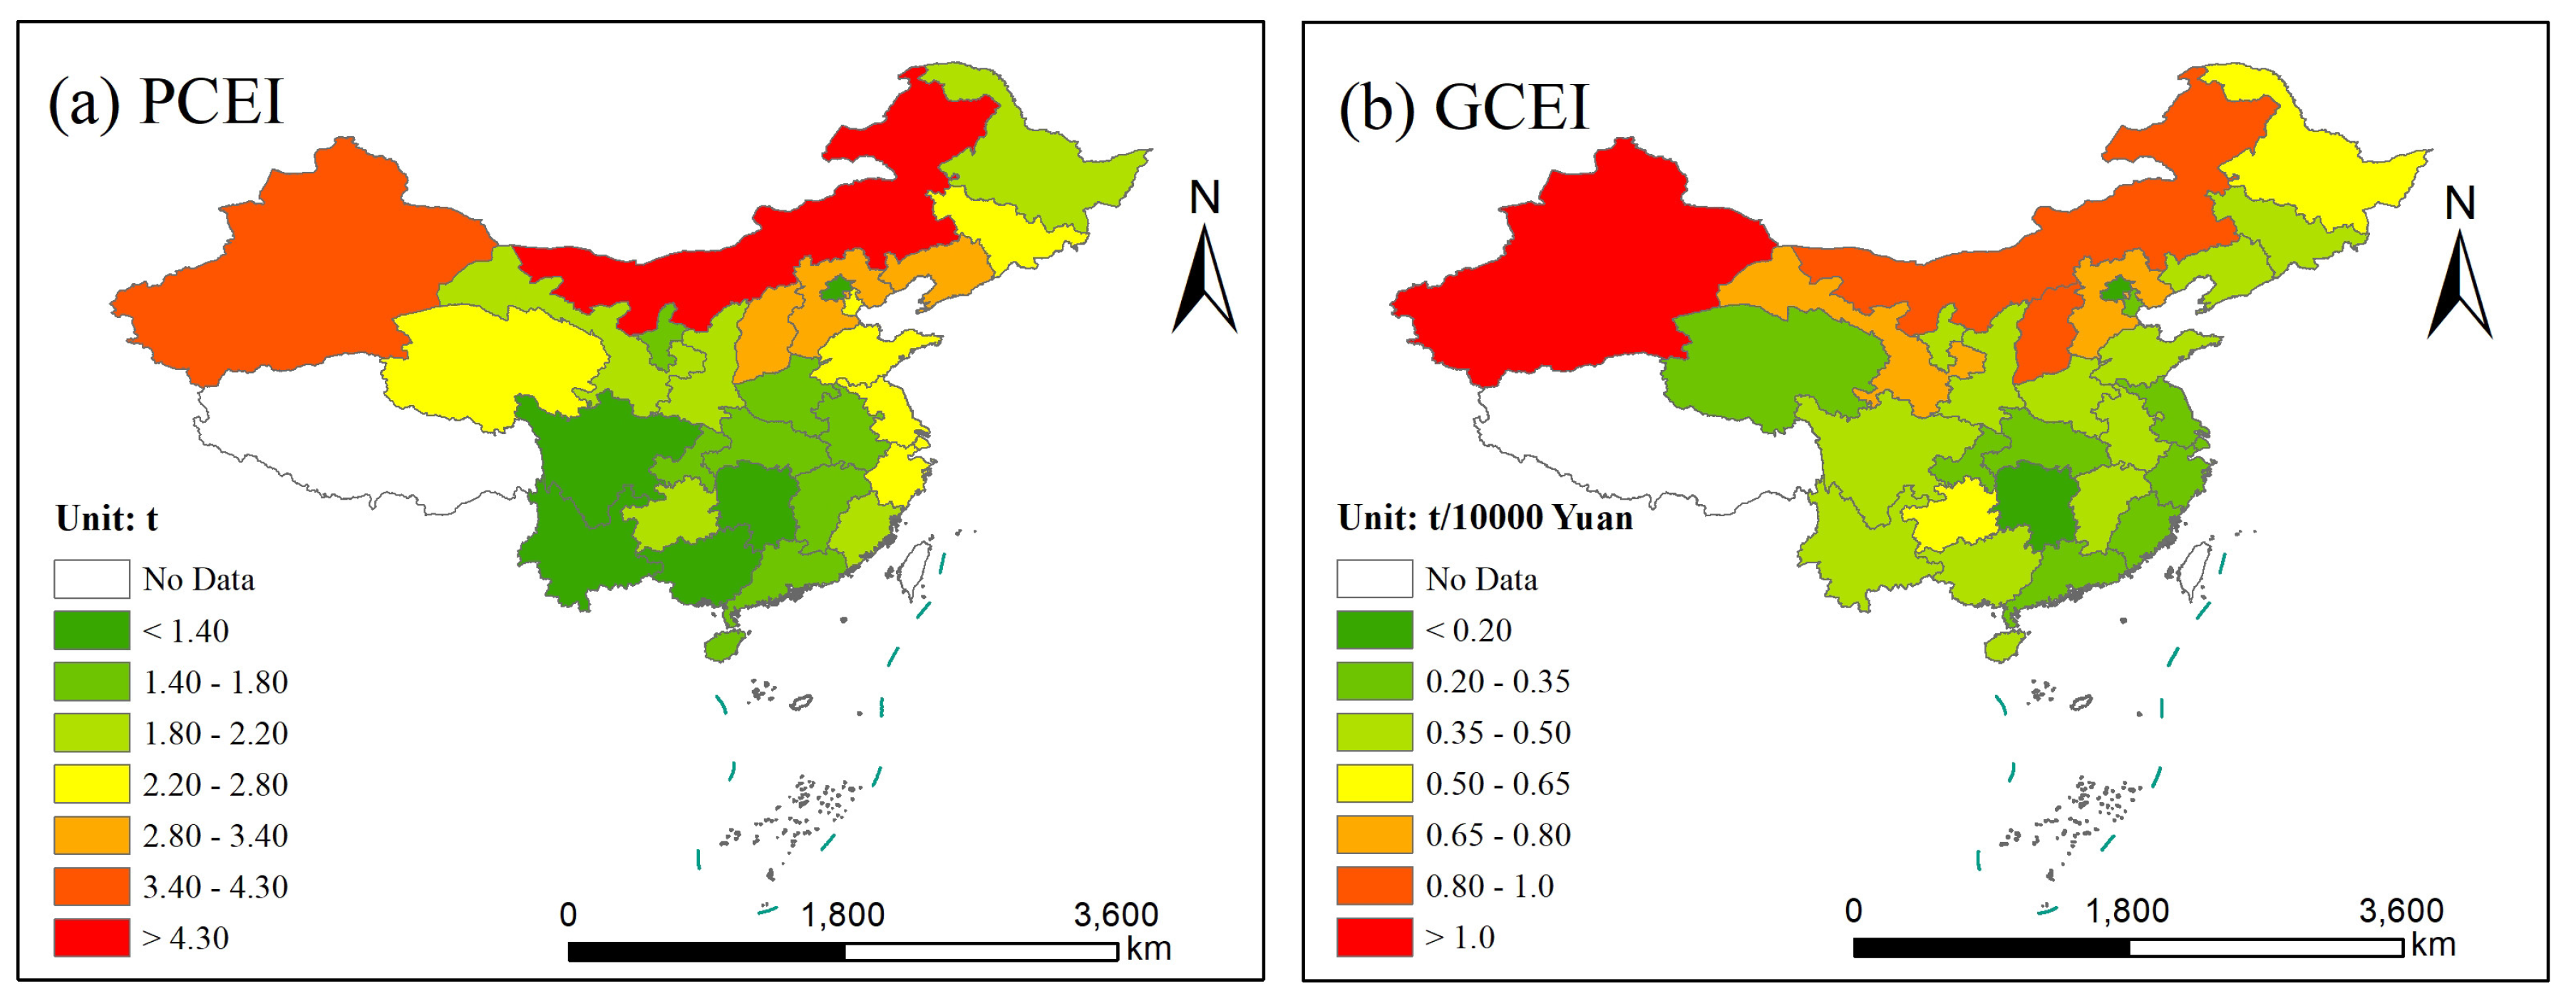
Taking the year 2015 as an example, we analyzed the spatial differences in carbon emissions intensity on a provincial scale. The national average value of per capita carbon emissions in 2015 was 2.19 t. Only 12 out of the 30 provinces had per capita carbon emissions higher than the national level (Table 8). Among them, Inner Mongolia, Xinjiang, and Shanxi had the highest per capita carbon emissions, with values of 6.53 t, 4.24 t, and 3.35 t, respectively. Notably, Inner Mongolia and Shanxi are both primary coal production bases in China, while Xinjiang is one of the main energy suppliers in the country [4]. Additionally, coal acts as a high-emissions fossil fuel in comparison to crude oil and natural gas due to the fact that it releases relatively more carbon dioxide while generating the same amount of heat compared to other energy types [68]. Consequently, these three provinces were among the top carbon emitters per person. In contrast, the six provinces with the lowest per capita carbon emissions were Yunnan (1.12 t), Guangxi (1.15 t), Beijing (1.23 t), Hunan (1.30 t), Sichuan (1.38 t), and Chongqing (1.41 t), with values less than one-third of the national level. All these provinces, except Beijing, are located in southwest China, which includes typically less developed regions of the country.
Moreover, the national average value of CEI per unit GDP in 2015 was 0.44 t/104 yuan. Only one-third of all provinces had a value of CEI per unit GDP exceeding the national level. Interestingly, the spatial distribution pattern of CEI per unit GDP was similar to that of per capita carbon emissions, as demonstrated in Figure 10. In general, the provinces in northwestern and northern China demonstrated comparatively larger CEIs per unit GDP, while the provinces in southwest China and coastal areas had relatively lower values. Specifically, the top three provinces having the highest CEIs per unit GDP were Xinjiang (1.07 t/104 yuan), Shanxi (0.96 t/104 yuan), and Inner Mongolia (0.92 t/104 yuan), with more than twice the amount of the national average. As stated, these provinces are primary energy (coal, crude oil, and natural gas) suppliers in China, and therefore their economies are highly dependent on energy production and transformation, which are typical high-emissions industries. As a result, the CEI per unit GDP in these energy-producing provinces was considerably higher than that in other provinces. Contrastingly, the four provinces with the lowest CEIs per unit GDP in the country were Beijing (0.12 t/104 yuan), Hunan (0.13 t/104 yuan), Guangdong (0.21 t/104 yuan), and Shanghai (0.21 t/104 yuan), with less than half of the national level. All these provinces, except Hunan, are economically developed regions in China. The economic development in these regions is largely driven by the service industry, which is less reliant on energy consumption.
In terms of CEI per unit land area, five provinces, including Shanghai, Tianjin, Jiangsu, Beijing, and Shandong, all developed regions in China, far exceeded the national average level in 2015 (974 t/km2). Among them, Shanghai had the highest value (8489 t/km2), nearly 400 times higher than the lowest value (Qinghai, 21 t/km2).
3.4. Relationships between Economic Growth, Urbanization, and Carbon Emissions
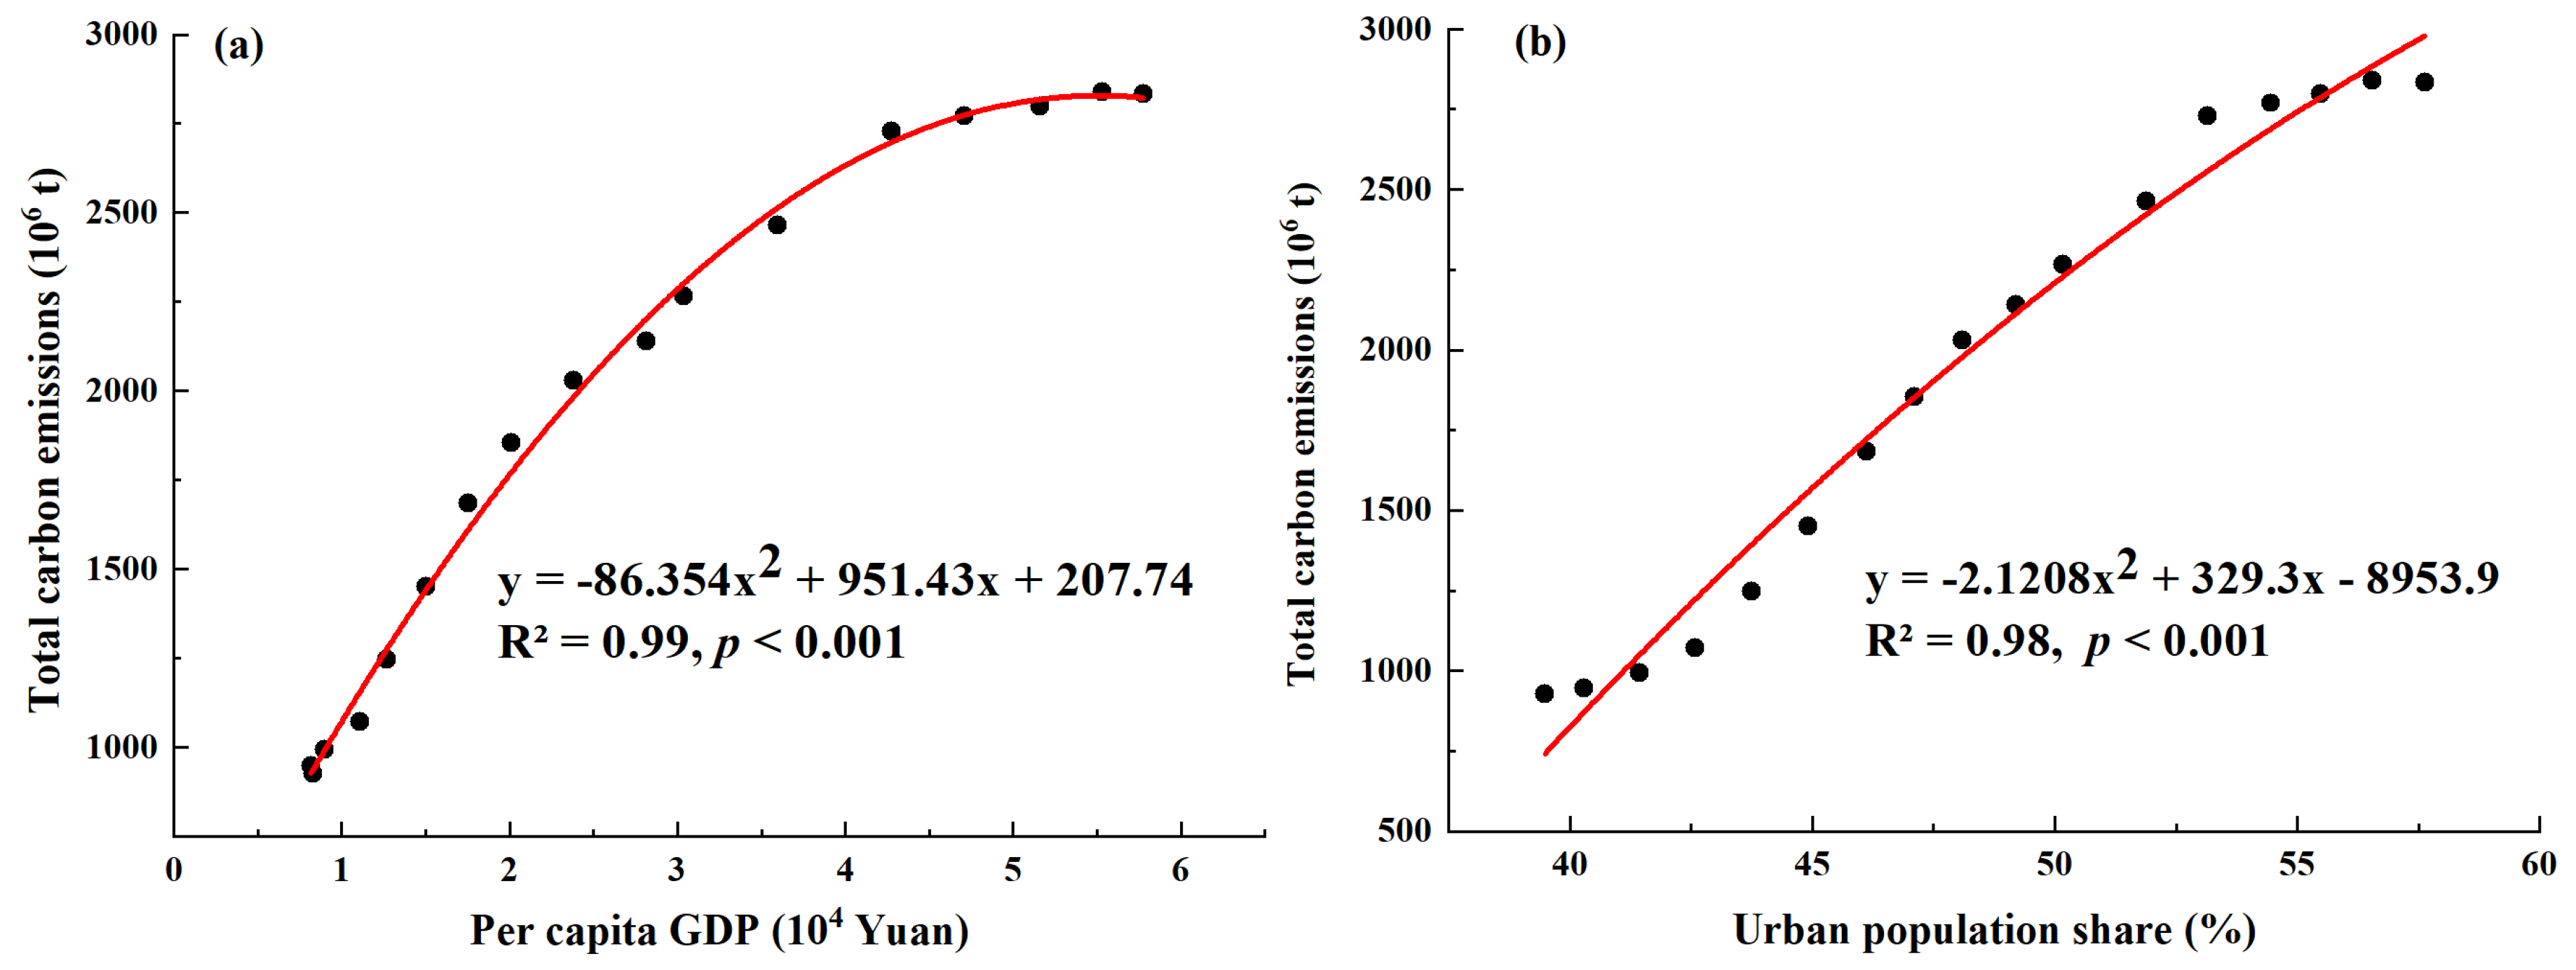
On the national scale, there was an inverted U-shaped curve relationship between per capita GDP and the total carbon emissions (R2 = 0.99, p < 0.001), as shown in Figure 11a. In addition, the relationship between urban population share and carbon emissions also presented as an inverted U-shaped curve (R2 = 0.98, p < 0.001, Figure 11b). Our results indicate that carbon emissions in China tended to plateau, as national economic performance and urbanization experienced far-reaching progress during the last two decades. In other words, carbon emissions efficiency in China was gradually enhanced. According to the environmental Kuznets curve theory, it is projected that China may undergo a significant decline in carbon emissions in the coming years.
Meanwhile, at the provincial scale, it was demonstrated that all provinces, excluding Xinjiang, had an inverted U-shaped curve between per capita GDP and carbon emissions (Figure S1). This suggests that the majority of Chinese provinces have almost completed the phase of economic “take-off”, during which a considerable amount of carbon dioxide is released to the atmosphere, and they have now entered or are about to enter the development stage of lower environmental pollution levels [69]. The economy in Xinjiang is relatively less developed compared to the rest of the country, and it is still undergoing industrialization, mainly energy production, and has increasing carbon emissions. Furthermore, as illustrated in Figure S2, 18 out of the 30 provinces had inverted U-shaped curves between urbanization and carbon emissions, indicating that carbon emissions in these provinces are likely to peak and decline in the future while maintaining a high degree of urbanization. Meanwhile, the remaining 12 provinces, including Hebei, Shanghai, Jiangsu, Anhui, Fujian, Jiangxi, Hainan, Chongqing, Sichuan, Gansu, Ningxia, and Xinjiang, need to figure out how to control and reduce the overall quantity of carbon emissions while further deepening the urbanization process.
4. Discussion
Land use carbon emissions account for a considerable proportion of human-driven carbon emissions [30]. In our study, we defined land as a carrier for carbon emissions and attributed these carbon emissions to different land use types according to the actual distributions of activities in China. The main contribution of this work is thus a new accounting of provincial carbon emissions in China from the perspective of land use. Our results showed that China’s emissions increased sharply from 927.88 Mt to 2833.91 Mt (Table 5) at a growth rate of 205.42% over the 17 years. In particular, the contribution of built-up land exceeded 85% each year. It was indicated that built-up land played a dominant role in carbon emissions increments. Recent studies have shown that the area of built-up land in China expanded 6.44-fold during 1981–2014, presenting a pattern of disorderly sprawling [70]. In general, under the current development scenario, China’s urbanization and economic growth are overly reliant on the expansion of built-up land, which directly leads to increasing carbon emissions and other ecological issues. Therefore, effectively curbing urban sprawl is still the core task of urban land management in China. To realize this goal, adequate attention needs to be paid to optimizing land use structure and its spatial layout to reduce carbon intensity [24]. Moreover, reasonable land use policies should be implemented by relevant government departments to control the urbanization development pace. In addition, local economic growth should be combined with ecological conservation [71], such as proceeding to carry out basic farmland protection policies and strictly limiting nonagricultural transfers of farmland, forests, and grassland. Taken together, these measures will contribute significantly to low-carbon urban development in the decades to follow.
In this study, we found that China’s carbon emissions have shown an apparent staged evolution since the start of the new millennium (Figure 3). In brief, it is evident that emissions in China have evolved from an initial accelerating growth since the country joined the WTO to a recent stabilization. This was in line with the evolution of national economic development. Particularly, China even witnessed a slight decline in emissions during 2014–2015, which can be largely explained by the establishment of sustainable strategies (i.e., pursuing a high-quality development mode rather than a high-speed pattern) and the implementation of low-carbon policies by the Chinese government in the “new normal” stage [64]. In addition, improved energy efficiency, shifts in industrial structure, and regional coordinated development have also played important roles in carbon reduction. Besides, our results demonstrated that the relationships between economic growth, urbanization, and carbon emissions in China presented as inverted U-shaped curves (Figure 11), conforming to the theory of the environmental Kuznets curve [72]. Given that China’s economy and urbanization will continue to grow, as they are mainly driven by scientific and technological innovation, it is likely that carbon reduction momentum could persist in the future. In this respect, China’s commitment to peak its carbon emissions prior to 2030 may have been fulfilled in advance [8,73]. However, the country still needs to carefully monitor its emissions and related drivers.
Distinct regional differences in carbon emissions were detected in our work (Figure 3). The Central and North regions altogether contributed 40% to total national emissions from 1999 to 2015. Therefore, special attention should be devoted to these regions when enacting relevant emissions-cutting policies.
In contrast to carbon emissions, China’s carbon sinks also underwent an increasing trend during the 17 years studied, but in relatively small increments. The enhanced carbon sink capacity can be primarily attributed to nationwide large-scale tree planting and ecological conservation programs spanning the last two decades [74]. There is mounting research showing that these programs have contributed significantly to carbon sequestration in China [67,75,76]. Overall, forests in China have merely absorbed approximately 9% of total carbon emissions in the same period. Despite the small absolute amount, there is still great potential for carbon sequestration in the future, since tree plantations are still in a primary stage [77].
In our study, there still exist certain limitations that should be addressed in the future. We employed a carbon emissions factor method for calculating land use carbon emissions for 30 provinces in China following the IPCC [30] guidelines, which have been widely used in a wealth of studies conducted in China [52,78,79,80]. Nevertheless, some emissions parameters were extracted from the IPCC recommended values and related ecological literature due to the fact that some of China’s carbon emissions factors are still under study. This measurement approach may not accurately reflect the actual situation in China due to a lack of measured parameters; however, it allowed our study to be comparable to other related studies. Furthermore, although uncertainty existed, it did not significantly affect our findings, since the primary objective of this work was to track spatial and temporal evolution patterns in China and identify their driving factors. In general, specifically modified emissions parameters to suit the Chinese situation will become an important topic in our future research.
5. Conclusions
In summary, here we sought to estimate the carbon emissions from land use in 30 Chinese provinces from 1999 to 2015 based on the carbon emissions factor method recommended by the IPCC guidelines. Three forms of carbon emissions intensity were introduced to quantify the spatial and temporal changes in the emissions–socioeconomics nexus. In addition, the Kuznets curve model was used to explore the relationships between economic development, urbanization, and carbon emissions at the national and provincial levels. Our results indicated that emissions in China tripled over the 17 years, up to 2833.91 Mt in 2015. However, the temporal evolution pattern suggested that the emissions tended to plateau and may even decline in the coming years. This was supported by the inverted U-shaped Kuznets curves found between economic growth, urbanization, and carbon emissions. Based on this, we could conclude that it is likely for China to realize its pledge to peak its emissions by 2030. Moreover, emissions in China presented apparent regional differences. That is, the Central region acted as the largest emissions contributor, whereas the Southwest region had the largest number of carbon sinks compared to other regions.
Additionally, China’s carbon sinks also experienced a 10.46% increase in the same period, which was highly associated with the long-term implementation of national-scale afforestation and conservation policies. However, terrestrial ecosystems only sequestrated roughly 9% of the total carbon emissions during 1999–2015. In this case, it is still necessary to further carry out tree planting programs.
Finally, taking into account the dominant role played by built-up land in carbon emissions gains, more efforts should be devoted to limiting the unreasonable expansion of urban construction areas and to supporting industrial restructuring, especially in highly polluted regions.
Supplementary Materials
The following are available online at https://www.mdpi.com/2071-1050/11/17/4531/s1, Figure S1: The relationship between carbon emissions and per capita GDP from 1999 to 2015 in each of 30 provinces of China; Figure S2: The relationship between carbon emissions and urban population share from 1999 to 2015 in each of 30 provinces of China; Table S1: Land use carbon emissions data of 30 provinces in China during 1999–2015.
Author Contributions
Conceptualization, J.P.; methodology, J.P.; formal analysis, L.W., J.P., and J.G.; investigation, L.W. and J.P.; resources, Z.N.; data curation, J.P., L.W., and J.G.; writing—original draft preparation, L.W. and J.P.; writing—review and editing, J.P.; visualization, L.W.; supervision, Z.N.; project administration, J.P. and L.W.; funding acquisition, L.W.
Funding
This research was funded by the Strategic Priority Research Program of the Chinese Academy of Sciences under grant number XDA19030404 and the National Natural Science Foundation of China under grant number 41871347.
Acknowledgments
The authors would like to thank Yiqiang Guo from the Key Laboratory of Land Consolidation and Rehabilitation, Ministry of Natural Resources of the People’s Republic of China, and Jiahong Yu from the National Bureau of Statistics of China, both of whom provided statistical data for the research. We also thank Yuelin Zhang and Yuxin Chen at the Agricultural University of Hebei for helping collect statistical data during the research.
Conflicts of Interest
The authors declare no conflicts of interest.
References
- Berrang-Ford, L.; Biesbroek, R.; Ford, J.D.; Lesnikowski, A.; Tanabe, A.; Wang, F.M.; Chen, C.; Hsu, A.; Hellmann, J.J.; Pringle, P. Tracking global climate change adaptation among governments. Nat. Clim. Chang. 2019, 9, 440–449. [Google Scholar] [CrossRef]
- Erickson, P.; Lazarus, M.; Piggot, G. Limiting fossil fuel production as the next big step in climate policy. Nat. Clim. Chang. 2018, 8, 1037–1043. [Google Scholar] [CrossRef]
- Liu, Z.; Geng, Y.; Lindner, S.; Guan, D. Uncovering China’s greenhouse gas emission from regional and sectoral perspectives. Energy 2012, 45, 1059–1068. [Google Scholar] [CrossRef]
- Shan, Y.; Liu, J.; Liu, Z.; Xu, X.; Shao, S.; Wang, P.; Guan, D. New provincial CO2 emission inventories in China based on apparent energy consumption data and updated emission factors. Appl. Energy 2016, 184, 742–750. [Google Scholar] [CrossRef]
- Gregg, J.S.; Andres, R.J.; Marland, G. China: Emissions pattern of the world leader in CO2 emissions from fossil fuel consumption and cement production. Geophys. Res. Lett. 2008. [Google Scholar] [CrossRef]
- Ye, B.; Jiang, J.; Li, C.; Miao, L.; Tang, J. Quantification and driving force analysis of provincial-level carbon emissions in China. Appl. Energy 2017, 198, 223–238. [Google Scholar] [CrossRef]
- Liang, Y.; Niu, D.; Zhou, W.; Fan, Y. Decomposition Analysis of Carbon Emissions from Energy Consumption in Beijing-Tianjin-Hebei, China: A Weighted-Combination Model Based on Logarithmic Mean Divisia Index and Shapley Value. Sustainability 2018, 10, 2535. [Google Scholar] [CrossRef]
- Guan, D.; Meng, J.; Reiner, D.M.; Zhang, N.; Shan, Y.; Mi, Z.; Shao, S.; Liu, Z.; Zhang, Q.; Davis, S.J. Structural decline in China’s CO2 emissions through transitions in industry and energy systems. Nat. Geosci. 2018, 11, 551–555. [Google Scholar] [CrossRef]
- Liu, Z.; Guan, D.; Wei, W.; Davis, S.J.; Ciais, P.; Bai, J.; Peng, S.; Zhang, Q.; Hubacek, K.; Marland, G. Reduced carbon emission estimates from fossil fuel combustion and cement production in China. Nature 2015, 524, 335–338. [Google Scholar] [CrossRef] [Green Version]
- Mi, Z.; Meng, J.; Guan, D.; Shan, Y.; Song, M.; Wei, Y.-M.; Liu, Z.; Hubacek, K. Chinese CO2 emission flows have reversed since the global financial crisis. Nat. Commun. 2017, 8, 1712. [Google Scholar] [CrossRef] [PubMed]
- Tong, X.; Li, X.; Tong, L.; Jiang, X. Spatial spillover and the influencing factors relating to provincial Carbon emissions in China based on the spatial panel data model. Sustainability 2018, 10, 4739. [Google Scholar] [CrossRef]
- Zhong, J. Biased technical change, factor substitution, and carbon emissions efficiency in China. Sustainability 2019, 11, 955. [Google Scholar] [CrossRef]
- Houghton, R.A.; House, J.; Pongratz, J.; Van Der Werf, G.; DeFries, R.; Hansen, M.; Quéré, C.L.; Ramankutty, N. Carbon emissions from land use and land-cover change. Biogeosciences 2012, 9, 5125–5142. [Google Scholar] [CrossRef] [Green Version]
- Chuai, X.; Huang, X.; Wang, W.; Zhao, R.; Zhang, M.; Wu, C. Land use, total carbon emissions change and low carbon land management in Coastal Jiangsu, China. J. Clean. Prod. 2015, 103, 77–86. [Google Scholar] [CrossRef]
- Cui, X.; Wei, X.; Liu, W.; Zhang, F.; Li, Z. Spatial and temporal analysis of carbon sources and sinks through land use/cover changes in the Beijing-Tianjin-Hebei urban agglomeration region. Phys. Chem. Earth Parts A/B/C 2019, 110, 61–70. [Google Scholar] [CrossRef]
- Pei, J.; Niu, Z.; Wang, L.; Song, X.-P.; Huang, N.; Geng, J.; Wu, Y.-B.; Jiang, H.-H. Spatial-temporal dynamics of carbon emissions and carbon sinks in economically developed areas of China: A case study of Guangdong Province. Sci. Rep. 2018, 8, 13383. [Google Scholar] [CrossRef] [PubMed]
- Lu, X.; Kuang, B.; Li, J.; Han, J.; Zhang, Z. Dynamic evolution of regional discrepancies in carbon emissions from agricultural land utilization: Evidence from Chinese provincial data. Sustainability 2018, 10, 552. [Google Scholar] [CrossRef]
- Chuai, X.; Huang, X.; Lu, Q.; Zhang, M.; Zhao, R.; Lu, J. Spatiotemporal changes of built-up land expansion and carbon emissions caused by the Chinese construction industry. Environ. Sci. Technol. 2015, 49, 13021–13030. [Google Scholar] [CrossRef]
- Zhao, R.; Huang, X.; Liu, Y.; Zhong, T.; Ding, M.; Chuai, X. Carbon emission of regional land use and its decomposition analysis: Case study of Nanjing City, China. Chin. Geogr. Sci. 2015, 25, 198–212. [Google Scholar] [CrossRef]
- World Bank. Available online: https://data.worldbank.org/indicator/SP.URB.TOTL.IN.ZS?end=2017&locations=CN&start=1960&view=chart (accessed on 17 April 2019).
- Yao, X.; Kou, D.; Shao, S.; Li, X.; Wang, W.; Zhang, C. Can urbanization process and carbon emission abatement be harmonious? New evidence from China. Environ. Impact Assess. Rev. 2018, 71, 70–83. [Google Scholar] [CrossRef]
- Li, J.; Wang, X. Energy and climate policy in China’s twelfth five-year plan: A paradigm shift. Energy Policy 2012, 41, 519–528. [Google Scholar] [CrossRef]
- Green, F.; Stern, N. China’s changing economy: Implications for its carbon dioxide emissions. Clim. Policy 2017, 17, 423–442. [Google Scholar] [CrossRef]
- Xu, Q.; Dong, Y.-x.; Yang, R. Urbanization impact on carbon emissions in the Pearl River Delta region: Kuznets curve relationships. J. Clean. Prod. 2018, 180, 514–523. [Google Scholar] [CrossRef]
- National Bureau of Statistics of China. Available online: http://www.stats.gov.cn/ (accessed on 19 February 2019).
- China Population & Employment Statistics Yearbook. Available online: http://cdi.cnki.net/Titles/SingleNJ?NJCode=N2016010131 (accessed on 20 February 2019).
- Yang, J.; Wan, Z.; Borjigin, S.; Zhang, D.; Yan, Y.; Chen, Y.; Gu, R.; Gao, Q. Changing Trends of NDVI and Their Responses to Climatic Variation in Different Types of Grassland in Inner Mongolia from 1982 to 2011. Sustainability 2019, 11, 3256. [Google Scholar] [CrossRef]
- Shan, Y.; Guan, D.; Zheng, H.; Ou, J.; Li, Y.; Meng, J.; Mi, Z.; Liu, Z.; Zhang, Q. China CO2 emission accounts 1997–2015. Sci. Data 2018, 5, 170201. [Google Scholar] [CrossRef]
- Feng, K.; Davis, S.J.; Sun, L.; Li, X.; Guan, D.; Liu, W.; Liu, Z.; Hubacek, K. Outsourcing CO2 within China. Proc. Natl. Acad. Sci. USA 2013, 110, 11654–11659. [Google Scholar] [CrossRef]
- 2006 IPCC Guidelines for National Greenhouse Gas Inventories. Available online: https://www.ipcc-nggip.iges.or.jp/public/2006gl/ (accessed on 12 December 2018).
- Ding, Y.; Li, F. Examining the effects of urbanization and industrialization on carbon dioxide emission: Evidence from China’s provincial regions. Energy 2017, 125, 533–542. [Google Scholar] [CrossRef]
- Zheng, H.; Shan, Y.; Mi, Z.; Meng, J.; Ou, J.; Schroeder, H.; Guan, D. How modifications of China’s energy data affect carbon mitigation targets. Energy Policy 2018, 116, 337–343. [Google Scholar] [CrossRef]
- Wang, Y.; Zhang, C.; Lu, A.; Li, L.; He, Y.; ToJo, J.; Zhu, X. A disaggregated analysis of the environmental Kuznets curve for industrial CO2 emissions in China. Appl. Energy 2017, 190, 172–180. [Google Scholar] [CrossRef]
- Bellarby, J.; Tirado, R.; Leip, A.; Weiss, F.; Lesschen, J.P.; Smith, P. Livestock greenhouse gas emissions and mitigation potential in Europe. Glob. Chang. Biol. 2013, 19, 3–18. [Google Scholar] [CrossRef] [PubMed]
- Hu, X.; Wang, J. Estimation of livestock greenhouse gases discharge in China. Trans. Chin. Soc. Agric. Eng. 2010, 26, 247–252. [Google Scholar]
- Solomon, S.; Qin, D.; Manning, M.; Chen, Z.; Marquis, M.; Averyt, K.B.; Tignor, M.; Miller, H.L. Climate change 2007: The physical science basis. Contribution of Working Group I to the Fourth Assessment Report of the Intergovernmental Panel on Climate Change; Cambridge University Press: Cambridge, UK; New York, NY, USA, 2007; p. 996. [Google Scholar]
- Wang, Z.; Geng, L. Carbon emissions calculation from municipal solid waste and the influencing factors analysis in China. J. Clean. Prod. 2015, 104, 177–184. [Google Scholar] [CrossRef]
- Hao, L.; Sun, X.; Jiang, C.Y.; Gong, X.F. Greenhouse gas emission and its reduction strategy from solid waste treatment in Xi’an. China Popul. Res. Environ. 2012, 22, 4. [Google Scholar]
- Zhao, W.; Van Der Voet, E.; Zhang, Y.; Huppes, G. Life cycle assessment of municipal solid waste management with regard to greenhouse gas emissions: Case study of Tianjin, China. Sci. Total Environ. 2009, 407, 1517–1526. [Google Scholar] [CrossRef] [PubMed]
- Zhao, Y.C.; Niu, D.J.; Chai, X.L. Solid Waste Disposal and Resource Recovery; Chemical Industry Press: Beijing, China, 2006. [Google Scholar]
- Piao, S.; Fang, J.; Ciais, P.; Peylin, P.; Huang, Y.; Sitch, S.; Wang, T. The carbon balance of terrestrial ecosystems in China. Nature 2009, 458, 1009–1013. [Google Scholar] [CrossRef] [PubMed]
- Fang, J.; Guo, Z.; Piao, S.; Chen, A. Terrestrial vegetation carbon sinks in China, 1981–2000. Sci. China Ser. D Earth Sci. 2007, 50, 1341–1350. [Google Scholar] [CrossRef]
- Yan, X.; Cai, Z.; Ohara, T.; Akimoto, H. Methane emission from rice fields in mainland China: Amount and seasonal and spatial distribution. J. Geophys. Res. Atmos. 2003. [Google Scholar] [CrossRef]
- Min, J.; Hu, H. Calculation of greenhouse gases emission from agricultural production in China. China Popul. Resour. Environ. 2012, 22, 21–27. [Google Scholar]
- Su, M.; Jiang, R.; Li, R. Investigating Low-Carbon Agriculture: Case Study of China’s Henan Province. Sustainability 2017, 9, 2295. [Google Scholar] [CrossRef]
- Luo, Y.; Long, X.; Wu, C.; Zhang, J. Decoupling CO2 emissions from economic growth in agricultural sector across 30 Chinese provinces from 1997 to 2014. J. Clean. Prod. 2017, 159, 220–228. [Google Scholar] [CrossRef]
- West, T.O.; Marland, G. A synthesis of carbon sequestration, carbon emissions, and net carbon flux in agriculture: Comparing tillage practices in the United States. Agric. Ecosyst. Environ. 2002, 91, 217–232. [Google Scholar] [CrossRef]
- Institute of Resource, Ecosystem and Environment of Agriculture in Nanjing Agricultural University (IREEA). Available online: https://ireea.njau.edu.cn/ (accessed on 5 February 2019).
- Li, B.; Zhang, J.; Li, H. Research on spatial-temporal characteristics and affecting factors decomposition of agricultural carbon emission in China. China Popul. Resour. Environ. 2011, 21, 80–86. [Google Scholar]
- Fang, J.; Yu, G.; Liu, L.; Hu, S.; Chapin, F.S. Climate change, human impacts, and carbon sequestration in China. Proc. Natl. Acad. Sci. USA 2018, 115, 4015–4020. [Google Scholar] [CrossRef] [PubMed] [Green Version]
- Cao, W.; Yuan, X. Region-county characteristic of spatial-temporal evolution and influencing factor on land use-related CO2 emissions in Chongqing of China, 1997–2015. J. Clean. Prod. 2019, 231, 619–632. [Google Scholar] [CrossRef]
- Han, D.; Qiao, R.; Ma, X. Optimization of Land-Use Structure Based on the Trade-Off Between Carbon Emission Targets and Economic Development in Shenzhen, China. Sustainability 2019, 11, 11. [Google Scholar] [CrossRef]
- Du, B.; Zhen, L.; Yan, H.; De Groot, R. Effects of government grassland conservation policy on household livelihoods and dependence on local grasslands: Evidence from Inner Mongolia, China. Sustainability 2016, 8, 1314. [Google Scholar] [CrossRef]
- Han, J.; Meng, X.; Zhou, X.; Yi, B.; Liu, M.; Xiang, W.-N. A long-term analysis of urbanization process, landscape change, and carbon sources and sinks: A case study in China’s Yangtze River Delta region. J. Clean. Prod. 2017, 141, 1040–1050. [Google Scholar] [CrossRef]
- Parajuli, R.; Joshi, O.; Maraseni, T. Incorporating forests, agriculture, and energy consumption in the framework of the Environmental Kuznets Curve: A dynamic panel data approach. Sustainability 2019, 11, 2688. [Google Scholar] [CrossRef]
- Martínez-Zarzoso, I.; Maruotti, A. The impact of urbanization on CO2 emissions: Evidence from developing countries. Ecol. Econ. 2011, 70, 1344–1353. [Google Scholar] [CrossRef]
- Boden, T.A.; Marland, G.; Andres, R.J. Global, Regional, and National Fossil-Fuel CO2 Emissions; Carbon Dioxide Information Analysis Center, Oak Ridge National Laboratory: Oak Ridge, TN, USA, 2017. [CrossRef]
- Olivier, J.G.; Schure, K.; Peters, J. Trends in Global CO2 and Total Greenhouse Gas Emissions; PBL Netherlands Environmental Assessment Agency: The Hague, The Netherlands, 2017; p. 42. [Google Scholar]
- Le Quéré, C.; Andrew, R.; Canadell, J.G.; Sitch, S.; Korsbakken, J.I.; Peters, G.P.; Manning, A.C.; Boden, T.A.; Tans, P.P.; Houghton, R.A. Global carbon budget 2016. Earth Syst. Sci. Data 2016, 8, 605–649. [Google Scholar] [CrossRef]
- British Petroleum (BP). BP Statistical Review of World Energy; British Petroleum: London, UK, 2017. [Google Scholar]
- U.S. Energy Information Administration (EIA). International Energy Statistics: Total Carbon Dioxide Emissions from the Consumption of Energy 2014. Available online: https://www.eia.gov/ (accessed on 4 August 2019).
- Multi-Resolution Emission Inventory for China (MEIC). National CO2 Emissions. Available online: http://www.meicmodel.org/index.html (accessed on 4 August 2019).
- Peters, G.P.; Marland, G.; Le Quéré, C.; Boden, T.; Canadell, J.G.; Raupach, M.R. Rapid growth in CO2 emissions after the 2008–2009 global financial crisis. Nat. Clim. Chang. 2012, 2, 2. [Google Scholar] [CrossRef]
- Zheng, J.; Mi, Z.; Milcheva, S.; Shan, Y.; Guan, D.; Wang, S. Regional development and carbon emissions in China. Energy Econ. 2019, 81, 25–36. [Google Scholar] [CrossRef]
- Piao, S.; Yin, G.; Tan, J.; Cheng, L.; Huang, M.; Li, Y.; Liu, R.; Mao, J.; Myneni, R.B.; Peng, S. Detection and attribution of vegetation greening trend in China over the last 30 years. Glob. Chang. Biol. 2015, 21, 1601–1609. [Google Scholar] [CrossRef]
- Chen, C.; Park, T.; Wang, X.; Piao, S.; Xu, B.; Chaturvedi, R.K.; Fuchs, R.; Brovkin, V.; Ciais, P.; Fensholt, R. China and India lead in greening of the world through land-use management. Nat. Sustain. 2019, 2, 122–129. [Google Scholar] [CrossRef] [PubMed]
- Lu, F.; Hu, H.; Sun, W.; Zhu, J.; Liu, G.; Zhou, W.; Zhang, Q.; Shi, P.; Liu, X.; Wu, X. Effects of national ecological restoration projects on carbon sequestration in China from 2001 to 2010. Proc. Natl. Acad. Sci. USA 2018, 115, 4039–4044. [Google Scholar] [CrossRef] [Green Version]
- Pan, K.-x.; Zhu, H.-x.; Chang, Z.; Wu, K.-h.; Shan, Y.-l.; Liu, Z.-x. Estimation of coal-related CO2 emissions: The case of China. Energy Environ. 2013, 24, 1309–1321. [Google Scholar] [CrossRef]
- Madlener, R.; Sunak, Y. Impacts of urbanization on urban structures and energy demand: What can we learn for urban energy planning and urbanization management? Sustain. Cities Soc. 2011, 1, 45–53. [Google Scholar] [CrossRef]
- Fang, C.; LI GD, Z.Q. The variation characteristics and control measures of the urban construction land in China. J. Nat. Resour. 2017, 32, 363–376. [Google Scholar]
- Abid, M. The close relationship between informal economic growth and carbon emissions in Tunisia since 1980: The (ir) relevance of structural breaks. Sustain. Cities Soc. 2015, 15, 11–21. [Google Scholar] [CrossRef]
- Dinda, S. A theoretical basis for the environmental Kuznets curve. Ecol. Econ. 2005, 53, 403–413. [Google Scholar] [CrossRef]
- Liu, Z.; Guan, D.; Moore, S.; Lee, H.; Su, J.; Zhang, Q. Climate policy: Steps to China’s carbon peak. Nat. News 2015, 522, 279. [Google Scholar] [CrossRef] [PubMed]
- Viña, A.; McConnell, W.J.; Yang, H.; Xu, Z.; Liu, J. Effects of conservation policy on China’s forest recovery. Sci. Adv. 2016, 2, e1500965. [Google Scholar] [CrossRef]
- Huang, L.; Liu, J.; Shao, Q.; Xu, X. Carbon sequestration by forestation across China: Past, present, and future. Renew. Sustain. Energy Rev. 2012, 16, 1291–1299. [Google Scholar] [CrossRef]
- Tong, X.; Brandt, M.; Yue, Y.; Horion, S.; Wang, K.; De Keersmaecker, W.; Tian, F.; Schurgers, G.; Xiao, X.; Luo, Y. Increased vegetation growth and carbon stock in China karst via ecological engineering. Nat. Sustain. 2018, 1, 44–50. [Google Scholar] [CrossRef]
- Sun, W.; Song, X.; Mu, X.; Gao, P.; Wang, F.; Zhao, G. Spatiotemporal vegetation cover variations associated with climate change and ecological restoration in the Loess Plateau. Agric. For. Meteorol. 2015, 209, 87–99. [Google Scholar] [CrossRef]
- Zheng, J.; Hu, Y.; Dong, S.; Li, Y. The Spatiotemporal Pattern of Decoupling Transport CO2 Emissions from Economic Growth across 30 Provinces in China. Sustainability 2019, 11, 2564. [Google Scholar] [CrossRef]
- Li, S.; Zhou, C. What are the impacts of demographic structure on CO2 emissions? A regional analysis in China via heterogeneous panel estimates. Sci. Total Environ. 2019, 650, 2021–2031. [Google Scholar] [CrossRef]
- Lin, X.; Ren, J.; Xu, J.; Zheng, T.; Cheng, W.; Qiao, J.; Huang, J.; Li, G. Prediction of Life Cycle Carbon Emissions of Sponge City Projects: A Case Study in Shanghai, China. Sustainability 2018, 10, 3978. [Google Scholar] [CrossRef]
Figure 1.
Spatial distribution of eight Chinese regions.
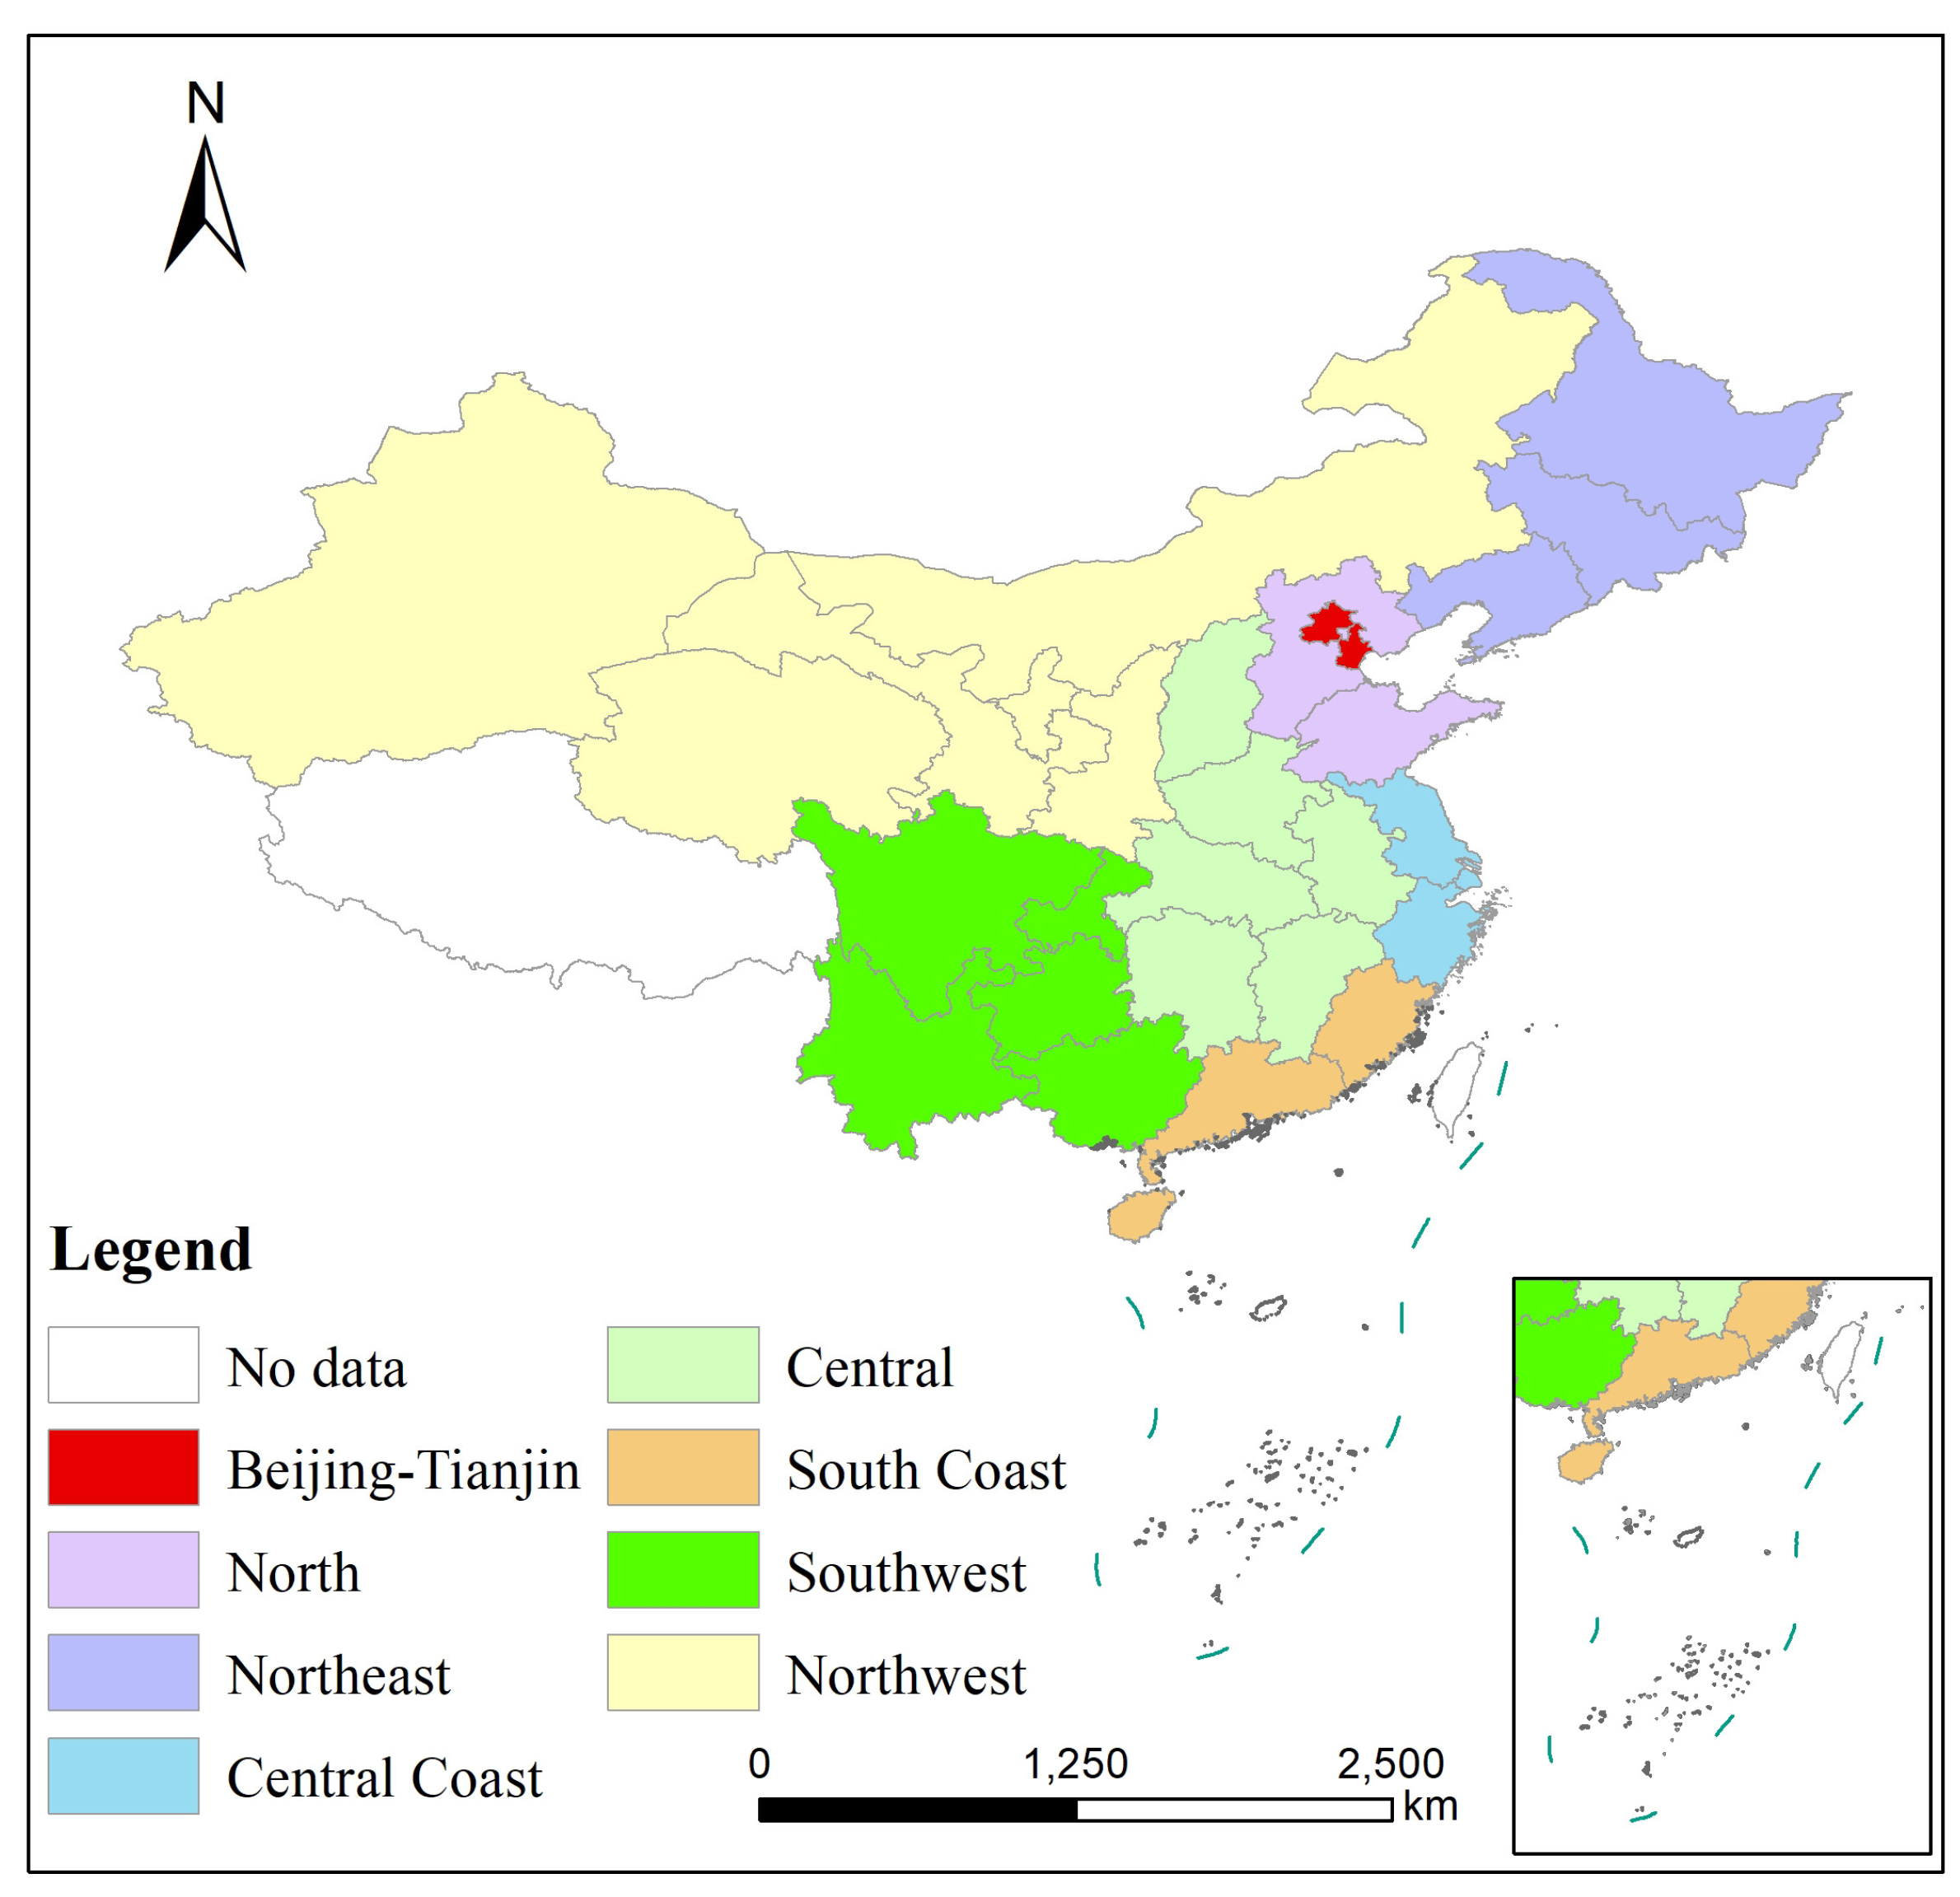
Figure 2.
A comparison of carbon emissions in China between this study and several other sources, including the Carbon Dioxide Information Analysis Centre (CDIAC) [57], the Emissions Database for Global Atmospheric Research (EDGAR) [58], the Global Carbon Budget (GCB) [59], British Petroleum (BP) [60], the U.S. Energy Information Administration (EIA) [61], and the Multi-Resolution Emissions Inventory for China (MEIC) [62]. Note that the original emissions data of these sources were calculated as carbon dioxide emissions. We thus converted these emissions into carbon emissions for ease of comparison by multiplying by the constant of 12/44.
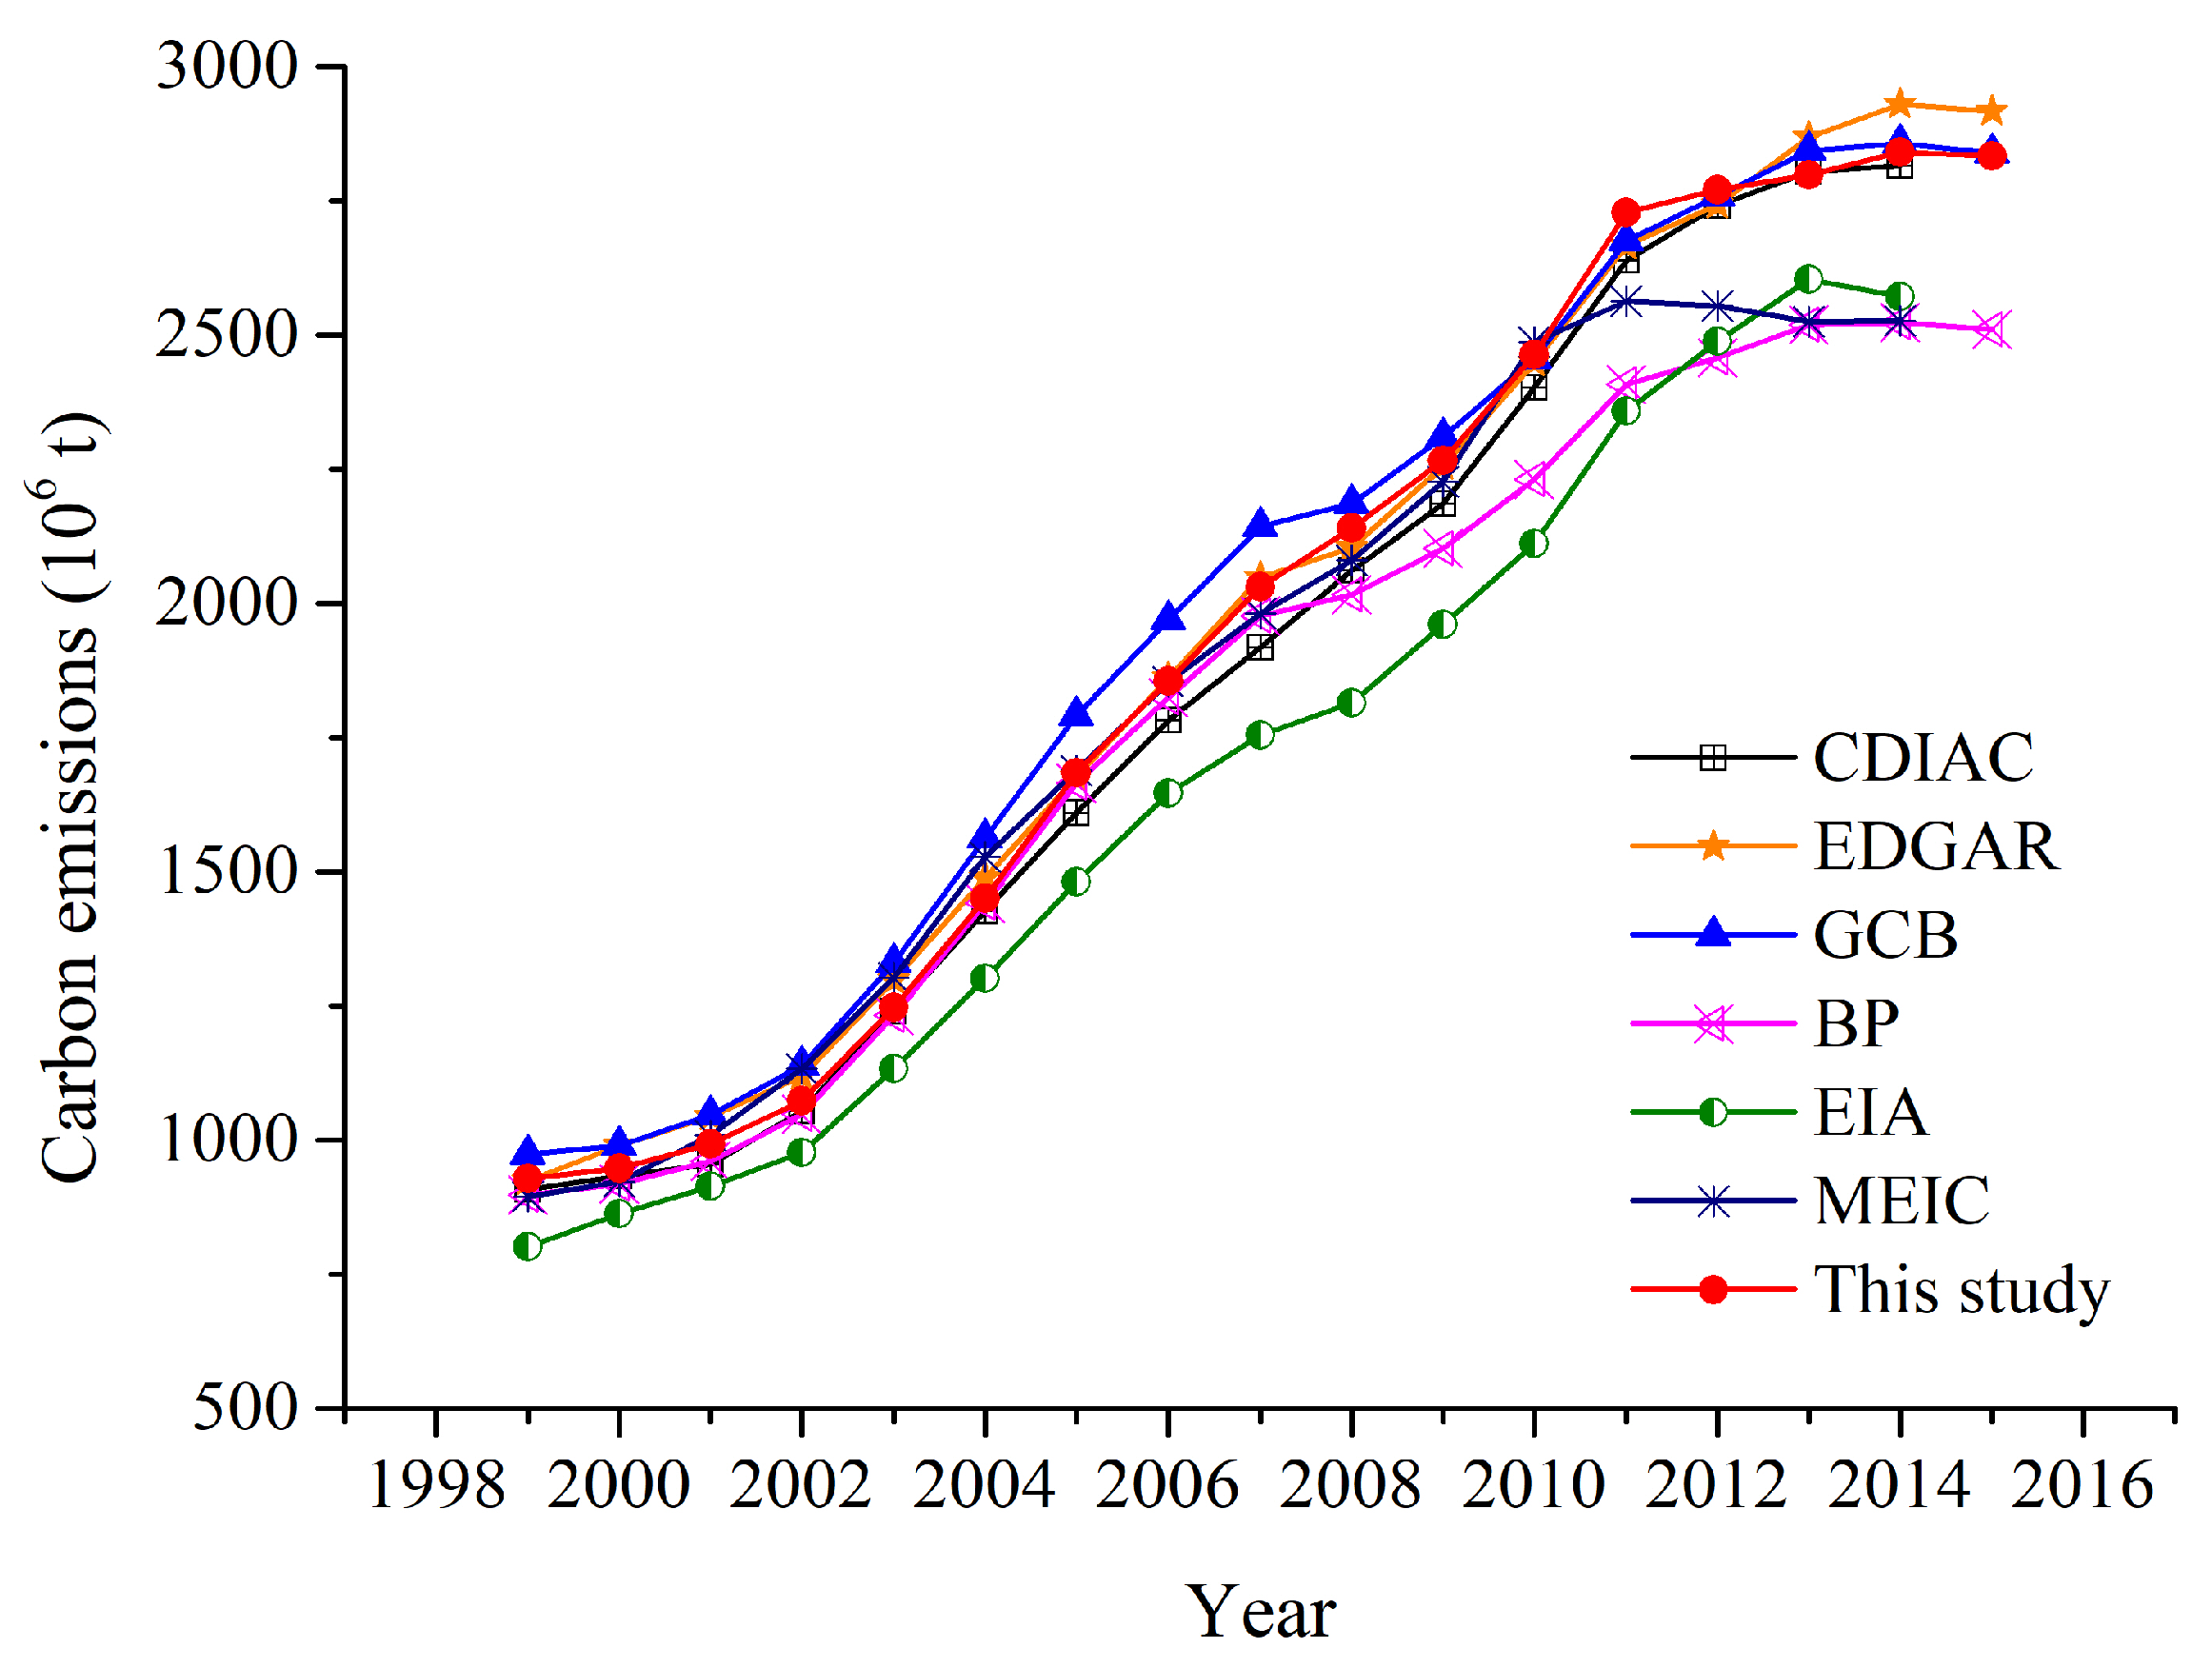
Figure 3.
The temporal evolution of China’s total carbon emissions/sinks resulting from land use over 1999–2015. The total numbers of carbon sinks in 2005 and 2006 were not included because of data limitations.
Figure 3.
The temporal evolution of China’s total carbon emissions/sinks resulting from land use over 1999–2015. The total numbers of carbon sinks in 2005 and 2006 were not included because of data limitations.
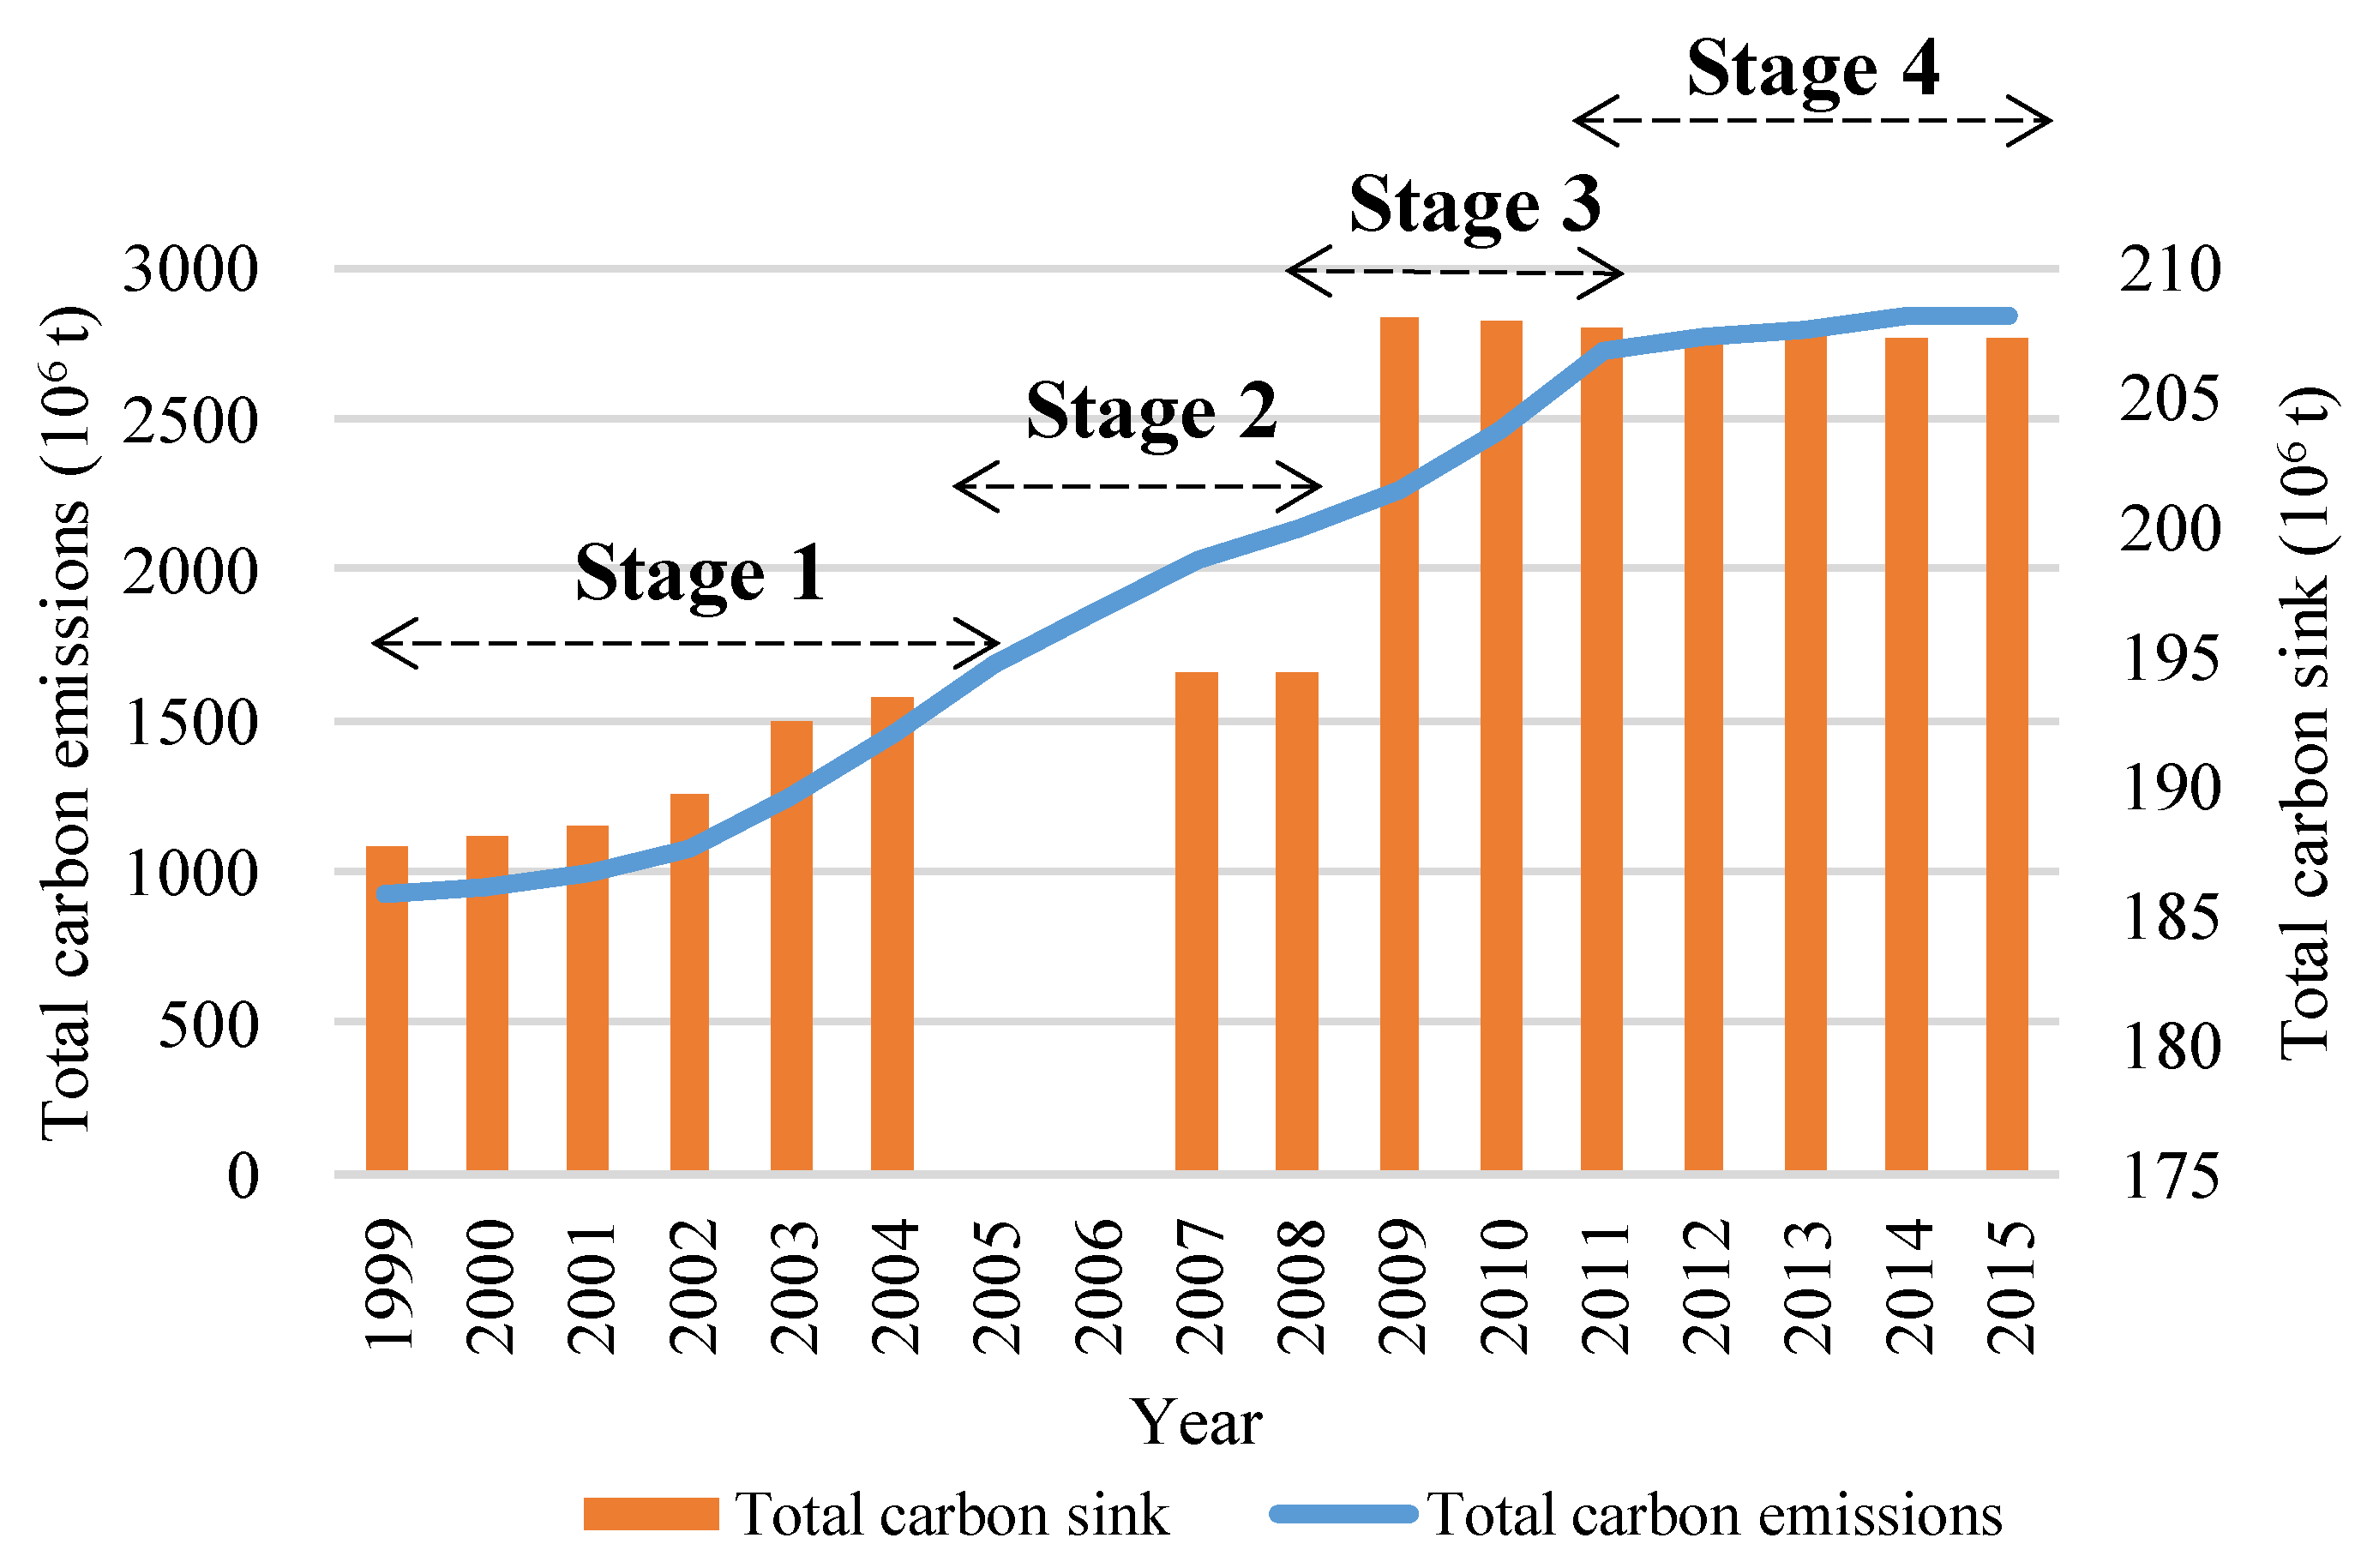
Figure 4.
A comparison of the carbon emissions in China (this study) and the other top nine carbon emitters in the world, whose emissions data were collected from Reference [57]. Note that the original emissions data of these countries were calculated as carbon dioxide emissions. We thus converted these emissions into carbon emissions for ease of comparison by multiplying by the constant of 12/44.

Figure 5.
A comparison of per capita carbon emissions in China and in the other top nine carbon emitters in the world, whose emissions data were collected from Reference [57]. Note that the original emissions data of these countries were calculated as carbon dioxide emissions. We thus converted these emissions into carbon emissions for ease of comparison by multiplying by the constant of 12/44.

Figure 6.
(a) Regional differences in total carbon emissions over time; (b) regional differences in total carbon sinks over time. Note that the total numbers of carbon sinks in 2005 and 2006 were not included because of data limitations.
Figure 6.
(a) Regional differences in total carbon emissions over time; (b) regional differences in total carbon sinks over time. Note that the total numbers of carbon sinks in 2005 and 2006 were not included because of data limitations.
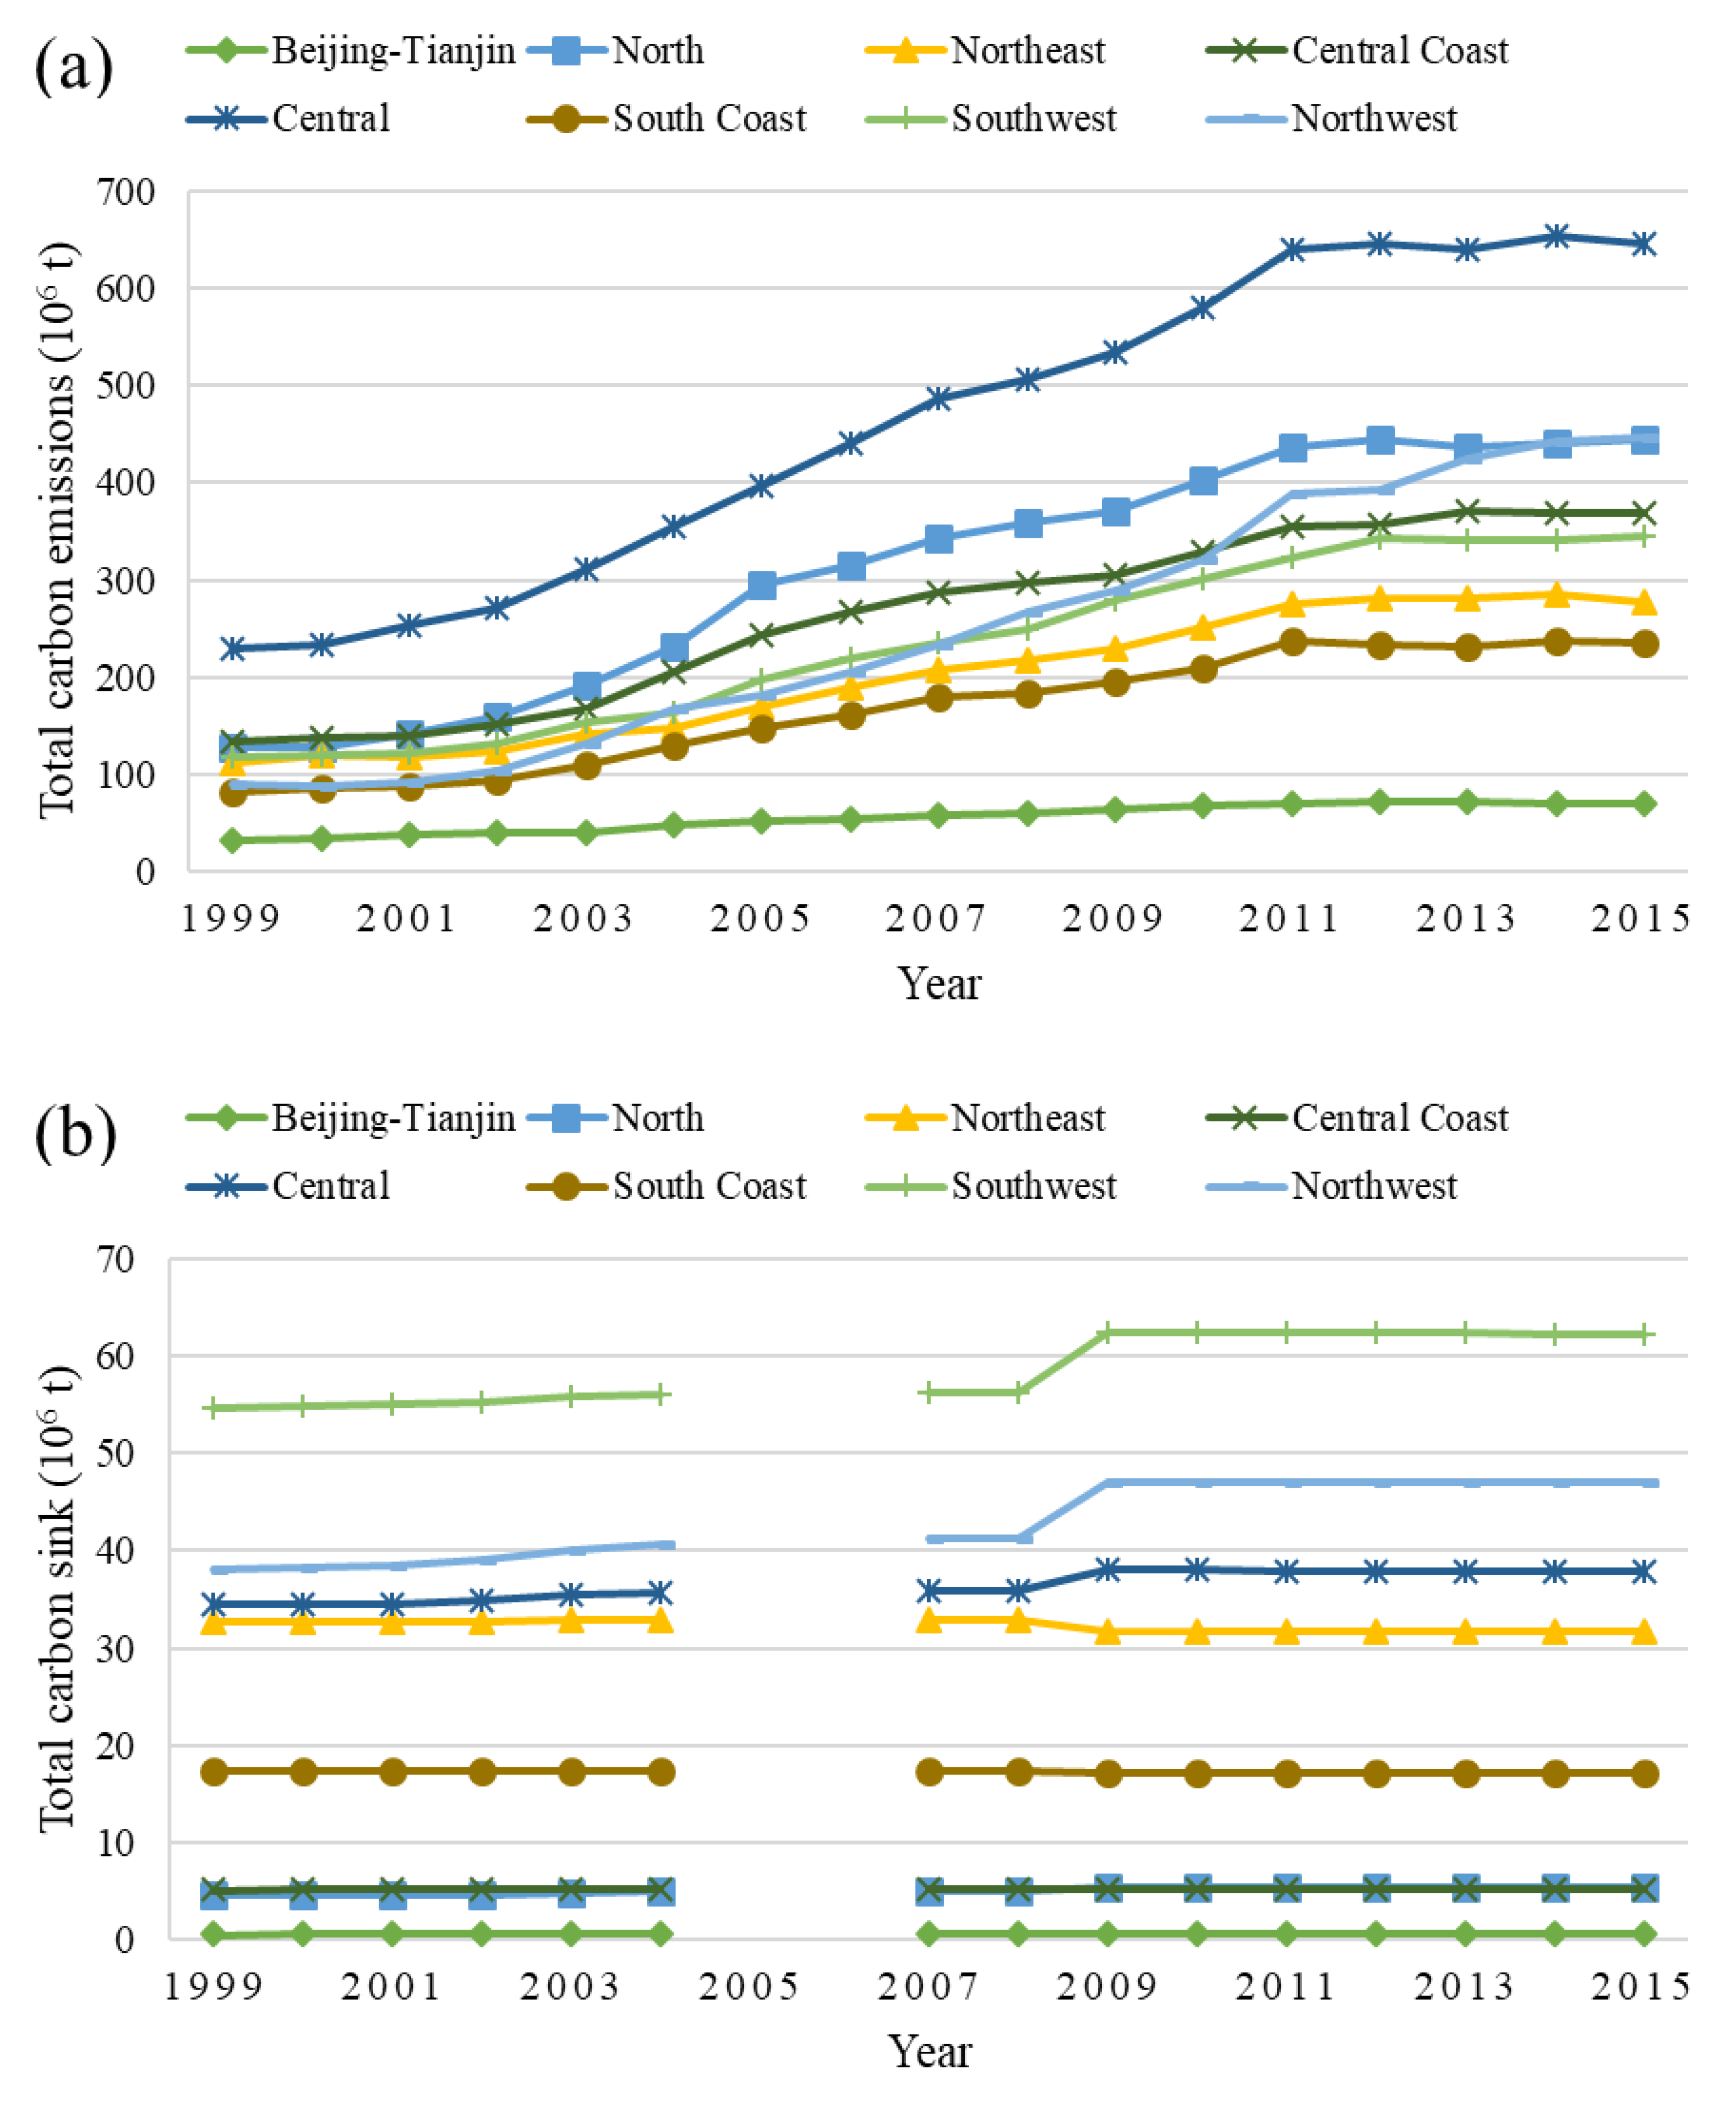
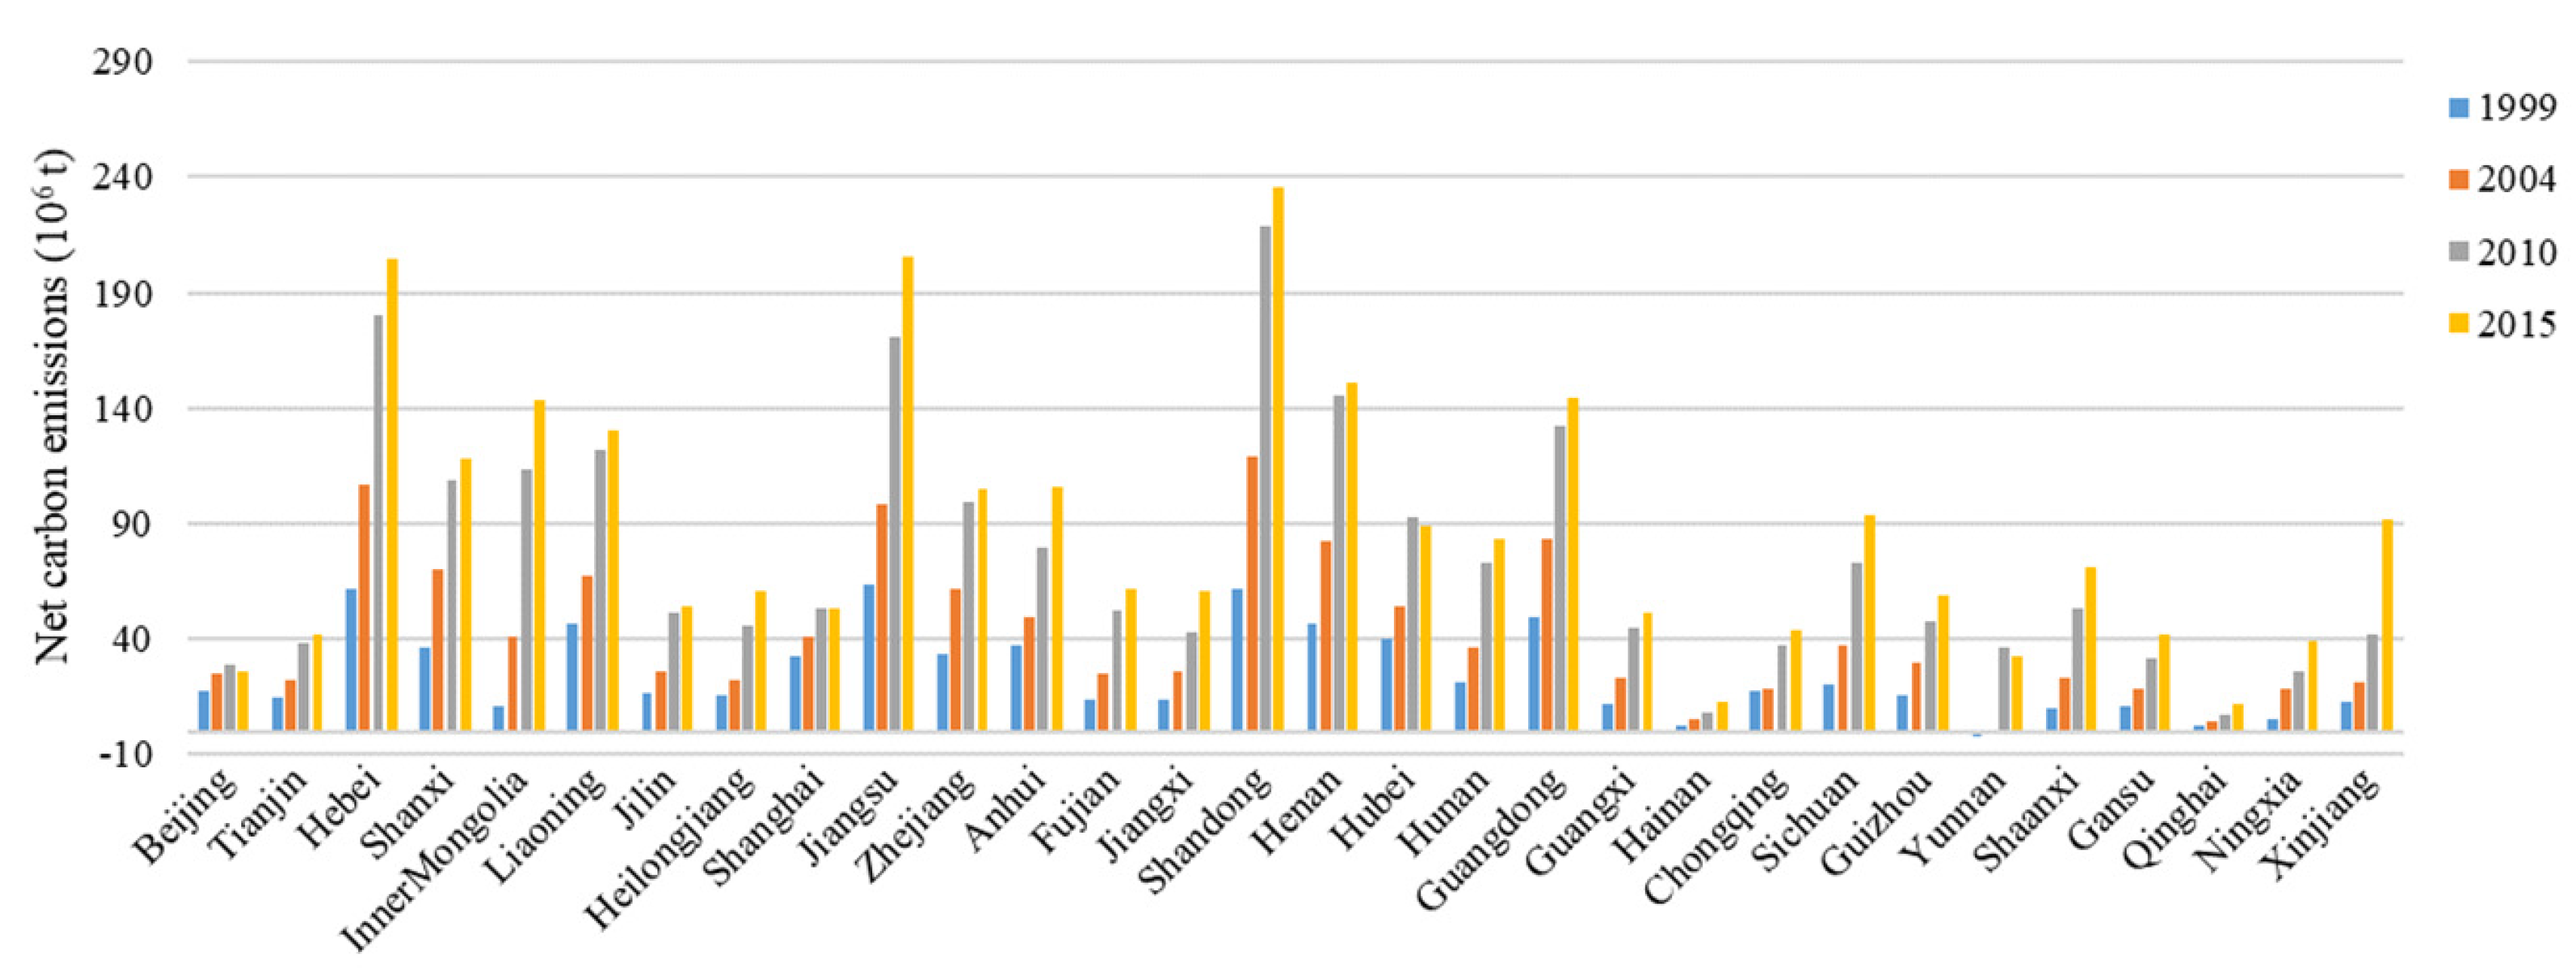
Figure 7.
The net carbon emissions of 30 Chinese provinces in 1999, 2004, 2010, and 2015.

Figure 8.
Spatial–temporal evolution of net carbon emissions in 30 Chinese provinces in (a) 1999, (b) 2004, (c) 2010, and (d) 2015.
Figure 8.
Spatial–temporal evolution of net carbon emissions in 30 Chinese provinces in (a) 1999, (b) 2004, (c) 2010, and (d) 2015.

Figure 9.
Carbon emissions of various land use types in 30 Chinese provinces in (a) 1999, and (b) 2015. Note that the negative value means a carbon sink.
Figure 9.
Carbon emissions of various land use types in 30 Chinese provinces in (a) 1999, and (b) 2015. Note that the negative value means a carbon sink.
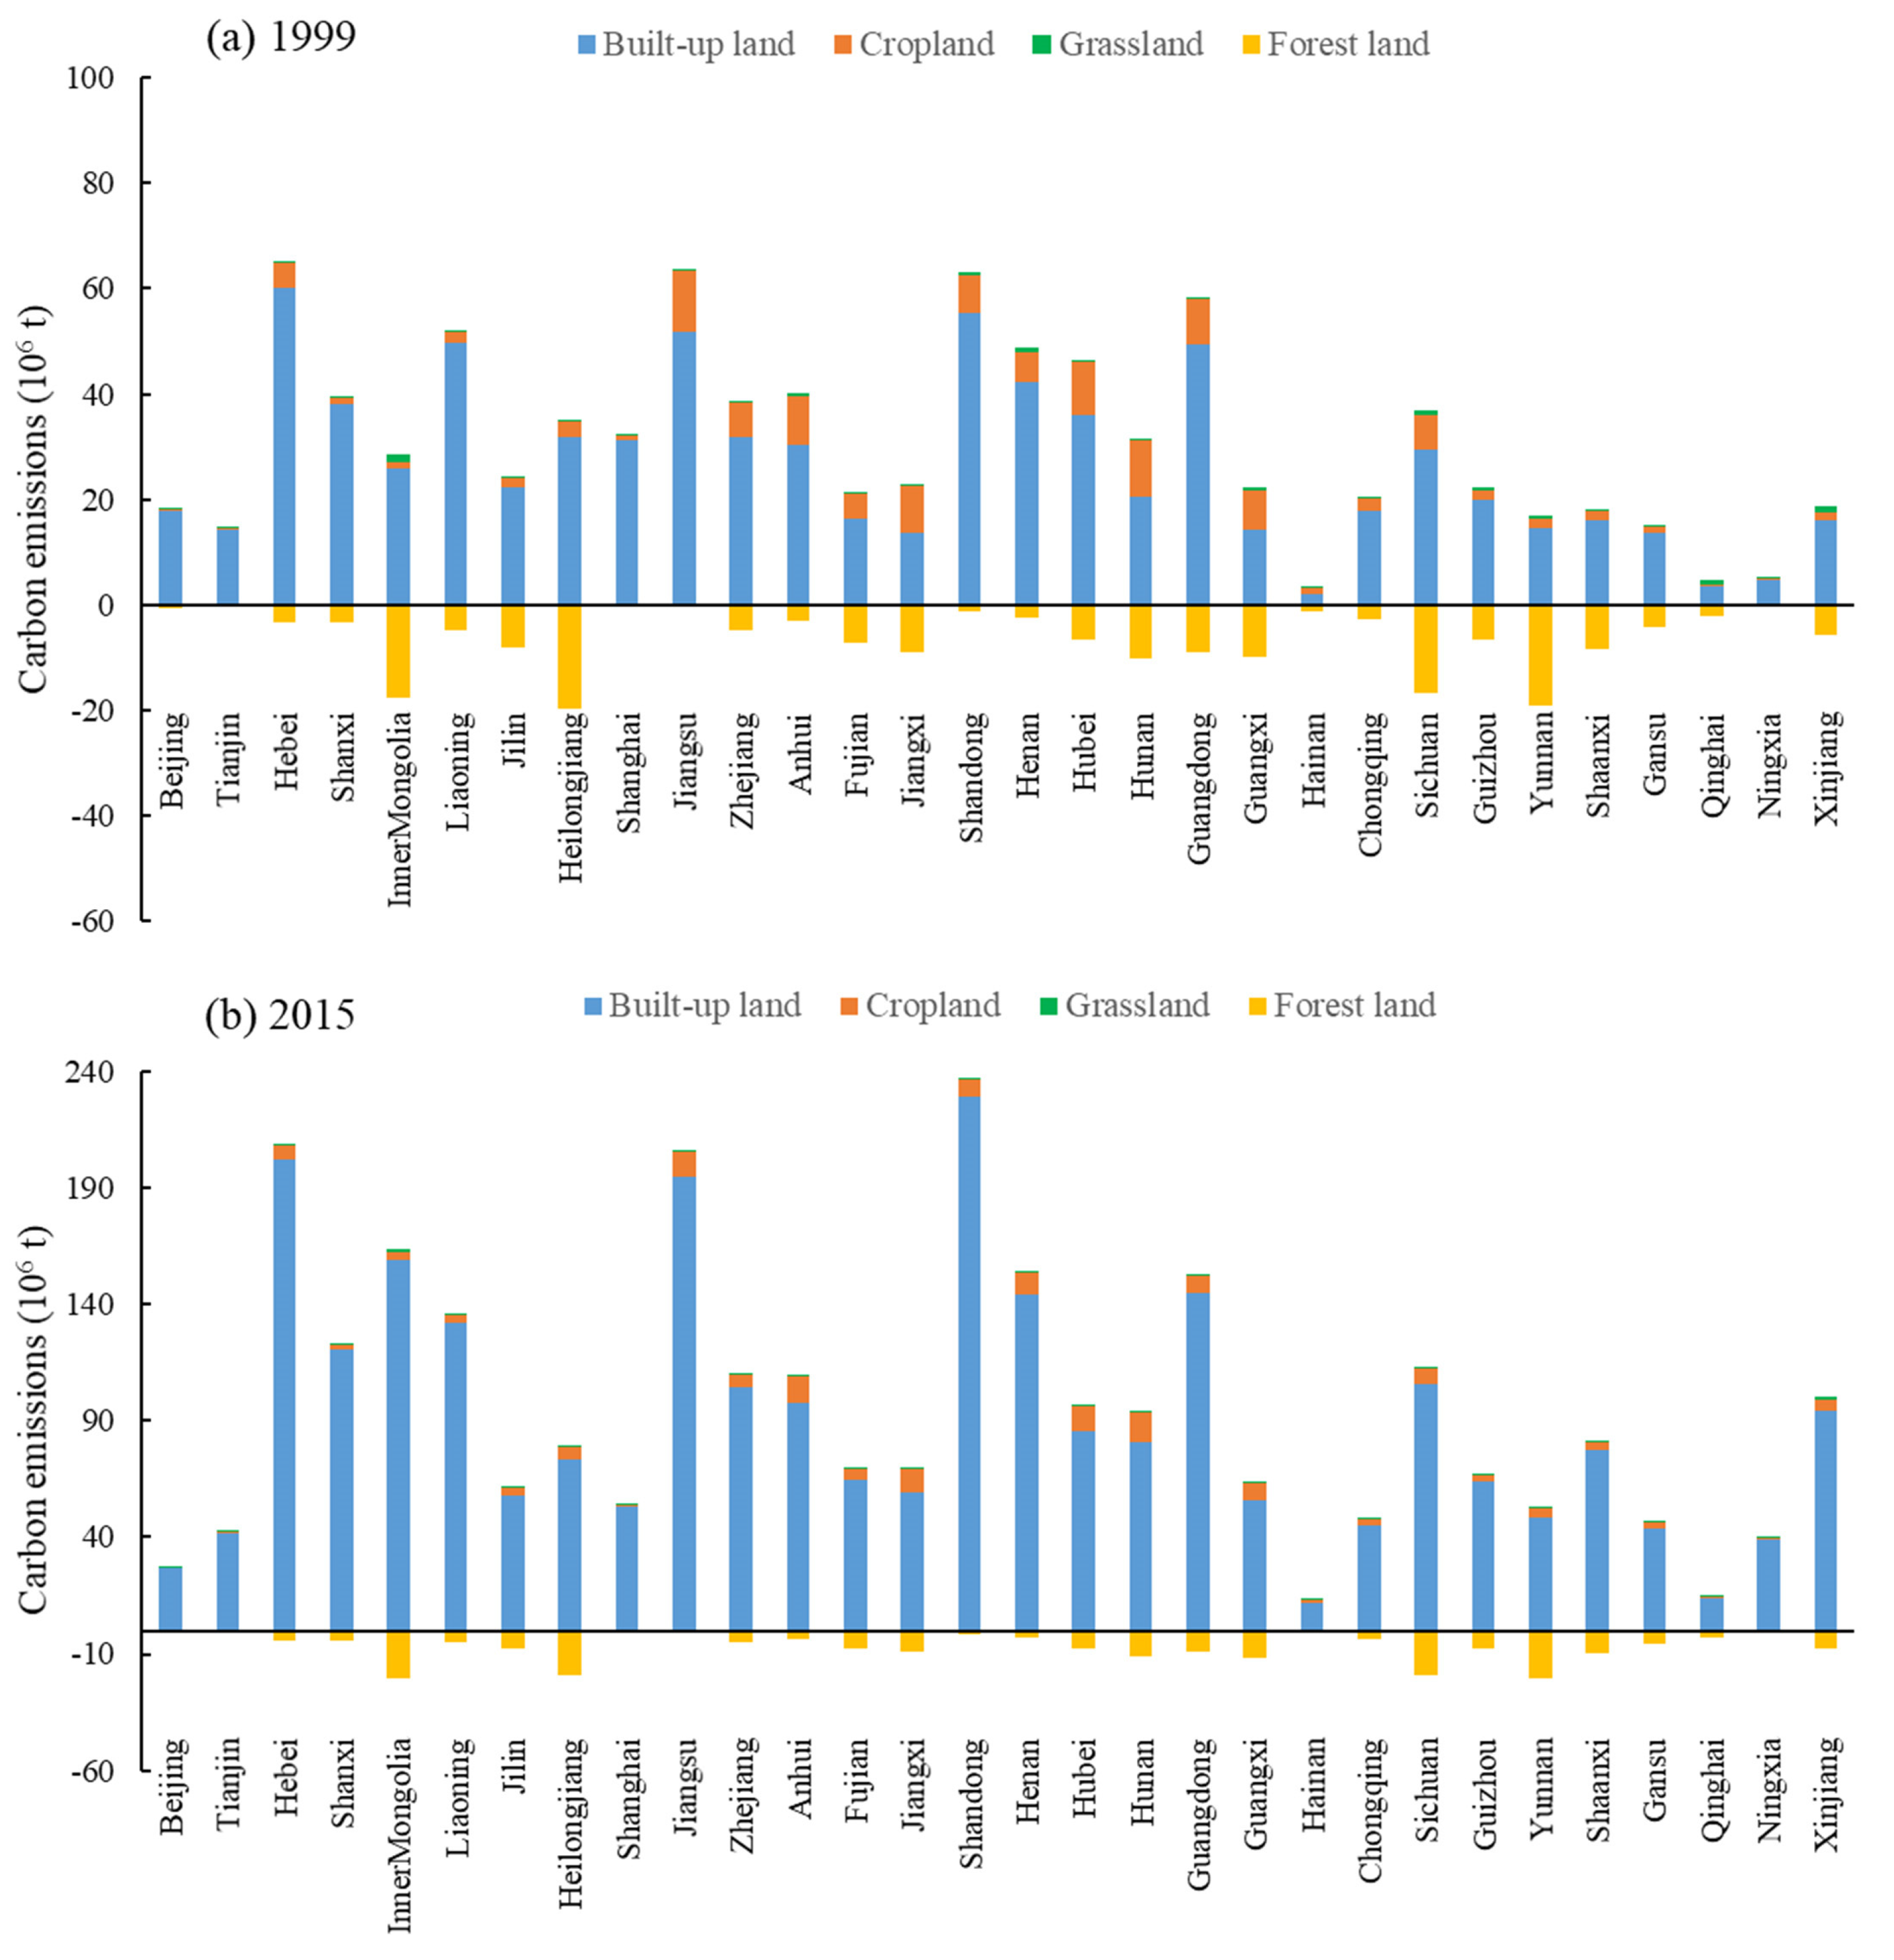
Figure 10.
Emissions–socioeconomic nexus in 30 Chinese provinces in 2015. (a) The spatial distribution of per capita carbon emissions (PCEI); (b) the spatial distribution of carbon emissions intensity per unit GDP (GCEI).
Figure 10.
Emissions–socioeconomic nexus in 30 Chinese provinces in 2015. (a) The spatial distribution of per capita carbon emissions (PCEI); (b) the spatial distribution of carbon emissions intensity per unit GDP (GCEI).

Figure 11.
(a) The relationship between carbon emissions and per capita GDP from 1999 to 2015 in China; (b) the relationship between carbon emissions and urban population share over 1999–2015 in China.
Figure 11.
(a) The relationship between carbon emissions and per capita GDP from 1999 to 2015 in China; (b) the relationship between carbon emissions and urban population share over 1999–2015 in China.

Table 1.
Description of the provinces contained in each Chinese region.
| Region | Provinces |
|---|---|
| Beijing–Tianjin | Beijing, Tianjin |
| North | Hebei, Shandong |
| Northeast | Liaoning, Jilin, Heilongjiang |
| Central Coast | Shanghai, Jiangsu, Zhejiang |
| Central | Shanxi, Anhui, Jiangxi, Henan, Hubei, Hunan |
| South Coast | Fujian, Guangdong, Hainan |
| Southwest | Guangxi, Chongqing, Sichuan, Guizhou, Yunnan |
| Northwest | Inner Mongolia, Shaanxi, Gansu, Qinghai, Ningxia, Xinjiang |
Table 2.
Assignment of carbon emissions to different land use types in China.
| Intergovernmental Panel on Climate Change (IPCC) Guidelines for National Greenhouse Gas Inventories | ||||
|---|---|---|---|---|
| Land Use Types | Energy Consumption | Industrial Processes | Agriculture, Forestry, and Other Land Use | Waste |
| Cropland | Farming | — | Soil and paddy fields | — |
| Forest land | Forestry | — | Vegetation and soil | — |
| Grassland | Animal husbandry | — | Vegetation and soil, enteric and manure fermentation of livestock 1 | — |
| Water bodies | Fisheries and water conservancy | — | Vegetation and soil | — |
| Unused land | — | — | Vegetation and soil | — |
| Urban land | Urban household consumption | — | Vegetation and soil | Wastewater and solid waste from urban households |
| Rural residential land | Rural household consumption | — | Vegetation and soil, enteric and manure fermentation of domestic livestock | Wastewater and solid waste from rural households |
| Industry–traffic land | Industry, construction, transportation, storage, post, and telecommunications services; wholesale, retail trade, and catering services | Industrial production | Soil | Industrial waste, water and solid waste |
1 Based on the current situation, livestock grazed on grasslands in China includes cattle, sheep, camels, and horses, while livestock raised on rural residential land includes mules, donkeys, pigs, and poultry.
Table 3.
CH4 emissions coefficient of various livestock in China (unit: CH4 kg·head−1·yr−1). 1
| Emissions Source | Cattle | Sheep | Camel | Horse | Mule | Donkey | Pig | Poultry |
|---|---|---|---|---|---|---|---|---|
| Enteric fermentation | 56.93 | 5.00 | 46.00 | 18.00 | 10.00 | 10.00 | 1.00 | 0.00 |
| Manure management | 6.33 | 0.16 | 1.92 | 1.64 | 0.90 | 0.90 | 3.50 | 0.02 |
| Total | 63.26 | 5.16 | 47.92 | 19.64 | 10.90 | 10.90 | 4.50 | 0.02 |
Table 4.
Agricultural production carbon emissions sources, coefficients, and reference sources.
| Carbon Source | Coefficient | Reference |
|---|---|---|
| Fertilizer | 0.8956 kg C/kg | West and Marland [47] |
| Pesticide | 4.9341 kg C/kg | Luo et al. [46] |
| Agricultural plastic film | 5.18 kg C/kg | IREEA 1 [48] |
| Agricultural diesel | 0.5927 kg C/kg | IPCC [30] |
| Agricultural irrigation | 20.476 kg C/ha | Li et al. [49] |
| Tillage | 312.6 kg C/km2 | Lu et al. [17] |
1 Institute of Resource, Ecosystem and Environment of Agriculture in Nanjing Agricultural University (IREEA).
Table 5.
Land use carbon emissions/sinks and carbon emissions intensity in China from 1999 to 2015. The percentages of built-up land, cropland, and grassland are the ratios of their emissions to total carbon emissions, while the percentage of forest land is the ratio of its carbon sinks to total carbon sinks. TCE, TCS, and NCE represent the total carbon emissions (unit: 106 t), total carbon sinks (unit: 106 t), and net carbon emissions (unit: 106 t), respectively. LCEI, GCEI, and PCEI represent the carbon emissions intensity (CEI) per unit of land area (unit: 103 t/km2), the carbon emissions intensity per unit of gross domestic product (GDP) (t/104 yuan), and per capita carbon emissions (t), respectively.
| Year | Land Use Carbon Emissions/Sinks (106 t) | TCE | TCS | NCE | LCEI | GCEI | PCEI | |||
|---|---|---|---|---|---|---|---|---|---|---|
| Built-Up Land | Cropland | Grassland | Forest Land | |||||||
| 1999 | 791.68 | 124.57 | 11.63 | 187.58 | 927.88 | 187.58 | 740.30 | 0.42 | 1.15 | 0.83 |
| 85.32% | 13.43% | 1.25% | 100% | 100% | 100% | |||||
| 2000 | 812.59 | 122.90 | 11.70 | 188.03 | 947.19 | 188.03 | 759.16 | 0.43 | 1.05 | 0.83 |
| 85.79% | 12.97% | 1.23% | 100% | 100% | 100% | |||||
| 2001 | 858.65 | 122.22 | 11.77 | 188.38 | 992.64 | 188.38 | 804.26 | 0.44 | 1.00 | 0.86 |
| 86.50% | 12.31% | 1.19% | 100% | 100% | 100% | |||||
| 2002 | 937.53 | 123.12 | 11.87 | 189.70 | 1072.53 | 189.70 | 882.82 | 0.47 | 0.97 | 0.91 |
| 87.41% | 11.48% | 1.11% | 100% | 100% | 100% | |||||
| 2003 | 1113.56 | 121.72 | 12.16 | 192.52 | 1247.44 | 192.52 | 1054.92 | 0.52 | 1.01 | 1.06 |
| 89.27% | 9.76% | 0.98% | 100% | 100% | 100% | |||||
| 2004 | 1308.56 | 129.81 | 12.49 | 193.46 | 1450.86 | 193.46 | 1257.40 | 0.60 | 0.96 | 1.22 |
| 90.19% | 8.95% | 0.86% | 100% | 100% | 100% | |||||
| 2005 | 1537.61 | 133.32 | 12.74 | 0.00 | 1683.67 | 0.00 | 1683.67 | 0.67 | 0.92 | 1.36 |
| 91.32% | 7.92% | 0.76% | 100% | 100% | 100% | |||||
| 2006 | 1708.14 | 135.12 | 11.47 | 0.00 | 1854.73 | 0.00 | 1854.73 | 0.72 | 0.87 | 1.49 |
| 92.10% | 7.29% | 0.62% | 100% | 100% | 100% | |||||
| 2007 | 1881.76 | 138.19 | 10.15 | 194.39 | 2030.09 | 194.39 | 1835.71 | 0.78 | 0.79 | 1.62 |
| 92.69% | 6.81% | 0.50% | 100% | 100% | 100% | |||||
| 2008 | 1990.13 | 139.84 | 10.17 | 194.37 | 2140.14 | 194.37 | 1945.77 | 0.81 | 0.69 | 1.70 |
| 92.99% | 6.53% | 0.47% | 100% | 100% | 100% | |||||
| 2009 | 2113.66 | 142.81 | 10.27 | 208.02 | 2266.74 | 208.02 | 2058.72 | 0.84 | 0.68 | 1.79 |
| 93.25% | 6.30% | 0.45% | 100% | 100% | 100% | |||||
| 2010 | 2307.85 | 145.52 | 10.30 | 207.86 | 2463.67 | 207.86 | 2255.81 | 0.90 | 0.61 | 1.91 |
| 93.68% | 5.91% | 0.42% | 100% | 100% | 100% | |||||
| 2011 | 2570.35 | 147.90 | 10.19 | 207.68 | 2728.43 | 207.68 | 2520.75 | 0.98 | 0.57 | 2.13 |
| 94.21% | 5.42% | 0.37% | 100% | 100% | 100% | |||||
| 2012 | 2609.83 | 149.84 | 10.11 | 207.54 | 2769.78 | 207.54 | 2562.24 | 0.98 | 0.52 | 2.17 |
| 94.23% | 5.41% | 0.37% | 100% | 100% | 100% | |||||
| 2013 | 2636.88 | 151.35 | 10.13 | 207.42 | 2798.36 | 207.42 | 2590.94 | 0.99 | 0.48 | 2.20 |
| 94.23% | 5.41% | 0.36% | 100% | 100% | 100% | |||||
| 2014 | 2676.91 | 152.84 | 10.25 | 207.26 | 2840.00 | 207.26 | 2632.74 | 0.98 | 0.46 | 2.22 |
| 94.26% | 5.38% | 0.36% | 100% | 100% | 100% | |||||
| 2015 | 2670.01 | 153.46 | 10.44 | 207.19 | 2833.91 | 207.19 | 2626.72 | 0.97 | 0.44 | 2.19 |
| 94.22% | 5.42% | 0.37% | 100.00% | 100% | 100% | |||||
Table 6.
Cumulative carbon emissions in 30 Chinese provinces over 1999–2015.
| Province | Cumulative Emissions (106 t) | Province | Cumulative Emissions (106 t) |
|---|---|---|---|
| Beijing | 437.20 | Henan | 1892.29 |
| Tianjin | 505.67 | Hubei | 1304.63 |
| Hebei | 2481.08 | Hunan | 1114.71 |
| Shanxi | 1556.75 | Guangdong | 1926.17 |
| Inner Mongolia | 1680.37 | Guangxi | 746.64 |
| Liaoning | 1667.44 | Hannan | 132.72 |
| Jilin | 806.19 | Chongqing | 546.13 |
| Heilongjiang | 954.37 | Sichuan | 1199.13 |
| Shanghai | 785.32 | Guizhou | 783.20 |
| Jiangsu | 2300.26 | Yunnan | 706.73 |
| Zhejiang | 1399.48 | Shaanxi | 779.65 |
| Anhui | 1206.54 | Gansu | 513.65 |
| Fujian | 785.63 | Qinghai | 152.97 |
| Jiangxi | 747.40 | Ningxia | 360.38 |
| Shandong | 2793.54 | Xinjiang | 781.77 |
Table 7.
Carbon emissions of different land use types in 30 Chinese provinces in 1999 and 2015 (106 t). Note that the negative value means a carbon sink.
Table 7.
Carbon emissions of different land use types in 30 Chinese provinces in 1999 and 2015 (106 t). Note that the negative value means a carbon sink.
| 1999 | 2015 | |||||||
|---|---|---|---|---|---|---|---|---|
| Province | Built-Up Land | Cropland | Grassland | Forest Land | Built-Up Land | Cropland | Grassland | Forest Land |
| Beijing | 17.93 | 0.32 | 0.01 | −0.55 | 26.53 | 0.18 | 0.02 | −0.64 |
| Tianjin | 14.30 | 0.38 | 0.01 | −0.03 | 41.97 | 0.38 | 0.02 | −0.05 |
| Hebei | 60.26 | 4.50 | 0.56 | −3.40 | 201.98 | 6.08 | 0.37 | −4.02 |
| Shanxi | 38.10 | 1.17 | 0.21 | −3.25 | 120.77 | 1.68 | 0.16 | −4.25 |
| Inner Mongolia | 25.97 | 1.22 | 1.26 | −17.66 | 159.11 | 3.32 | 1.44 | −20.32 |
| Liaoning | 49.63 | 2.17 | 0.17 | −4.90 | 131.99 | 3.21 | 0.30 | −4.91 |
| Jilin | 22.43 | 1.68 | 0.31 | −8.00 | 58.02 | 3.42 | 0.31 | −7.74 |
| Heilongjiang | 31.86 | 2.99 | 0.36 | −19.79 | 73.16 | 5.92 | 0.39 | −19.08 |
| Shanghai | 31.16 | 1.05 | 0.01 | 0.00 | 52.90 | 0.58 | 0.01 | −0.04 |
| Jiangsu | 51.91 | 11.43 | 0.09 | −0.27 | 194.56 | 11.38 | 0.04 | −0.23 |
| Zhejiang | 31.75 | 6.54 | 0.04 | −4.82 | 104.38 | 5.36 | 0.02 | −4.94 |
| Anhui | 30.39 | 9.24 | 0.41 | −2.94 | 97.55 | 11.67 | 0.14 | −3.28 |
| Fujian | 16.21 | 4.93 | 0.08 | −7.27 | 64.77 | 4.33 | 0.05 | −7.29 |
| Jiangxi | 13.80 | 8.83 | 0.24 | −8.90 | 59.09 | 10.35 | 0.20 | −9.04 |
| Shandong | 55.32 | 7.16 | 0.75 | −1.14 | 229.07 | 7.74 | 0.44 | −1.30 |
| Henan | 42.21 | 5.69 | 1.00 | −2.46 | 144.15 | 9.52 | 0.69 | −3.04 |
| Hubei | 36.09 | 10.03 | 0.28 | −6.69 | 85.20 | 11.30 | 0.25 | −7.52 |
| Hunan | 20.62 | 10.52 | 0.33 | −10.22 | 80.53 | 13.03 | 0.33 | −10.68 |
| Guangdong | 49.52 | 8.48 | 0.27 | −8.93 | 144.59 | 8.04 | 0.16 | −8.77 |
| Guangxi | 14.25 | 7.43 | 0.52 | −9.98 | 55.61 | 7.46 | 0.31 | −11.64 |
| Hainan | 2.05 | 1.18 | 0.09 | −1.25 | 11.78 | 1.62 | 0.06 | −1.05 |
| Chongqing | 17.85 | 2.27 | 0.11 | −2.58 | 44.82 | 2.56 | 0.11 | −3.33 |
| Sichuan | 29.51 | 6.60 | 0.85 | −16.58 | 105.47 | 7.07 | 0.88 | −19.37 |
| Guizhou | 19.83 | 1.92 | 0.46 | −6.62 | 64.23 | 2.37 | 0.38 | −7.82 |
| Yunnan | 14.49 | 1.81 | 0.59 | −18.97 | 48.33 | 4.07 | 0.58 | −20.13 |
| Shaanxi | 16.03 | 1.83 | 0.22 | −8.24 | 77.73 | 3.06 | 0.16 | −9.79 |
| Gansu | 13.73 | 1.09 | 0.43 | −4.05 | 43.87 | 2.51 | 0.56 | −5.33 |
| Qinghai | 3.69 | 0.11 | 0.81 | −2.12 | 14.26 | 0.18 | 0.87 | −3.10 |
| Ningxia | 4.70 | 0.40 | 0.08 | −0.23 | 39.06 | 0.64 | 0.12 | −0.67 |
| Xinjiang | 16.11 | 1.58 | 1.06 | −5.71 | 94.57 | 4.42 | 1.07 | −7.84 |
Table 8.
Carbon emissions/sinks of land use along with carbon emissions intensity in 30 Chinese provinces in 2015.
Table 8.
Carbon emissions/sinks of land use along with carbon emissions intensity in 30 Chinese provinces in 2015.
| Province | Total Carbon Emissions (106 t) | Total Carbon Sink (106 t) | GDP per Capita (104 Yuan) | Per Capita Carbon Emissions (t) | CEI per Unit GDP (t/104 Yuan) | CEI per Unit Land Area (103 t/km2) |
|---|---|---|---|---|---|---|
| Beijing | 26.73 | 0.64 | 10.60 | 1.23 | 0.12 | 1.57 |
| Tianjin | 42.37 | 0.05 | 10.69 | 2.74 | 0.26 | 3.53 |
| Hebei | 208.42 | 4.02 | 4.01 | 2.81 | 0.70 | 1.10 |
| Shanxi | 122.62 | 4.25 | 3.48 | 3.35 | 0.96 | 0.77 |
| Inner Mongolia | 163.86 | 20.32 | 7.10 | 6.53 | 0.92 | 0.14 |
| Liaoning | 135.49 | 4.91 | 6.78 | 3.20 | 0.47 | 0.90 |
| Jilin | 61.76 | 7.74 | 5.28 | 2.32 | 0.44 | 0.33 |
| Heilongjiang | 79.47 | 19.08 | 3.96 | 2.08 | 0.53 | 0.17 |
| Shanghai | 53.48 | 0.04 | 10.40 | 2.21 | 0.21 | 8.49 |
| Jiangsu | 205.98 | 0.23 | 8.79 | 2.58 | 0.29 | 2.06 |
| Zhejiang | 109.75 | 4.94 | 8.80 | 2.25 | 0.26 | 1.10 |
| Anhui | 109.35 | 3.28 | 3.58 | 1.78 | 0.50 | 0.78 |
| Fujian | 69.16 | 7.29 | 6.77 | 1.80 | 0.27 | 0.58 |
| Jiangxi | 69.65 | 9.04 | 3.66 | 1.53 | 0.42 | 0.41 |
| Shandong | 237.24 | 1.30 | 6.40 | 2.41 | 0.38 | 1.48 |
| Henan | 154.36 | 3.04 | 3.45 | 1.44 | 0.42 | 0.91 |
| Hubei | 96.76 | 7.52 | 5.05 | 1.65 | 0.33 | 0.51 |
| Hunan | 93.89 | 10.68 | 9.63 | 1.30 | 0.13 | 0.45 |
| Guangdong | 152.79 | 8.77 | 8.08 | 1.70 | 0.21 | 0.80 |
| Guangxi | 63.38 | 11.64 | 3.05 | 1.15 | 0.38 | 0.26 |
| Hainan | 13.46 | 1.05 | 4.08 | 1.48 | 0.36 | 0.40 |
| Chongqing | 47.48 | 3.33 | 4.66 | 1.41 | 0.30 | 0.58 |
| Sichuan | 113.41 | 19.37 | 3.66 | 1.38 | 0.38 | 0.23 |
| Guizhou | 66.98 | 7.82 | 2.98 | 1.90 | 0.64 | 0.37 |
| Yunnan | 52.97 | 20.13 | 2.87 | 1.12 | 0.39 | 0.14 |
| Shaanxi | 80.95 | 9.79 | 4.75 | 2.13 | 0.45 | 0.39 |
| Gansu | 46.94 | 5.33 | 2.61 | 1.81 | 0.69 | 0.11 |
| Qinghai | 15.32 | 3.10 | 4.14 | 2.60 | 0.26 | 0.02 |
| Ningxia | 39.81 | 0.67 | 3.95 | 1.69 | 0.43 | 0.60 |
| Xinjiang | 100.06 | 7.84 | 3.95 | 4.24 | 1.07 | 0.06 |
© 2019 by the authors. Licensee MDPI, Basel, Switzerland. This article is an open access article distributed under the terms and conditions of the Creative Commons Attribution (CC BY) license (http://creativecommons.org/licenses/by/4.0/).
Share and Cite
MDPI and ACS Style
Wang, L.; Pei, J.; Geng, J.; Niu, Z. Tracking the Spatial–Temporal Evolution of Carbon Emissions in China from 1999 to 2015: A Land Use Perspective. Sustainability 2019, 11, 4531. https://doi.org/10.3390/su11174531
AMA Style
Wang L, Pei J, Geng J, Niu Z. Tracking the Spatial–Temporal Evolution of Carbon Emissions in China from 1999 to 2015: A Land Use Perspective. Sustainability. 2019; 11(17):4531. https://doi.org/10.3390/su11174531
Chicago/Turabian StyleWang, Li, Jie Pei, Jing Geng, and Zheng Niu. 2019. "Tracking the Spatial–Temporal Evolution of Carbon Emissions in China from 1999 to 2015: A Land Use Perspective" Sustainability 11, no. 17: 4531. https://doi.org/10.3390/su11174531
Note that from the first issue of 2016, this journal uses article numbers instead of page numbers. See further details here.