Towards Analytics-Enabled Efficiency Improvements in Maritime Transportation: A Case Study in a Mediterranean Port


Department of Energy, Systems, Territory and Construction Engineering, University of Pisa—Largo Lucio Lazzarino 1, 56122 Pisa, Italy
*
Author to whom correspondence should be addressed.
Sustainability 2019, 11(16), 4473; https://doi.org/10.3390/su11164473
Submission received: 21 June 2019
/
Revised: 1 August 2019
/
Accepted: 13 August 2019
/
Published: 18 August 2019
Abstract
:The current digitalization trend, the increased attention towards sustainability, and the spread of the business analytics call for higher efficiency in port operations and for investigating the quantitative approaches for maritime logistics and freight transport systems. Thus, this manuscript aims at enabling analytics-driven improvements in the port transportation processes efficiency by streamlining the related information flow, i.e., by attaining shorter time frames of the information and document sharing among the export stakeholders. We developed a case study in a mid-sized European port, in which we applied Process Mining (PM)—an emerging type of business analytics—to a seven-month dataset from the freight export process. Four process inefficiencies and an issue that can jeopardize the reliability of the time performance measurements were detected, and we proposed a draft of solutions to cope with them. PM enabled enhancements in the overall export time length, which might improve the vessels’ turnover and reduce the corresponding operational costs, and supported the potential re-design of performance indicators in process control and monitoring. The results answer the above-mentioned calls and they offer a valuable, analytics-based alternative to the extant approaches for improving port performance, because it focuses on the port information flow, which is often related to sustainability issues, rather than the physical one.
1. Introduction
Today’s sharper environmental restrictions, higher attention towards sustainability, growing transport volumes, and the pressing need to digitalize the transactions demand better port efficiency for ameliorating the competitiveness of seaports [1,2,3]. With this aim, the wider data volumes that are currently generated are increasingly requiring support from the business analytics for more timely, fact-based decision making [4,5,6,7,8,9].
Despite this, and although analytics play a topical role in the logistics evolution [10,11], the logistics literature is characterized by a shortage of contributions that harness such wider data volumes through business analytics for achieving better port efficiency. Thus, the objective of this paper is to enable analytics-driven enhancements of the freight export business process efficiency by improving the performances that are related to the export information flow, i.e., by enabling shorter time to retrieve, process, and transmit the transaction and authorization documents. In this regard, intervening in the information flow corresponds to a wide set of potential actions, e.g., redefining the document flow, removing specific activities, quickening the sharing of data that are needed for combined activities by two or more actors. These enhancements may lower the export process time length, potentially reducing the waiting time of the container vessels, whose daily cost at a port terminal ranges between US$ 45,000–65,000 [12].
The relevance of such an objective is linked to three scientific gaps. First, there is little scientific evidence regarding quantitative analyses for freight transport and maritime logistics systems, and additional efforts are needed [13].
Second, the information flow that is involved in port freight transportation processes is very data-intensive [14,15] because of the high number of data attributes that characterize the cargos. This makes such processes strongly suitable for the exploitation of business analytics, which are known for enabling better process efficiency [16,17]. Nevertheless, the scientific literature has offered limited investigations regarding harnessing such great data volumes through the business analytics for information-flow-based improvements in port efficiency.
Third, our focus on the information flow rather than the physical one is topical because: (I) lowering the time length of information and document sharing can affect the overall port efficiency to a certain extent [18]; and (II) the physical flow has been the main area of optimization in maritime and port literature [19,20], while the information one has been overlooked, despite its utmost relevance to port efficiency [21] and to sustainability issues [22,23]. Indeed, the optimization of the physical logistics flow [24], particularly when linked to terminal operations, can only affect port efficiency positively to a certain extent. The physical handling is only part of what is needed to execute the main port logistics activities because it must be supported by an information flow specifying, for instance, the goods’ declaration data (e.g., type, weight) and the needed authorizations. Inefficiencies in the information flow, e.g., issues in goods declaration or delays in the submission of the bills of lading, can hamper or even impede the cargo loading or unloading, or the berthing or departure of a vessel. Moreover, the lack of accurate information sharing might increase the uncertainty in planning and scheduling terminal operations [25]. These occurrences can exert a detrimental effect on several efficiency indicators, e.g., berth occupancy rate, cargo time, time elapsed from when the cargo is unloaded until the vessel leaves the port, prolonging the vessel waiting time, and increasing the corresponding total cost.
To achieve our research objective, we developed a case study in which we applied Process Mining (PM)—an emerging type of business analytics—to the information flow of the Information-System-supported export process of a mid-sized Mediterranean port. PM was suitable for our objective, because it is a set of techniques developed for semi-automated business process discovery, conformance, and enhancement activities, and for identifying and fixing process deviations, inefficiencies, bottlenecks, and deadlocks in Information-System-enabled, data-intensive business processes [26].
We elicited the export time metrics, including the overall mean export time frame, through the PM analysis on a seven-month export dataset. By reconstructing the actual flow of the export process, we identified a process issue that can threaten the reliability of the time performance measurements and four inefficiencies. We proposed a draft of solutions for coping with them, enabling improvements in both the overall efficiency of the freight export process and the process control and monitoring. The findings fill the above-mentioned scientific gaps and provide in-depth evidences regarding how business analytics may be practically leveraged, which challenges the complexity of a real-life case in the port environment.
The remainder of this manuscript is structured, as follows: Section 2 presents the literature background; Section 3 details the research design; Section 4 expounds the findings, which are discussed in Section 5; Section 6 outlines the implications based on the experimental outcomes; finally, Section 7 concludes the work.
2. Business Analytics in Port Operations
Information management and digital transformation cover the lion’s share in the current port logistics evolution [27]. Significant efforts have been spent for enhancing efficiency, effectiveness, and transparency of the port information flow by implementing different kinds of collaborative port Information Systems (ISs), such as the Port Community Systems (PCSs) [14,15]. A PCS is an open electronic platform that enables information exchange among public and private port stakeholders, and its scope may cover a wide number of activities [28]. In so doing, it manages the main port processes through a single point of data entry [29], and it automates and supports the collection of port data [30]. PCSs may reduce the average time frame of port procedures [21], and the enhanced information sharing they enable can improve the port competitiveness [31]. Nonetheless, to our best knowledge, the scientific literature has investigated neither how to optimize the efficiency of the information flow exchanged by such ISs nor how to potentially improve port transportation efficiency without an exclusive focus on the port physical activities.
The implementation of such advanced port ISs has enabled the data collection from heterogeneous sources to feed business analytics for extracting process-related knowledge and for supporting long- and short-term decision making [14]. Despite the growing port data volumes and the need to harness them for improving port operations efficiency and transparency [2], the scientific literature has offered limited contributions about how business analytics can practically leverage such volumes for enabling enhancements in port efficiency.
Kim et al. (2017) [32] devised and validated a predictive analytics method for the early detection of vessels delays by comparing the tracking patterns of shipments to historical shipping data. The analytics was mostly developed for improving the capabilities of the fourth-party logistics firms in fulfilling the expectations of the customers, although the effectiveness of the method was demonstrated for detecting delays both prior to vessel departure and in real time. Thus, any potential link with port efficiency [33] was overlooked.
Wasesa et al. (2017) [34] presented a Decision Support System (DSS) exploiting analytics to predict the seaport service rate for drayage operations, and it showed better performance than other benchmark solutions. Yet, despite involving seaports, this DSS mostly concerns the drayage operators’ standpoint to improve their prediction of the pick-up/delivery operations. Hence, it is more focused on the landside perspective, rather than the seaside one.
Perera and Mo (2017) [35] developed and validated a data analytics approach to monitor ship performance and navigation conditions from the ship energy efficiency perspective. The approach aims at improving the vessel navigation parameters, but its main unit of analysis is the vessel itself, without establishing any relationships with port operations.
Maldonado et al. (2019) [36] proposed an analytics-based DSS to minimize the container re-handlings. The DSS uses data about container features, berthing location, and yard conditions, and showed good performance when compared to other stacking practices and strategies. Yet, this contribution concerns the optimization of the port physical flow, overlooking the information one. Thus, it can hardly be framed within the current port digitalization trend.
The business analytics have also been used for enhancing maritime security and logistics visibility [37] and for assessing the potential risks in the maritime environment [38]. Nonetheless, these contributions, as the other ones, we analyzed:
- are analytics-based but they mostly focus on the freight or vessel physical flow rather than the information one;
- do not investigate port efficiency and do not enable potential interventions to cope with potential inefficiencies in port operations; and,
- do not consider the perspective of the main stakeholder of a seaport, i.e., the port authority.
Accordingly, this manuscript tackles these gaps directly by enabling analytics-driven enhancements in the data-intensive information flow efficiency of a port freight transport process, and the next section presents the research design.
3. Research Design
We developed a case study within a port context in which we applied PM to a dataset from the PCS that serves the port community to fulfill our research objective. PM was suitable for our research purpose, because: (I) it is an emerging type of business analytics [39]; (II) it has been specifically developed for diagnosis and improvement business processes; and, (III) it focuses on the analysis of the information flow stemming from the ISs supporting the business processes [40]. Thus, the following sections justify and detail the case study (3.1) and the PM application (3.2).
3.1. The Case Study
According to the guidelines by [41], we developed a descriptive case study that aimed at (a) collecting the data that are needed to deepen the port logistics dynamics, (b) collecting the quantitative data for exploiting PM, and (c) receiving support in interpreting the findings. The suitability of such a methodology is consistent with [42] and [41], and with the need to increase the domain knowledge when the exploitation of business analytics is involved [43].
The case design was single-case, because its descriptive nature did not require any replication or analytic generalization, differently from explanatory purposes. The rationale of the single case was the common case, i.e., a case whose objective “is to capture the circumstances and conditions of an everyday situation” [41] (p. 52).
The context of the case was a mid-sized European port, whose overall throughput surpasses 800,000 containers. Recently, its import and export volumes have slightly diminished, but the number of vessels has strongly increased. The port mostly serves lift-on/lift-off vessels and handles containerized cargoes. Yet, it also manages other kinds of cargoes, such as agricultural and city vehicles, and also bulk materials, in particular products that were yielded by two nearby, big-sized chemical facilities.
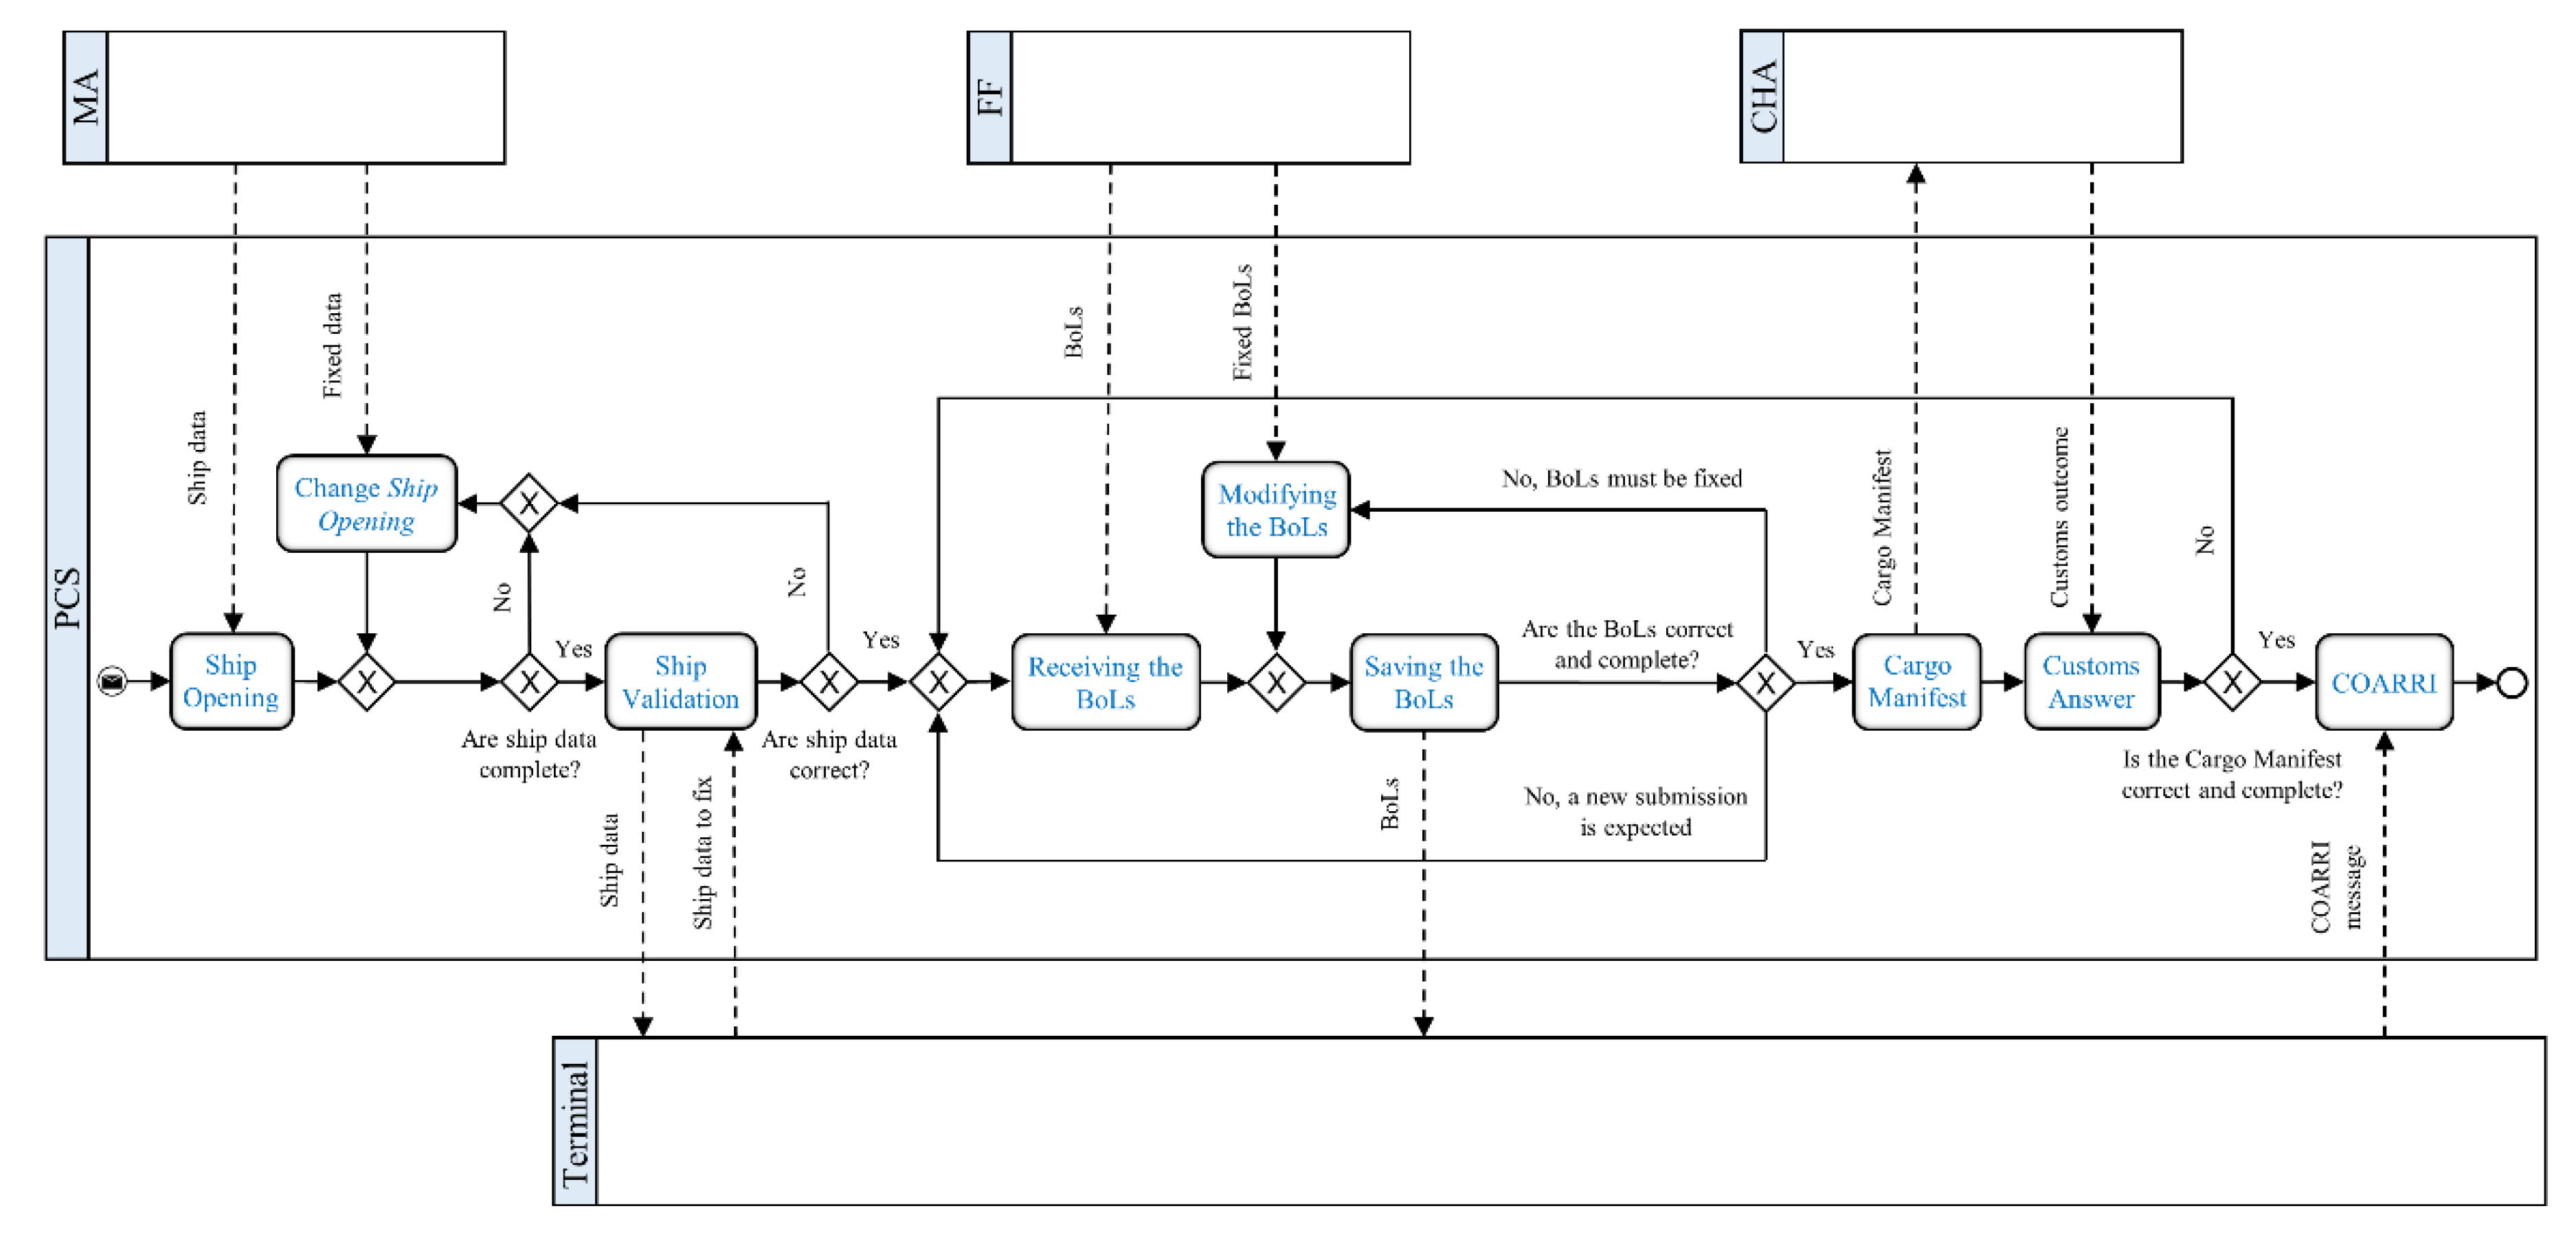
Since 2012, the port has backed its operations up by means of a PCS, which supports four business processes: export, import, national and community cabotage, and customs single window. Given our research purpose, we focused on the freight export process, because, according to the Port Authority (PA), it is the most data-intensive and is the most critical one in creating value for the port customers. Our inquiry was limited to the containerized cargoes because they account for over 90% of the goods throughput and because this may potentially foster the generalization of the outcomes to other container ports. The qualitative data about the freight export dynamics were collected through multiple semi-structured interviews, until saturation, with a panel that consists of six experts about port logistics and about the ISs of the informant port. Table 1 shows the additional data that were provided by the PA. Table 2 specifies the freight export stakeholders and documents, while Figure 1 depicts the de jure model of the export process in Business Process Model and Notation standard.
The export process starts with a Maritime Agency that creates a new export instance that is related to a vessel (Ship Opening activity). The data concerning the vessel—e.g., ship name, itinerary, Estimate Time to Arrival, Closing Time, and the Customs House Agent associated with the ship operations—are sent from the PCS to the Terminal for a check about their correctness and completeness (Ship Validation activity). If the check is negative, the data need to be fixed or updated (Change Ship Opening activity). In the case of a positive outcome, the Freight Forwarders (FFs) can start to submit their Bills of Lading (BoLs) to the PCS (Receiving the BoLs activity) within the given Closing Time. The export BoLs submission is authorized when the vessel that shall be laden with the goods to export arrives within the pre-clearing area, i.e., a sea area that extends to three kilometers from the quayside. The Terminals save the accepted BoLs on their own system (Saving the BoLs activity). All of the BoLs sent after the Closing Time are saved in the PCS, but their acceptance is at the discretion of the Terminals, who eventually coordinate with the corresponding FFs for their processing. When a BoL is accepted by a Terminal, the corresponding goods are moved to the FF warehouses, if available, or directly to the Terminal warehouse.
The BoLs can be modified or updated by the FFs (Modifying the BoLs activity). Thus, the management of the BoLs (henceforth, BoL process) is organized into three BoLs’ activities, and its output incrementally builds the Cargo Manifest up (Cargo Manifest activity). The Cargo Manifest—one for each vessel—is made available to a Customs House Agent for a customs check, which is executed on the customs national system outside the PCS. Once the same agent receives the outcome of the check by the customs system, s/he submits it to the PCS (Customs Answer activity). If all of the documents are consistent with each other, the Terminals may load the goods on the vessel and, when the lading is complete, they transmit the COARRI to the PCS. The COARRI message points out which goods were loaded and if some goods recorded in the Cargo Manifest were not laden and, in the port in which we developed the case, it is submitted as soon as possible after the departure of the vessel. The COARRI release completes the export process instance.
3.2. The Process Mining Application
We applied PM to seven months of export data that were extracted from the PCS by considering the life-cycle model by [26]. The purpose of the PM application was both process discovery and enhancement [40], in keeping with the objective of the paper.
The PM application followed four phases: (1) log preparation, (2) process discovery, (3) performance assessment, and (4) criticality evaluation.
- Log preparation. The main input to PM is a process log, i.e., a sequential list of the process events, automatically generated by the IS supporting the business process under exam. The data attributes that characterize an event log are typically scattered across the process database. Hence, to reconstruct the freight export event log, we explored the PCS dataset to select the most appropriate attributes by following the indications from the panel of experts. Table 3 briefly describes the selected data attributes and provides and a justification for including them in the log.
The International Maritime Organization (IMO) number alone is not sufficient for identifying a process instance unambiguously, because, in a given time window, a vessel may pass through the port more than one time. This occurrence would assign to a single case some events that actually refer to different cases, generating misleading process overlaps. Instead, cross-checking IMO number against Route drastically reduces this issue. The few recurring IMO-Route couples were manually differentiated within the log for distinguishing the different process instances completely. The five selected attributes in Table 4 were both necessary and sufficient to identify the process instances for conducting the process performance analysis through PM [26]. The event log was further refined by removing incomplete events and partial cases, which results in 808 complete cases (i.e., vessels), 736 variants, and 194,518 events.
- 2.
- Process discovery. To elicit the information flow time frame, it is necessary to extract the actual process blueprint of the freight export process—which usually differs from the de jure model [26]—through a typical, automatic PM activity, called “process discovery”. We calculated the Complexity Index (CI) proposed by [44] to select the most appropriate process discovery algorithm. The CI of our log is μ = (total of unique traces)/(total of cases) = 736/808 = 0.91. Such an evidence highlights that less than one export case out of ten follows the theoretical process flow precisely, suggesting that the export process is low-structured. Hence, we adopted the Fuzzy Miner algorithm, because it “is able to clean up a large amount of confusing behavior, and to infer and extract structure from what is chaotic” [45] (p. 341). We conducted the process discovery through Disco® 2.1.0—a PM software that is based on the Fuzzy Miner. The output from this phase was the de facto model, i.e., the business blueprint illustrating the actual freight export process executed by the PCS. In this model, the activities were represented as boxes that are connected by arcs.
- 3.
- Performance assessment. Drawing from the timestamps, Disco® automatically calculates time and frequency performances and includes analytics functionalities supporting the analysis of the results. The outcome from this assessment was an overview of such performances for every activity and arc.
- 4.
- Criticality evaluation. We drew from the Project Management stream, where the risk of an event is quantified as the product between its probability of occurrence and its impact, to understand whether the time performance of an arc or activity may be an information flow inefficiency [46]. Similarly, we developed a Criticality Index (CrI) = (absolute frequency) (mean time length), measured in days. Absolute frequency is the total amount of occurrences across all 808 cases, while the mean time length is the mean time frame out of all the occurrences. The CrI expresses the cumulative time duration of an arc/activity across all their occurrences in all the cases, allowing for a more objective evaluation of the impact that the time performance of an arc/activity may exert on the export time length.
We considered an arc/activity relevant to the export time performance if CrI ≥ 0.01 (export mean time) (total of cases). A CrI was critical if it exceeded 1% of the export cumulative time frame, since the product between export mean time and total of cases is the cumulative time length of the export process. The threshold was set jointly with the panel through a sensitivity analysis to detect not only the most evident criticalities but also the moderate ones, and for analyzing a more comprehensive overview of the potential weaknesses in the export process.
Seven CrIs, corresponding to seven arcs, exceeded the threshold. Along with the PA, they were deepened for figuring out whether they corresponded to an actual delay in the export information flow. Four of them emerged as weak points of the export process, and a draft of solution for fixing them was proposed.
4. Findings
This section expounds the results that stem from the PM application. Figure 2 displays the approximate case duration, expressed in days, related to the number of cases. Globally, the 808 process instances involved 50 FFs, 10 Maritime Agencies, and five Terminals. About 95% of the cases show a time length within the 0.82–14.3 [days] range. The highest frequency of case occurrence (44) corresponds to a 6.2 days duration. The red vertical line marks the mean case duration (7.9 days) within the distribution. Therefore, an arc/activity is critical if it shows a CrI ≥ 0.01 7.9 days 808 = 63.8 days.
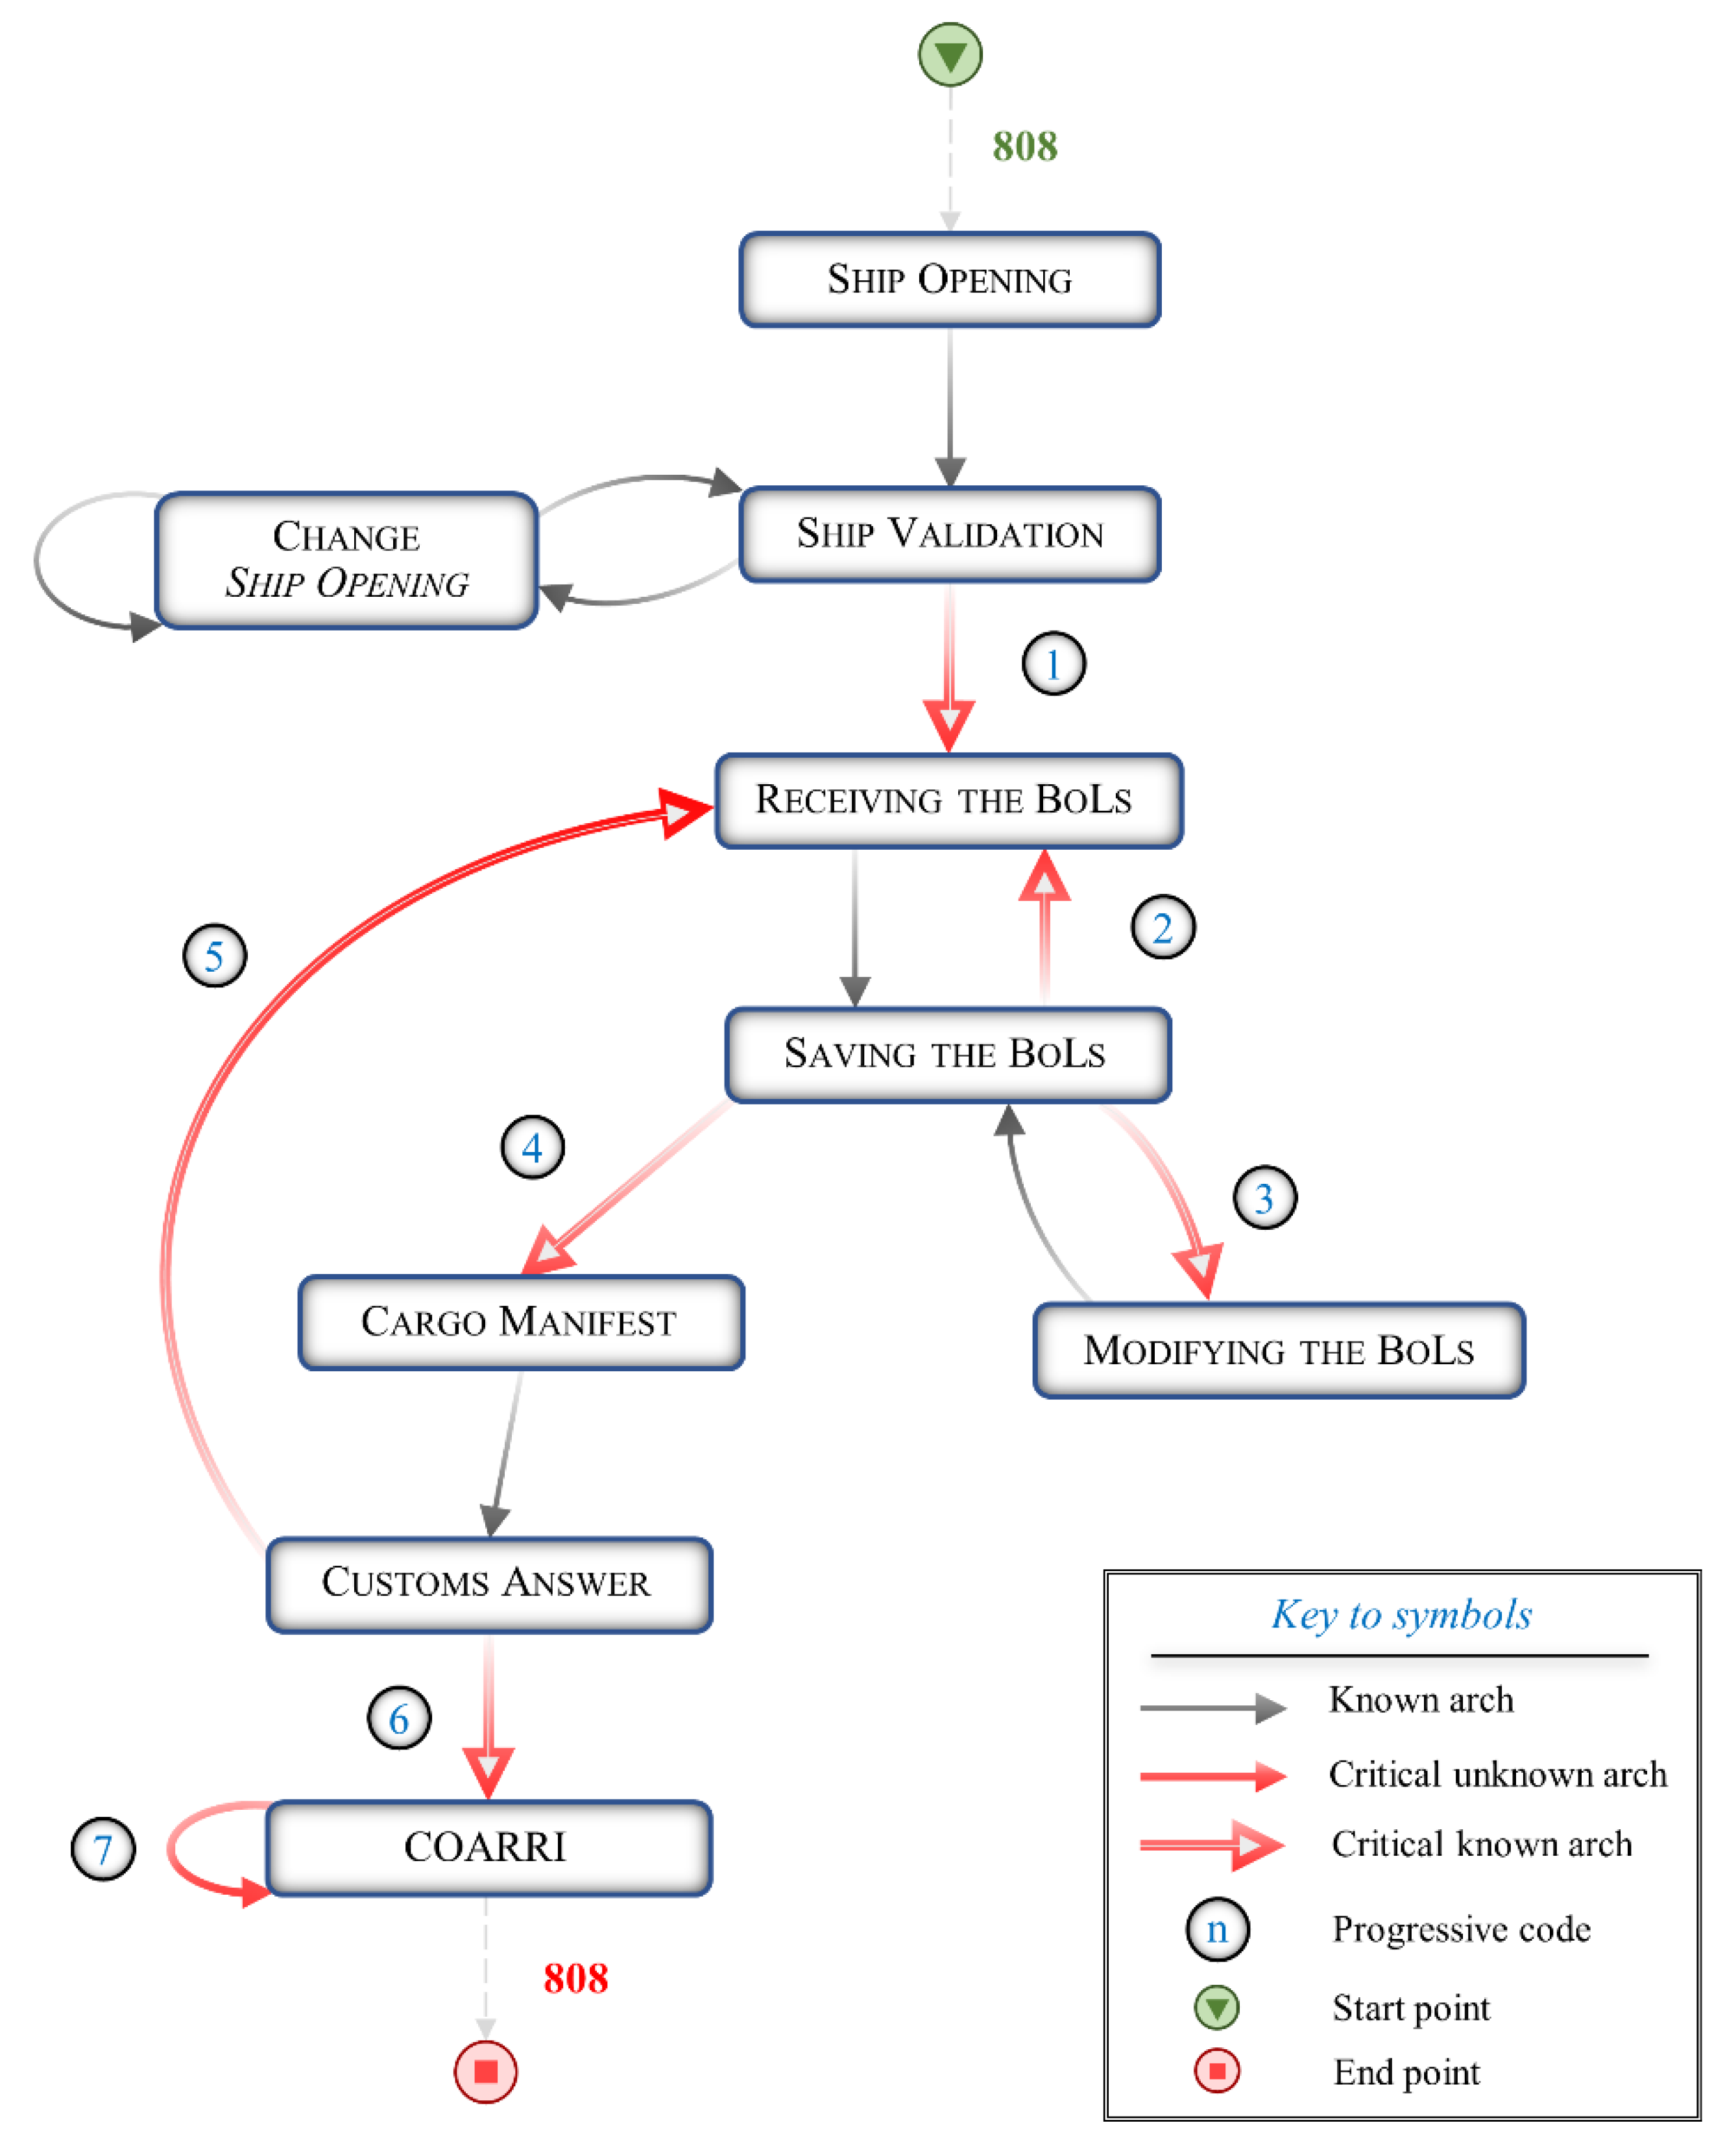
The de facto model is shown in Figure A1 in Appendix A. Start and Complete were merged into single activities, since the time length between the beginning and the end of all the activities is of the order of milliseconds. Figure A1 encompasses 48 arcs, nine of which were a loop on the 9 activities of the de jure model, e.g., an arc going from Ship Validation to Ship Validation again. Six arcs out of the 48 occurred only one time in the whole dataset, and they were considered as outliers to overlook. The Fuzzy miner algorithm that we exploited grants different levels of aggregation and abstraction [45], which can be shown in Disco® by setting the desired ratio of arcs and activities to display. Figure A1 was generated by maximizing the percentage of shown arcs and activities. We developed a streamlined version of the de facto model to improve both readibility and understandability of the model and to focus mostly on those arcs whose CrI surpasses the threshold, and given the low quality of the image in output from Disco® (Figure 3). Figure 3 does not show those arcs that are neither critical according to the CrI nor included within the de jure model to avoid graphical overburdening (Figure 1).
The number (808) near the start and the end points highlights that all of the considered process instances started with Ship Opening and ended with COARRI. The process map contains all of the arcs shown in the de jure model (Figure 1). The seven dark-gray arrows depict the arcs that were included in the de jure model and that, based on the CrI, are not critical to the export time performance. Arrow 7 is an unforeseen arc, not included in the de jure model and discovered by PM, that is critical. Arrows 1–6 are arcs belonging to the de jure model and that are also critical.
Table 4 displays frequency information about the nine activities. Absolute frequency is the total number of occurrences, while Relative frequency is the absolute frequency out of the total number of occurrences of all the activities. Time data were omitted, because the time length of all the activities was found to be nearly instantaneous and, thus, their CrI was negligible. Table 5 specifies the distribution of the vessels according to the five container vessel classes by [47]. The classes distinguish the vessels by considering their dimension (in meters), their capacity (in Twenty-foot Equivalent Units, TEUs, i.e., containers), and the distribution of the containers on, below, and across deck. Over four-fifths of the vessels belong to class A, i.e., small ships whose capacity, generally, does not exceed 2500 TEUs.
On the basis of Table 4, it is possible to note that each vessel may account for about 100 BoLs. By crossing the data in Table 4 and Table 5, we can state that, on average, most of the BoLs regard small containerships and, given their limited capacity, it highlights that the average number of BoLs per vessel may not be acceptable and may correspond to a little efficient information exchange among the FFs, the PCS, and the Terminals.
Table 6 contains some fundamental details regarding the seven critical arcs, divided into general information (first two columns), frequency data (third, fourth, and fifth column), and time information (the remaining five columns). It is worth stressing that ostensible inconsistencies among the absolute frequencies in Table 5 and Table 6 are due to our choice to lighten the development of this section by avoiding reporting the frequency and time metrics of all 48 arcs in Figure A1. The analyzed data and the information contained in such tables both account for the behavior of the whole event log and the pertinent discussion was developed accordingly.
The time data (last five columns in Table 6) have a different meaning when referring to an activity or to an arc. When referring to an activity, they point out the time that is needed by the PCS to execute the activity. When related to an arc, they express the time between the end of an activity and before the start of another one, i.e., the idle time of the PCS between two activities belonging to the same process instance. Hence, the mean time of an arc does not correspond to an interruption in the export process. Instead, it shows that the information flow concerning a specific case is on hold: the export process may be still on-going, within the PCS by other process instances or outside the PCS by physical activities, such as materials handling. Thus, the time length of an arc is squandered time that extends the export time length and it increases the average cost that a port sustains for managing a berthed vessel.
The next section discusses the above results and deepens the seven critical arcs.
5. Discussion
This section is divided into seven parts (5.1–5.7), whose progressive number is consistent with the progressive code of the arcs in Figure 3 and Table 6. In each of them, one of the seven critical arcs is deepened for figuring out whether it is an actual inefficiency.
5.1. Arc 1—From Ship Validation to Receiving the BoLs
This arc marks the transition of the export process from the introductive activities (ship opening and validation) to the BoL process, which involves both the FFs and the Terminals (see Figure 1). Its CrI (1128) is high, mostly because of the 33.3 h mean time length. The median is 7 h only, while the maximum and minimum time frames are 22 days and 3.4 min., respectively. These evidences suggest that some process instances show an idle time between Ship Validation and the reception of the first BoL that is much higher than the average one.
There is not a formal rule that establishes the maximum time window between the opening of a ship and the start of the BoL process. According to the PA, all of the activities concerning ship opening and validation can start some days before the berthing of the ship to allow for the port to know the vessel traffic ahead of time. Instead, once the vessel has been validated, the receiving of the BoLs starts when an FF, which has visibility about the ship validation, sends the pertinent information to the PCS. Hence, although any reduction in the cumulated time frame of Arc 1 can improve the overall time performance of the export information flow, the duration of Arc 1 should not be considered to be a delay: this time length is due to the flexible policy of the PA.
A possible solution for increasing the control over the idle time of Arc 1 may be to set a limit for opening the ship before the estimated arrival of the vessel, e.g., one week. Nonetheless, the resulting lower export average time would be misleading, because it would be due to the postponement of an activity. This solution would not imply any improvement in the export efficiency, even though it would make the overall export time measurements more objective.
Thus, Arc 1 is not an actual inefficiency, but its occurrence raises concerns regarding the reliability of the measurement of the overall export mean time by the PA. For clarifying this issue, Figure 4 shows a simplified, compact version of the de facto model and specifies some of the most relevant mean time lengths.
Arc 1 decouples the initial activities—Ship Opening, Change Ship Opening, Ship Validation—from the remaining ones—from Receiving the BoLs to COARRI. Therefore, its mean time (1.4 days) is a buffer that splits the export process in two parts. The mean value of the time buffer, which is due to a PA policy, accounts for 1.4 d/7.9 d = 17.7% of the export mean time.
When evaluating the export mean time (7.9 days), the PA should consider that such a measurement is negatively affected by Arc 1, which introduces a strong and undesirable variance, and that the core of the export process—from Receiving the BoLs to COARRI—lasts 6.3 days, on average. This finding underlines an issue regarding the control and monitoring of the process and suggests that the design of the time performance indicators should be partly revised.
5.2. Arc 2—From Saving the BoLs to Receiving the BoLs
Among the critical arcs, Arc 2 shows the highest absolute frequency (37,862) and total duration (94.2 months). Such numbers are high, since each Cargo Manifest is built incrementally drawing from the BoLs, and the number of the BoLs is high because the amount of different goods to be exported is large. Given a vessel, the FFs do not send the BoLs all together to the PCS, but they submit them progressively. The first BoLs are saved, and the further ones are gradually sent and saved generating new occurrences of Saving the BoLs and Receiving the BoLs. The loop between these two activities is necessary for satisfying all of the export requests by the FFs and for enabling the creation of the Cargo Manifest.
As depicted in Figure 1, Arc 2 marks a change in the main stakeholder that is involved in the information flow: while Saving the BoLs is the saving of one or more BoLs from the PCS in the Information System of a Terminal, Receiving the BoLs consists in a FF sending one or more BoLs to the PCS. According to the PA, the main cause of the repeated transitions from Saving the BoLs to Receiving the BoLs is the lack of coordination between FFs and their customers. This lack results in a very frequent and fragmented submission of the BoLs.
A higher absolute frequency of BoL submission likely entails more frequent loops in the BoL process, i.e., higher absolute frequency of Arc 2, and then a higher cumulated idle time. It might be possible to reduce the submission frequency by narrowing the Closing Time, after which additional BoLs for a given vessel are no longer accepted by the PCS. Yet, the Closing Time mostly affects the available time window for submitting the BoLs, and the absolute frequency of the submission to a lesser extent only. Instead, improving the coordination among the FFs and their customers might lead to a more efficient data exchange and to a faster and less fragmented BoL submission.
5.3. Arc 3—From Saving the BoLs to Modifying the BoLs
The case frequency of Arc 3 is 524, which means that the request for changes in one or more BoL records occurs in almost 65% of the process instances, at least. The need for such changes usually emerges when an FF or a Terminal identifies any mistake in one or more BoLs, or when the customs require modifying the Cargo Manifest. In the latter case, it is necessary to return to the start of the BoL process, as suggested by the de jure model (Figure 1).
The idle time corresponding to Arc 3 is critical because of both its mean time and its absolute frequency. Almost one hour passes after Saving the BoLs and before Modifying the BoLs, and this transition occurs almost five times per case, on average. The PA claimed that the high request for time-consuming changes in the BoLs is mostly due to human errors in data entry. If the ratio of wrong BoLs is lower, the whole BoL process would be smoother, with an additional possible reduction of the frequency of the loops from Customs Answer (see Figure 1) and an improvement in the export overall time performance.
5.4. Arc 4—FRom Saving the BoLs to Cargo Manifest
A Cargo Manifest is created in the PCS by combining all of the pertinent BoLs sent from the forwarders. The average time length of Arc 4 is 3.8 h and the absolute frequency is 2496. These time and frequency are too high for a document procedure that is strongly automated (e.g., the related data are unified and stored within the PCS database) and that does not involve decision gates. The median time is 26 min. only, which suggests that several occurrences were slowed in an inefficient transition from the BoL process to the submission of the Cargo Manifest to the customs.
The main cause for this issue is likely linked to those process instances that involve multiple occurrences of Arc 4. In these cases, an updated version of the manifest is submitted on the basis of additional BoLs being sent to the PCS before the Closing Time, but after the previous manifest submission. Hence, the submission of the Cargo Manifest is strongly affected by the inefficient BoL process, which entails further delays on the activities downstream. Consequently, a streamlined BoL process may reduce the absolute frequency of Arc 4 and its time frame too, since the Cargo Manifest may be built and submitted faster and with less mistakes, with a positive effect on the export time performance.
5.5. Arc 5—From Customs Answer to Receiving the BoLs
The case frequency of Arc 5—522 cases out of 808—points out that, after receiving the customs answer about the Cargo Manifest, almost two-thirds of the process instances return to the BoL process. There are two main reasons for this feedback: a negative outcome from the customs, or human errors in managing the information flow. In the first case, it is needed to modify the manifest by starting from the BoL process and to submit it again to the customs. In the second case, the users of the PCS go back to Receiving the BoLs by oversight or because they want to add new BoLs, which generates dummy occurrences in the BoL process.
Moreover, Arc 5 shows an absolute frequency that is equal to 1675—over three occurrences per case. Ideally, this frequency should be 0, corresponding to a completely exhaustive BoL process that leads to a flawless Cargo Manifest. Instead, the cumulated idle time surpasses 27 weeks: it is a consequence of a low-performing management of the upstream information flow, and its reduction might enhance the efficiency of the export process.
5.6. Arc 6—from Customs Answer to COARRI
On the basis of the CrI, Arc 6 is the second most critical one, since it shows the highest mean time length (39.1 h) among the arcs of the de jure model. Yet, the transition from Customs Answer to COARRI hides the physical handling of the goods from the warehouses and from the quays to the vessel. In fact, a positive answer from the customs authorizes the cargo loading on the ship, while the COARRI certifies that the loading is complete. The physical flow and its time length are out of the scope of this manuscript, which focuses on the information one. Consequently, the time frame of Arc 6 cannot be considered to be a delay or an inefficiency in the export information flow.
5.7. Arc 7—Loop on COARRI
The case frequency of Arc 7—806 out of 808—prompts that almost all of the cases need for iteration on COARRI, which accounts for the absolute frequency of the COARRI activity (1728). Although Arc 7 is not present in the de jure model (Figure 1), it facilitates the management of the information flow by the Terminals: when the number of BoL records for a single vessel is high, the Terminal can send one or more intermediate COARRIs that incrementally build the final COARRI. Thus, Arc 7 should be considered as a desirable process deviation [26].
In the port under analysis, the COARRI is sent to the PCS immediately after the departure of the ship and not when the loading of the goods on the ship is completed. The average time length of Arc 7 is linked to the physical logistics activities and not to any delays or inefficiencies in the information flow. Therefore, the last occurrence of Arc 7 within a case determines the end of the export process instance since the duration of COARRI is almost instantaneous.
6. Implications Based on the Experimental Outcomes
This section is divided in two parts: the first one (6.1) proposes a draft of solution to the inefficiencies discussed in Section 5; and, the second one (6.2) outlines the managerial implications.
6.1. A Draft of Solutions
In the previous section, we singled out four arcs, among the seven selected ones, which correspond to actual inefficiencies in the overall export time length. This section is an attempt to provide a draft of solution to such inefficiencies. Table 7 summarizes the findings about the seven arcs.
Among the four inefficiencies in Table 7, arcs 2–5 are critical known arcs that exhibit a shared cause: heterogeneous issues that are linked to the BoL process. The inefficiencies related to Arc 2 are due to the lack of effective coordination among port stakeholders, which may be solved by improving the information sharing between FFs and port customers. For instance, the FFs should try to gather all the BoLs from the customers and submit them to the PCS as soon as possible. Even though this would not affect the export mean time directly, a lower absolute frequency of Arc 2 might reduce the frequency of Arc 5 in those cases in which Arc 5 occurs for adding further BoLs. Thus, such a solution might yield an indirect reduction of the overall time performance.
The inefficiencies concerning Arc 3 are mainly caused by the excessive frequency of this arc. Most occurrences of Arc 3 are linked to a high ratio of human errors by the FFs in entering the BoLs data. The high request for changes in the BoL records can also be a source of dummy occurrences of events and activities that do not correspond to any update in the data. Even though the additional dummy occurrences do not affect the time metrics, they make the interpretation of event data harder. A possible way to cope with such an issue may be to revise the data entry controls, since the PCS currently only requires single data entry. A possible intervention might be to implement double-key entering, which performs better than single-key entering and equally to more advanced controls, such as Optical Mark Recognition [48].
The cases that include multiple low-performing occurrences of Arc 4 may benefit from the above-mentioned solutions, because these occurrences often entail the update of the Cargo Manifest with new BoLs after the submission of the previous version of the manifest to the customs. Thus, since Arc 4 links the BoL process to the customs activities (Cargo Manifest and Customs Answer), every effort in streamlining the BoL process might reduce the number of low-performing occurrences of Arc 4 downstream.
Finally, according to the panel, the inefficiencies that are linked to Arc 5 are mostly the aftermath of other upstream inefficiencies within the BoL process. Hence, a possible solution may be intervening on the PCS to allow the users to return to the BoL process after sending the Cargo Manifest if and only if the customs require to do so.
The proposed draft of solutions may affect both waiting time and vessel turnaround, reducing the corresponding daily costs, and it may ultimately enable improvements in the overall export time performance, leading to higher vessel throughput per year.
6.2. Managerial Implications
The ISs that support maritime transportation processes, e.g., the PCSs, are akin to data-intensive workflow systems. Freight vessels can transport thousands of containers, and the corresponding stream of event data contains a wealth of information that can be used for several process-related purposes.
By drawing from such event data in our case, PM proved its usefulness in supporting the decision making regarding improving both the process efficiency and the process control and monitoring. From the process efficiency standpoint, PM allowed to identify four inefficiencies that may pave the way for two kinds of intervention. The first one concerns the business process management area and it consists in replacing the de jure model with the de facto one [26]. Alternatively, the de jure model may be slightly modified in line with some selected evidences from the de facto one. Any modification in the de jure model corresponds to a business process re-engineering activity, whose scope depends on the number and on seriousness of the inefficiencies.
The second kind of intervention is consistent with the previous one and it concerns the management information systems area. It requires modifying the IS by forbidding some shortcuts that may lead to deadlock, anomalies, or overlaps among process instance. This solution should not result in introducing an extensive number of constraints within the system, since they may jeopardize the flexibility of the process. Instead, it should consist in setting few, selected boundaries to the IS process flow for coping with the main inefficiencies in a sharp way.
Both of these classes of solutions should consider that port ISs are often inter-organizational in nature [15]. Any intervention may affect the interfaces among different stakeholders (e.g., Arc 2). Thus, inter- and intra-organizational integration efforts should not be neglected in trying to overcome the detected inefficiencies [49,50].
PM enabled more reliable and punctual measurements of the process time performances from a process control and monitoring standpoint—a benefit that is not directly related to the interventions on the low-performing arcs. As the time data in the event log are a transparent evidence of the actual behavior of the IS, they are the basis for a more structured overview about time performances that may lead to revising the performance indicators. For instance, in line with the results regarding Arc 1, the overall mean time length of a process might conceal those arcs or activities whose time frame may seem acceptable, but that may overestimate the time needed for executing the process. Thus, it may be useful to introduce additional indicators, such as the mean time frame of the main subprocesses belonging to the process under analysis. Examples of subprocesses to consider may be the one going from Receiving the BoLs to COARRI and the one encompassing Ship Opening, Change Ship Opening, and Ship Validation (Figure 4).
The comparisons of these indicators to the overall time performance of the whole process allow for singling out the misleading time buffers (e.g., Arc 1), which enables more objective and precise evaluations from a benchmarking perspective. The latter aspect concerns both an internal perspective—juxtaposing the current performance to the previous ones and attempting to refine the extant best practices in line with the PM evidences—and an external one—comparing port competitiveness to the one of the other ports.
The PA has favourably welcomed the PM application and the draft of solutions to the extent that has entrusted its innovation center—the business function in charge of research and development activities—to deepen both the PM capabilities and the potential exploitation of further analytics, e.g., machine learning. Under the light of the presented evidences, the PA has recognized that its knowledge about, and control over, the time and frequency metrics of the port processes must be improved. Additionally, it claimed that the potential enhancements in the efficiency of the export information flow are an unexpected soure of time—and cost—saving that they did not consider. Hence, based on the analytics capabilities, it developed the following action plan:
- to improve the information exchange with the Information and Communication Technology firm that manages the PCS about the performances of the PCS-supported business processes;
- to further probe feasibility and scope of the proposed draft of solutions;
- to develop best practices for the whole port community, considering the operational needs of all the main kinds of stakeholder and discussing them in ad hoc port community meetings;
- to create an incentive plan to deter opportunistic behaviours by the port stakeholders, e.g., late submission of the BoLs by the FFs;
- to revise the time performance indicators system (cf. Section 5.1) and to better assess the impact of the information exchange time performances on the import and export cost structure; and,
- to systematically harness business analytics (e.g., PM) to make business processes time and frequency performance measurements more objective and to analyze the root causes of inefficiencies more in depth.
The development of such changes has been framed within a more extensive strategic plan, which should start in the beginning of the next year.
7. Conclusions
In this paper, we applied PM to the PCS-managed freight export process of a mid-sized Mediterranean port. We analyzed seven months of real-life export data to enable improvements in the efficiency of the transportation document and data management. Leveraging the Criticality Index we developed, the following main evidences about the export process were obtained:
- the de facto model;
- all the main time and frequency metrics—data which the PA was not aware of;
- four inefficiencies in the export process flow; and,
- a process issue that can jeopardize the reliability of the overall time performance measurements.
We proposed a draft of solutions for coping with both the inefficiencies and the additional process issue. At the same time, we explained how PM may support the decision-making regarding improvements in both process efficiency and process control and monitoring. The purpose of the case study was to present an in-depth overview of the application of analytics for enabling the above-mentioned improvements. Thus, the outcomes might not form a strong basis for scientific generalization [41], which should need for more extensive research involving multiple case studies, but they might be applied to other similar contexts since, besides distinct specializations, port main business processes present commonalities, even when the ports are in different geographic areas or manage different throughput volumes.
Nevertheless, our results show that the current digitalization trend and the wider data availability in port contexts strengthen the capabilities of the analytics, such as PM, which can be exploited for deep and partly automatable analyses of process data. In addition, the exploitation of analytics in multi-stakeholder contexts, e.g., the port one, might allow for identifying process inefficiencies or other issues that are caused by the behavior of a specific kind of stakeholder. Despite this, fixing such inefficiencies may require to involve multiple parties (e.g., the FFs, the terminal, and customers in Arc 2) to avoid local optimums in proposing solutions.
Furthermore, this manuscript provides three scientific contributions:
- It provides an empirical answer to the call for higher efficiency in port operations [2]. The lower mean export duration potentially achievable through the solutions that we proposed may enable a reduction in the average cost that a port sustains for managing a berthed vessel, increasing the ships’ turnover and, consequently, the number of served port customers.
- It satisfies the need, as underlined by [13], to investigate quantitative approaches for maritime logistics and freight transport systems. PM allows to make decisions through a quantitative, data-driven approach that, by diverging from the classic operations-research-based ones, may affect port efficiency without the need to formulate any optimization problem. Such an approach fulfills a fact-based, analytics-supported decision making characterized by high objectivity and granularity. The increased objectivity in evaluating the time and frequency performances and the actual process flow may provide clearer inputs to the decision-making process (e.g., to decide how to intervene on the export process to improve its efficiency), increasing the decision quality [51], which, in turn, may lead to better overall performances [52,53], e.g., greater port efficiency and sustainability [22,54].
Additionally, we focused on the analytics-based analysis and streamlining of the information flow, which is quite less explored than the physical one in port operations literature, offering an alternative to the classic approaches to the improvement of port performance. In addition, PM considers a constant comparison between analytical information (e.g., time metrics) and graphical information (e.g., the de facto model). This integrated perspective might foster the understanding and the interpretation of the decision-making outcomes [55], outdoing any gut-feeling approach in terms of attainable support [56].
- 3.
- It presents an extensive, extremely focused evidence of analytics-enabled process enhancement that reflects the actual complexity of a real-life process. Although it has been widely argued that PM may improve business processes, there is a dearth of comprehensive evidences regarding its application for such an objective, which has been tackled in literature at a lower level of detail only, and for other purposes, e.g., [57].
From a managerial perspective, the outcomes from the PM application specify a draft of possible interventions for improving the freight export process efficiency and control. Such solutions concern the process flow within the PCS and the process design, on one side, and the design of performance indicators, on the other side. The PM approach that we followed for enabling these interventions is suitable for implementing a real- or near-real time management dashboard for port operations, fueled by process data, which may be useful in different ways. For instance, it may allow for monitoring the time and frequency performances of the process under analysis in a more transparent and punctual way, quickly pointing out any inefficiency. By selecting a process perspective [26], a decision maker may check which on-going process instance is late, adopting the most appropriate and immediate countermeasures for recovering the delay. Additionally, by cross-checking the time indicators (see Section 6.2), the management dashboard may facilitate the identification of those process criticalities that may need for a business process re-engineering effort. Finally, the streamlined information sharing that was enabled by the analytics may also facilitate port sustainability investments and may improve the profits for both port and carriers [54].
This work is not free from limitations. First, the event data were mostly analyzed through the lens of the PA, and this might lead to a less holistic interpretation of the evidences. Instead, the PCS serves a port community that consists of several stakeholders, whose objectives and performance measures may be different and not aligned with each other. Second, we enabled the attainment of better export time performances, but we did not evaluate the actual impact of the proposed solutions on the export time frame because it was out of the scope of this paper. Additionally, the feasibility of the proposed solutions should be further investigated. Other port stakeholders should be involved in refining the proposed draft of solutions or in developing new ones. Although the PA continuously communicates with the other actors of the port community in three ways (one-to-one direct communication, one-to-many communication during port community meetings, and indirectly through the firm that manages the PCS maintenance tickets), their more direct involvement may lead to sharper action plans.
Thus, further research might investigate the effect of the PM approach on port time indicators and on the related costs, within a structured management dashboard. Another opportunity may be to deepen the PM-based prediction of process indicators in running cases to adopt proactive actions for real-time risk mitigation, e.g., [58]. Finally, the kinds of above-discussed support allow for framing PM as a data-driven tool that may be integrated within a structured DSS, such as a Knowledge Management-based DSS or an Intelligent DSS [59].
Author Contributions
Conceptualization, P.Z., D.A., R.D. and V.M.; Methodology, P.Z., D.A., R.D. and V.M.; Formal Analysis, P.Z., D.A., R.D. and V.M.; Investigation, P.Z., D.A., R.D. and V.M.; Data Curation, P.Z., D.A., R.D. and V.M.; Writing – Original Draft Preparation, P.Z., D.A., R.D. and V.M.; Writing – Review & Editing, P.Z., D.A., R.D. and V.M.; Supervision, P.Z., D.A., R.D. and V.M.
Funding
This research received no external funding.
Conflicts of Interest
The authors declare no conflict of interest.
Appendix A
Figure A1.
The de facto model of the export process.

References
- Heilig, L.; Voß, S. Inter-terminal transportation: An annotated bibliography and research agenda. Flex. Serv. Manuf. J. 2017, 29, 35–63. [Google Scholar] [CrossRef]
- Meersman, H.; van de Voorde, E.; Vanelslander, T. Port competitiveness now and in the future: What are the issues and challenges? Res. Transp. Bus. Manag. 2016, 19, 1–3. [Google Scholar] [CrossRef]
- Lee, P.T.-W.; Kwon, O.K.; Ruan, X. Sustainability challenges in maritime transport and logistics industry and its way ahead. Sustainability 2019, 11, 1331. [Google Scholar] [CrossRef]
- Gandomi, A.; Haider, M. Beyond the hype: Big data concepts, methods, and analytics. Int. J. Inf. Manag. 2015, 35, 137–144. [Google Scholar] [CrossRef] [Green Version]
- Vera-Baquero, A.; Colomo-Palacios, R.; Molloy, O. Real-time business activity monitoring and analysis of process performance on big-data domains. Telemat. Inform. 2016, 33, 793–807. [Google Scholar] [CrossRef]
- Božič, K.; Dimovski, V. Business intelligence and analytics for value creation: The role of absorptive capacity. Int. J. Inf. Manag. 2019, 46, 93–103. [Google Scholar] [CrossRef]
- Lismont, J.; Vanthienen, J.; Baesens, B.; Lemahieu, W. Defining analytics maturity indicators: A survey approach. Int. J. Inf. Manag. 2017, 37, 114–124. [Google Scholar] [CrossRef] [Green Version]
- Larson, D.; Chang, V. A review and future direction of agile, business intelligence, analytics and data science. Int. J. Inf. Manag. 2016, 36, 700–710. [Google Scholar] [CrossRef]
- Akter, S.; Bandara, R.; Hani, U.; Fosso Wamba, S.; Foropon, C.; Papadopoulos, T. Analytics-based decision-making for service systems: A qualitative study and agenda for future research. Int. J. Inf. Manag. 2019, 48, 85–95. [Google Scholar] [CrossRef]
- Hopkins, J.; Hawking, P. Big Data Analytics and IoT in logistics: A case study. Int. J. Logist. Manag. 2018, 29, 575–591. [Google Scholar] [CrossRef]
- Queiroz, M.M.; Telles, R. Big data analytics in supply chain and logistics: An empirical approach. Int. J. Logist. Manag. 2018, 29, 767–783. [Google Scholar] [CrossRef]
- Kia, M.; Shayan, E.; Ghotb, F. The importance of information technology in port terminal operations. Int. J. Phys. Distrib. Logist. Manag. 2000, 30, 331–344. [Google Scholar] [CrossRef] [Green Version]
- Chew, E.P.; Christiansen, M.; Günther, H.O.; Kim, K.H.; Kopfer, H. Logistics and maritime systems. Flex. Serv. Manuf. J. 2015, 27, 135–138. [Google Scholar] [CrossRef]
- Heilig, L.; Voß, S. Information systems in seaports: A categorization and overview. Inf. Technol. Manag. 2017, 18, 179–201. [Google Scholar] [CrossRef]
- Lambrou, M.A.; Rødseth, Ø.J.; Foster, H.; Fjørtoft, K. Service-oriented computing and model-driven development as enablers of port information systems: An integrated view. WMU J. Marit. Aff. 2013, 12, 41–61. [Google Scholar] [CrossRef]
- Laursen, G.H.N.; Thorlund, J. Business Analytics for Managers: Taking Business Intelligence Beyond Reporting, 2nd ed.; John Wiley & Sons, Inc.: Hoboken, NJ, USA, 2016. [Google Scholar]
- Ashrafi, A.; Zare Ravasan, A.; Trkman, P.; Afshari, S. The role of business analytics capabilities in bolstering firms’ agility and performance. Int. J. Inf. Manag. 2019, 47, 1–15. [Google Scholar] [CrossRef]
- Bichou, K.; Gray, R. A logistics and supply chain management approach to port performance measurement. Marit. Policy Manag. 2004, 31, 47–67. [Google Scholar] [CrossRef]
- Stahlbock, R.; Voß, S. Operations research at container terminals: A literature update. OR Spectr. 2008, 30, 1–52. [Google Scholar] [CrossRef]
- Steenken, D.; Voß, S.; Stahlbock, R. Container terminal operation and operations research—A classification and literature review. OR Spectr. 2004, 26, 3–49. [Google Scholar]
- Aydogdu, Y.V.; Aksoy, S. A study on quantitative benefits of port community systems. Marit. Policy Manag. 2015, 42, 1–10. [Google Scholar] [CrossRef]
- Michaelides, M.P.; Herodotou, H.; Lind, M.; Watson, R.T. Port-2-Port Communication Enhancing Short Sea Shipping Performance: The Case Study of Cyprus and the Eastern Mediterranean. Sustainability 2019, 11, 1912. [Google Scholar] [CrossRef]
- Cheng, T.C.E.; Farahani, R.Z.; Lai, K.-H.; Sarkis, J. Sustainability in maritime supply chains: Challenges and opportunities for theory and practice. Transp. Res. Part E Logist. Transp. Rev. 2015, 78, 1–92. [Google Scholar] [CrossRef]
- Bartolacci, M.R.; LeBlanc, L.J.; Kayikci, Y.; Grossman, T.A. Optimization Modeling for Logistics: Options and Implementations. J. Bus. Logist. 2012, 33, 118–127. [Google Scholar] [CrossRef]
- Stahlbock, R.; Voß, S. Vehicle routing problems and container terminal operations—An update of research. Oper. Res. Comput. Sci. Interfaces Ser. 2008, 43, 551–589. [Google Scholar]
- van der Aalst, W.M.P. Process Mining: Data Science in Action, 2nd ed.; Springer: Berlin, Heidelberg, 2016; ISBN 9783662498514 | 9783662498507. [Google Scholar]
- Heilig, L.; Lalla-Ruiz, E.; Voß, S. Digital transformation in maritime ports: Analysis and a game theoretic framework. NETNOMICS Econ. Res. Electron. Netw. 2017, 18, 227–254. [Google Scholar] [CrossRef]
- PORTEL. Inventory of Port Single Windows and Port Community Systems, 2009. Available online: http://eutravelproject.eu/knowledge/DownloadFile.aspx?tableName=tblSubjectArticles&field=PDF%20Filename&idField=subjectArticleID&id=231 (accessed on 16 August 2019).
- van Baalen, P.; Zuidwijk, R.; Van Nunen, J. Port Inter-Organizational Information Systems: Capabilities to Service Global Supply Chains. Found. Trends Technol. Inf. Oper. Manag. 2008, 2, 81–241. [Google Scholar] [CrossRef]
- IPCSA. Port Community Systems. Available online: http://www.ipcsa.international/pcs (accessed on 20 April 2017).
- Carlan, V.; Sys, C.; Vanelslander, T. How port community systems can contribute to port competitiveness: Developing a cost-benefit framework. Res. Transp. Bus. Manag. 2016, 19, 51–64. [Google Scholar] [CrossRef]
- Kim, S.; Kim, H.; Park, Y. Early detection of vessel delays using combined historical and real-time information. J. Oper. Res. Soc. 2017, 68, 182–191. [Google Scholar] [CrossRef]
- Ha, M.-H.; Yang, Z.; Notteboom, T.; Ng, A.K.Y.; Heo, M.-W. Revisiting port performance measurement: A hybrid multistakeholder framework for the modelling of port performance indicators. Transp. Res. Part E 2017, 103, 1–16. [Google Scholar] [CrossRef]
- Wasesa, M.; Stam, A.; van Heck, E. The seaport service rate prediction system: Using drayage truck trajectory data to predict seaport service rates. Decis. Support Syst. 2017, 95, 37–48. [Google Scholar] [CrossRef]
- Perera, L.P.; Mo, B. Marine engine-centered data analytics for ship performance monitoring. J. Offshore Mech. Arct. Eng. 2017, 139. [Google Scholar] [CrossRef]
- Maldonado, S.; González-Ramírez, R.G.; Quijada, F.; Ramírez-Nafarrate, A. Analytics meets port logistics: A decision support system for containerstacking operations. Decis. Support Syst. 2019, 121, 84–93. [Google Scholar] [CrossRef]
- Min, H.; Lim, Y.-K.; Park, J.-W. Supply chain analytics for enhancing the maritime security. Int. J. Logist. Syst. Manag. 2017, 28, 164–179. [Google Scholar] [CrossRef]
- Malik, A.; Maciejewski, R.; Jang, Y.; Oliveros, S.; Yang, Y.; Maule, B.; White, M.; Ebert, D.S. A visual analytics process for maritime response, resource allocation and risk assessment. Inf. Vis. 2014, 13, 93–110. [Google Scholar] [CrossRef]
- Chen, H.; Chiang, R.H.R.; Storey, V.C. Business Intelligence and Analytics: From Big Data To Big Impact. MIS Q. 2012, 36, 1165–1188. [Google Scholar] [CrossRef]
- van der Aalst, W.M.P.; Adriansyah, A.; De Medeiros, A.K.A.; Arcieri, F.; Baier, T.; Blickle, T.; Bose, J.C.; van den Brand, P.; Brandtjen, R.; Buijs, J.; et al. Process mining manifesto. In Proceedings of the International Conference on Business Process Management, Clermont-Ferrand, France, 29 August–2 September 2011; Volume 99 LNBIP, pp. 169–194. [Google Scholar]
- Yin, R.K. Case Study Research: Design and Methods, 5th ed.; SAGE Publications, Inc.: Thousand Oaks, CA, USA, 2013; ISBN 1483302008. [Google Scholar]
- Benbasat, I.; Goldstein, D.K.; Mead, M. The Case Research Strategy in Studies of Information Systems. MIS Q. 1987, 11, 369–386. [Google Scholar] [CrossRef]
- Waller, M.A.; Fawcett, S.E. Data Science, Predictive Analytics, and Big Data: A Revolution That Will Transform Supply Chain Design and Management. J. Bus. Logist. 2013, 34, 77–84. [Google Scholar] [CrossRef]
- Zerbino, P.; Aloini, D.; Dulmin, R.; Mininno, V. Process-Mining-enabled audit of Information Systems: Methodology and an application. Expert Syst. Appl. 2018, 110, 80–92. [Google Scholar] [CrossRef]
- Günther, C.W.; van der Aalst, W.M.P. Fuzzy Mining—Adaptive Process Simplification Based on Multi-perspective Metrics. In Proceedings of the Business Process Management—Lecture Notes in Computer Science, Brisbane, Australia, 24–28 September 2007; Volume 4714, pp. 328–343. [Google Scholar]
- Project Management Institute. A Guide to the Project Management Body of Knowledge (PMBOK® Guide), 6th ed.; Project Management Institute: Newtown Square, PA, USA, 2017; ISBN 1628251840. [Google Scholar]
- Brooks, M.R.; Pallis, T.; Perkins, S. Port Investment and Container Shipping Markets: Roundtable Summary and Conclusions; Organisation for Economic Co-operation and Development (OECD), International Transport Forum (ITF): Paris, France, 2014. [Google Scholar]
- Paulsen, A.; Overgaard, S.; Lauritsen, J.M. Quality of data entry using single entry, double entry and automated forms processing—An example based on a study of patient-reported outcomes. PLoS ONE 2012, 7, e35087. [Google Scholar] [CrossRef]
- Hossain, T.M.T.; Akter, S.; Kattiyapornpong, U.; Dwivedi, Y.K. Multichannel integration quality: A systematic review and agenda for future research. J. Retail. Consum. Serv. 2019, 49, 154–163. [Google Scholar] [CrossRef]
- Lai, K.H.; Wong, C.W.Y.; Cheng, T.C.E. A coordination-theoretic investigation of the impact of electronic integration on logistics performance. Inf. Manag. 2008, 45, 10–20. [Google Scholar] [CrossRef] [Green Version]
- Kahai, S.S.; Cooper, R.B. Exploring the core concepts of media richness theory: The impact of cue multiplicity and feedback immediacy on decision quality. J. Manag. Inf. Syst. 2003, 20, 263–299. [Google Scholar]
- Schryen, G. Revisiting IS business value research: What we already know, what we still need to know, and how we can get there. Eur. J. Inf. Syst. 2013, 22, 139–169. [Google Scholar] [CrossRef]
- Sharma, R.; Mithas, S.; Kankanhalli, A. Transforming decision-making processes: A research agenda for understanding the impact of business analytics on organisations. Eur. J. Inf. Syst. 2014, 23, 433–441. [Google Scholar] [CrossRef]
- Lai, X.; Tao, Y.; Wang, F.; Zou, Z. Sustainability investment in maritime supply chain with risk behavior and information sharing. Int. J. Prod. Econ. 2019, 218, 16–29. [Google Scholar] [CrossRef]
- Wixom, B.H.; Watson, H.J.; Werner, T. Developing an Enterprise Business Intelligence Capability: The Norfolk Southern Journey. MIS Q. Exec. 2011, 10, 61–71. [Google Scholar]
- LaValle, S.; Lesser, E.; Shockley, R.; Hopkins, M.S.; Kruschwitz, N. Big Data, Analytics and the Path From Insights to Value. MIT Sloan Manag. Rev. 2011, 52, 21–32. [Google Scholar]
- Senderovich, A.; Weidlich, M.; Yedidsion, L.; Gal, A.; Mandelbaum, A.; Kadish, S.; Bunnell, C.A. Conformance checking and performance improvement in scheduled processes: A queueing-network perspective. Inf. Syst. 2016, 62, 185–206. [Google Scholar] [CrossRef] [Green Version]
- Márquez-Chamorro, A.E.; Resinas, M.; Ruiz-Cortés, A.; Toro, M. Run-time prediction of business process indicators using evolutionary decision rules. Expert Syst. Appl. 2017, 87, 1–14. [Google Scholar] [CrossRef]
- Arnott, D.; Pervan, G. A critical analysis of decision support systems research. J. Inf. Technol. 2005, 20, 67–87. [Google Scholar] [CrossRef]
Figure 1.
The de jure model of the export process.

Figure 2.
Distribution of the cases.

Figure 3.
The streamlined process map from the Process Mining (PM) application.

Figure 4.
Simplified version of the de facto model.


Table 1.
Additional sources of information.
| Input | Detail |
|---|---|
| Documents | Documentation about: evolution of the PCS since its introduction; future technical improvements; How to Use guidelines; description of the freight export documents and stakeholders |
| Export process blueprint | Blueprint of the export process |
| Export de jure model | Business blueprint describing how the export process should be executed by the PCS |
| Data dump | Dataset from the PCS, with detailed information about its structure and the main attributes |
Table 2.
Freight export stakeholders and documents.
| Information Unit | Detail | |
|---|---|---|
| Stakeholder | Freight Forwarder | It oversees organization and management of all the aspects concerning the freight forwarding, including the administrative and customs one on behalf of the customer |
| Maritime Agency | It handles the activities concerning Coast Guard, public security offices, and other institutional offices, on behalf of the shipping companies | |
| Customs House Agent | He/she manages the customs activities on behalf of the vessel | |
| Terminal | Its main duties are: interface between shipping companies and carriers; phyisical activities such as container handling, quay management, freight storage for import and export | |
| Document | Bill of Lading (BoL) | List of what a forwarder needs to load on the vessel |
| Cargo Manifest | List of the BoLs’ content for a single vessel | |
| Customs Answer | Result of the customs check about the Cargo Manifest | |
| COARRI | Standard EDI message reporting which containers have been loaded | |
Table 3.
The selected data attributes.
| Attribute | Description | Justification |
|---|---|---|
| Timestamp | Record of the time of occurrence of an event | It provides the time sequence of the events across the instances and allows to elicit the time and frequency metrics |
| Activity | Activity which an event refers to | It is needed to assign an event to an activity |
| Lifecycle | Status of the event | When crossed with the timestamp, it allows to find out the timeframe of each event and the idle time between events |
| IMO number | Unique seven-digit numerical sequence that identifies the over-100-tons vessels | The IMO-Route couple identifies a process instance unambiguously |
| Route | Route of the vessel |
Table 4.
Frequency of the export activities.
| Activity | Absolute Frequency | Relative Frequency |
|---|---|---|
| Saving the BoLs | 86,814 | 44.63% |
| Receiving the BoLs | 81,618 | 41.96% |
| Customs Answer | 8954 | 4.6% |
| Cargo Manifest | 6556 | 3.37% |
| Modifying the BoLs | 5196 | 2.67% |
| Ship Validation | 1808 | 0.93% |
| COARRI | 1728 | 0.89% |
| Ship Opening | 1656 | 0.85% |
| Change Ship Opening | 188 | 0.1% |
Table 5.
Distribution of the vessels.
| Vessel Class | Kind of Vessel | Frequency | Percentage |
|---|---|---|---|
| A | Early containerships, Fully cellular | 673 | 83.3% |
| B | Panamax, Panamax Max | 97 | 12% |
| C | Post Panamax I and II | 38 | 4.7% |
| D | New Panamax | 0 | 0% |
| E | Very Large Container Ship, Ultra Large Container Ship | 0 | 0% |
| Total | 808 | 100% | |
Table 6.
Details about the seven critical arches.
| Code | CrI | AFr | CFr | MRep | Median | Mean | Total | Max | Min |
|---|---|---|---|---|---|---|---|---|---|
| 1 | 1128 d | 813 | 808 | 2 | 7 h | 33.3 h | 37.1 mo | 22 d | 3.4 min |
| 2 | 2863.3 d | 37862 | 762 | 203 | 8.7 min | 108.9 min | 94.2 mo | 12.2 d | 10 ms |
| 3 | 93.8 d | 2413 | 524 | 29 | 3.1 min | 56 min | 13.4 w | 5 d | 296 ms |
| 4 | 395.2 d | 2496 | 797 | 12 | 26 min | 3.8 h | 13.1 mo | 14 d | 265 ms |
| 5 | 188.44 d | 1675 | 522 | 11 | 15.2 min | 2.7 h | 27.2 w | 3.8 d | 63 ms |
| 6 | 1173 d | 720 | 716 | 2 | 29.9 h | 39.1 h | 38.6 mo | 16.1 d | 13.9 min |
| 7 | 129 d | 911 | 806 | 5 | 104.6 s | 3.4 h | 18.2 w | 30.3 d | 203 ms |
Code: progressive number of the arcs (see Figure 3); CrI: Criticality Index; AFr: Absolute Frequency; CFr: Case Frequency, i.e., the amount of cases which the arc occurs in; MRep: maximum number of occurrences of the arc in a case; Median and Mean: median and mean time lengths of the arc out of its absolute frequency; Total: cumulated time frame of the arc (i.e., Mean ∙ AFr); Max and Min: maximum and minimum time frame of the arc.
Table 7.
Summary of the findings about the seven arcs.
| Arc | Actual Inefficiency | Noncritical | Detail |
|---|---|---|---|
| 1 | X | Port export flexible procedure | |
| 2 | X | Inefficienct BoL process due to coordination issues between FFs and their customers | |
| 3 | X | Human errors in BoLs’ data entry | |
| 4 | X | Inefficienct BoL process | |
| 5 | X | Human errors in BoLs’ data entry and in managing the information flow | |
| 6 | X | Time length hiding the export physical handling | |
| 7 | X | Intermediate COARRIs |
© 2019 by the authors. Licensee MDPI, Basel, Switzerland. This article is an open access article distributed under the terms and conditions of the Creative Commons Attribution (CC BY) license (http://creativecommons.org/licenses/by/4.0/).
Share and Cite
MDPI and ACS Style
Zerbino, P.; Aloini, D.; Dulmin, R.; Mininno, V. Towards Analytics-Enabled Efficiency Improvements in Maritime Transportation: A Case Study in a Mediterranean Port. Sustainability 2019, 11, 4473. https://doi.org/10.3390/su11164473
AMA Style
Zerbino P, Aloini D, Dulmin R, Mininno V. Towards Analytics-Enabled Efficiency Improvements in Maritime Transportation: A Case Study in a Mediterranean Port. Sustainability. 2019; 11(16):4473. https://doi.org/10.3390/su11164473
Chicago/Turabian StyleZerbino, Pierluigi, Davide Aloini, Riccardo Dulmin, and Valeria Mininno. 2019. "Towards Analytics-Enabled Efficiency Improvements in Maritime Transportation: A Case Study in a Mediterranean Port" Sustainability 11, no. 16: 4473. https://doi.org/10.3390/su11164473
Note that from the first issue of 2016, this journal uses article numbers instead of page numbers. See further details here.