Drought Risk Assessment and Estimation in Vulnerable Eco-Regions of China: Under the Background of Climate Change


1
State Key Laboratory of Earth Surface Processes and Resource Ecology, Faculty of Geographical Science, Beijing Normal University, Beijing 100875, China
2
Joint Center for Global Change Studies, Beijing 100875, China
*
Author to whom correspondence should be addressed.
Sustainability 2019, 11(16), 4463; https://doi.org/10.3390/su11164463
Submission received: 9 July 2019
/
Revised: 11 August 2019
/
Accepted: 15 August 2019
/
Published: 18 August 2019
(This article belongs to the Collection Advanced Methodologies for Sustainability Assessment: Theory and Practice)
Abstract
:Drought risk analysis can help improve disaster management techniques, thereby reducing potential drought risk under the impacts of climate change. This study analyses observed and model-simulated spatial patterns of changes in drought risk in vulnerable eco-regions in China during 1988–2017 and 2020–2050 using an analytic hierarchy process (AHP) method. To perform a risk assessment and estimation of a drought disaster, three subsystems—namely hazard, vulnerability and exposure—are assessed in terms of the effects of climate change since the middle of the 21st century: (i) Hazards, represented by climate anomalies related to the drought process, such as changes in rainfall averages, temperature averages and evaporation averages; (ii) vulnerability, encompassing land use and mutual transposition between them; (iii) exposure, consisting of socioeconomic, demographic, and farming. The results demonstrated that high hazards continue to be located in the arid zone, high vulnerability levels occur in the Junggar Basin and Inner Mongolia Plateau, and high exposure levels occur Loess Plateau and southern coastal area. In this way, the results provide exhaustive measures for proactive drought risk management and mitigation strategies.
1. Introduction
Strengthening the capacity to cope with climate change and increase risk research in vulnerable eco-regions is a popular issue that continues to be of concern to all countries and the public. Global climate change, characterized by warming, has led to increased climate-driven variability in social and economic development, an increased frequency of extreme events, and a chain reaction of disasters [1]. Drought ranks first among all natural disasters directly encountered by humans, and it affects almost all climatic regions [2]. More emphasis on drought risk is warranted due to repeated and widespread droughts throughout the world [3]. In China, drought is the most common of the major climatic disasters [4]. Northern China is located at mid–high latitudes and is highly sensitive to global warming [5]. Drought risk is a product of regional exposure to natural disasters and long-term water scarcity. To reduce the occurrence of severe consequences, drought risk first needs to be analyzed. In particular, vulnerable eco-regions must better understand their drought risk distribution characteristics to minimize the losses caused by drought.
In mainstream practice, the development stage of drought risk assessment is divided into three stages: Attention to the hazard factor stage, attention to the social attribute stage of the hazard body, and the comprehensive research stage that combines disaster and social attributes. From the 1920s to the 1980s, researchers generally used the environment as a hazard or disaster to conduct research [6,7]. However, research at this stage focused on the disaster itself, treating disasters as the uncertain effects of extreme events [8], ignoring the interrelationship between the disaster-tolerant environment and the hazard-bearing body. In the 1980s and 1990s, researchers began to pay attention to the social attributes of the hazard-bearing body [9]. Gregoric (2010) noted that drought is a phenomenon closely linked to climate and society [10]. Natural disasters are not the only factor determining risk, and the ability of society to overcome the difficulties caused by vulnerability also determines risk; vulnerability determines the risk of current and future drought effects. Assessing natural disasters and social vulnerability becomes one of the goals of drought risk management. The historical assessment of drought establishment and monitoring systems has been undertaken to establish a regional estimation method for climate and actual natural disasters. However, most drought risk assessment methods focus on drought risks and vulnerabilities. As an important part of arid ecological risks, exposures need to be considered. From the 1990s to the present, the trend of disaster risk vulnerability research has gradually turned to disaster-based research [11]. Scholars who study the theory of disaster systems believe that disasters are the result of interactions between hazards and the environment of pregnant disasters [12]. The disaster risk in a certain area is formed by the interaction of three factors: Hazard, exposure and vulnerability. Therefore, disaster risk assessments should be based on the above three factors [13]. Using disaster assessment models to assess hazards, vulnerabilities, exposures, and the spatial distribution of drought risks, decision-makers can identify drought conditions and make decisions to reasonably fight against drought [14,15].
International trends in drought disaster research have shifted from the traditional “drought disaster crisis management” to the modern “drought disaster risk management” [16]. Drought risk is usually assessed for its impact on human activities, as well as economic, social and environmental systems, with the aim to determine the appropriate actions that can be taken to reduce potential damage [17]. Most of the research mainly uses meteorological elements to assess disasters, and less consideration is given to the environmental and social factors that cause disasters. This study uses meteorological data and social statistics to assess drought risk in the historical period of 1988~2017 and further uses multimodal data to estimate drought risks in different scenarios in the future based on environmental and social factors. This study aims to provide decision-makers with a visual distribution of disaster risks and reduce the social and economic losses caused by drought.
2. Materials and Methods
2.1. Data and Methods
Data
Meteorological and social statistical data were used to conduct drought risk assessments (Table 1). Based on precipitation, temperature, and drought-affected areas as indicators in the drought hazard assessment, total agricultural output value, water resources, and forest area were used as vulnerability assessment factors, while permanent population, cultivated land area, and the gross output value of agriculture, forestry and fisheries were used as exposure assessment factors. Many semiarid and arid-prone areas have significant competitive advantages for irrigated agriculture because they are rich in resources, agricultural activities in the area are inexpensive, and there are few land use alternatives [18]. Therefore, the use of water resources and agroforestry to assess drought risks is considered reasonable.
Wide-ranging uncertainties about future climate change coercion and responses are expected by the 21st century, so future scenarios need to be utilized to explore the potential consequences of distinct response options [19]. When applied to climate change research, scenarios help to assess the uncertainty of human contributions, the responses of Earth to anthropogenic activities, and the impacts of different mitigation and adaptation methods (actions that promote responses to new climatic conditions). Specifically, we conducted drought risk estimates from Phase 5 of the Coupled Model Intercomparison Project (CMIP5) [20], land use and population GDP data (see Table 2 for a complete list of all model expansions).
Consistent with many other studies, we focused on lower emission RCP (Representative Concentration Pathway) 4.5 scenario and high emission RCP 8.5 scenario [26]. Temperature, precipitation and evaporation were used to estimate hazards; primary land, second land, urban and secondary land transition to crop were used to estimate vulnerability; and population, GDP, crop, and pasture were used to estimate exposure. Studies have shown that changes in land use caused by human activities can affect global climate change by changing the carbon content of the atmosphere [22,27]. For example, vegetation degradation can cause increased drought and ecosystem degradation [28]. Therefore, it is reasonable to consider land use in drought risk estimation.
2.2. Methods
2.2.1. Methods of Disaster Risk Assessment
According to regional disaster system theory, disasters are the product of the combined effects of disaster systems consisting of hazard, disaster-bearing bodies and disaster-pregnant environments [29]. The hazard factor is a necessary condition for disasters. A hazard-bearing body is a necessary condition for amplifying or reducing disaster impacts. The environment in a disaster-prone area is the background condition that affects the hazard factor and the hazard-bearing body. The three effects are indispensable. Disaster risk assessments are based on a quantitative perspective to assess the form and intensity of disaster occurrence. Generally, three major factors are considered, including the hazard, the vulnerability of the environment, and exposure to the hazard [30].
2.2.2. Normalization of Indicators
The disaster risk assessment contains multiple indicators. Since each indicator has different dimensions and cannot be directly compared, each indicator needs to be normalized so that the values are distributed between [0, 1] for comparison.
2.2.3. Fuzzy Analytic Hierarchy Process (AHP)
Buckley (1983) [31] used the geometric mean method to calculate the fuzzy weights of each fuzzy matrix, a process which is often used in disaster zoning studies [32]. The analytic hierarchy process AHP is a decision-making method that combines qualitative and quantitative methods and guarantees a unique solution for the reciprocal matrix. This study selected the weighted evaluation method of the geometric mean because it is simple and easy to use in a fuzzy environment. The comparison of the index weights with the positive and negative numbers of the evaluation factors is shown in [33]:
The geometric mean of each row vector is calculated as follows:
Calculate the n-th root of
Normalize the vector
is the weighting factor of each variable.
To evaluate the coefficient matrix, it is necessary to calculate the consistency index of the matrix. , where is the largest eigenvalue of . When = 0, the judgment matrix is completely consistent; the smaller is, the better the consistency of the judgment matrix. In the judgment matrix consistency test, the value is compared with the average random consistency index (Table 3), and is expressed as the random consistency ratio of the judgment matrix; that is, = /. When < 0.1, the judgment matrix can be considered to have good consistency; when > 0.1, the judgment matrix needs to be adjusted until < 0.1.
3. Research Area
The Ministry of Ecology and Environment of the People’s Republic of China identified eight ecologically fragile areas in China with the ecotone as the main body (Ministry of Environmental Protection, 2008): 1. Northeast forest grass ecotone; 2. northern agriculture pasture ecotone; 3. northwest desert oasis ecotone; 4. southern red soil hilly mountain ecotone; 5. southwestern karst mountain rocky desert ecotone; 6. southwestern mountain farming and pasture ecotone; 7. Qinghai–Tibet Plateau complex-erosion, ecologically fragile zone; 8. coastal water–land junction zone. With the deepening of Earth system science and sustainable development research, the existing ecologically fragile zoning has not adapted to the needs of the new situation. The comprehensive ecological division that integrates natural elements and social and economic factors is currently the main trend and the principle of dividing the research area in this study. To identify ecologically vulnerable areas, carbon flux was used to divide the study area.
Net primary productivity (NPP) is the total amount of organic dry matter that can be produced by green plants per unit time and unit area. This value reflects the ability of plants to utilize natural environmental resources and is a key link in the biogeochemical carbon cycle. The temporal and spatial variations in NPP are mainly determined by the complex interactions between vegetation, soil, and climate, and they are strongly influenced by human activities and global environmental changes [34]. Human disturbances, especially those associated with land use change, have equal or even more severe ecosystem productivity than those physiological changes associated with climate composition [35]. If the resilience and adaptability of ecosystems are severely damaged, these ecosystems may be at risk. The increase in global warming will lead to increased risks to the ecosystems in the 21st century. In turn, feedback from global carbon that sinks to atmospheric carbon dioxide pools can accelerate or limit climate change [36]. The estimation process of NPP is as follows [37]:
and
where gross primary production () is the cumulative sum of at every time step (); represents the parameterizations for leaf photosynthesis [38]; and Ra is the autotrophic respiration [39], determined by temperature and tissue nitrogen content.
To reflect the changes in the patterns of vulnerable eco-regions in the future, this study selected the NPP data from the MPI-ESM-LR(Max Planck Institute Earth System Model) model from 2021 to 2050 as a typical period to represent the medium-term trend (based on 1988–2017) (Figure 1). The MPI-ESM-LR includes a detailed spatial separation rate and considers complex human activities that reflect the ecological issues we care about, and the modular land surface scheme (Jena Scheme for Biosphere-Atmosphere Coupling in Hamburg) brings simulation results closer to real values [40]. Under the low-emissions scenario (RCP 4.5), vulnerable eco-regions are expected to be concentrated in the southern region. For the high-emissions scenario (RCP 8.5), the area may extend north to the central and northeastern regions. It is worth noting that regardless of the type of emissions scenario, the ecosystem of the western region will develop, at least until 2050, while the region from south to southwest will become a new ecologically fragile zone. This change may be mainly due to increased drought in Southern China [41]. Therefore, in this study, the traditional arid zone was combined with the new vulnerable eco-region as a drought risk assessment research area.
4. Results
4.1. Drought Risk Assessment
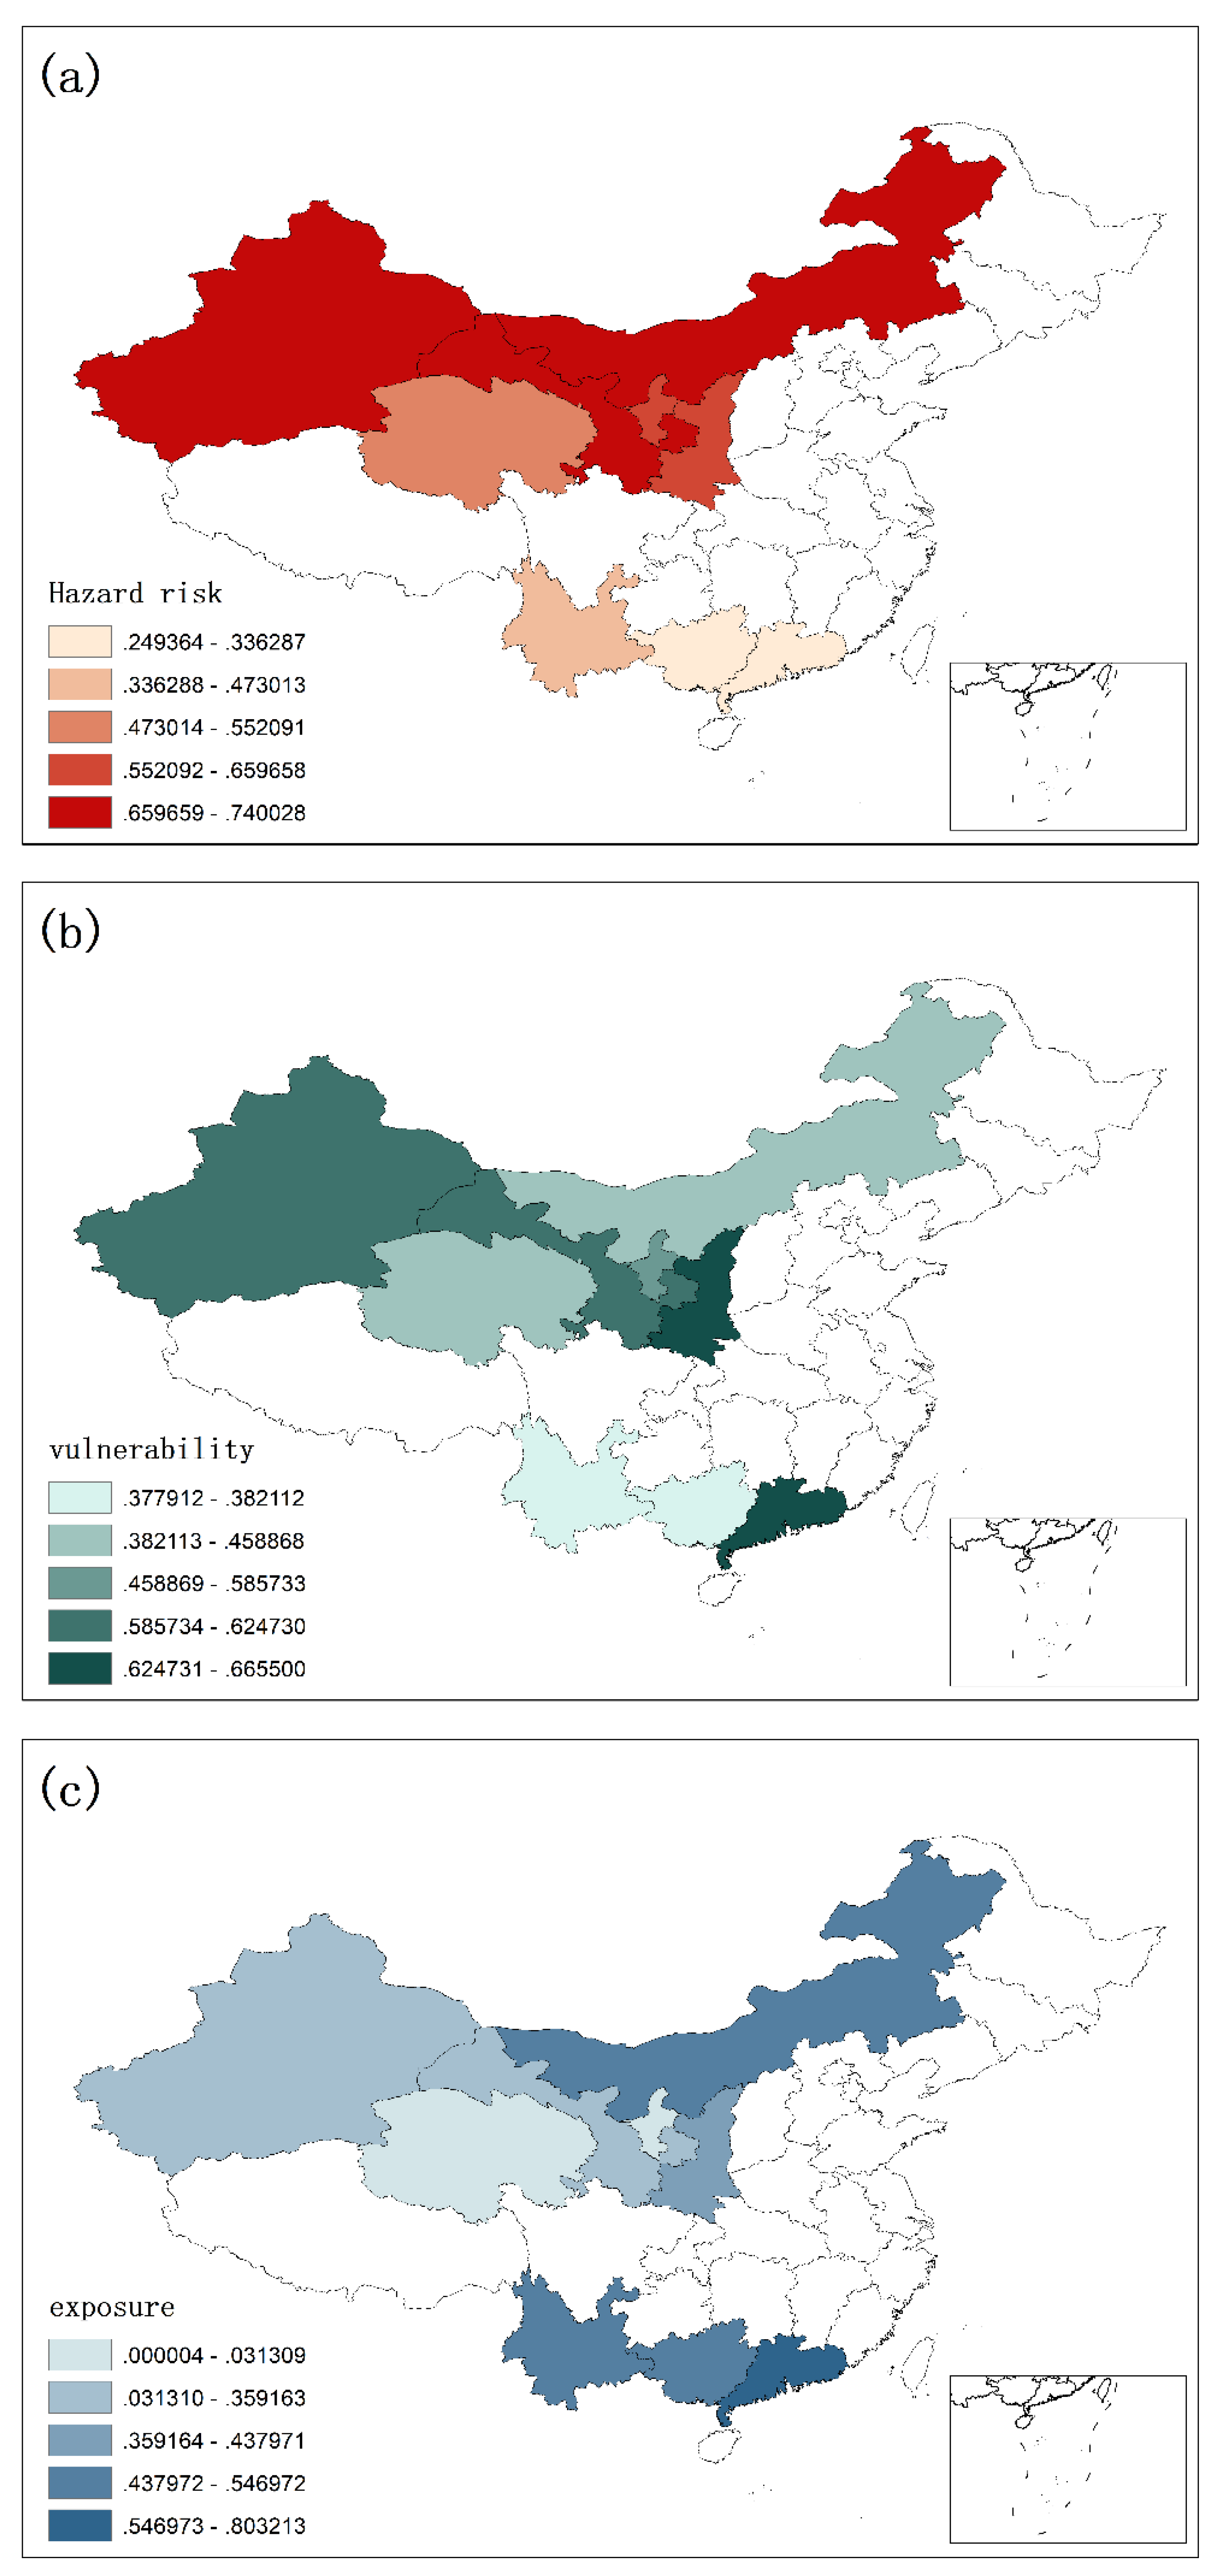
Hazard factors, including natural and anthropogenic climate change, determine the probability of risk [42]. Hazard refers to the various characteristics and abnormalities of the main meteorological factors causing the disaster, such as abnormal changes in precipitation and temperature, which are generally considered to affect disaster risks. Figure 2a shows the distribution of hazard risk based on three hazard factors: Precipitation, temperature, and drought-affected areas. After processing the data, a comprehensive hazard index was obtained. The comprehensive hazard index decreased from north to south, and attention should be paid to drought prevention measures in the north.
Vulnerability describes a system of vulnerability and lack of ability to adapt to variation and change [43], and it is generally defined as the possibility, degree, or state of a system that is vulnerable to damage under external interference. The greater the vulnerability of the region, the greater the potential for damage and the higher the risk. Figure 2b shows the distribution of vulnerability risk based on three vulnerability indicators: Total agricultural output value, water resources, and forest area. After data processing, a vulnerability model was established, and the composite vulnerability index was obtained. The composite vulnerability index generally showed a decreasing trend from north to south (Figure 2b). Though Guangdong had abundant water vapor, the vulnerability index was relatively high for drought. Therefore, the vulnerability of Guangdong should be given special attention.
Exposure degree refers to the infrastructure, resources, environment, society, economy and cultural property that are closely related to human life and production [44]. The greater the exposure is in a region, the greater the potential loss and the higher the risk. Figure 2c shows the distribution of exposure risk based on three exposure indexes, including permanent population, cultivated land area, and gross output value of agriculture, forestry and fisheries. After data processing, the exposure model was established, and a comprehensive exposure index was obtained. The exposure index trend was in contrast to the hazard index trend and generally increased from north to south. It is worth noting that although the drought in the south was less than that in the north, the exposure was higher in the south than in the north. Therefore, the exposure in the south should be given more attention.
To reduce the drought risk in the study area, we extracted the main risk factors in each area (Table 4) from the drought risk assessment (Figure 2) to provide countermeasures. (1) High hazard and vulnerability risks in disaster-bearing environments are the main risks in Gansu and Ningxia. The high hazard risks in these regions are mainly due to the dry climate, low precipitation and high temperature (relative to the same latitude). However, with industrial development, the impact of anthropogenic aerosols on natural disasters is increasing. In areas with a low moisture content, an increase in aerosols will inhibit precipitation. Some feasible measures to address this risk are to reduce the emission of carbon dioxide and pollutants. The transition from traditional agriculture to irrigated agriculture and the increase in the total number of reservoirs may be able to adequately improve the disaster reduction capacity. Expanding forest areas and reducing industrial water use may reduce vulnerability. (2) Excessive grazing and excessive mining are some of the ways to artificially cause drought in Inner Mongolia. With the increase in grazing costs, pastoralists can only rely on more grazing to eliminate these increased costs, resulting in overgrazing and ecological deterioration of pastures. At the same time, the mineral resources in Inner Mongolia are very rich, but rainfall will lead to reduced mining efficiency. To protect economic benefits, enterprises will adopt artificial rain dispersal. Measures can be taken to control the pasture and mining industries: Controlling the development of pasture can reduce the livestock deaths caused by drought and reduce the exposure of the disaster-bearing body; on the other hand, the ecological conditions of grasslands can be gradually restored to alleviate the impacts of drought. For overexploitation, the government can appropriately control the mining enterprise while replenishing the economic losses faced by companies due to rainfall.
(3) Due to the hindrance of the warm and humid air currents from the Indian Ocean by the Himalayas, the leeward slope of the Qinghai–Tibet Plateau is one of the main factors causing drought in Qinghai. Moreover, the high wind speed caused by the high altitude will further accelerate evaporation. Increasing afforestation can reduce ecological fragility while reducing wind speed, which seems to be a way to alleviate drought. (4) The arid environment in Xinjiang is caused by the fact that it is located far from the ocean. The water availability from the ocean gradually decreases during long-distance transportation. When this water reaches Xinjiang, it is blocked by the mountains. Both the water and the regional differences in precipitation distribution decrease. Because urban expansion led to the destruction of large areas of vegetation, the living and industrial water requirements both increased, while surface water and groundwater were severely overdrawn, which directly led to drought in Xinjiang. Therefore, a reduction in domestic and industrial water use and maintenance of the surface and groundwater levels should be focused on in this area. (5) The main risk factors in Guangdong, Guangxi and Yunnan are high exposure (Guangdong is also accompanied by high vulnerability), and the large population is one of the main reasons for high exposure. Therefore, a feasible solution is to control the permanent population and convert the primary industry into a tertiary industry. In general, the emissions of greenhouse gases and pollutants should be controlled in the northern region, and the population and transformation of the primary industry into a tertiary industry should be controlled in the southern region.
4.2. Drought Risk Estimate
4.2.1. Estimation of Future Hazard
To identify key risk areas in vulnerable eco-regions, a model-MRI-CGCM3 (Meteorological Research Institute atmosphere–ocean coupled global climate model version 3) with high spatial resolution that was more suitable for Asia was used to analyze precipitation, temperature and evaporation. MRI-CGCM3 can capture regional differences over subtropical China [45] and can better simulate the spatial distribution of Chinese meteorological factors. The uncertainty of the model is given in Appendix A. The uncertainty is calculated based on the statistics of the model and observations and the error between them.
where is the model value and is the observations value.
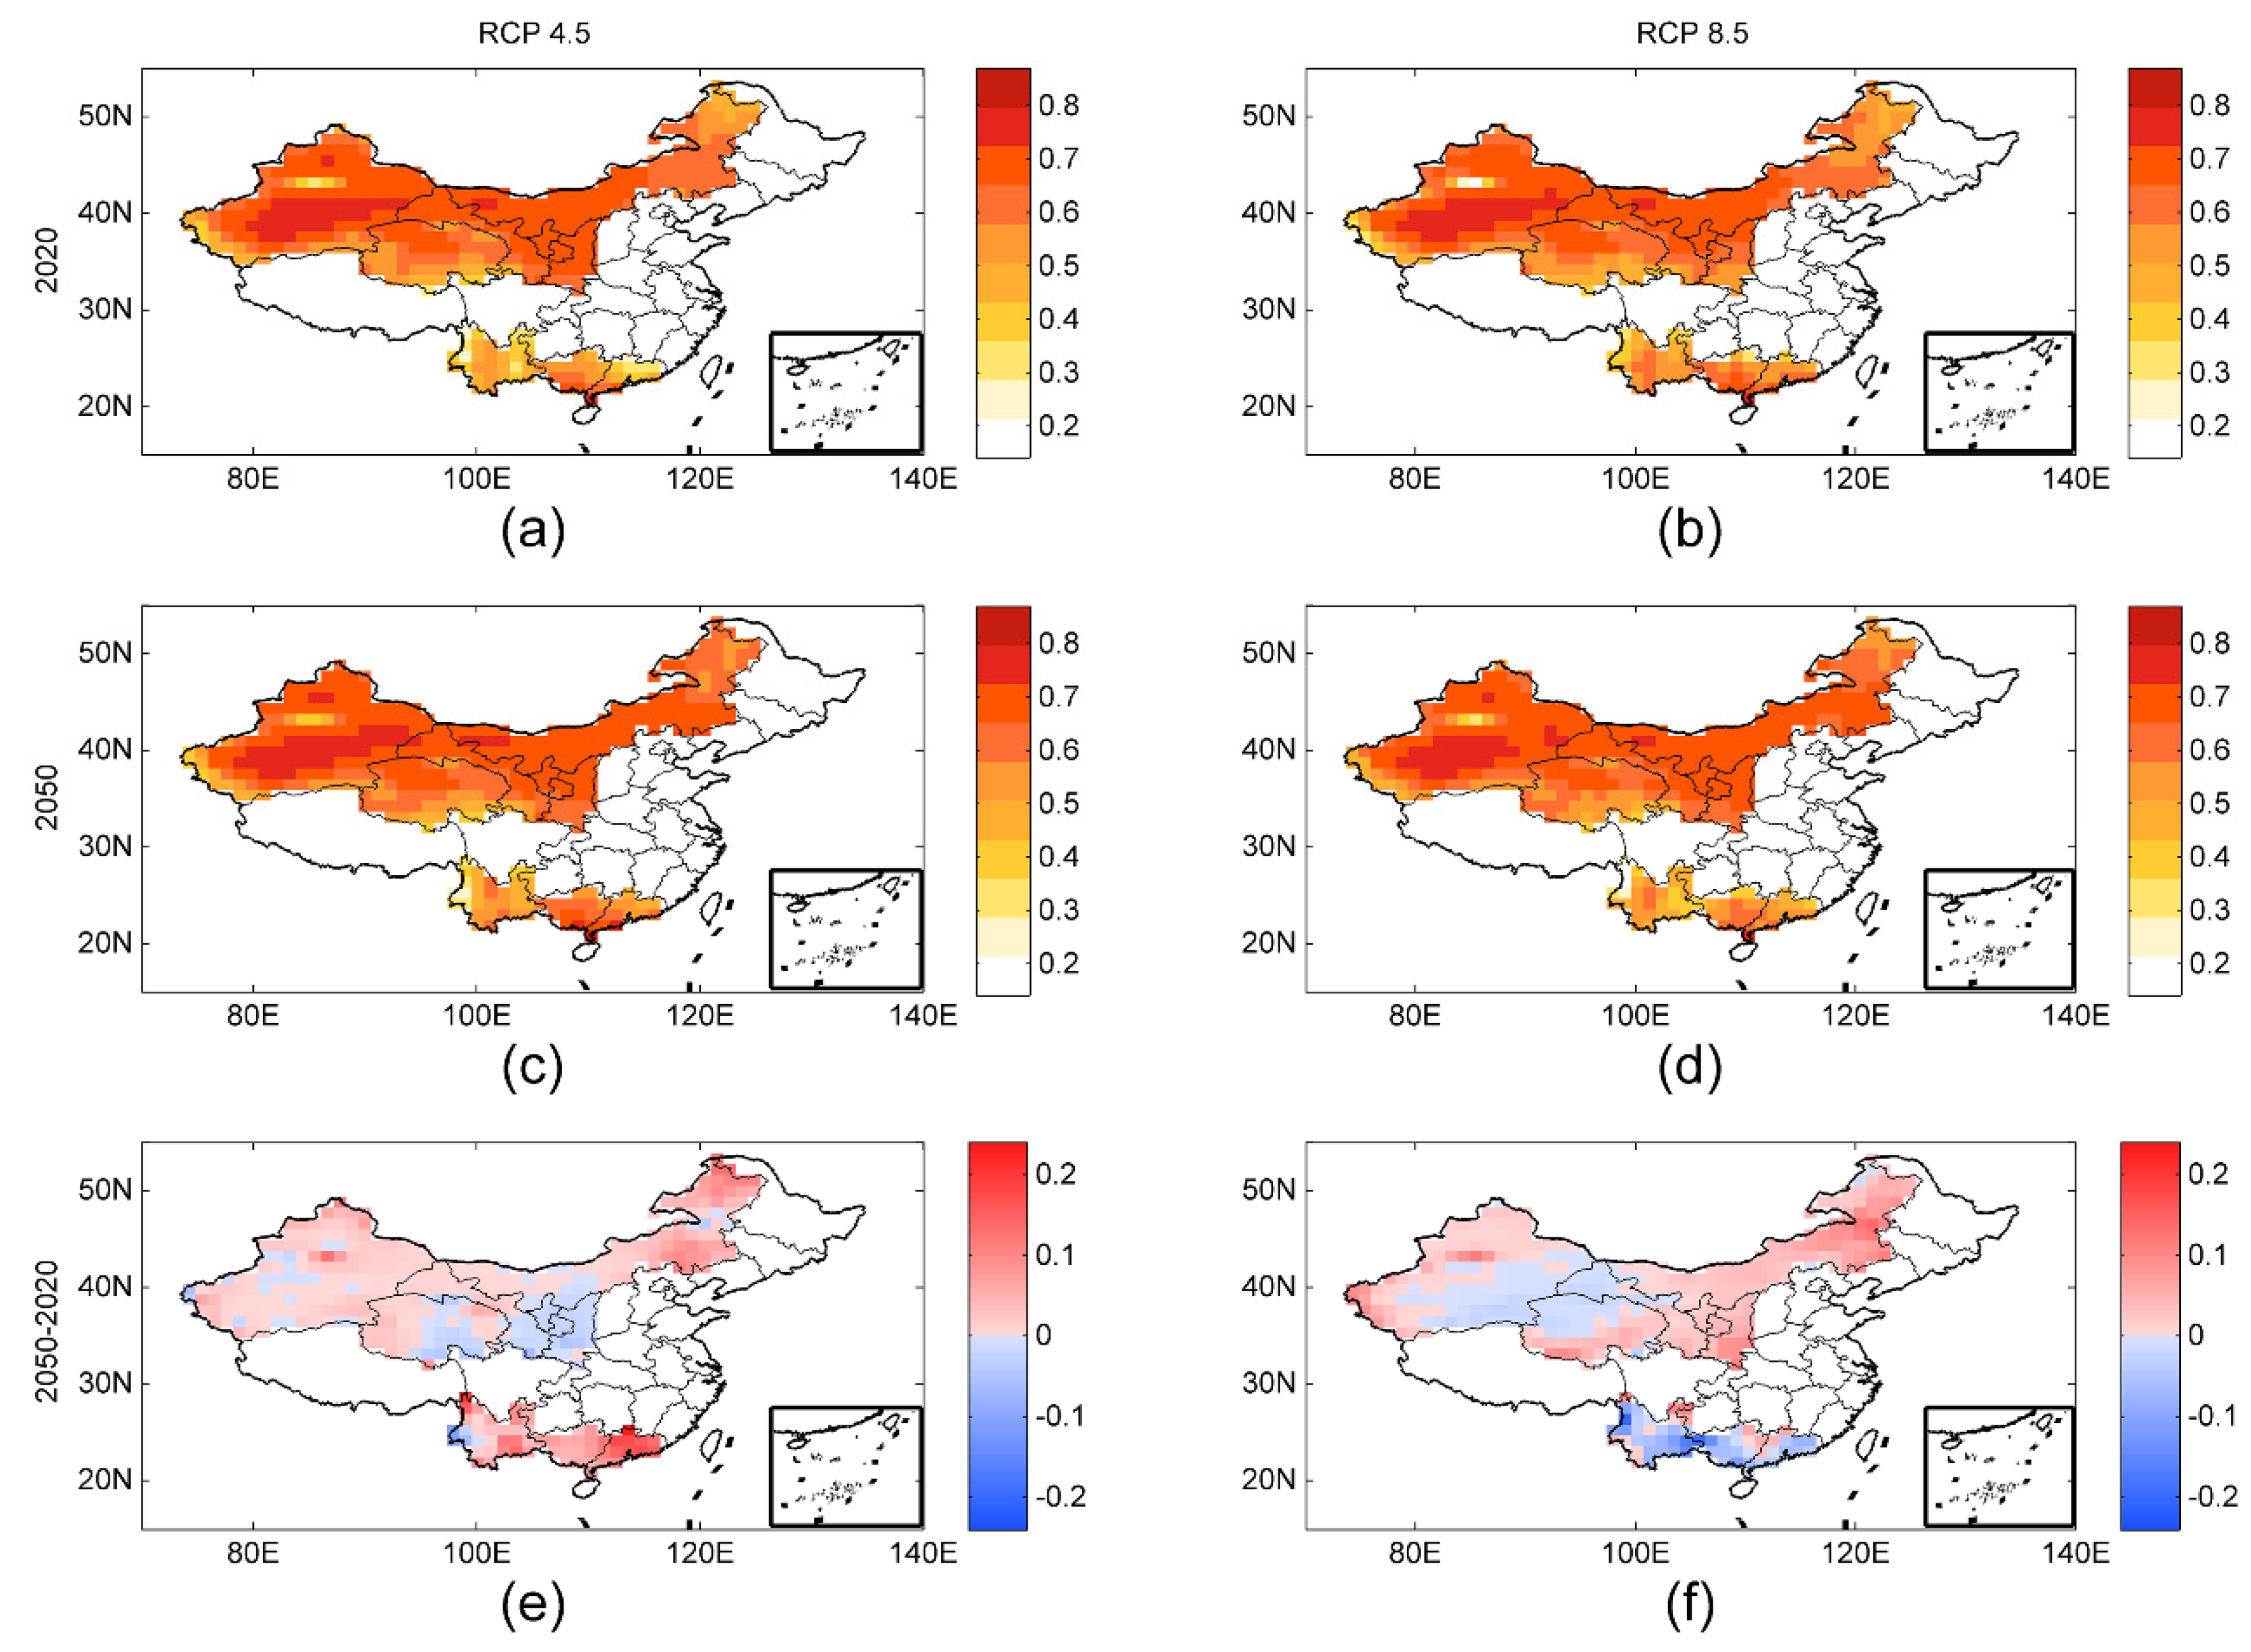
The projected future hazards for the vulnerable eco-regions in China as a whole under two emissions scenarios are shown in Figure 3a,b,d,e. High hazard risks around the Tarim Basin are exhibited for both RCP 8.5 and RCP 4.5. We also calculated the hazard differences over the next three decades (Figure 3e,f) to determine where the changes will be the greatest relative to the first half of the 21st century. As the low-emission mitigation scenario, the RCP 4.5 scenario projects that the hazards will increase throughout most of the research area (Figure 3e). However, the high hazard risks under the RCP 8.5 scenario will occur in the traditionally vulnerable eco-regions (Figure 3f), while a drastic countrywide risk is projected for RCP 4.5. It is worth noting that when emissions increase, the changes in hazard risks are less than those under the low emissions scenario in the Cainozoic vulnerable eco-regions, which may mean that the increase in emissions will result in hazards occurring earlier.
4.2.2. Estimation of Future Vulnerability
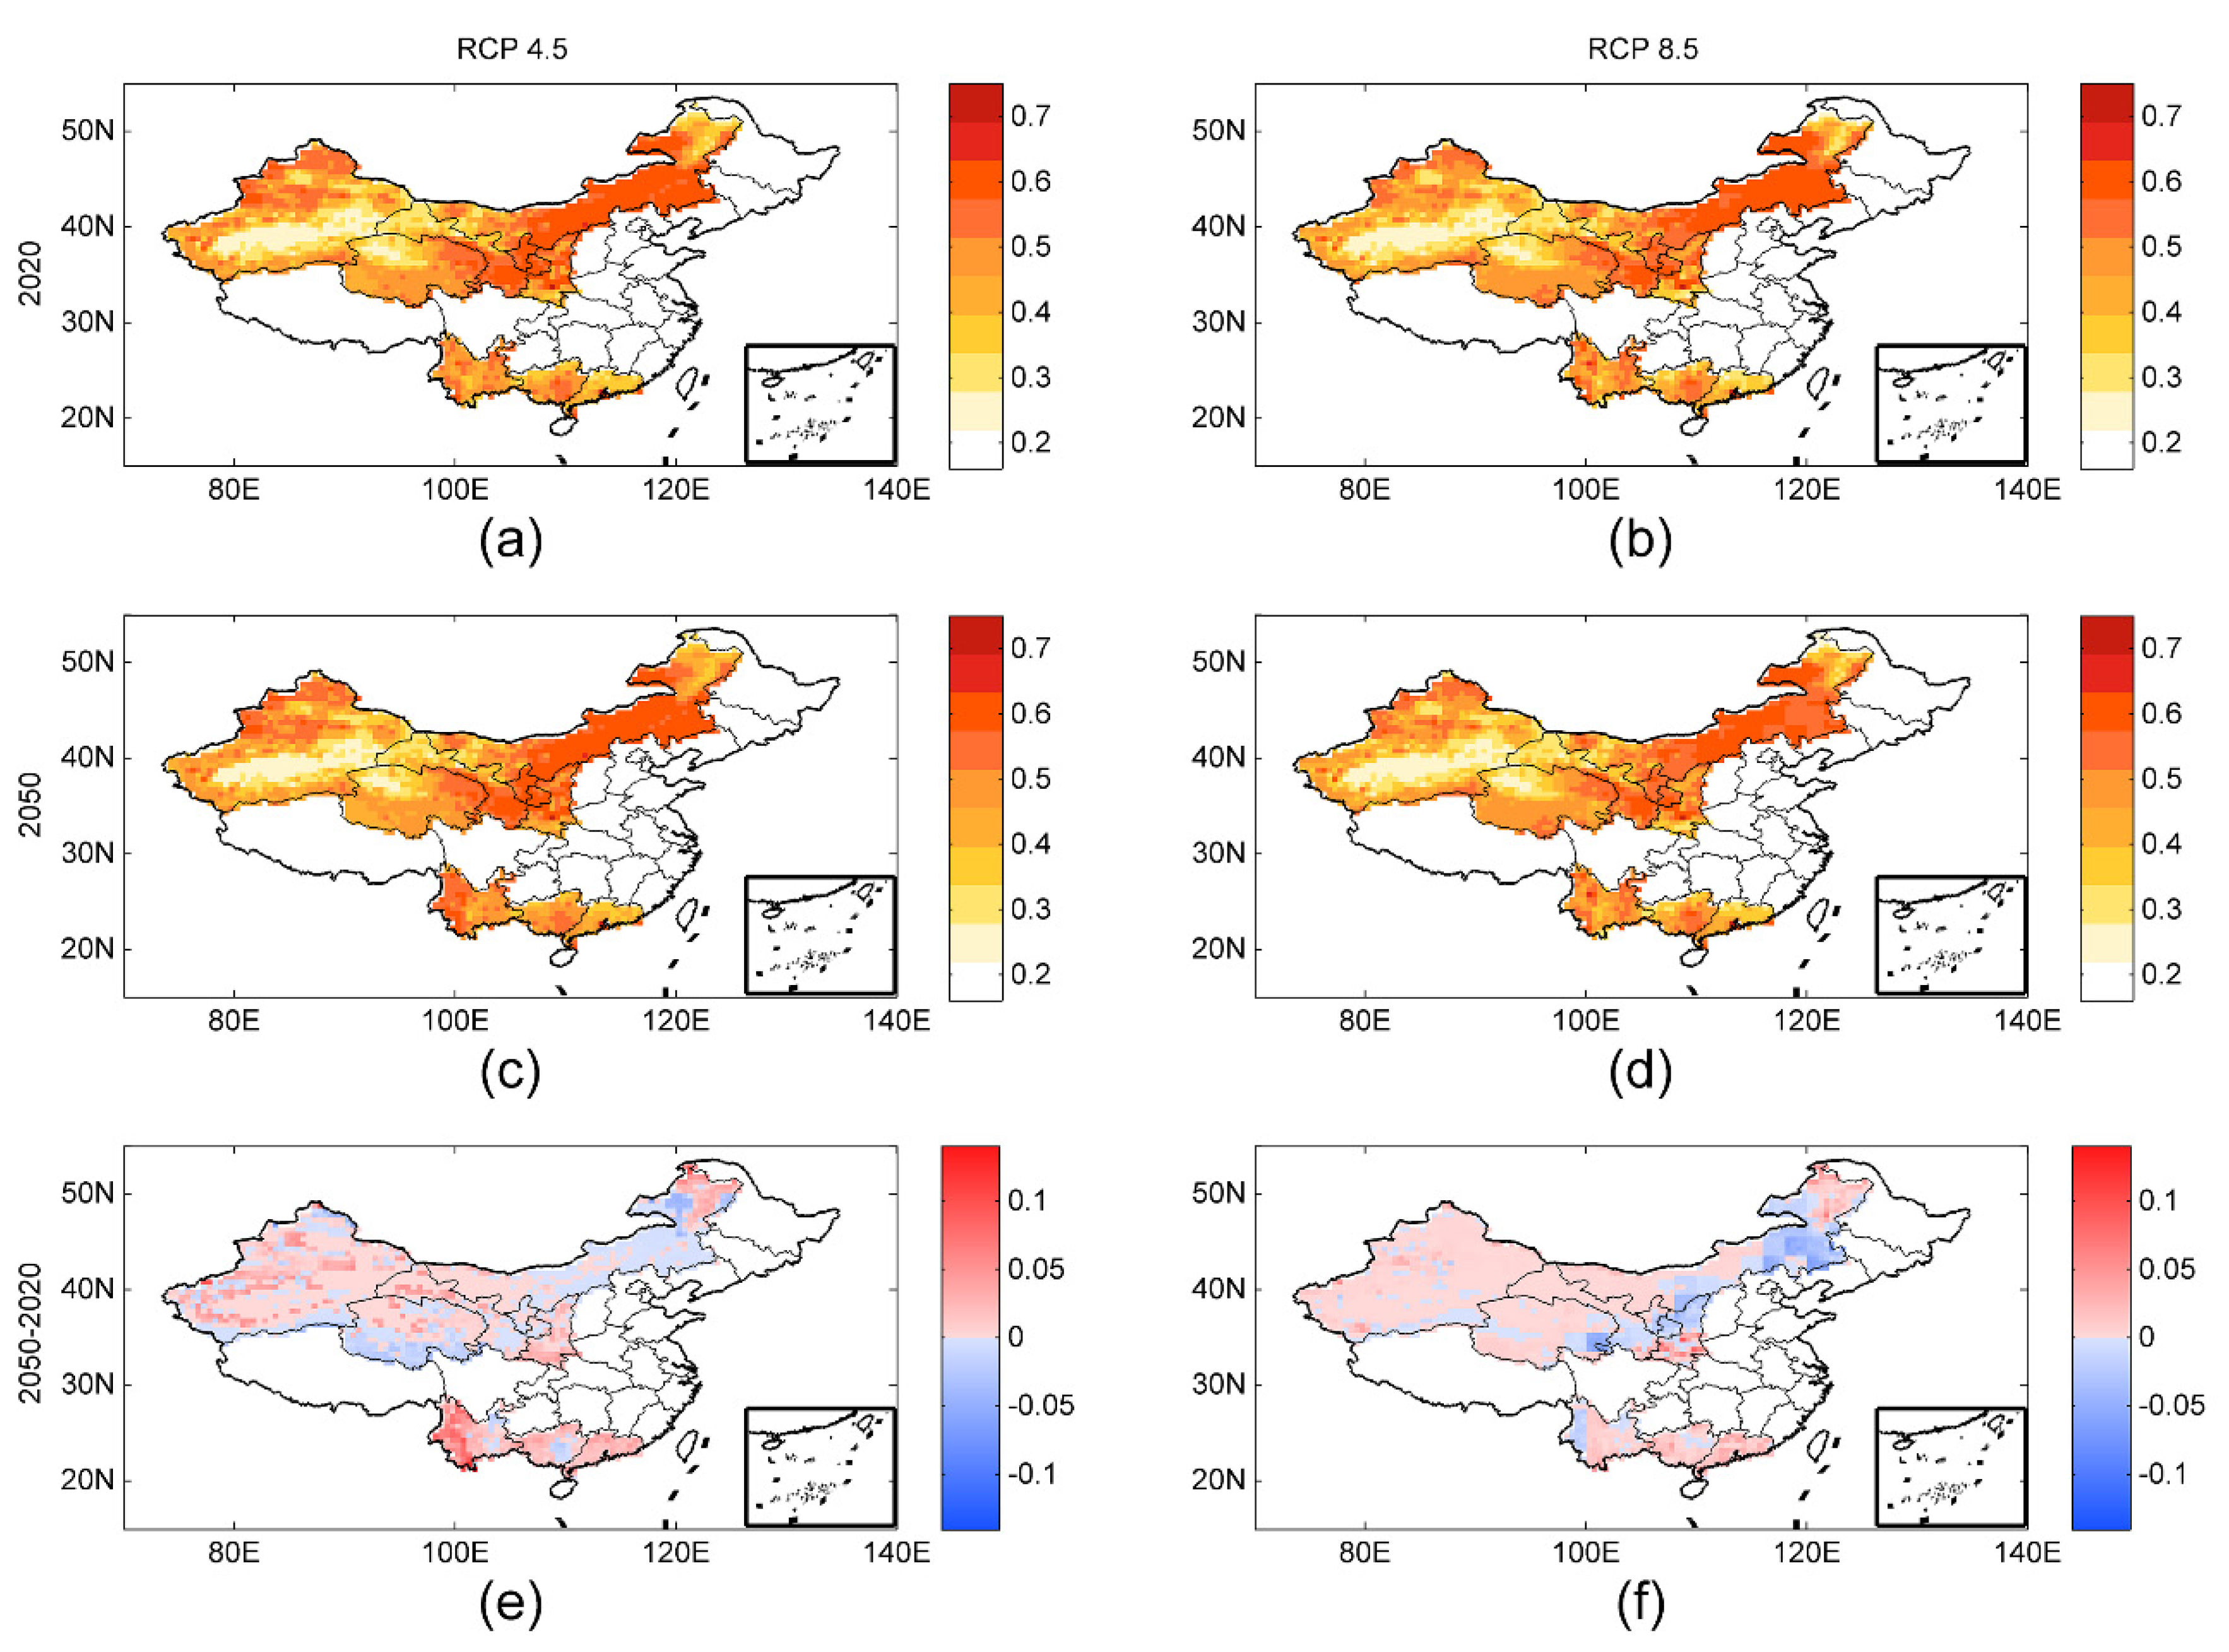
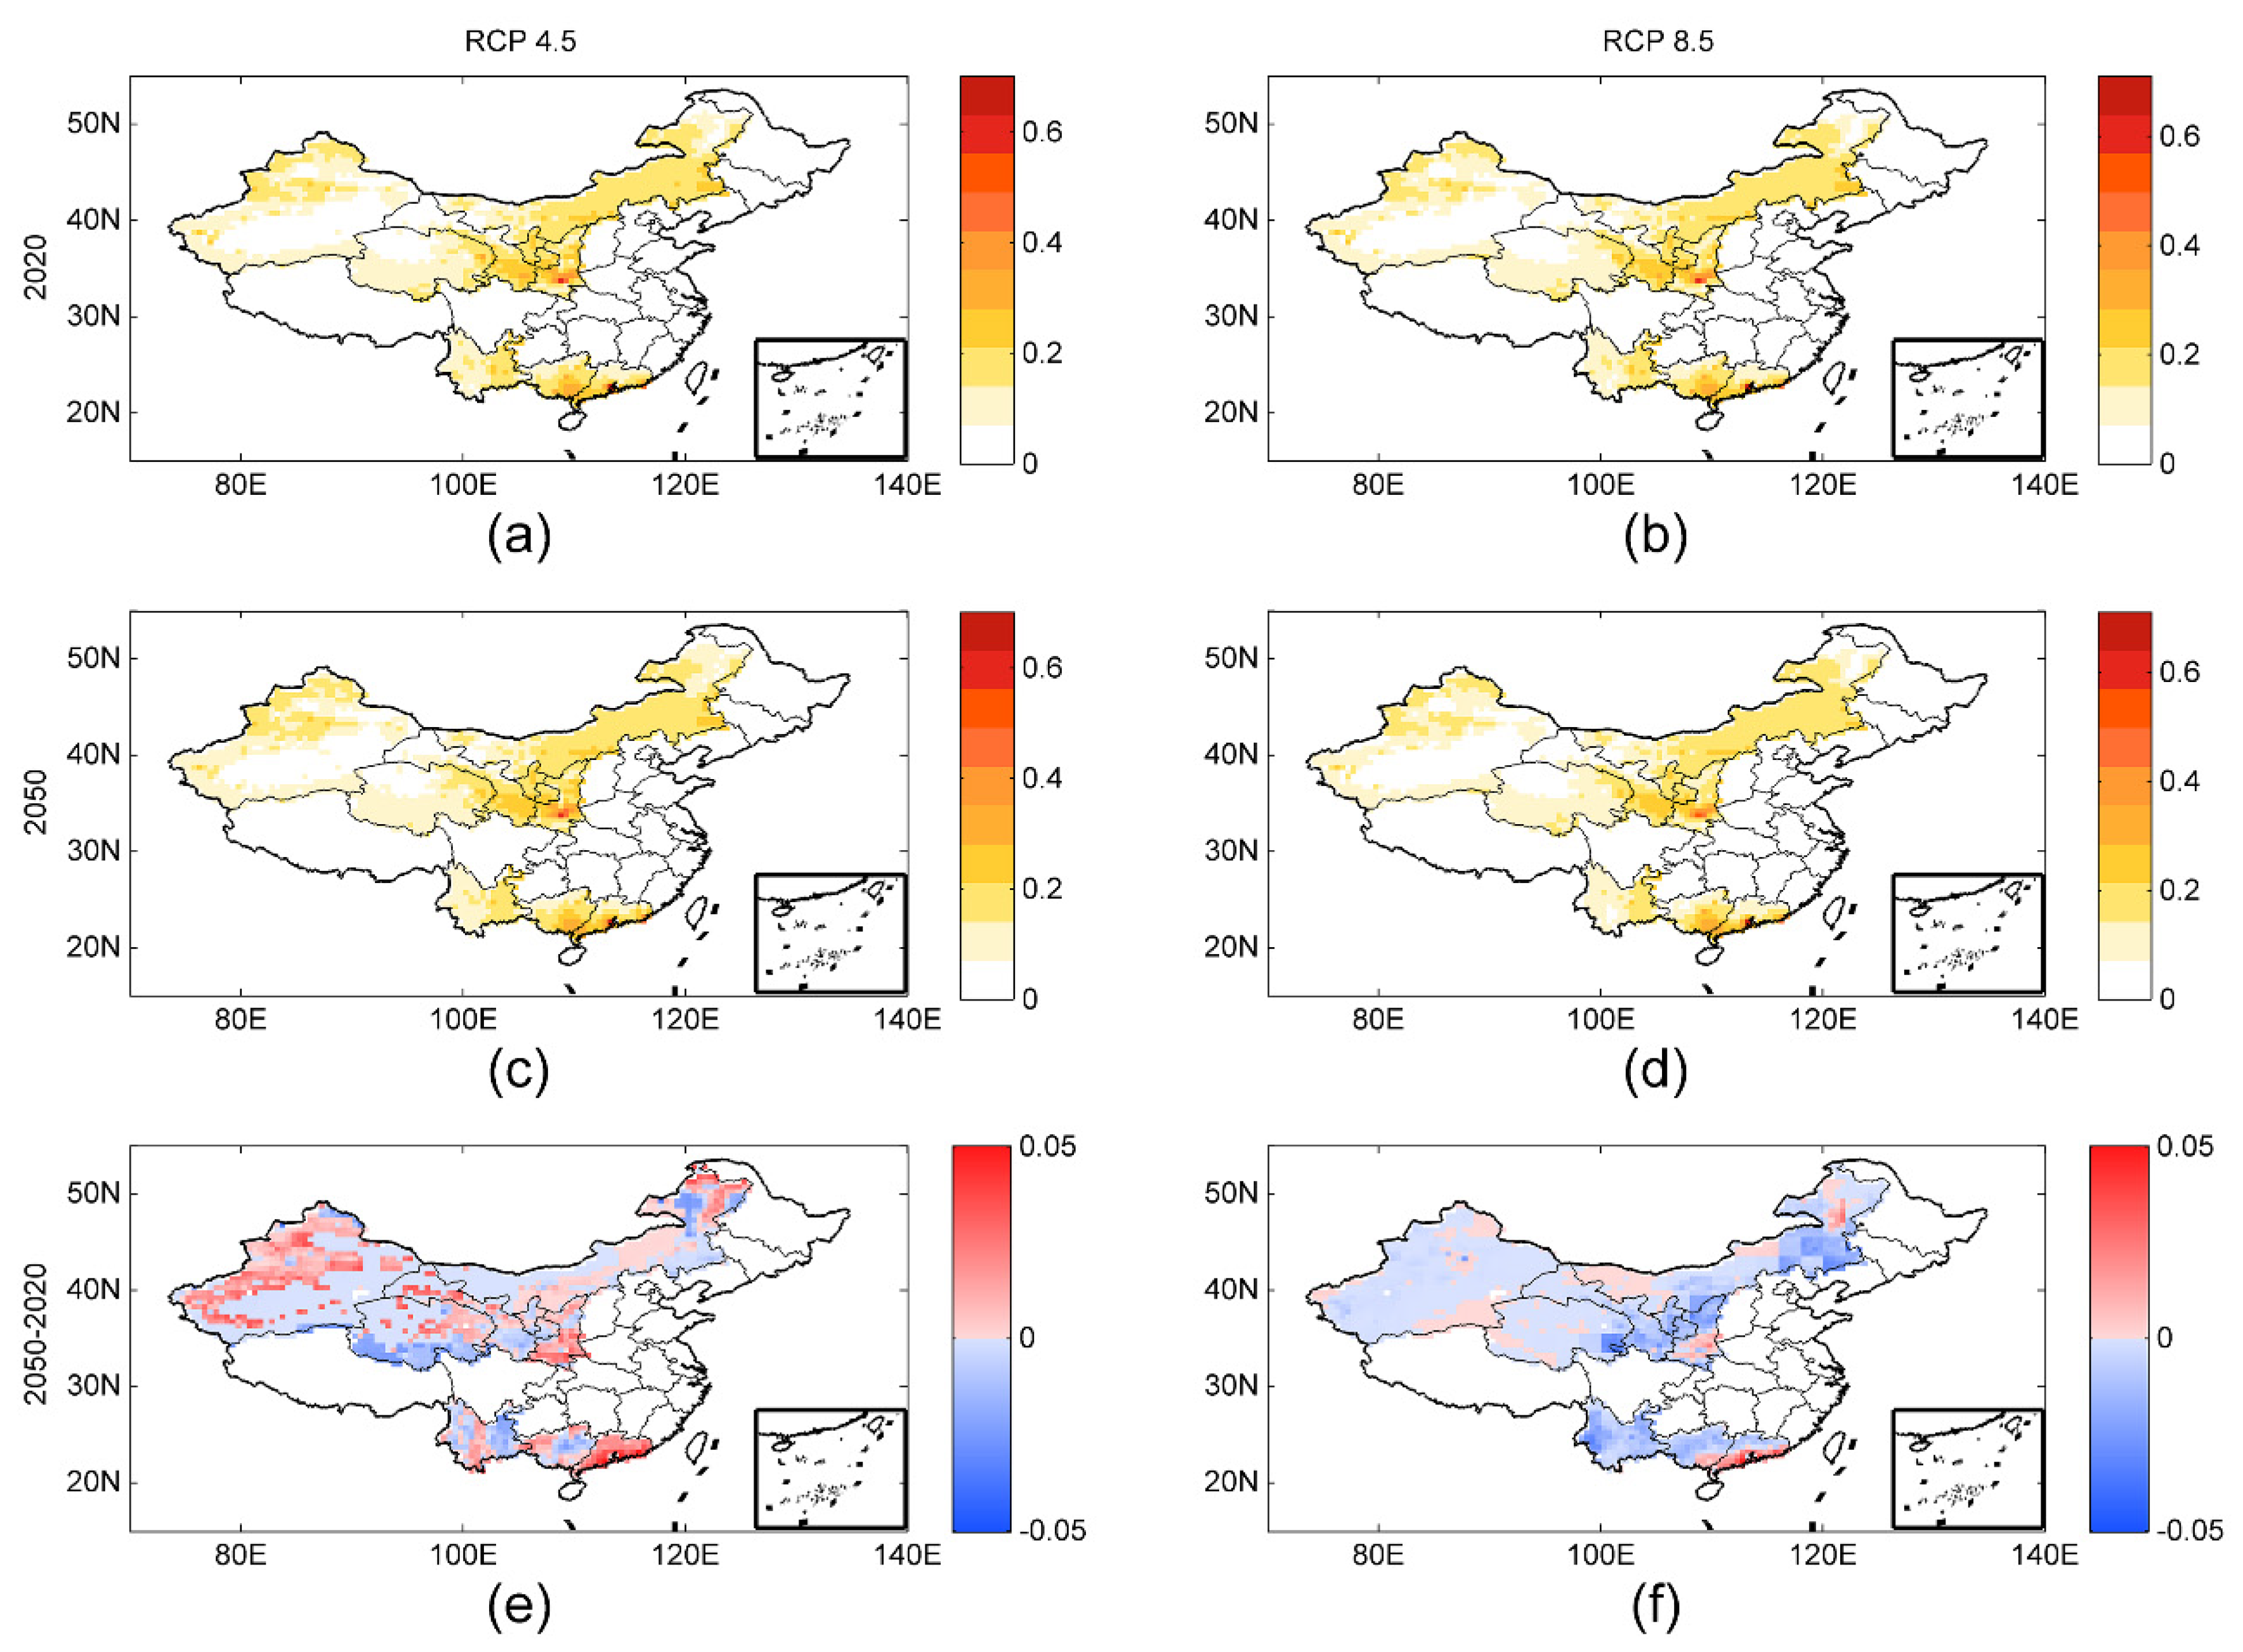
Figure 4 shows the geographic pattern of ecological vulnerability over a 30-year period. Interestingly, the spatial patterns in the hazard changes are similar between the two scenarios. The most ecologically vulnerable areas are concentrated in the Inner Mongolian Plateau (Figure 4a–d). To determine where the changes will be the greatest relative to the first half of the 21st century, two typical years of 2020 and 2050 were selected in this study (Figure 4e,f). The risk area is predicted to be distributed in most regions under the two emissions scenarios (RCP 4.5 and RCP 8.5).
4.2.3. Estimation of Future Exposure
Figure 5 shows a crude index of exposure risk. This is an index of population, GDP, crop and pasture. The data were calculated at a spatial resolution of 0.5° × 0.5°. The Loess Plateau and southern coastal area are highly exposed to drought (Figure 5a–d). Figure 5e,f clearly show that excessive carbon dioxide emissions will expose more areas to drought earlier. Regarding the emissions scenarios, exposure to the high-exposure Loess Plateau and southern coastal area will increase continuously.
5. Conclusions and Discussion
Projections of future drought risk estimation are usually associated with multiple sources of uncertainty inherent in climate model predictions, emissions scenarios, land use, economic demographics, and generally unpredictable social, technological and environmental changes. Recognizing this uncertainty, we simulate the risk of drought under different emissions scenarios.
We learned that there are limits to validating an index because the risk system is not a quantitatively measurable variable from some points of view. In this sense, the purpose of the study was to determine the main risk comparisons, especially in the most critical areas. Thus, the variables were listed to determine the logical relation between what they reflect and the occurrence of disasters studied.
Under the RCP 8.5 emissions scenario, the hazard in Cainozoic vulnerable eco-regions and exposure in most study areas will increase until 2050, which means that the risk levels that should only have been reached in 2050 may now occur before 2020, compared to the RCP 4.5 emissions scenario. Ignoring the emissions scenario, the vulnerability shows a similar spatial pattern—the vulnerability of most vulnerable eco-regions will increase.
The risk index results satisfactorily demonstrate that there are many vulnerable eco-regions that are at a high risk of drought. Traditionally vulnerable eco-regions have always maintained high hazard risks in both historical and future periods. Moreover, the Junggar Basin and Inner Mongolia Plateau are highly vulnerable to drought, which may trigger devastating disasters due to the low resilience of these areas. The vulnerability is often deteriorated due to the land use dynamics in risky areas; it is worth noting that the Loess Plateau and the southern coastal areas are severely exposed to drought, and even if the droughts in these areas are not severe, they will suffer more disaster losses once disasters occur.
Therefore, a complete risk management program must include a fine-scale analysis of the risks to which certain ecological components and society are exposed, allowing for the development of measures to prevent and reduce the risks related to this exposure. Considering that the most suitable measures to reduce risk occur locally, the information provided and generated by this work at the regional level will help to identify financial resources for the preparation of locations that are considered critical to mitigate imminent effects.
The combination of modes indicates the importance of public policies to be implemented in the near future. In addition, it is of great importance to support long-term drought mitigation measures to relieve drought and consider the drought management stages of monitoring, early warning, mitigation, response, and recovery. Thus, it is recommended to adopt preparatory adaptive measures for future drought risk management planning strategies, especially in vulnerable eco-regions, to respond to future drought conditions.
Author Contributions
Conceptualization, J.C.; data curation, T.X. and R.Z.; formal analysis, J.C. and T.X.; funding acquisition, J.C.; investigation, T.X.; methodology, T.X.; project administration, J.C.; resources, T.X.; software, R.Z.; supervision, J.C., Y.X., F.Y. and M.S.; writing—original draft, T.X.; writing—review & editing, J.C.
Funding
This work was supported by National Key Research and Development Program of China (grant 2018YFC1509003), National Key Research and Development Program of China (grant 2016YFA0602703), National Natural Science Foundation of China (grant 41575001), Skate Key Laboratory of Earth Surface Processes and Resource Ecology Project (2017-FX-03), and Supported Scientific Research Foundation Beijing Normal University (2015KJJCA14).
Acknowledgments
Thanks to the “American Journal Experts” for helping us to polish this article.
Conflicts of Interest
No conflict of interest exits in the submission of this manuscript, and manuscript is approved by all authors for publication.
Appendix A

Table A1.
The Uncertainty of the MRI-CGCM3 by the Historical (1966–2005) Period.
| Statistics | Pr (mm mon−1) | Evaporation (mm mon−1) | T (°C) | ||||||
|---|---|---|---|---|---|---|---|---|---|
| Observation | MRI-CGCM3 | Error | Observation | MRI-CGCM3 | Error | Observation | MRI-CGCM3 | Error | |
| Mean | 70.8258 | 58.2089 | −20.6169 | 12.1496 | 45.3955 | 33.2459 | 11.6572 | 6.0697 | −5.5875 |
| median | 61.4500 | 47.1123 | −14.3377 | 11.3837 | 38.9522 | 27.5685 | 12.8151 | 6.9891 | −5.826 |
| Mode | 1.3905 | 7.7494 | 6.3589 | 2.2233 | 15.3962 | 13.1729 | −6.0305 | −12.9264 | −6.8959 |
| Standard deviation | 48.1565 | 37.5733 | −0.5831 | 6.4183 | 20.8258 | 14.4075 | 9.3843 | 10.6533 | 1.269 |
References
- Chou, J.; Xian, T.; Dong, W.; Xu, Y. Regional Temporal and Spatial Trends in Drought and Flood Disasters in China and Assessment of Economic Losses in Recent Years. Sustainability 2019, 11, 55. [Google Scholar] [CrossRef]
- Mishra, A.K.; Singh, V.P. A review of drought concepts. J. Hydrol. 2010, 391, 204–216. [Google Scholar] [CrossRef]
- Wu, H.; Wilhite, D.A. An operational agricultural drought risk assessment model for Nebraska, USA. Nat. Hazards 2004, 33, 1–21. [Google Scholar] [CrossRef]
- Xie, Z.; Xu, J.; Deng, Y. Risk analysis and evaluation of agricultural drought disaster in the major grain-producing areas, China. Geomat. Nat. Hazards Risk 2016, 7, 1691–1706. [Google Scholar] [CrossRef]
- Zhang, Q.; Hu, Z. Assessment of drought during corn growing season in Northeast China. Theor. Appl. Climatol. 2018, 133, 1315–1321. [Google Scholar] [CrossRef]
- Passioura, J.B. Roots and Drought Resistance. Agric. Water Manag. 1983, 7, 265–280. [Google Scholar] [CrossRef]
- Rind, D.; Goldberg, R.; Hansen, J.; Rosenzweig, C.; Ruedy, R. Potential Evapotranspiration and the Likelihood of Future Drought. J. Geophys. Res.-Atmos. 1990, 95, 9983–10004. [Google Scholar] [CrossRef]
- Adger, W.N. Social vulnerability to climate change and extremes in coastal Vietnam. World Dev. 1999, 27, 249–269. [Google Scholar] [CrossRef]
- Hewitt, K. Seismic Risk And Mountain Environments—The Role of Surface Conditions in Earthquake Disaster. Mt. Res. Dev. 1983, 3, 27–44. [Google Scholar] [CrossRef]
- Gregoric, G.; Susnik, A. Drought Management Centre for South Eastern Europe. In Global Environmental Change: Challenges to Science and Society in Southeastern Europe; Springer: Berlin, Germany, 2010; pp. 237–242. [Google Scholar]
- Kelman, I. Linking disaster risk reduction, climate change, and the sustainable development goals. Disaster Prev. Manag. 2017, 26, 254–258. [Google Scholar] [CrossRef] [Green Version]
- Cheung, N.K.-W. At risk: Natural hazards, people’s vulnerability and disasters. Geogr. J. 2007, 173, 189–190. [Google Scholar] [CrossRef]
- Dilley, M. Setting priorities: Global patterns of disaster risk. Philos. Trans. R. Soc. A Math. Phys. Eng. Sci. 2006, 364, 2217–2229. [Google Scholar] [CrossRef] [PubMed]
- Liu, X.; Zhang, J.; Ma, D.; Bao, Y.; Tong, Z.; Liu, X. Dynamic risk assessment of drought disaster for maize based on integrating multi-sources data in the region of the northwest of Liaoning Province, China. Nat. Hazards 2013, 65, 1393–1409. [Google Scholar] [CrossRef]
- Zhang, J.-Q.; Zhang, Q.; Yan, D.-H.; Liu, X.-P.; Tong, Z.-J. A Study on Dynamic Risk Assessment of Maize Drought Disaster in Northwestern Liaoning Province, China. Beyond Exp. Risk Anal. Crisis Response 2011, 16, 196–206. [Google Scholar]
- Wilhite, D.A. Managing drought risk in a changing climate. Climate Res. 2016, 70, 99–102. [Google Scholar] [CrossRef]
- Jenkins, K. Indirect economic losses of drought under future projections of climate change: A case study for Spain. Nat. Hazards 2013, 69, 1967–1986. [Google Scholar] [CrossRef]
- Young, G.; Zavala, H.; Wandel, J.; Smit, B.; Salas, S.; Jimenez, E.; Fiebig, M.; Espinoza, R.; Diaz, H.; Cepeda, J. Vulnerability and adaptation in a dryland community of the Elqui Valley, Chile. Clim. Chang. 2010, 98, 245–276. [Google Scholar] [CrossRef]
- Najafi, M.R.; Moradkhani, H. A hierarchical Bayesian approach for the analysis of climate change impact on runoff extremes. Hydrol. Process. 2014, 28, 6292–6308. [Google Scholar] [CrossRef]
- Taylor, K.E.; Stouffer, R.J.; Meehl, G.A. An Overview of Cmip5 and the Experiment Design. Bull. Am. Meteorol. Soc. 2012, 93, 485–498. [Google Scholar] [CrossRef]
- Sillmann, J.; Kharin, V.V.; Zhang, X.; Zwiers, F.W.; Bronaugh, D. Climate extremes indices in the CMIP5 multimodel ensemble: Part 1. Model evaluation in the present climate. J. Geophys. Res. Atmos. 2013, 118, 1716–1733. [Google Scholar] [CrossRef]
- Hurtt, G.C.; Chini, L.P.; Frolking, S.; Betts, R.A.; Feddema, J.; Fischer, G.; Fisk, J.P.; Hibbard, K.; Houghton, R.A.; Janetos, A.; et al. Harmonization of land-use scenarios for the period 1500–2100: 600 Years of global gridded annual land-use transitions, wood harvest, and resulting secondary lands. Clim. Chang. 2011, 109, 117–161. [Google Scholar] [CrossRef]
- Moss, R.H.; Edmonds, J.A.; Hibbard, K.A.; Manning, M.R.; Rose, S.K.; van Vuuren, D.P.; Carter, T.R.; Emori, S.; Kainuma, M.; Kram, T.; et al. The next generation of scenarios for climate change research and assessment. Nature 2010, 463, 747–756. [Google Scholar] [CrossRef] [PubMed]
- Gruebler, A.; O’Neill, B.; Riahi, K.; Chirkov, V.; Goujon, A.; Kolp, P.; Prommer, I.; Scherbov, S.; Slentoe, E. Regional, national, and spatially explicit scenarios of demographic and economic change based on SRES. Technol. Forecast. Soc. Chang. 2007, 74, 980–1029. [Google Scholar] [CrossRef]
- Hawkins, E.; Sutton, R. The potential to narrow uncertainty in projections of regional precipitation change. Clim. Dyn. 2011, 37, 407–418. [Google Scholar] [CrossRef]
- Smirnov, O.; Zhang, M.; Xiao, T.; Orbell, J.; Lobben, A.; Gordon, J. The relative importance of climate change and population growth for exposure to future extreme droughts. Clim. Chang. 2016, 138, 41–53. [Google Scholar] [CrossRef] [Green Version]
- Davin, E.L.; de Noblet-Ducoudre, N. Climatic Impact of Global-Scale Deforestation: Radiative versus Nonradiative Processes. J. Clim. 2010, 23, 97–112. [Google Scholar] [CrossRef]
- Wen, Q.H.; Zhang, X.; Xu, Y.; Wang, B. Detecting human influence on extreme temperatures in China. Geophys. Res. Lett. 2013, 40, 1171–1176. [Google Scholar] [CrossRef]
- Blaikie, P.; Cannon, T.; Davis, I.; Wisner, B. ClineCole. In At risk: Natural Hazards, People’s Vulnerability and Disasters; Routledge: Abingdon, UK, 1997; Volume 21, pp. 185–186. [Google Scholar]
- Ding, A.J.; Huang, X.; Nie, W.; Sun, J.N.; Kerminen, V.M.; Petaja, T.; Su, H.; Cheng, Y.F.; Yang, X.Q.; Wang, M.H.; et al. Enhanced haze pollution by black carbon in megacities in China. Geophys. Res. Lett. 2016, 43, 2873–2879. [Google Scholar] [CrossRef]
- Buckley, J.J. Fuzzy-Programming and the Pareto Optimal Set. Fuzzy Sets Syst. 1983, 10, 57–63. [Google Scholar] [CrossRef]
- Lee, A.H.I.; Chen, W.-C.; Chang, C.-J. A fuzzy AHP and BSC approach for evaluating performance of IT department in the manufacturing industry in Taiwan. Expert Syst. Appl. 2008, 34, 96–107. [Google Scholar] [CrossRef]
- Kaya, T.; Kahraman, C. An integrated fuzzy AHP-ELECTRE methodology for environmental impact assessment. Expert Syst. Appl. 2011, 38, 8553–8562. [Google Scholar] [CrossRef]
- Schimel, D.S.; Braswell, B.H.; Holland, E.A.; McKeown, R.; Ojima, D.S.; Painter, T.H.; Parton, W.J.; Townsend, A.R. Climatic, Edaphic, and Biotic Controls over Storage and Turnover of Carbon in Soils. Glob. Biogeochem. Cycles 1994, 8, 279–293. [Google Scholar] [CrossRef]
- Schimel, D.; Melillo, J.; Tian, H.Q.; McGuire, A.D.; Kicklighter, D.; Kittel, T.; Rosenbloom, N.; Running, S.; Thornton, P.; Ojima, D.; et al. Contribution of increasing CO2 and climate to carbon storage by ecosystems in the United States. Science 2000, 287, 2004–2006. [Google Scholar] [CrossRef]
- Qian, H.; Joseph, R.; Zeng, N. Enhanced terrestrial carbon uptake in the Northern High Latitudes in the 21st century from the Coupled Carbon Cycle Climate Model Intercomparison Project model projections. Glob. Chang. Biol. 2010, 16, 641–656. [Google Scholar] [CrossRef]
- Shao, P.; Zeng, X.; Sakaguchi, K.; Monson, R.K.; Zeng, X. Terrestrial Carbon Cycle: Climate Relations in Eight CMIP5 Earth System Models. J. Clim. 2013, 26, 8744–8764. [Google Scholar] [CrossRef]
- Farquhar, G.D.; Caemmerer, S.V.; Berry, J.A. A Biochemical-Model of Photosynthetic CO2 Assimilation in Leaves of C-3 Species. Planta 1980, 149, 78–90. [Google Scholar] [CrossRef]
- Ryan, M.G. Effects of Climate Change on Plant Respiration. Ecol. Appl. 1991, 1, 157–167. [Google Scholar] [CrossRef]
- Thum, T.; Raisanen, P.; Sevanto, S.; Tuomi, M.; Reick, C.; Vesala, T.; Raddatz, T.; Aalto, T.; Jarvinen, H.; Altimir, N.; et al. Soil carbon model alternatives for ECHAM5/JSBACH climate model: Evaluation and impacts on global carbon cycle estimates. J. Geophys. Res.-Biogeosci. 2011, 116. [Google Scholar] [CrossRef] [Green Version]
- Yin, Y.; Ma, D.; Wu, S. Climate change risk to forests in China associated with warming. Sci. Rep. 2018, 8, 493. [Google Scholar] [CrossRef]
- Cabrera Cabrera, J.W.; Castillo Navarro, L.F. Climate change and debris flow: Hazards maps in Matucana village Peru under IPCC scenarios. Hydrology In a Changing World: Environmental And Human Dimensions. Proceeding of the FRIEND-Water 2014, Montpellier, France, 11 September 2014; 363, pp. 234–238. [Google Scholar]
- Mainali, J.; Pricope, N.G. High-resolution spatial assessment of population vulnerability to climate change in Nepal. Appl. Geogr. 2017, 82, 66–82. [Google Scholar] [CrossRef]
- Yin, S.; Sun, C.; Li, J. Determinants of Disaster Risk and Disaster Risk Management. Progress. Inquisitiones Mutatione Clim. 2012, 8, 84–89. [Google Scholar]
- Yuan, W. Diurnal cycles of precipitation over subtropical China in IPCC AR5 AMIP simulations. Adv. Atmos. Sci. 2013, 30, 1679–1694. [Google Scholar] [CrossRef]
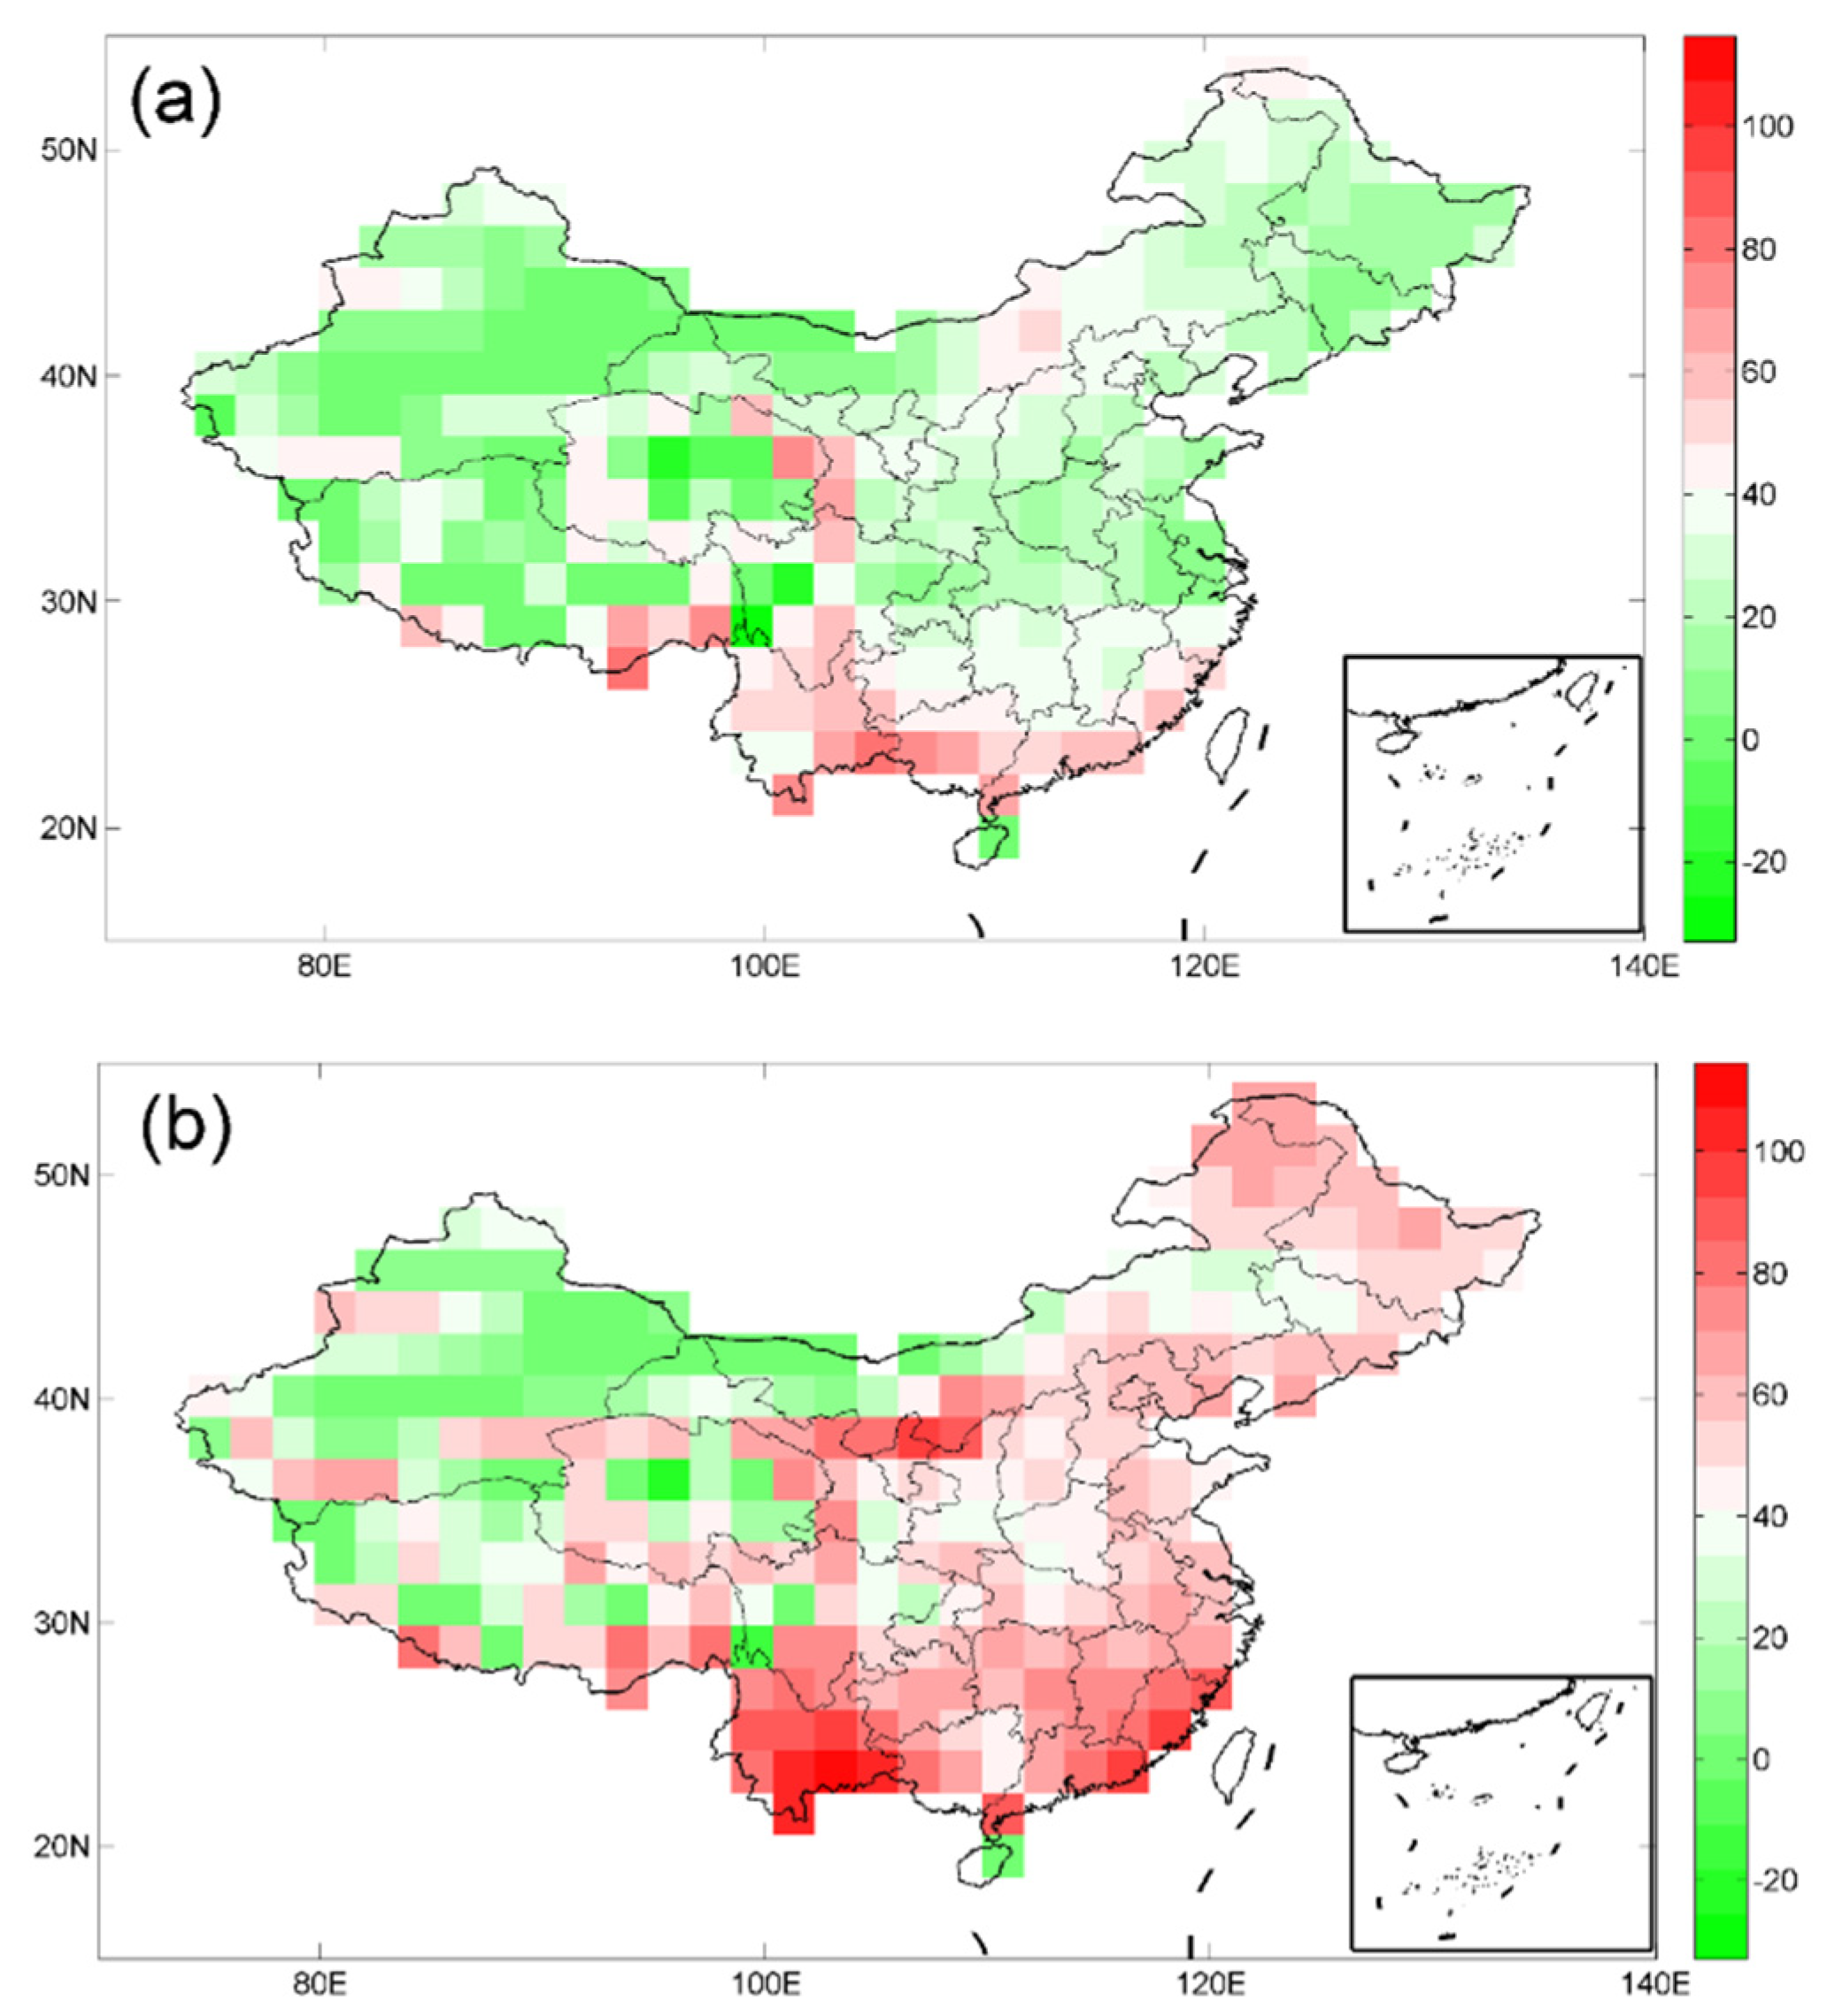
Figure 1.
Distribution of future (2021–2050) net primary productivity (unit: kg m−2 s−1) changes under different emissions scenarios (a) RCP 4.5 (b) RCP 8.5 (based on 1988–2017). A greener (or redder) grid indicates an improvement (or worsening) of the ecological environment.
Figure 1.
Distribution of future (2021–2050) net primary productivity (unit: kg m−2 s−1) changes under different emissions scenarios (a) RCP 4.5 (b) RCP 8.5 (based on 1988–2017). A greener (or redder) grid indicates an improvement (or worsening) of the ecological environment.

Figure 2.
Drought risk assessment during the historical period (1988–2017): (a) Hazard, (b) vulnerability, and (c) exposure.
Figure 2.
Drought risk assessment during the historical period (1988–2017): (a) Hazard, (b) vulnerability, and (c) exposure.

Figure 3.
Risk estimates and changes in hazards in the future under different emissions scenarios. (a,b) and (c,d) describes the distribution of hazards in 2020 and 2050, respectively. In (e,f), the red grids indicate an increased hazard risk, and the blue grids indicate the opposite.
Figure 3.
Risk estimates and changes in hazards in the future under different emissions scenarios. (a,b) and (c,d) describes the distribution of hazards in 2020 and 2050, respectively. In (e,f), the red grids indicate an increased hazard risk, and the blue grids indicate the opposite.

Figure 4.
Risk estimates and changes in future vulnerability under different emissions scenarios. (a,b) and (c,d) describes the distribution of vulnerability in 2020 and 2050, respectively. In (e,f), the red grids represent an increase in vulnerability risk, while the blue grids represent the opposite.

Figure 5.
Risk estimates and changes in future exposures under different emissions scenarios. (a,b) and (c,d) describes the distribution of exposures in 2020 and 2050, respectively. In (e,f), the red grids represent an increase in exposure risk, and the blue grids represent the opposite.
Figure 5.
Risk estimates and changes in future exposures under different emissions scenarios. (a,b) and (c,d) describes the distribution of exposures in 2020 and 2050, respectively. In (e,f), the red grids represent an increase in exposure risk, and the blue grids represent the opposite.

Table 1.
Sources of drought risk assessment data.
| Types | Index Name | Historical Period | Source |
|---|---|---|---|
| Meteorological data | Temperature, precipitation, etc. | 1988–2017 | National Meteorological Information Center |
| Social statistics | Population, GDP, etc. | 1988–2017 | China Statistical Yearbook |
Table 2.
Sources of drought risk estimates.
| Model | Index Name | Horizontal Resolution (Lat Lon) | Selected References |
|---|---|---|---|
| MRI-CGCM3 | Temperature, precipitation, evaporation | 1.125° 1.125° | Sillmann et al., 2013 [21] |
| Global Land-Use Models (GLMs) | Crop, pasture, primary land, second land, urban | 0.5° 0.5° | Hurtt et al., 2011 [22] Moss et al., 2010 [23] |
| International Institute for Applied System Analysis (IIASA) | Population, GDP | 0.5° 0.5° | Grubler et al., 2007 [24] Hawkins et al., 2011 [25] |
Table 3.
Average random consistency indicator .
| 1 | 2 | 3 | 4 | 5 | 6 | 7 | 8 | 9 | |
|---|---|---|---|---|---|---|---|---|---|
| 0.00 | 0.00 | 0.58 | 0.90 | 1.12 | 1.24 | 1.32 | 1.41 | 1.45 |
Table 4.
Main risk factors by region.
| Province | Main Risk Factors | |
|---|---|---|
| Gansu | Hazard | Vulnerability |
| Ningxia | Hazard | Vulnerability |
| Inner Mongolia | Hazard | Exposure |
| Xinjiang | Hazard | Vulnerability |
| Guangdong | Vulnerability | Exposure |
| Qinghai | Hazard | |
| Shanxi | Vulnerability | |
| Guangxi | Exposure | |
| Yunnan | Exposure | |
© 2019 by the authors. Licensee MDPI, Basel, Switzerland. This article is an open access article distributed under the terms and conditions of the Creative Commons Attribution (CC BY) license (http://creativecommons.org/licenses/by/4.0/).
Share and Cite
MDPI and ACS Style
Chou, J.; Xian, T.; Zhao, R.; Xu, Y.; Yang, F.; Sun, M. Drought Risk Assessment and Estimation in Vulnerable Eco-Regions of China: Under the Background of Climate Change. Sustainability 2019, 11, 4463. https://doi.org/10.3390/su11164463
AMA Style
Chou J, Xian T, Zhao R, Xu Y, Yang F, Sun M. Drought Risk Assessment and Estimation in Vulnerable Eco-Regions of China: Under the Background of Climate Change. Sustainability. 2019; 11(16):4463. https://doi.org/10.3390/su11164463
Chicago/Turabian StyleChou, Jieming, Tian Xian, Runze Zhao, Yuan Xu, Fan Yang, and Mingyang Sun. 2019. "Drought Risk Assessment and Estimation in Vulnerable Eco-Regions of China: Under the Background of Climate Change" Sustainability 11, no. 16: 4463. https://doi.org/10.3390/su11164463
Note that from the first issue of 2016, this journal uses article numbers instead of page numbers. See further details here.