A Systemic Design Method to Approach Future Complex Scenarios and Research Towards Sustainability: A Holistic Diagnosis Tool


Politecnico di Torino, Department of Architecture and Design, Viale Pier Andrea Mattioli, 39, 10125 Torino, Italy
*
Author to whom correspondence should be addressed.
Sustainability 2019, 11(16), 4458; https://doi.org/10.3390/su11164458
Submission received: 25 June 2019
/
Revised: 5 August 2019
/
Accepted: 9 August 2019
/
Published: 17 August 2019
(This article belongs to the Section Sustainable Engineering and Science)
Abstract
:This article aims to frame the role of Systemic Design (SD) as an alternative design model for the future of design for sustainability, by defining and assessing a structured process to execute Holistic Diagnosis (HD), an innovative context framework. Taking as its background a deep understanding of the design for sustainability and systems thinking concepts that frame SD as a field where HD is rooted, multiple case-study analyses were performed. HD demonstrates its ability to overcome the design boundaries in different fields such as industrial production, local communities, and policy-making, thereby providing a more in-depth understanding of complex environments with an iterative process: assess, research, collect, visualize, and interpret. This framework is a relevant tool for designers to address problem framing in complex scenarios to obtain future sustainable solutions with an innovative and transdisciplinary approach, thereby promoting a horizontal dialogue among all involved components.
1. Introduction
More than ever before, nations today are experiencing erratic disruptions, which are correlated to climate change, economic inequalities, and war, exacerbating more and more what are known as irresolvable “wicked problems” [1]. The wide complexity of these problems is defined by multiple interconnections and interdependences, involving different factors [2]. How can we navigate such complexity to attain a sustainable and resilient future? What strategies must communities, governments, and industries address towards enabling resilient territories and ensuring the future of natural and social resources?
The first step towards such sustainable livelihoods comes from paradigm shifts: discoveries in physics—quantum theories—have permitted the transition from Cartesian and Newtonian mechanisms (a linear model) to a holistic and ecological view of life [3]. Kate Raworth has interpreted this phenomenon in economic terms as a change in the mentality of 21st-century economists. In this framework, a different economy must be embedded and based on a dynamic complexity, which is distributive and regenerative by design, created by adaptable social humans who have grown agnostic and stay inside the safe zone for humanity, which they consider the planetary boundaries that Raworth called the “doughnut” [4].
These approaches towards complexity and its wickedness are based on the statement that “Systemic and inter-connected problems need systemic and inter-connected solutions” [5]. Consequently, these problems require the participation of experts from diverse background disciplines to achieve innovative solutions. Facilitating possible dialogues among technicians, economists, humanists, and many more, the designer acquires a key role, which is underlined by his/her competences and high skills as a “mediator” [6,7]. For his/her capability as an expert in designing future scenarios [8], a transition in design discipline also takes place—from the limited perspective of product designer for the industry to a designer of complex systems collaborating with many other experts.
To be able to determine sustainable solutions for complex scenarios, Systemic Design (SD) expertise provides a method to tap into the holistic analysis of these contexts, allowing the design discipline an opportunity to create autopoietic open systems based on contextual assets. This article aims to frame the role of SD as an alternative design model and strategy for the future of design for sustainability, which is based on Holistic Diagnosis (HD). Due to the importance of this tool as an innovative context framework to obtain a holistic picture of the state-of-the-art and to determine advantages for change, this article defines and assesses a structured process to execute HD, taking as its background a deep understanding of the Design Thinking and Systems Thinking (ST) concepts, which frame the process to define it. This disruptive approach improves Design methodologies in the first phase of problem definition and research, making the HD a relevant tool for designers to address problems and framing complex scenarios within an innovative and transdisciplinary approach, thereby promoting a horizontal dialogue among all involved components. Ultimately, fostering synergies between disciplines like design, technology, economics, and sociology, which are fundamental for finding innovative and anticipatory solutions for holistic and complex changes.
SD has emerged as an approach to provide systemic and interconnected solutions to the complexity of the current situation, encompassing economic, environmental and social contexts. P.H. Jones, a relevant thinker about the SD discipline, understands SD as a merge between human-centred design and multi-stakeholder service system design, as its application has moved from artefacts and communication, products, and services, to organizational transformation and social transformation—four domains that have increased their complexity [9]. SD represents “an integrative interdiscipline with the potential to implement systems theory with creative methods and mindsets, by bringing deep technical knowledge, aesthetic skill, and creative implementation to the most abstract programmes of collective action” [10]. A systemic designer embodies traditional design competencies—form and process reasoning, social and generative research methods, and sketching and visualization practices—being, moreover, able to “describe, map, propose and reconfigure complex services and systems … (they view design as) … an advanced practice of rigorous research and form-giving methods, practices of critical reasoning and creative making, and of sub-disciplines and deep skillsets” [9].
Today, SD has a worldwide relevance. International research networks, such as the Systemic Design Research Network (SDRN) [11], have approached the topic since 2012, and the Systemic Design Association (SDA) [12] was created in 2018 and features the involvement of the Oslo School of Architecture and Design, Ontario College of Art and Design University in Toronto and Politecnico di Torino in Italy.
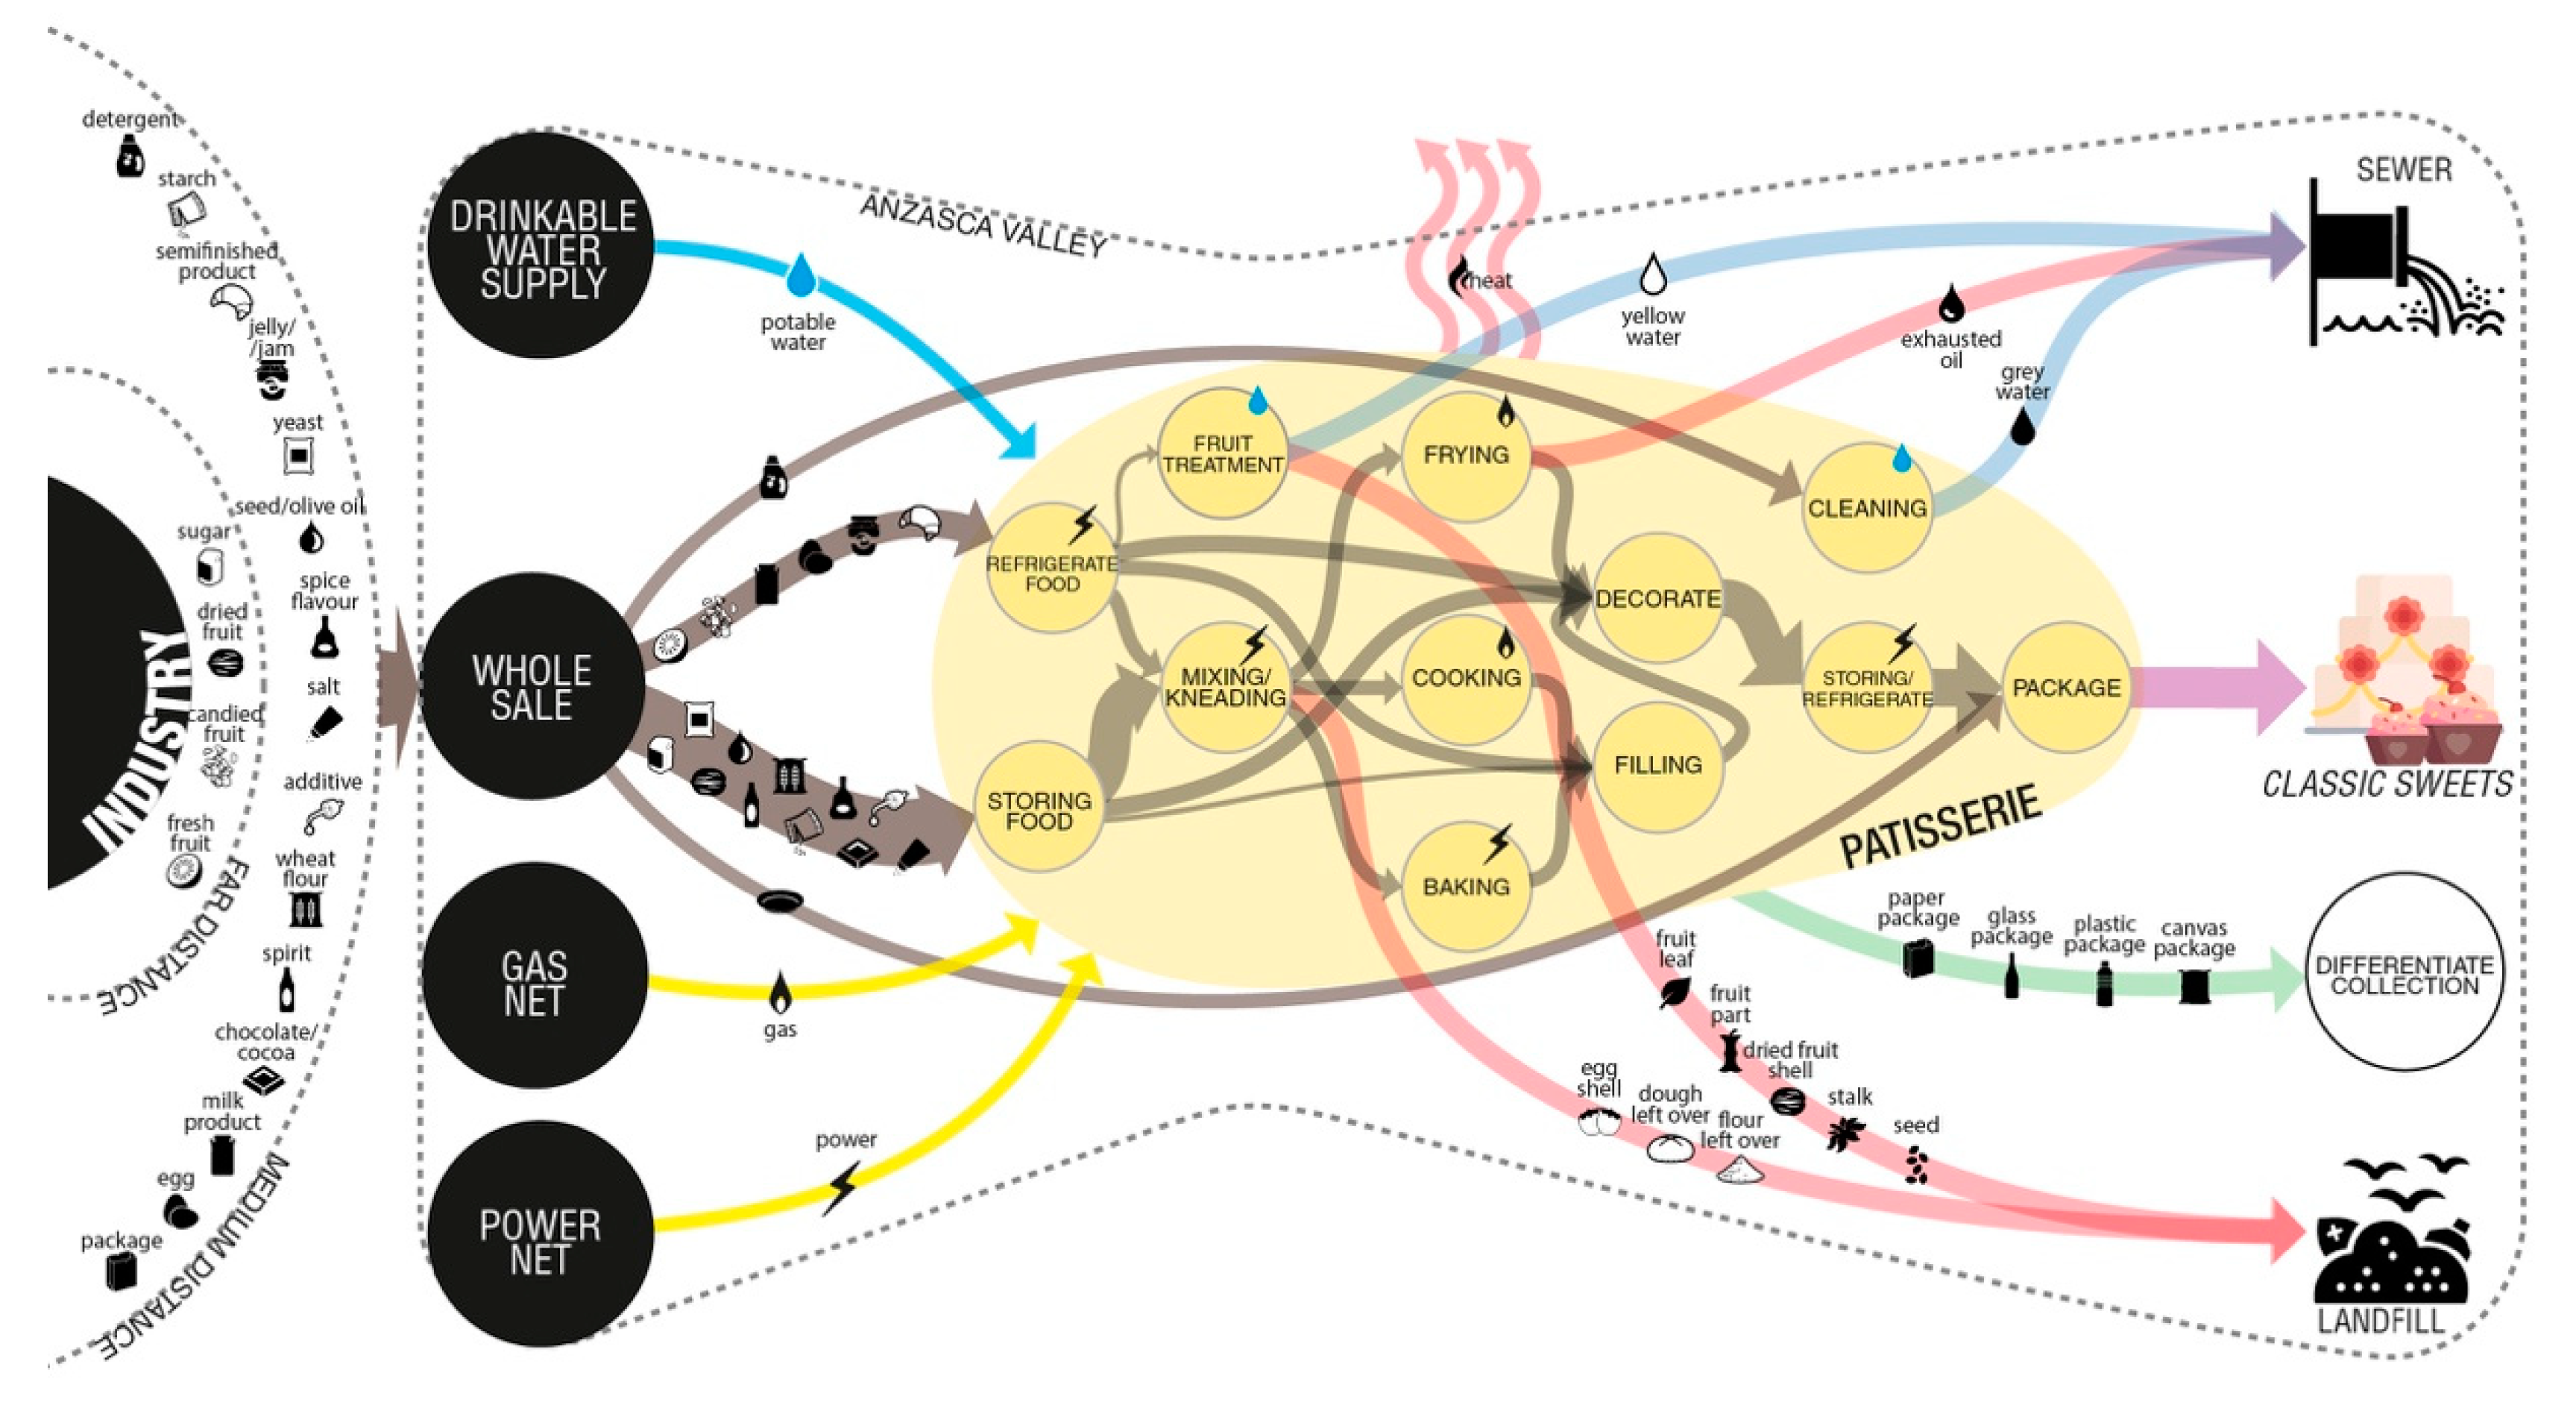
In the early 2000′s, a research group at the Department of Architecture and Design in Politecnico di Torino (Italy) (with the ZERI foundation [13]) developed a particular SD approach as a step forward for eco-design to reach a blue economy and Circular Economy. This group wanted to model production and energy systems after nature’s principles, primarily connecting their outputs and inputs to reach zero emissions in the air, water, and soil (Figure 1). SD’s main goal is to promote a paradigm shift, thereby providing a new way to act with:
- A change in the management of resources, improving production processes through a continuous transformation of matter, and
- To activate new relationships between subjects, producing a general wellness improvement in people [14].
This SD approach is developed around five guidelines [14]:
- Output–input: The output (waste) of a system becomes the input (resource) for another one;
- Relationships: These relationships generate the system;
- Autopoiesis: Self-producing systems sustain themselves by reproducing automatically, defining their own paths of action and coevolving together;
- Acting locally: The local context becomes fundamental because it values local resources (humans, cultures, and materials);
- Human at the centre of the project: A human being is considered connected to its environmental, social, cultural, and ethical context, and its needs become central in design requirements.
The use of this approach to design production processes has several positive outcomes [15]:
- Environmental: A lower consumption of local resources and the use of more sustainable production processes;
- Social: The creation of new jobs linked to the cultural and spatial places of belonging;
- Economic: The optimization of resources minimizes costs and increases the competitiveness of companies, as well as new business areas.
The SD methodology passes from the definition of the context to the design of a complex system. Its principal steps can be divided as follows ([16,17] (Figure 2)):
- Holistic diagnosis (HD) with field and desk research: An analysis and visualization of all the components that define the current scenario, considering both the surrounding context and the flow of energy and matter;
- Definition of problems and leverages for change: With the complex data collected in HD, it is possible to underline the criticalities and potentialities, and gather eco-guidelines, for the definition of new complex systems;
- Design of a system; the new production model: The goal is to obtain zero emissions. S system is created based on relationships between processes and actors, optimizing the energy and material flows and valorising the waste as resources;
- Study of the outcomes: Preliminary evaluation of the benefits given by the system at environmental, economic, and social level;
- Implementation: Realization of the system in the specific context and the evaluation of the feasibility of the new business plan;
- Analysis of the results and feedback: The inputs coming from the implementation improve the project and enable the discovery of new opportunities, making it autopoietic.
This methodology has gained relevance in multiple environments, especially in academia. It has been used in the Masters of science program in ‘Systemic design ‘Aurelio Peccei’’ since 2003–04 (before it was named ‘Ecodesign’) at the Design School of the Politecnico di Torino [17]. It is also uses in European projects (e.g., RETRACE Interreg Europe [18] and PROGIREG [19]) and collaborative studies with industries (e.g., Agrindustria Tecco s.r.l., Luigi Lavazza S.p.A., and Groupe Poult).
2. Materials and Methods
This article seeks to define and assess HD as a tool for systemic approaches in the design discipline and discusses a defined process for its execution based on HD’s previous definitions and applications in different contexts. To achieve these goals, the research method employed a three-stage approach: a literature review, an analysis of case studies with the inductive method, and a framework design. This process enables this study to move from a broader perspective to a narrower, more efficient result.
The literature review started with the scientific contributions to the design for sustainability that have framed the concept, in order to understand how the design process approaches complexity and how the ST has influenced them, thereby providing a taxonomy of the SD discipline. Afterwards, the research addressed, in detail, the potentialities of the HD tool questioned in this article. A literature review was conducted on the primary database to determine scientific contributions (Scopus), in order to find uses of the term “holistic diagnosis” and its application in the design discipline (this review was conducted in September 2018 and updated in August 2019). Moreover, the HD place was framed in the SD methodology developed in Politecnico di Torino to assess its importance and discuss a new framework to define a process to implement HD. To achieve this, previous attempts to define the typologies, processes, and tools among the research group in SD at Politecnico di Torino are reported to understand the evolution of the framework over time.
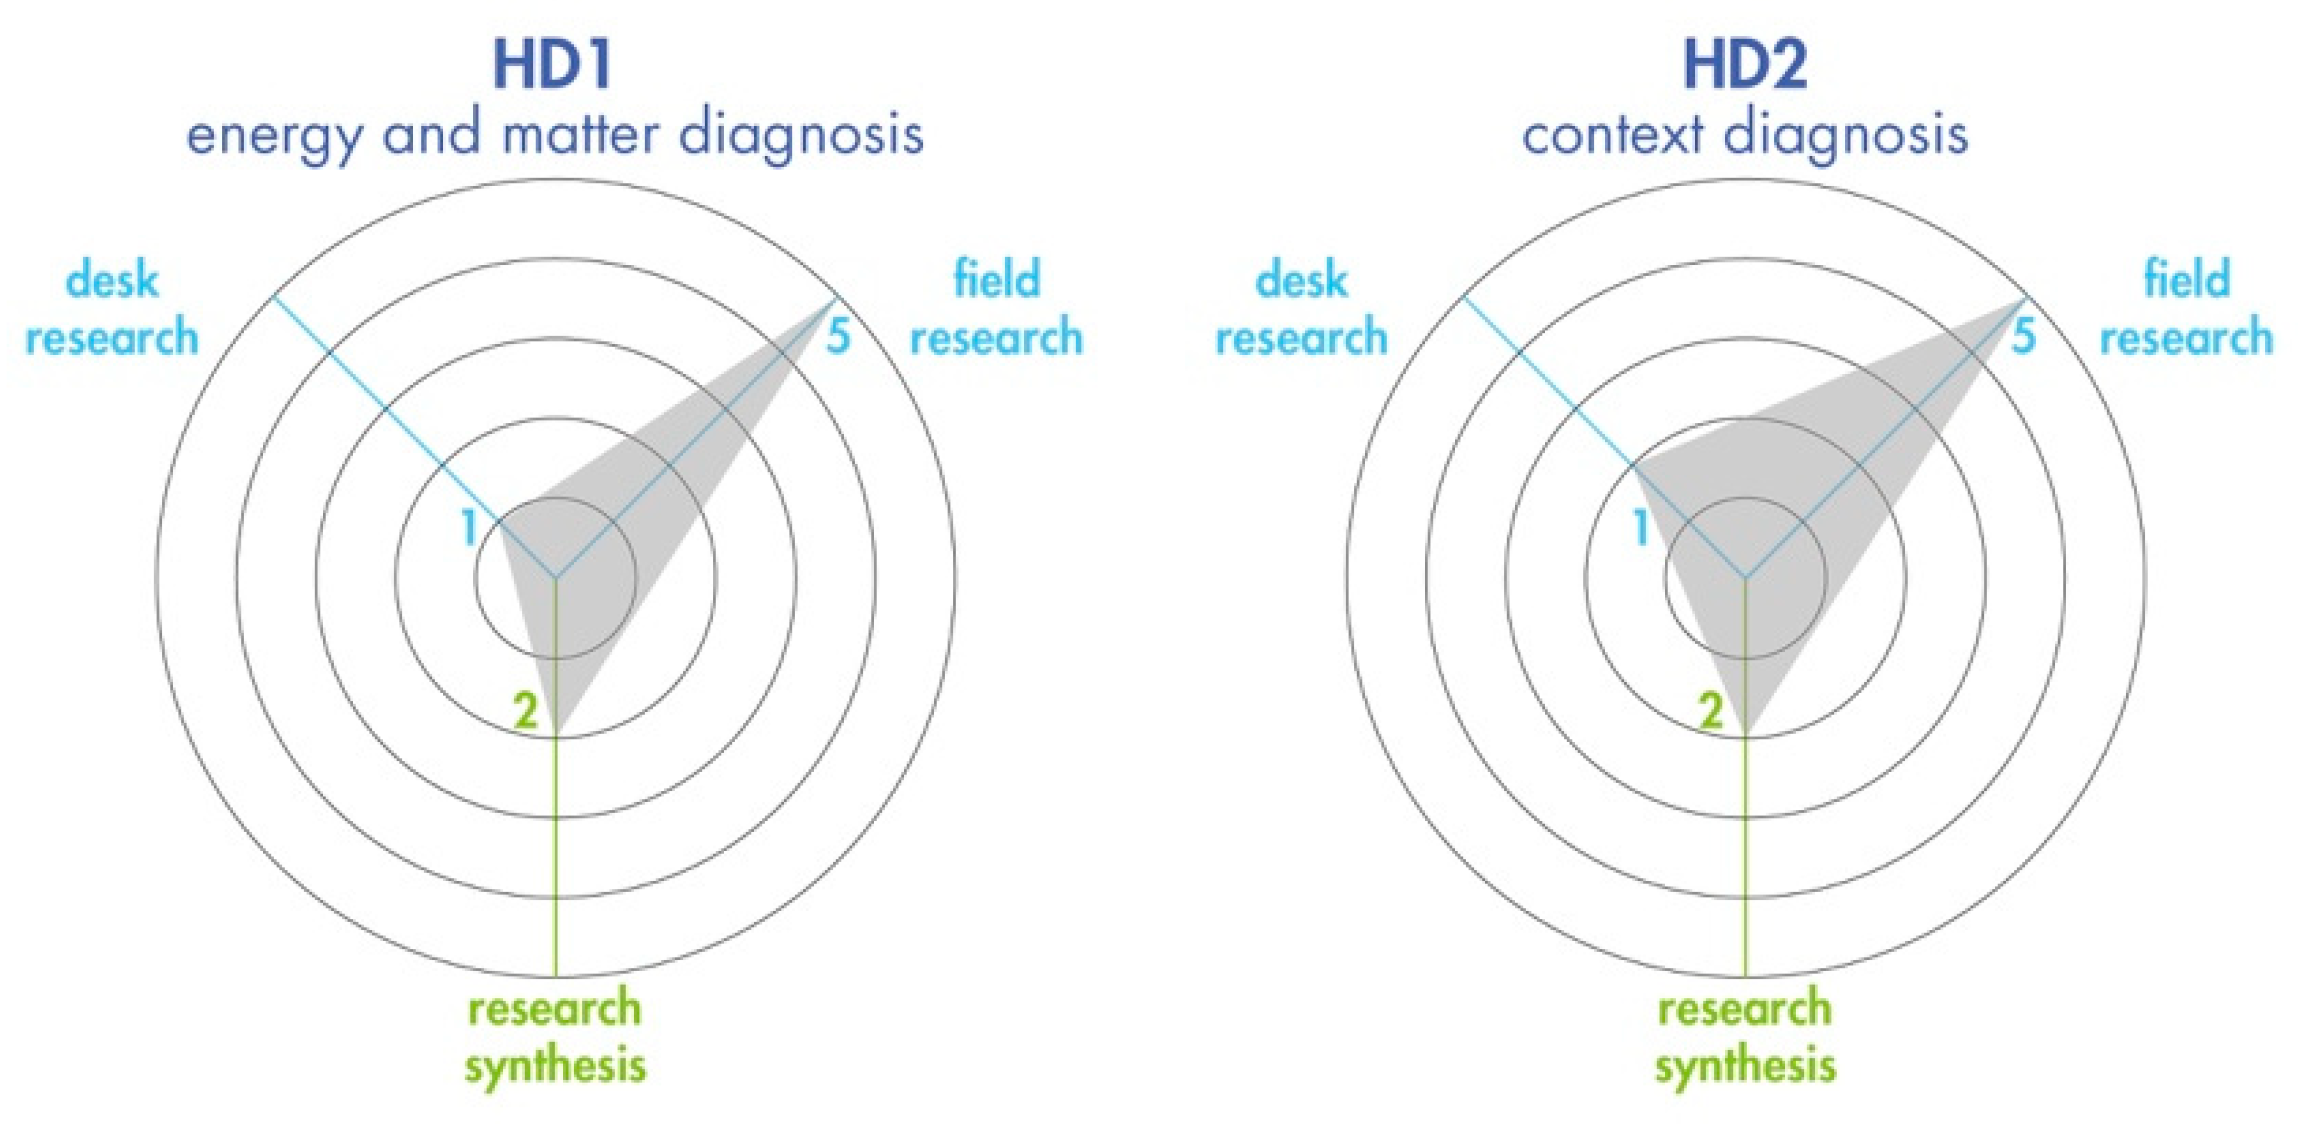
The second stage of the examination used a multiple case-study analysis [20]. To determine a basis to compare and relate SD practices across domains, three representative case studies extracted from SD projects were selected in the areas of study where the HD tool was applied: a project for industrial production, one involving local communities, and one addressing change in policy-making. The goal of both selected projects was to attain local circular and sustainable development. The purpose of the analysis was to determine how the HD process has been conducted in different groups of works approaching different topics underlying the barriers faced in process implementation. Moreover, radar graphs were used to evaluate, for each case study, the importance of every different stage involved in the HD process (desk research, field research, and research synthesis). This can also clarify how the HD tool changes depending on the topic to address and show how different contexts influenced challenges in implementing the SD approach.
3. Results
3.1. Taxonomy
Currently, sustainability is understood as a system of resilient relationships rather than a characteristic of individual components of systems [21]. As the world has become more interconnected, a desirable sustainable future has increased in complexity. This complexity is only visible through ‘wicked problems’. These challenges are portrayed as trivial or lasting situations that cannot be overcome immediately due to their inner complexity or exogenous/endogenous relations [10]. This prevailing complex scenario can only be approached through a process-based, multi-scale, and systemic approach [22]. Such a shift involves a radical transformation in how a human society operates and requires deep leverage for change from social, cultural institutional, and organizational perspectives [23,24].
Over the last few decades, design has continuously been related to different aspects of the sustainability dialogue and practice as a primary engine for innovation in our society on industry, local communities, and government [25,26,27,28]. The recent review presented by Ceschin and Gaziulusoy [21] describes the evolution of the design for sustainability: from product innovation to product–service system innovation to spatial–social innovation and socio–technical system innovation. This timeframe illustrates how design has evolved towards dematerialization and is approaching more closely to solutions for complex social, environmental, and even political problems, as suggested by Papanek [29]. During this transition, designers have expanded their field of action from a single user to communities as users, thereby becoming a more participatory discipline and delivering sustainable services and systems. This last part is synthesized by Buchanan [30], who has addressed the role of design practices to approach current wicked problems with the purpose of transitioning towards a more resilient, fair, and sustainable society.
Hence, more and more developments around design for sustainability have gained momentum, providing a different vision for the role of design. A visible manifestation of this vision is the manifesto of Danish designers, ‘Design for People, Profit, and Planet’, which proclaims the designer’s future role by balancing three interests for innovation and sustainable development and moving forward a concept considered contradictory in the past [31]. Consequently, the designer has changed its role, providing skills and capabilities for sustainability development [32].
Designers have been hailed by the current complexities as the ones with creative abilities and other skills to approach future scenarios and face current wicked problems. The designer’s approach to problem-solving refers to the designer’s ability to create frames. This is the result of dealing continuously with complex problems that have to encourage designers to create these frames [33]. The method for creating new frames allows a more comprehensible interpretation of complex situations in terms of themes, which are based on a process of analysis related to phenomenological methods [34]. A main outcome of this process will be solutions focusing on strategies. Tools like graphic visualization design expose all the components of complex scenarios, displaying different levels of interconnection that increase the number of interpretations for a context. Designers in this process seek to deliver a wider range of possibilities to generate other types of conversations on innovative approaches and problem solving. Involving the audience on a deeper level and changing their traditional roles as passive recipients into active participants that reach design conclusions allows the comprehension of innovative approaches by a wider audience where arguments can be seen from a bigger spectrum of perspectives [30].
Systems Thinking and Design
In the last half-century, the System Theory and the ST approaches have been integrated into design discipline. The major thinkers on ST, collected by Ramage and Shipp in 2009, agreed that “To make sense of the complexity of the world, we need to look at it regarding wholes and relationships rather than splitting it down into its parts and looking at each in isolation” [35] (p. 1). According to Capra [2], one of the most relevant authors on the topic, ST emerged between the 1920s and the 1930s because of the contributions of researchers in diverse disciplines, such as psychologists, biologists, and ecologists. However, researchers have agreed that the starting point of the ST movement was in the 1940s, with the appearance of the two schools of thoughts, the General Systems Theory [36] and Cybernetics [37]. Thanks to discoveries in physics—quantum theory—there was a shift in the cultural paradigm of western culture from Cartesian and Newtonian mechanisms to a more holistic and ecological view of life [3].
The holism theory, which suggests that the whole is more than the sum of its single parts, has determined the properties of systems that have completely changed the way we see complexity. Thinking in systems means looking at the whole, analysing single components and focusing attention on relationships and connections. The discovery of the interdependence between each part of a system and between the system and its environment also allowed us to define the system’s boundaries, thus creating an identity and no isolation. ST, in practical terms, means zooming out from a single part and considering that part’s relationship to its surroundings and other ecosystems (applying a qualitative approach more than quantitative approach) and mapping the situation more than measuring it, by using a multidisciplinary approach [2].
Application of knowledge on living systems to other systems created by human beings enables us to learn from nature and subsequently create something that will be sustainable itself. As suggested by P.H. Jones, “Systems theory and its guidelines in practice—Systems Thinking—have been promoted as the best techniques for raising social awareness about interconnected complex systems, which might determine human destiny” [9] (p. 92). In fact, researchers have agreed that the concept of interconnections represents a primary ability to tackle current complex scenarios and the immediacy of a sustainable future, which involves a complete social, economic, and environmental perspective.
The result of the application of ST to the design discipline is the birth of a new discipline called SD: a holistic approach applied to projects for artefacts and services, which allows one to have a wider view of the context/scenario in which this discipline will be introduced. As Jones [10] declared, the origin of this application passed from a soft part represented by the Social System Theory to the hard part, represented by Systems Dynamics: “Christopher Alexander, Victor Papanek (with critical social design), and John Chris Jones (design methods originator), influenced a new generation of designers” [10] (p. viii). One of the many reasons for this application is the need to develop more innovative solutions as a response to the complexity of design problems, as Charnley [38] has stated. Bhamra, Hernandez, and Mawle [39] also recognized this relationship: a higher level of design for sustainability is reached through innovation at a systems level—a more radical and strategic approach that involves many stakeholders, such as communities, governments, companies, and customers.
3.2. Holistic Diagnosis: a Tool for Systemic Approaches
From the perspective of the SD discipline in Politecnico di Torino, HD exists in the first stage of the design path. It is a method for comprehending the problem definition, which, in the design process, is a common step. As Buchanan quoting Rittel, a teacher at Ulm school, stated: “design process is divided in two distinct phases: problem definition and problem solution. Problem definition is an analytic sequence in which the designer determines all of the elements of the problem and specifies all of the requirements that a successful design solution must have” [30] (p. 15).
The term HD comes from the union between diagnosis—the central concept—and holism—its characterization. ‘Diagnosis’, according to the Cambridge dictionary, refers to the doctor’s opinion and, therefore, belongs to the healthcare field. In Italian, diagnosis is translated as ‘rilievo’, which refers more to a survey in architecture (site survey, architectural survey, survey maps, map making, field survey, and metric survey). Holism refers to the ST previously defined in the previous paragraph.
To understand how HD is currently used, and the previous attempts that defined its process, a literature review on the databases Scopus in August 2019 was performed using the keyword “holis* diagnos*” only in article title, abstract, and keywords to look for results.
The results in Table A1 reveal that the term HD is used by 40 documents. Their analysis permits us to understand the different subjects that refer to the term: 21 records are related to medicine (5 in alternative or integrative medicine), 9 to engineering (2 medicine-engineering), 2 to management, 2 to human science, 1 to human-computer interaction/design and 1 to participatory design, 1 to cognitive science, 1 to philosophy, 1 to communication/climate science, and 1 to safety. The number of records in the subject area ‘alternative and integrative medicine’ highlight the relationship between ‘holism’ and oriental culture, as also stated by Capra (1982). Parallel to this, the records demonstrate that holistic approaches have started to be used in other different contexts, from engineering to management and governance. Interestingly, the second record uses the term in the field of participatory design applied to agroecology, which could reflect the development of holistic approaches in the design field related to sustainability. However, no results seem to refer to this concept as a tool with a precise methodology and implementation process, except for the conference paper by Montagner [40], which applied the concept to data design and referred to SD by Bistagnino [14] as part of the research group in Politecnico di Torino.
Due to the lack of information about the HD process in scientific contributions found during the review, in order to define a structured framework to approach complexity in any contextual system, the research was extended to articles, books, PhD theses, and conference proceedings produced without indexes on SD, especially by the SD research group in Politecnico di Torino.
According to [14,41], one of the main contributors to the definition of the methodological frame of SD, HD is defined as a mapping of the state-of-the-art useful for giving indications about the quality and the quantity of what an anthropic process involves. Moreover, to highlight the relationships that are activated, both inside the system and between the system and its environment (as the local context), one can analyse afterwards the implications at each territorial dimension, from regional to worldwide ones.
In that regard, HD represents a useful tool to guide the first complete overview analysis of contexts/products/processes/services and define the current state-of-the-art. From this point of view, HD is related to ST, which defines a detailed study on behavioural patterns and interactions. An analysis of this nature is understood as a holistic overview of the components of the system and how their interconnections/relations result in the sum of all parts/subjects that interact between the environment and other systems.
To reach an effective understanding of the HD results, we require visualization tools whose main aim is to break down the information of the system. The synthesis of this analysis is represented as a graphical outcome, which is a giga-map [42,43] that displays all the components of the system and the relationships between them.
In the SD methodology, HD refers to two different levels of analysis: HD1 for energy and matter analysis and HD2 for context/framework analysis. Starting from a deeper overview on a single production process with an analysis of the output (what goes out) and input (what comes in), the view is enlarged to its context of reference to help understand its influences.
3.2.1. Holistic Diagnosis Phase 1: Energy and Matter Analysis
This first phase of the HD entails the analysis of everything used by the production, exchange, and consumption of goods and services (Figure 3), including:
- Input: resources as raw materials, semi-finished and energy, which enters in the process;
- Output: waste and surplus, both matter and energy or data, that produce or don’t use the process;
- Final product or service;
- Goods and people management, as well as logistics.
The purpose of HD1 is to analyse in detail all the resources used by anthropic activity. This activity is seen as an open system, where the boundaries are the limits of the production process itself (when the production starts and when it stops), and it contains all the sub-processes inside.
The HD1 is divided into three steps:
- A general overview of the entire anthropic activity (seen as a production process), considering the flows of energy and matter that enter and go out (input and output);
- An analysis of the relationships with other anthropic/natural activities that the input and output generate;
- A detailed analysis of the input and output of every single sub-process involved into the entire process.
HD1 is unrooted in other methods, presenting many similarities with them: niche analysis used in permaculture [44], material-flow analysis and substance-flow analysis from urban metabolism [45]; an economic-wide material flow account [46]; input–output analyses [47]; stock and flow analyses in system dynamics [48]; the urban harvest approach [49]; life cycle analyses [50], and many more.
3.2.2. Holistic Diagnosis Phase 2: Context Analysis
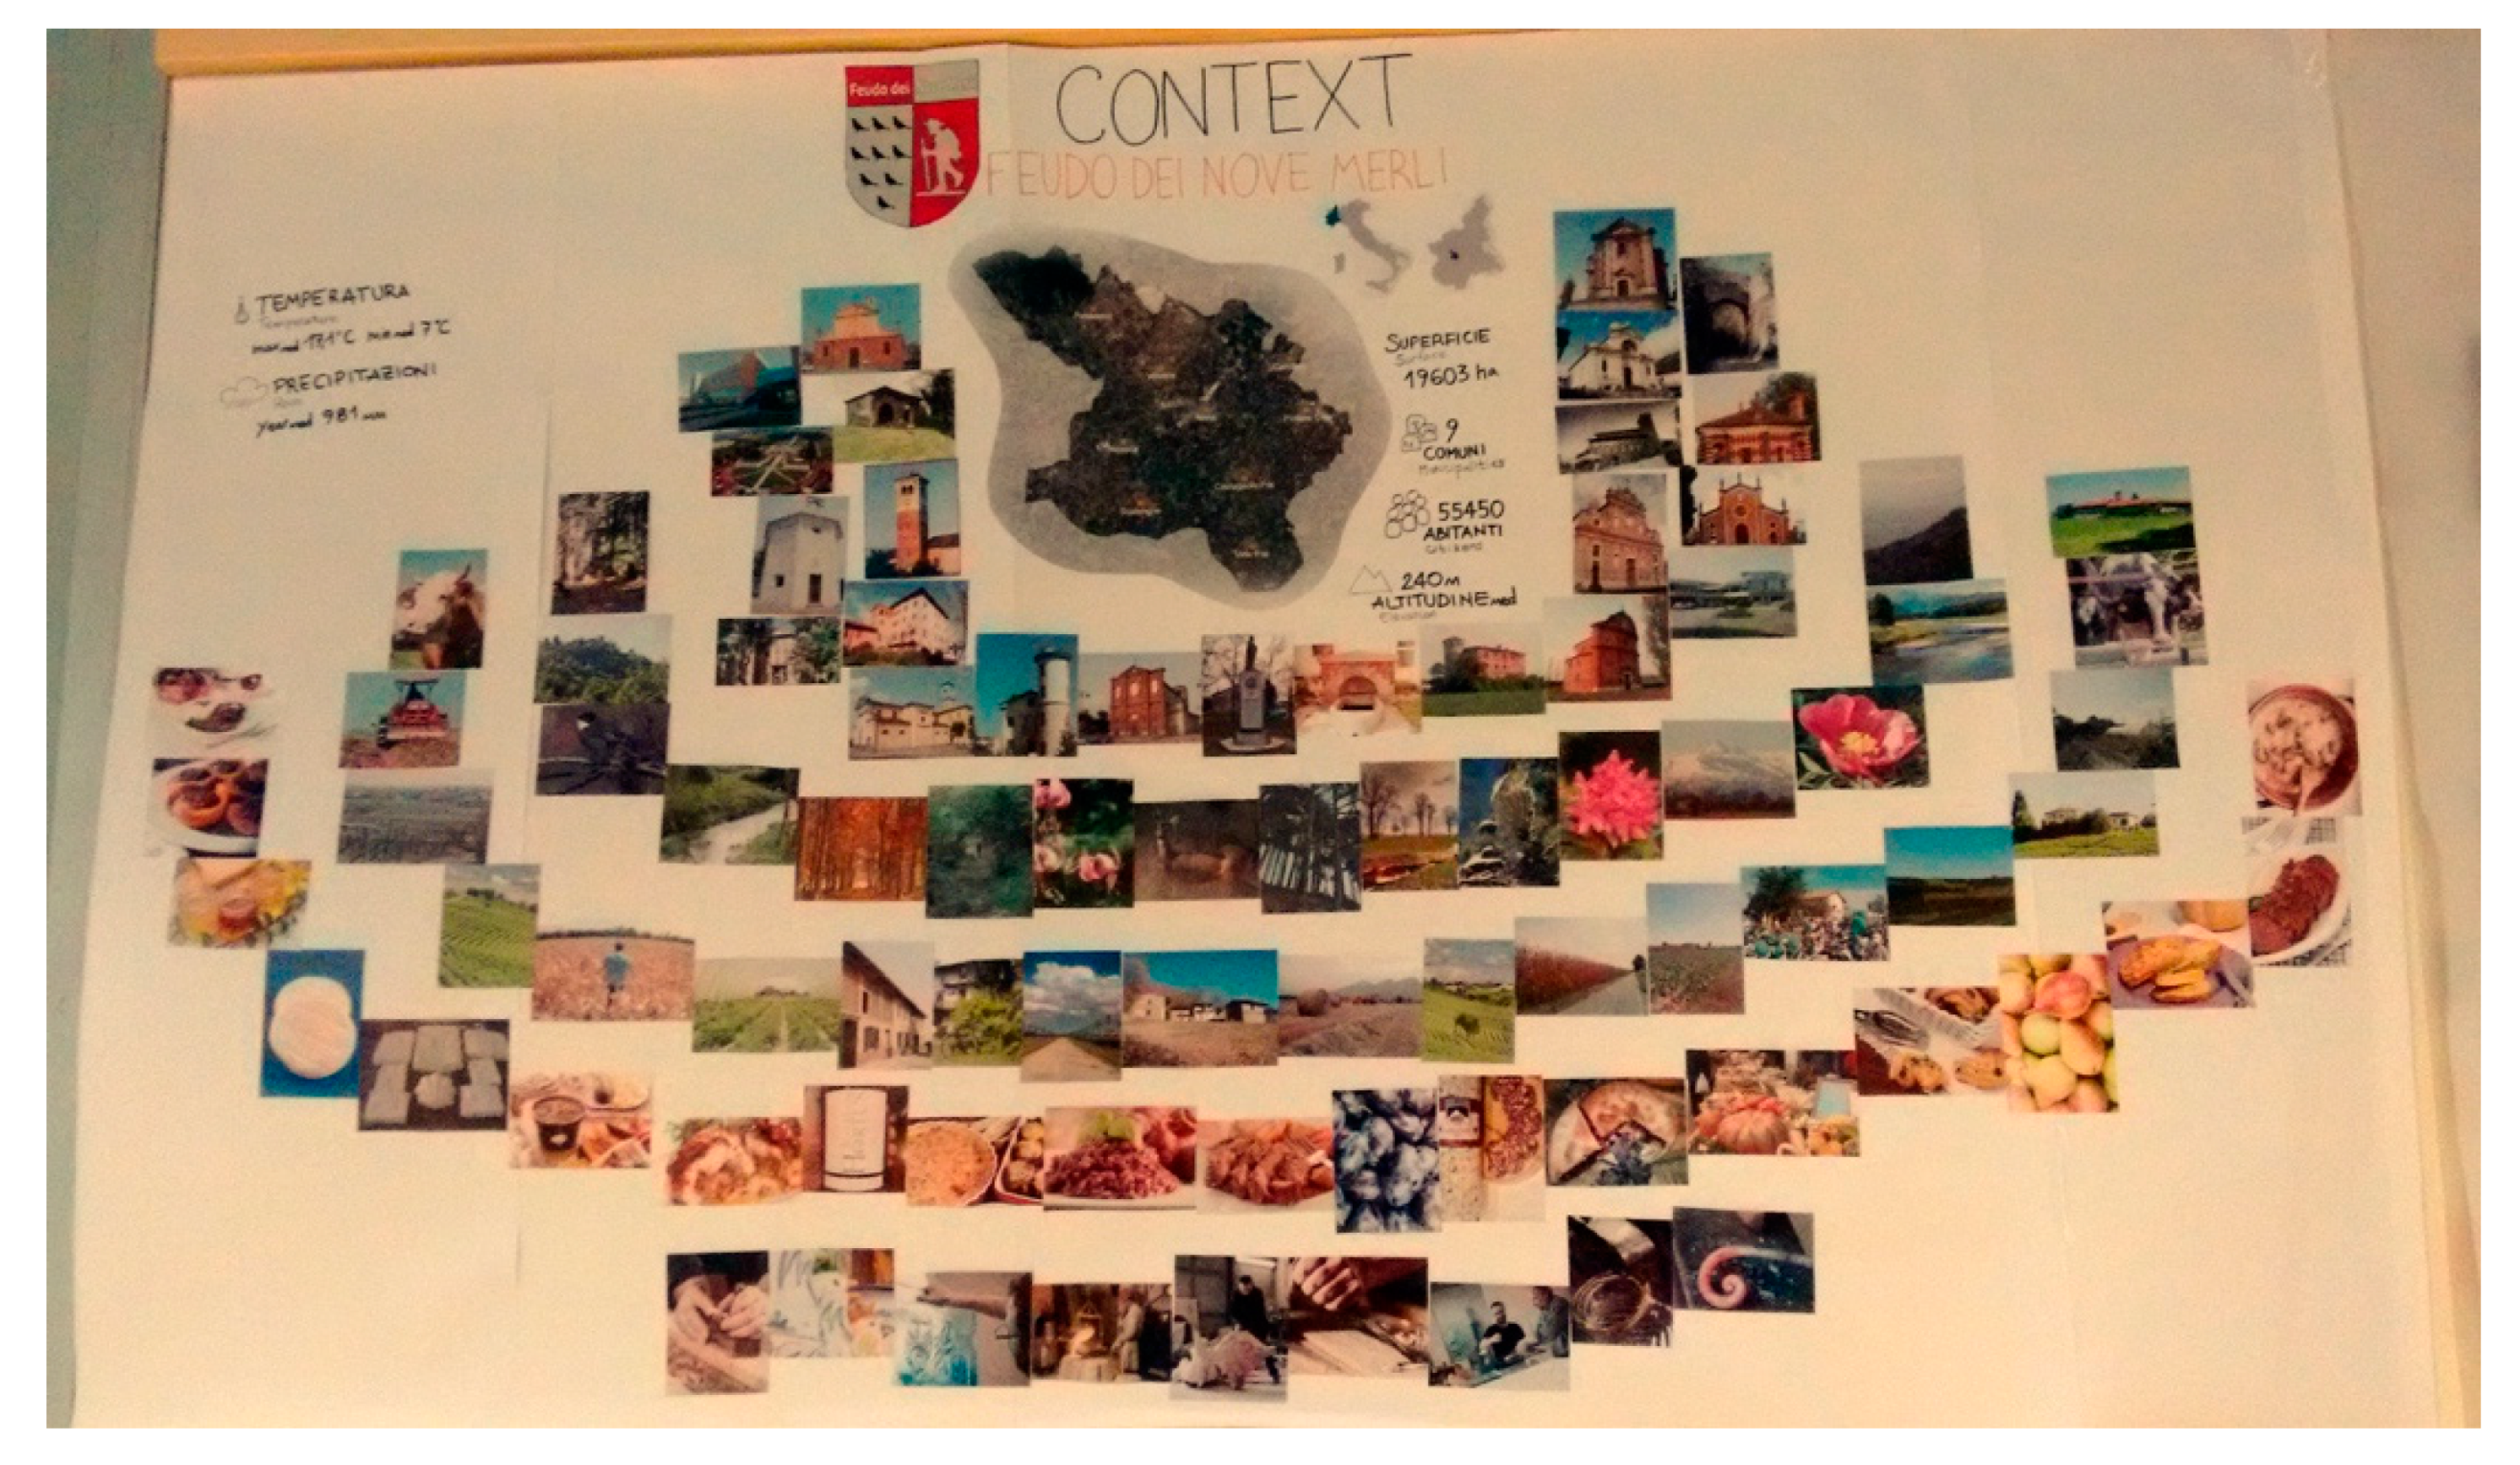
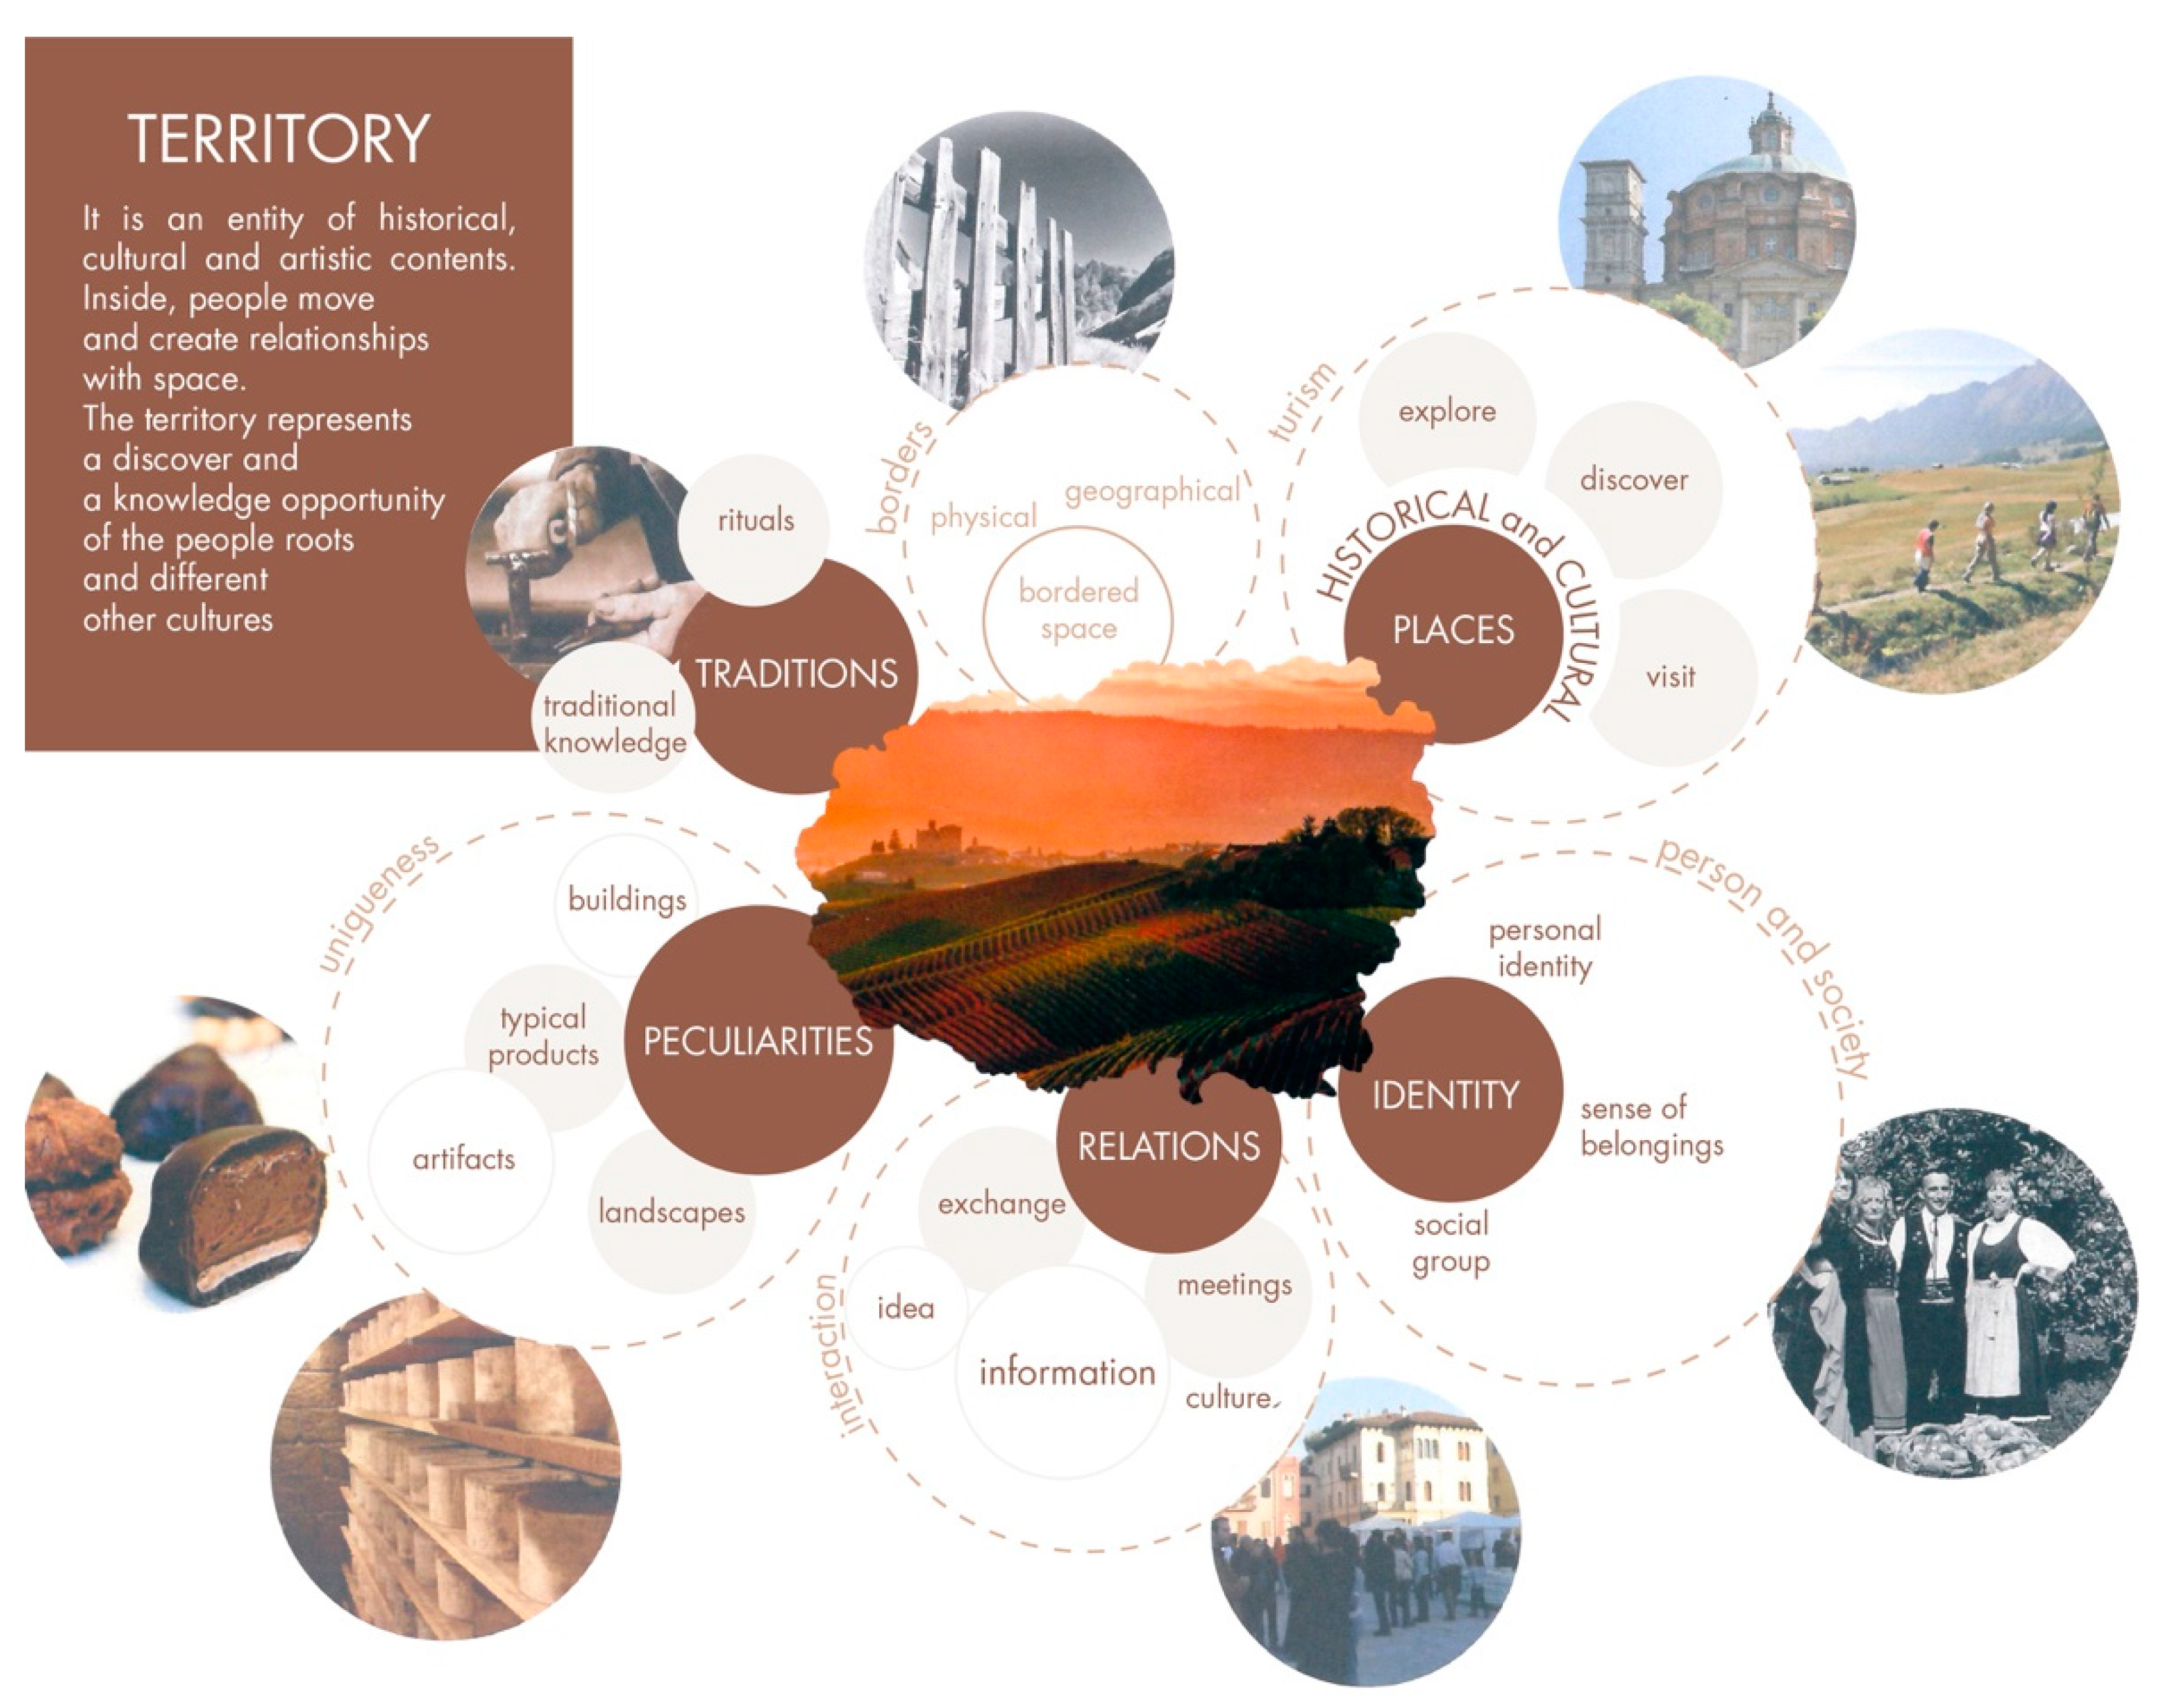
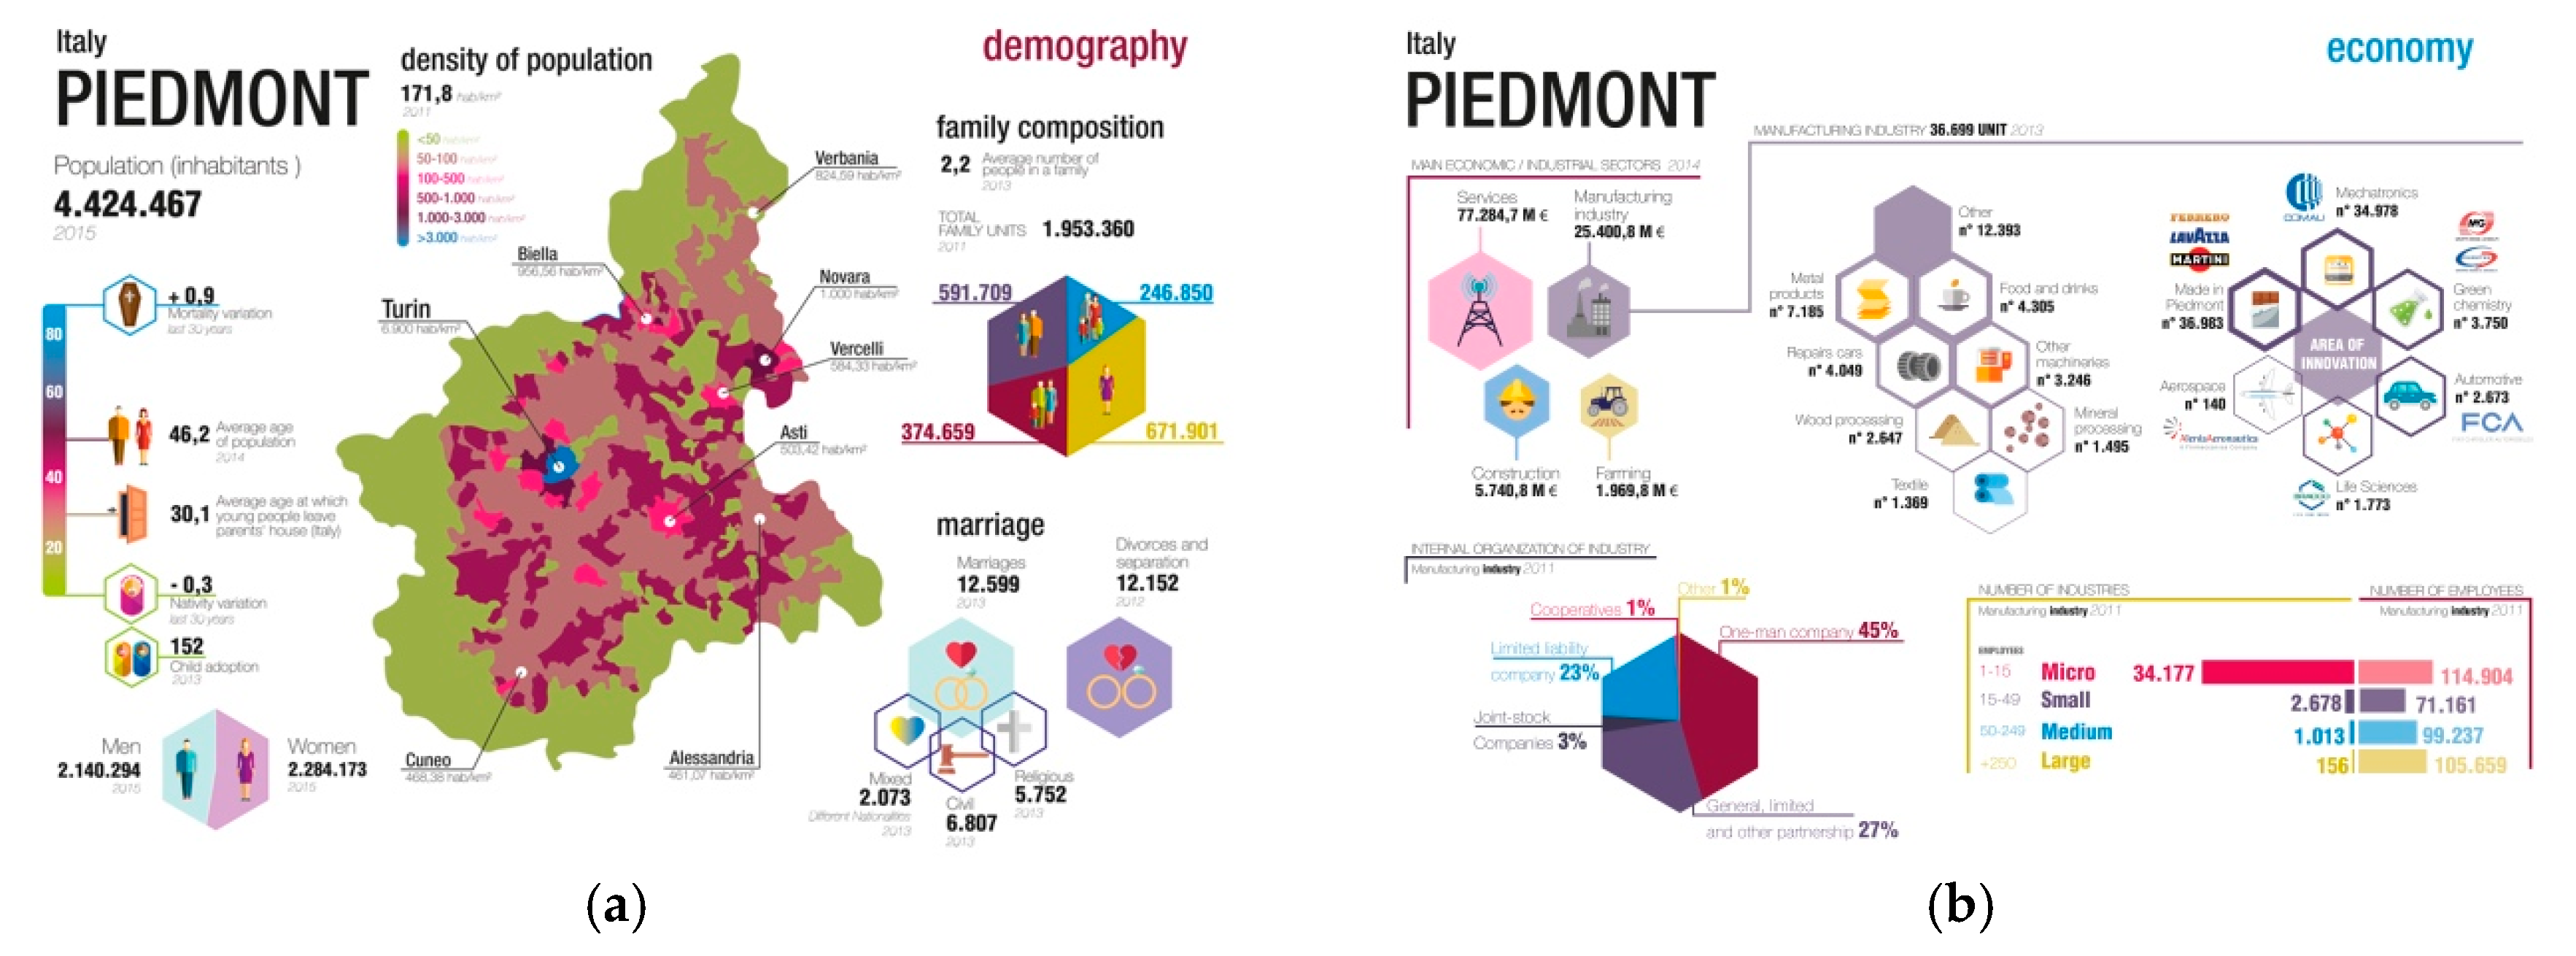
The second phase of HD is an analysis of every relationship generated in a direct or indirect way, including the environment where the system is placed, to discover the relationships in between the activities and the contexts around them. This analysis goes in depth for both territorial considerations and stakeholder involvement. The context is determined from its morphological features and also through its economic, social, and cultural aspects. Attention shifts from natural resources to relevant industrial activities, typical products, folklore, and demographic aspects (Figure 4). Furthermore, to produce an overall analysis, the HD should involve mapping of the different actors and stakeholders involved in the topic of analysis. For example, in the case of production activities, the analysis should be addressed not only to producers and end users but also to the technicians, providers, intermediaries, and other pertinent public and private bodies.
3.2.3. Holistic Diagnosis Process Definition
Starting from the definition of Bistagnino [14,41], HD has evolved through different studies to be defined as an established framework [54,55].
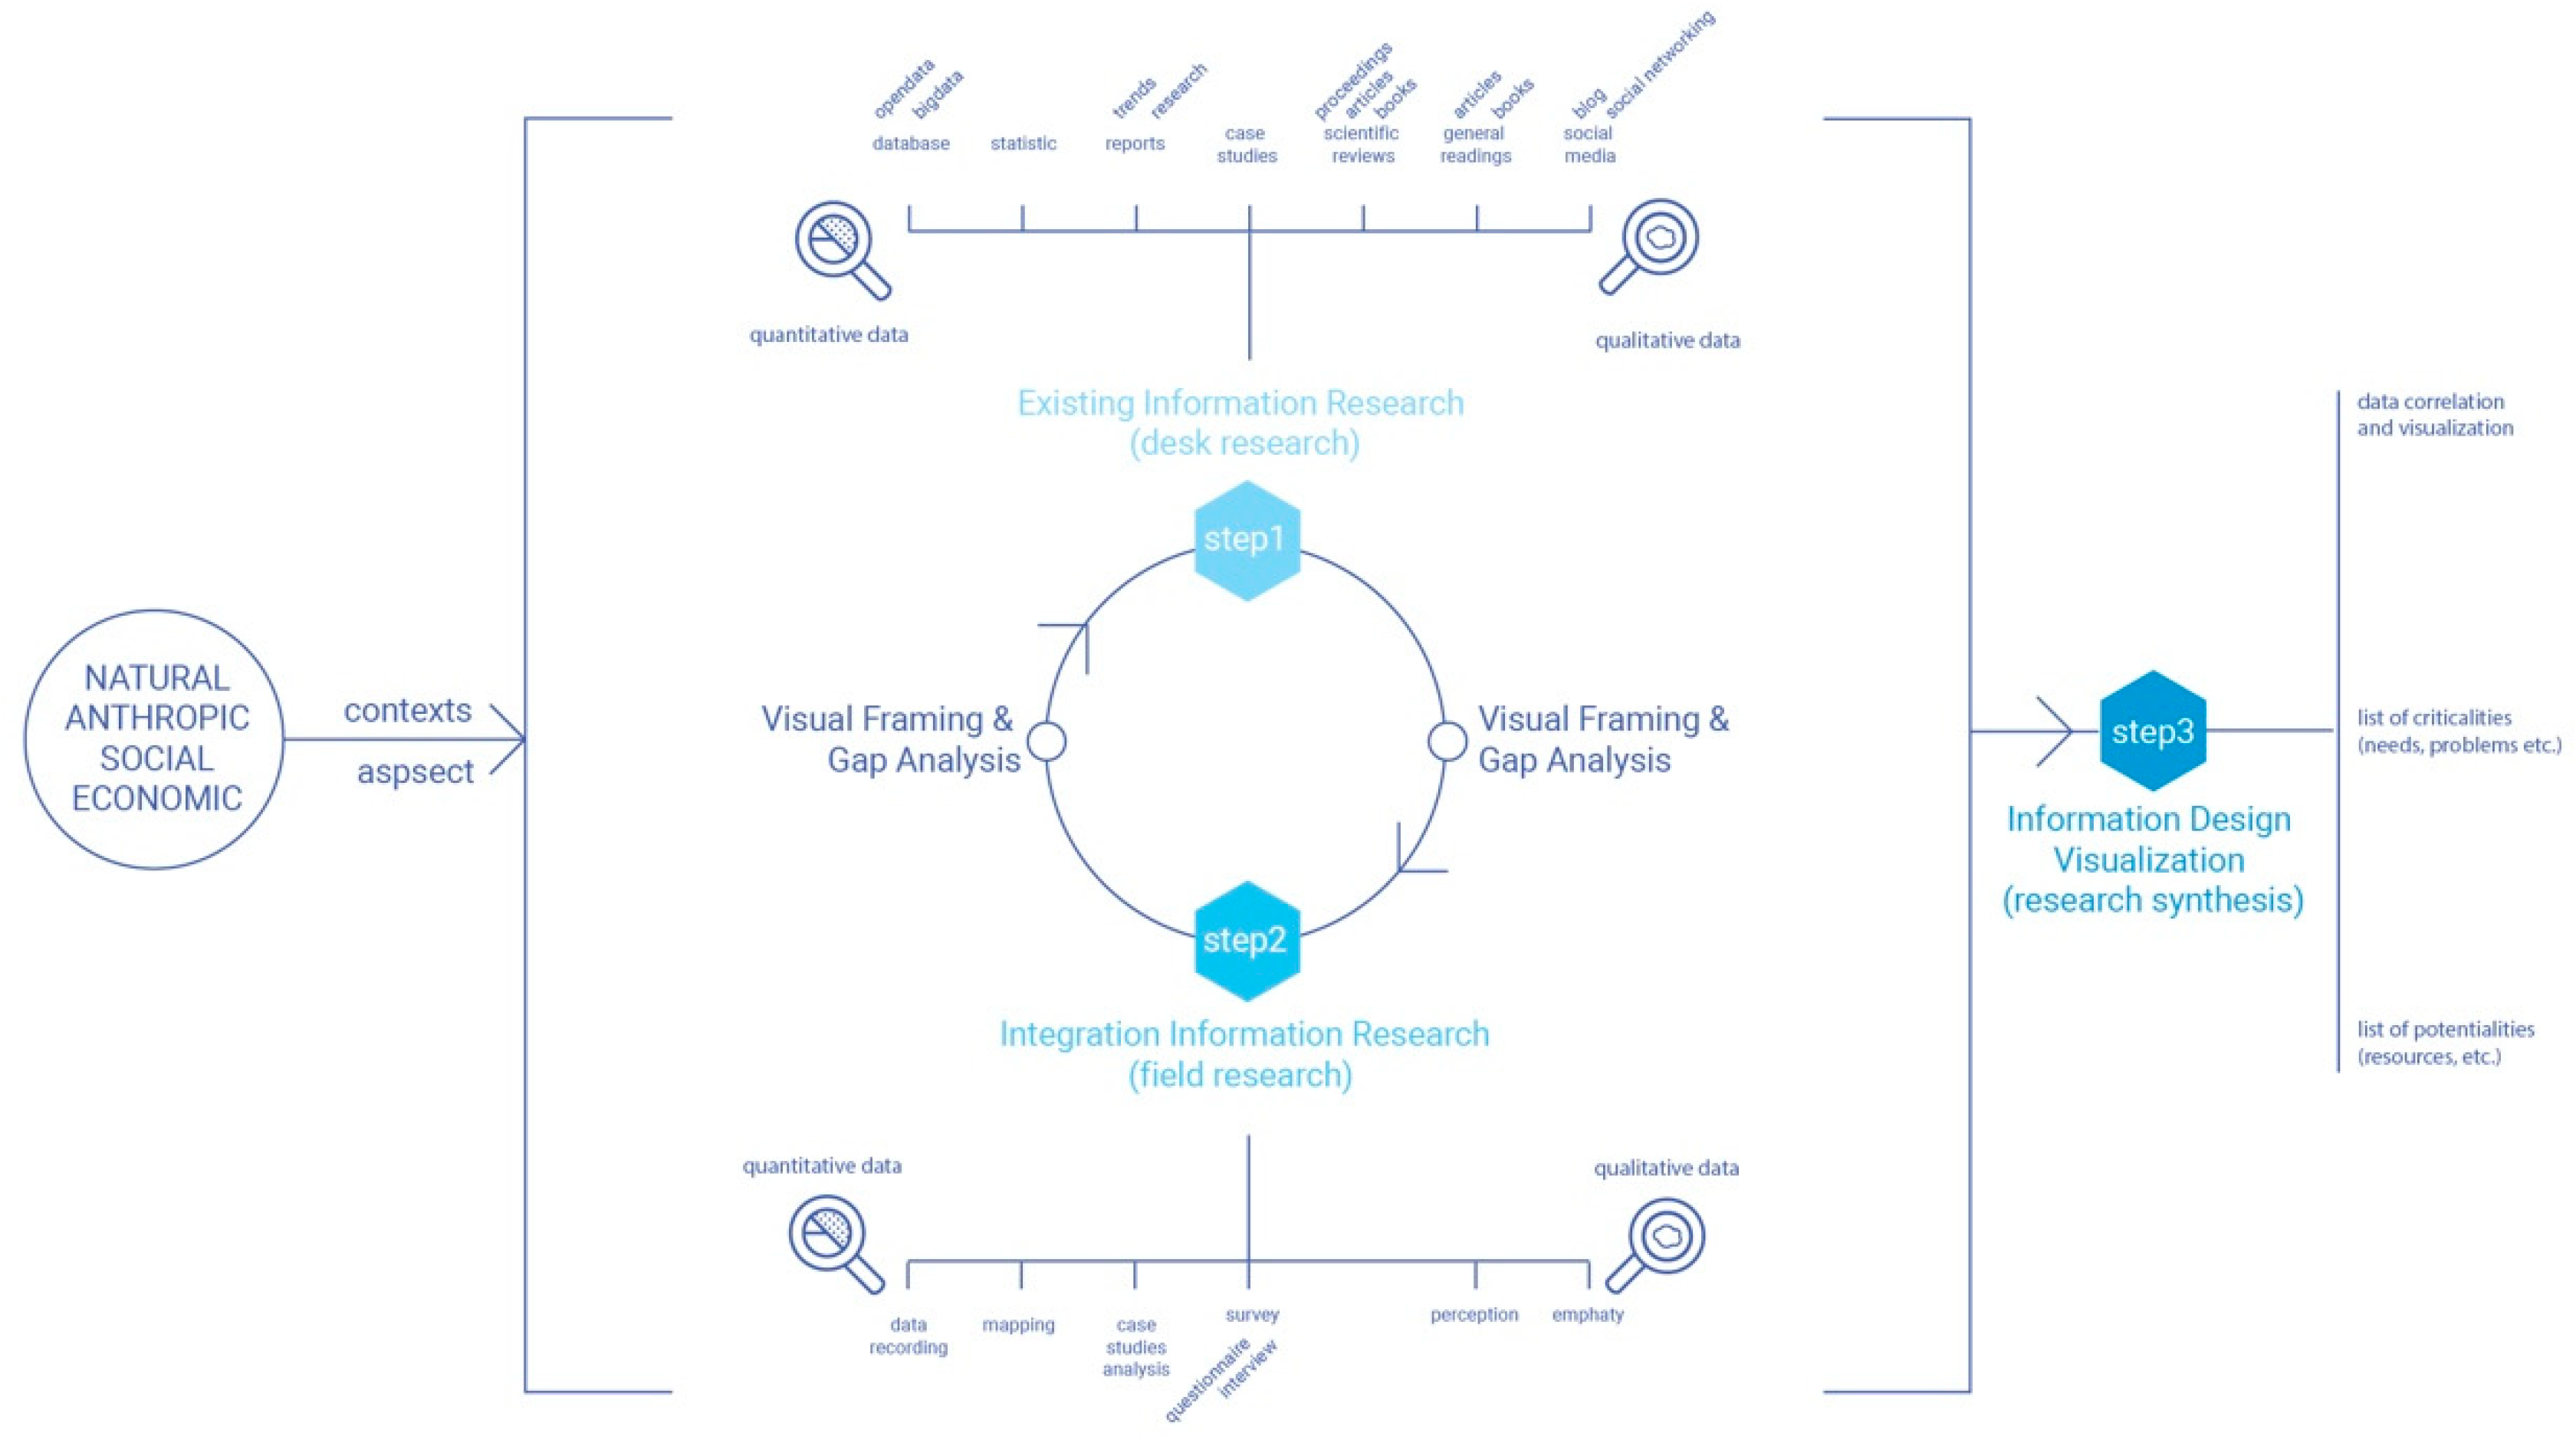
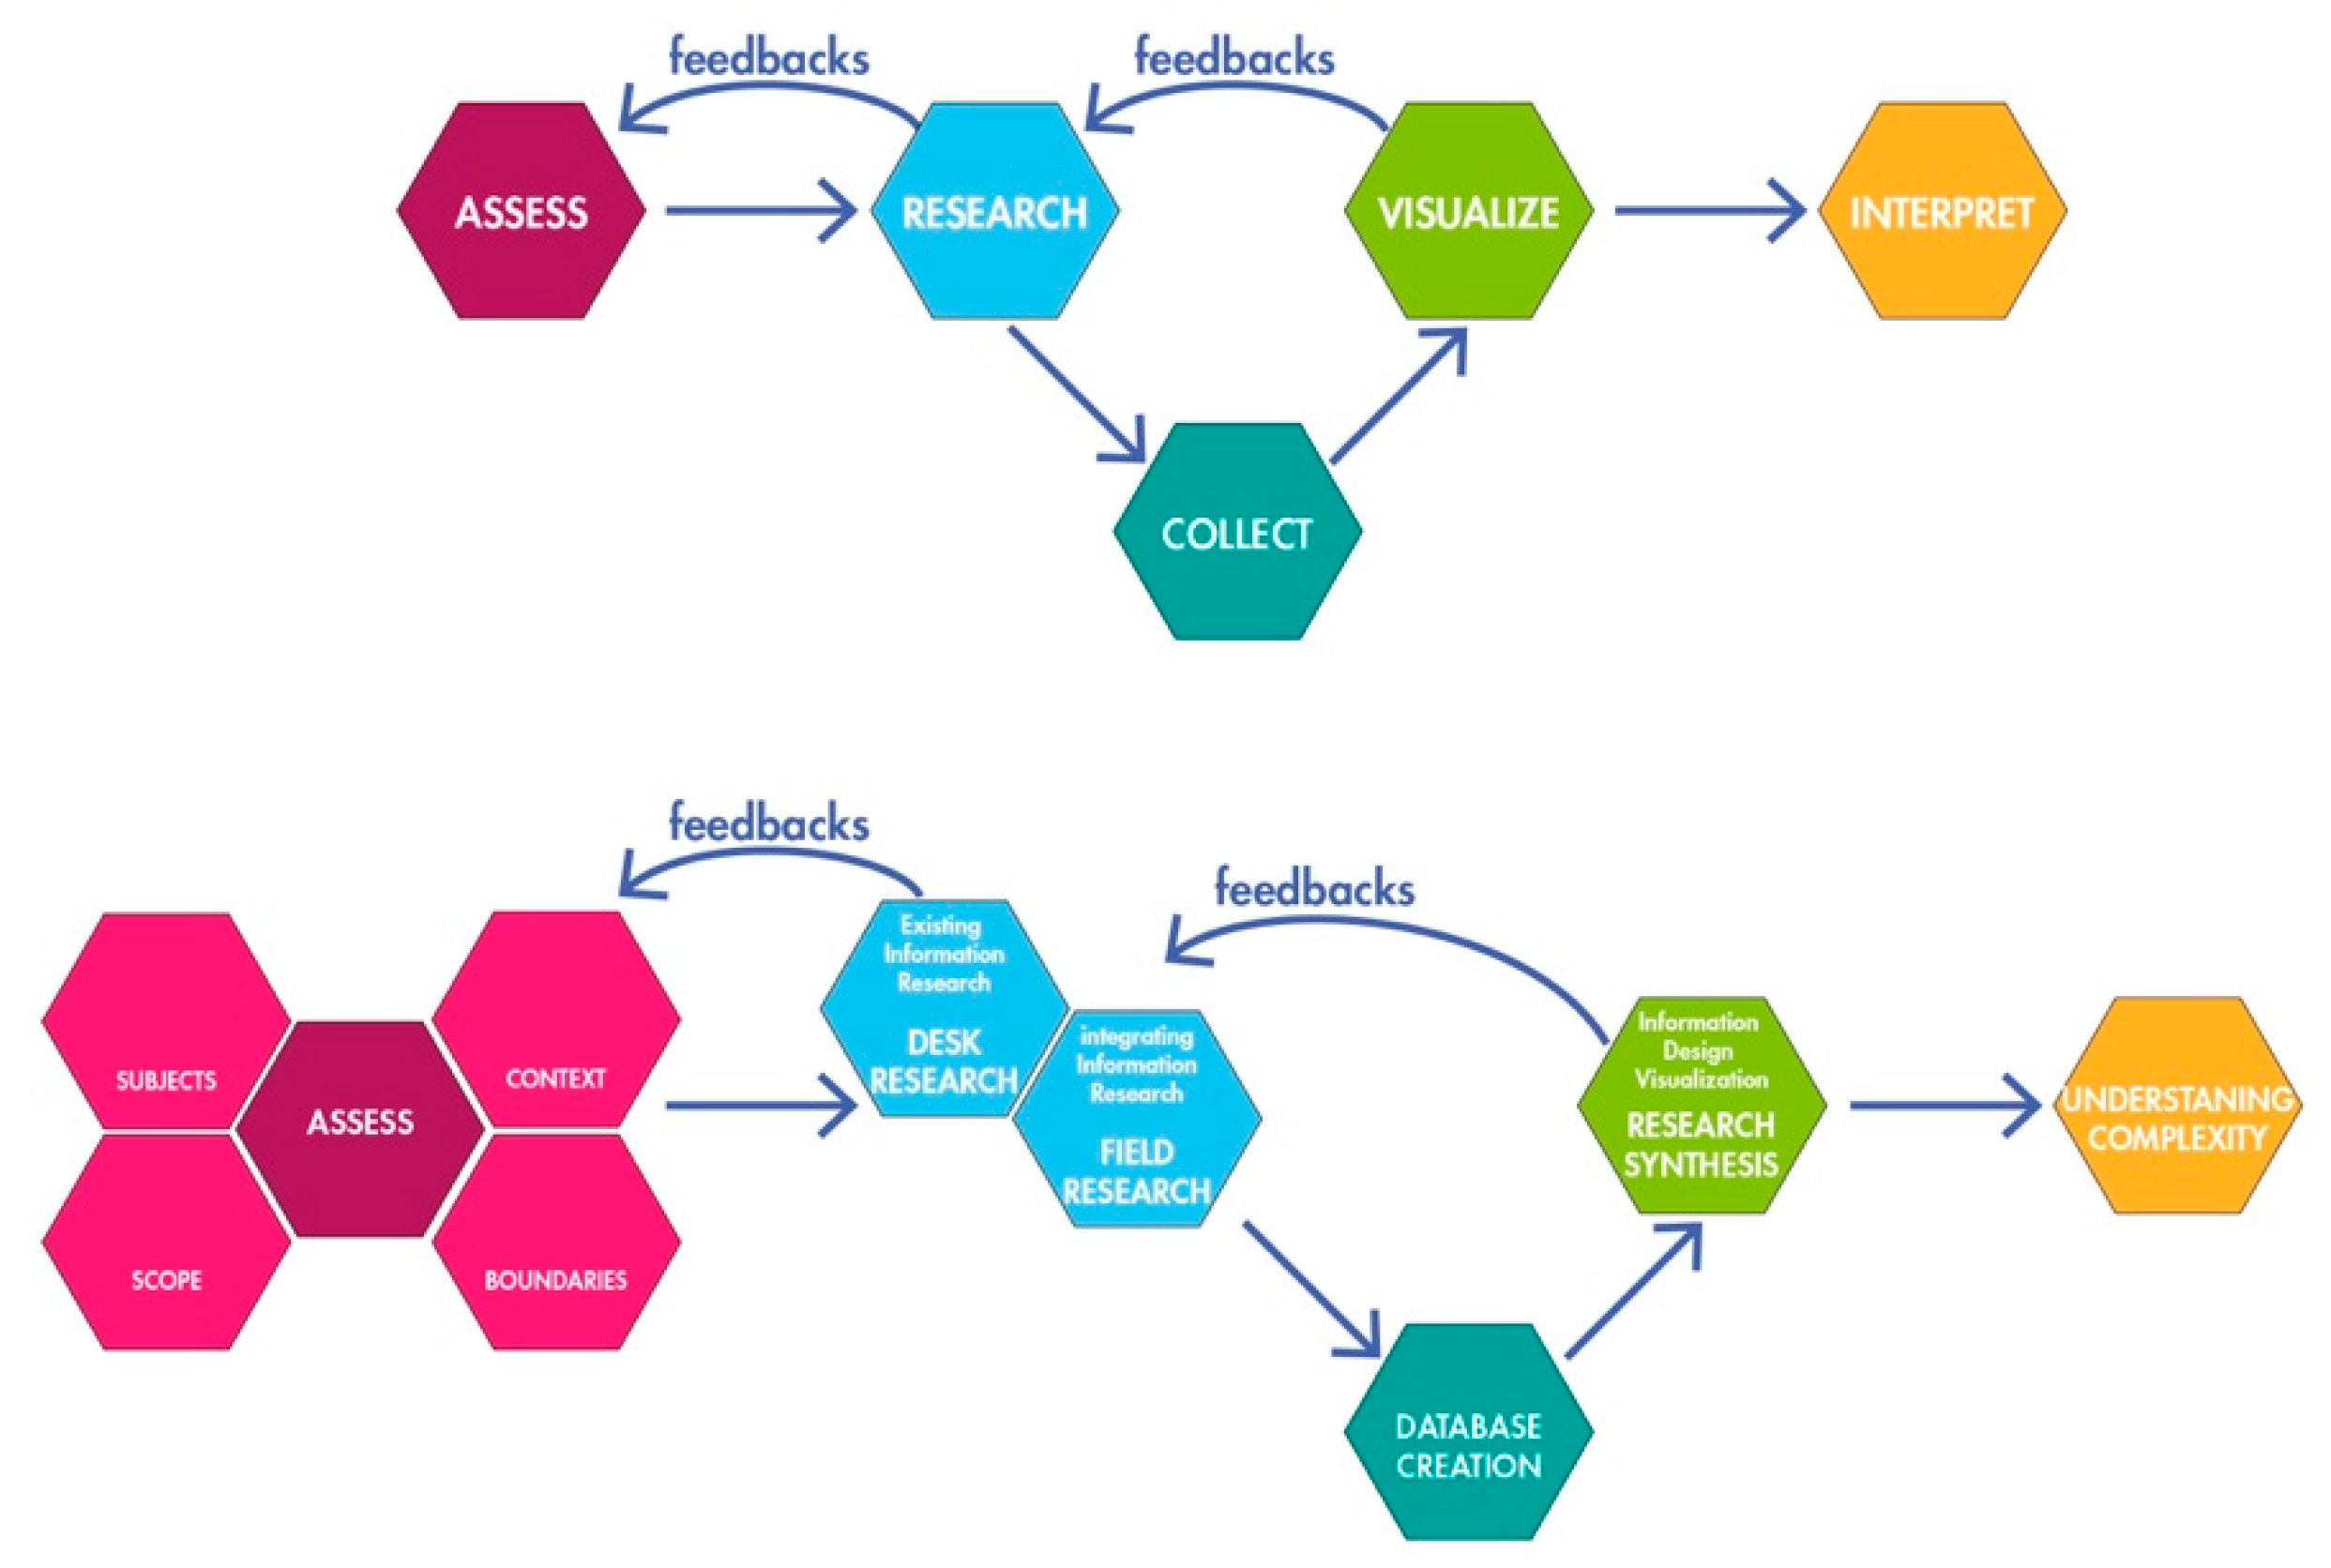
Gaiardo, in 2016, identified three principal ways to realize an effective HD. These methods should be actuated not consequentially but with reiteratively [56] (p. 113) (Figure 5):
- Existing information research—desk research: The collection of information about the state-of-the-art is done through formal sources, such as existing scientific literature and official databases, as well as informal ones, such as social media;
- Integration information research—field research: Complementary to the previous phase, this analysis is done through direct experience in the field of reference, ranging from direct data recording to collection of perceptions (pictures, direct interviews, etc.);
- Information design visualization—research synthesis: This is used to ease the understanding of the collected data, thereby exposing controversial aspects, potentialities, and data correlation. Thus, it is possible to start a project development and at the same time to communicate the research results to other parties.
Both desk than field studies look for both quantitative and qualitative data through different tools and different sources. For each of these methods, there is visual framing and gap analysis, which should not be sequential but iterative. The third—research synthesis—produces three outputs: data correlation, a list of criticalities, and a list of potentialities [54].
This framework details a way to build a toolkit to conduct the research phase and, consequently, visualise complexities. It specifies the instruments needed to perform desk and a field research and also delivers the way to analyse external contexts and the potential lists of outcomes that should be reached within the research synthesis.
Nevertheless, the field of data to be analysed is still wide. To be able to process results with a standardized procedure is necessary to frame the type of information that will be extracted from a given system. For that purpose, the following methodology proposes a research study to establishing categories where a delimited amount of information can be extracted to approach an HD in a more effective way.
As result of this, a detailed description of the entire method and useful tools is needed, in order to render the importance of an HD inside SD. That been said, the purpose of this article is to define and assess a structured method to achieve a more effective execution of the HD. This new approach allows the HD to be utilized even for the analysis of multiple contexts simultaneously within multidisciplinary groups and usess standard organized information to achieve synthesis results.
3.3. Comparative Case Studies Applying the HD Tool
The HD framework over the years has been applied in the design process for several SD projects, as guided by the research group at Politecnico di Torino. The following applications illustrate how the HD method has been improved in different fields:
- Industrial production—from a certain production chain to the analysis of local context for product innovation;
- Local Communities—from a certain productive sector and context to the definition of new opportunities for social innovation;
- Policy making—from a certain regional context to the definition of strategic production chains and policy planning tools.
3.3.1. Industrial Production
The HD within an industrial production context is common in SD projects experienced in Politecnico di Torino and requires an acknowledgement of the outcomes generated by the linear production models at environmental level, thereby increasing the awareness of the relationships between one company and the local context where it operates.
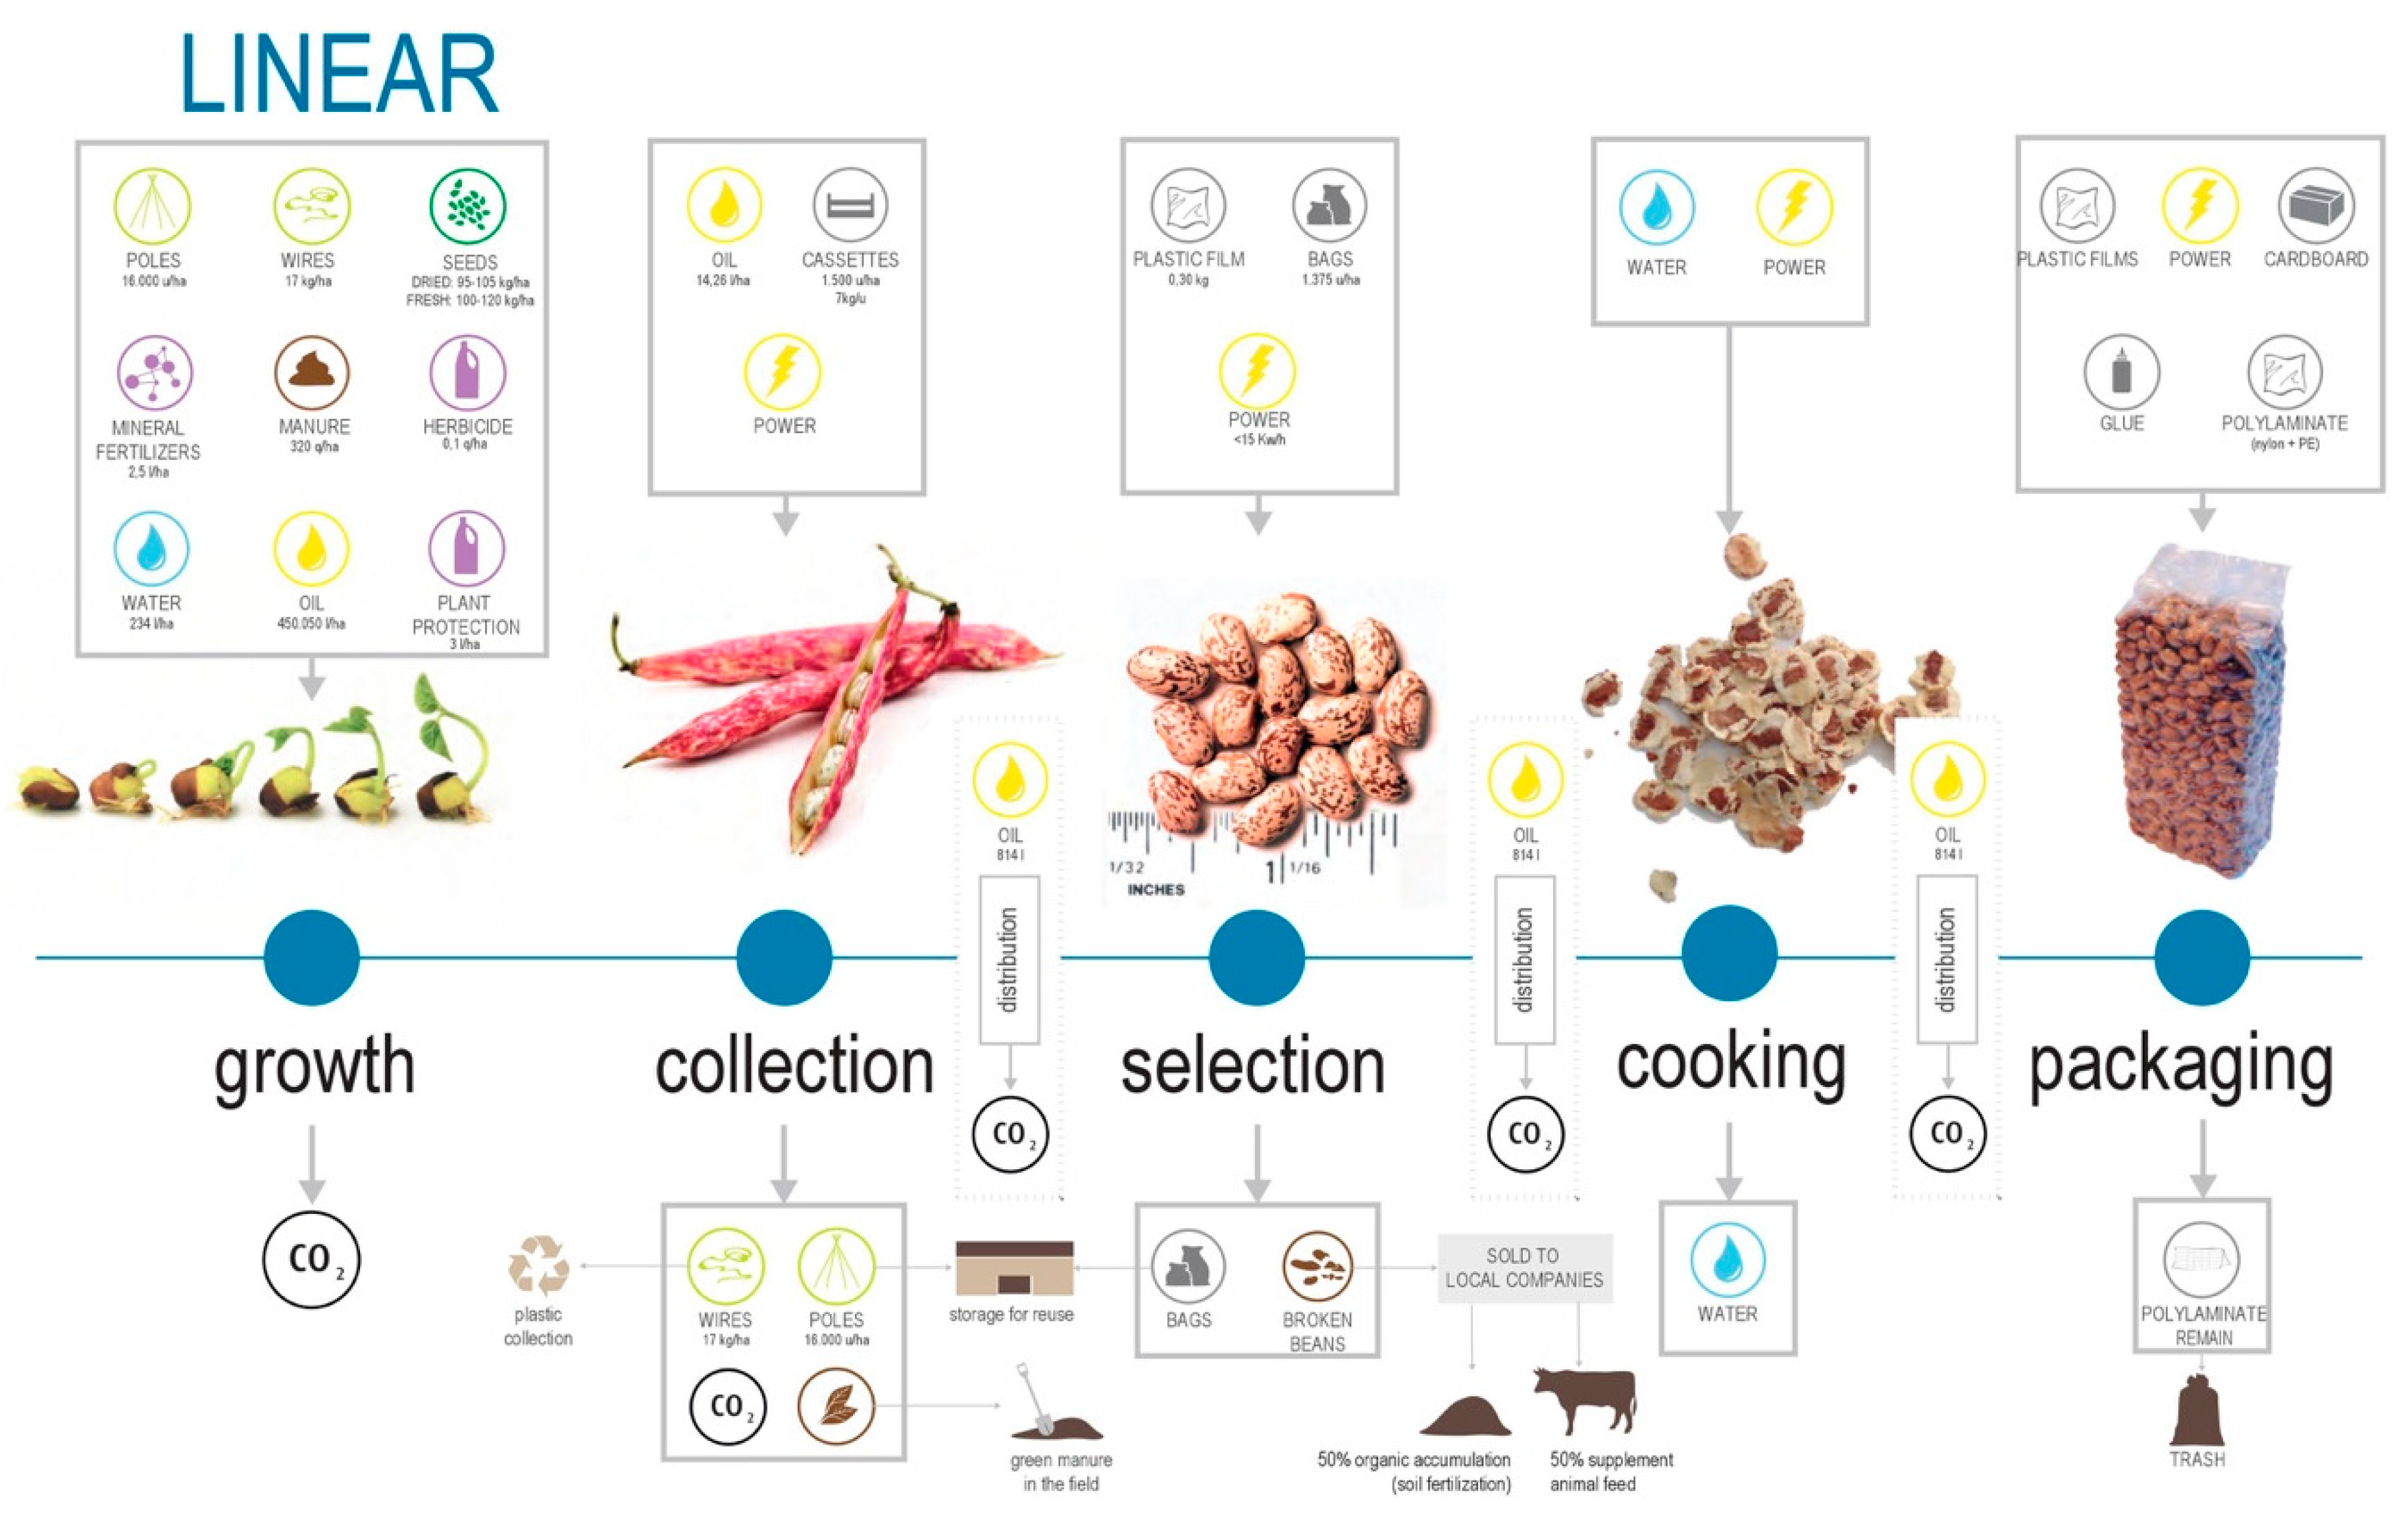
A case study on industrial production is the EN.FA.SI. project (l’ENergia e il FAgiolo in SIstema), implemented with the support of the Piedmont Region (Italy) with POR-FESR 2007–2013 funds for productive transition and innovation. This project was developed in collaboration with local industries and aimed to develop a specific area in the North West of Italy (Cuneo province) where the Cuneo Bean (Fagiolo Cuneo) is cultivated, a product registered as a TFP—Traditional Food Product—and a PGI—Protection of Geographical Indication [57,58,59].
With the goal of reducing the environmental impact of industrial cultivation and food transformation, thus creating relationships with other productions to enhance production outputs, the HD1 and HD2 in this case were developed simultaneously. Starting with the HD1, the SD research group in Politecnico di Torino (composed of systemic designers and researchers based in the same region), using desk research, analysed the cultural aspects of the Cuneo area and productive sectors. In the meantime, mixing desk and field research framed the supply chain of the Cuneo bean (HD2) through field visits and interviews involving local actors from the agricultural consortium of the local producers of the Cuneo Bean. Manufacturing activities, such as Agrindustria Tecco s.r.l. and Arese Franco s.n.c., focused on the transformation of the beans; other research centres, such as Agroinnova and CReSO, focused on the agro-food sector. The HD was led by the SD group in Politecnico di Torino, which developed it until research synthesis, thereby creating giga-maps, such as the ones in Figure 6 and Figure 7, which included the feedback received from the other actors. This process lasted for several months and required multiple cycles of iterations through desk and field research and research synthesis, especially for the identification of the quantity and quality of the inputs and outputs involved in the production processes.
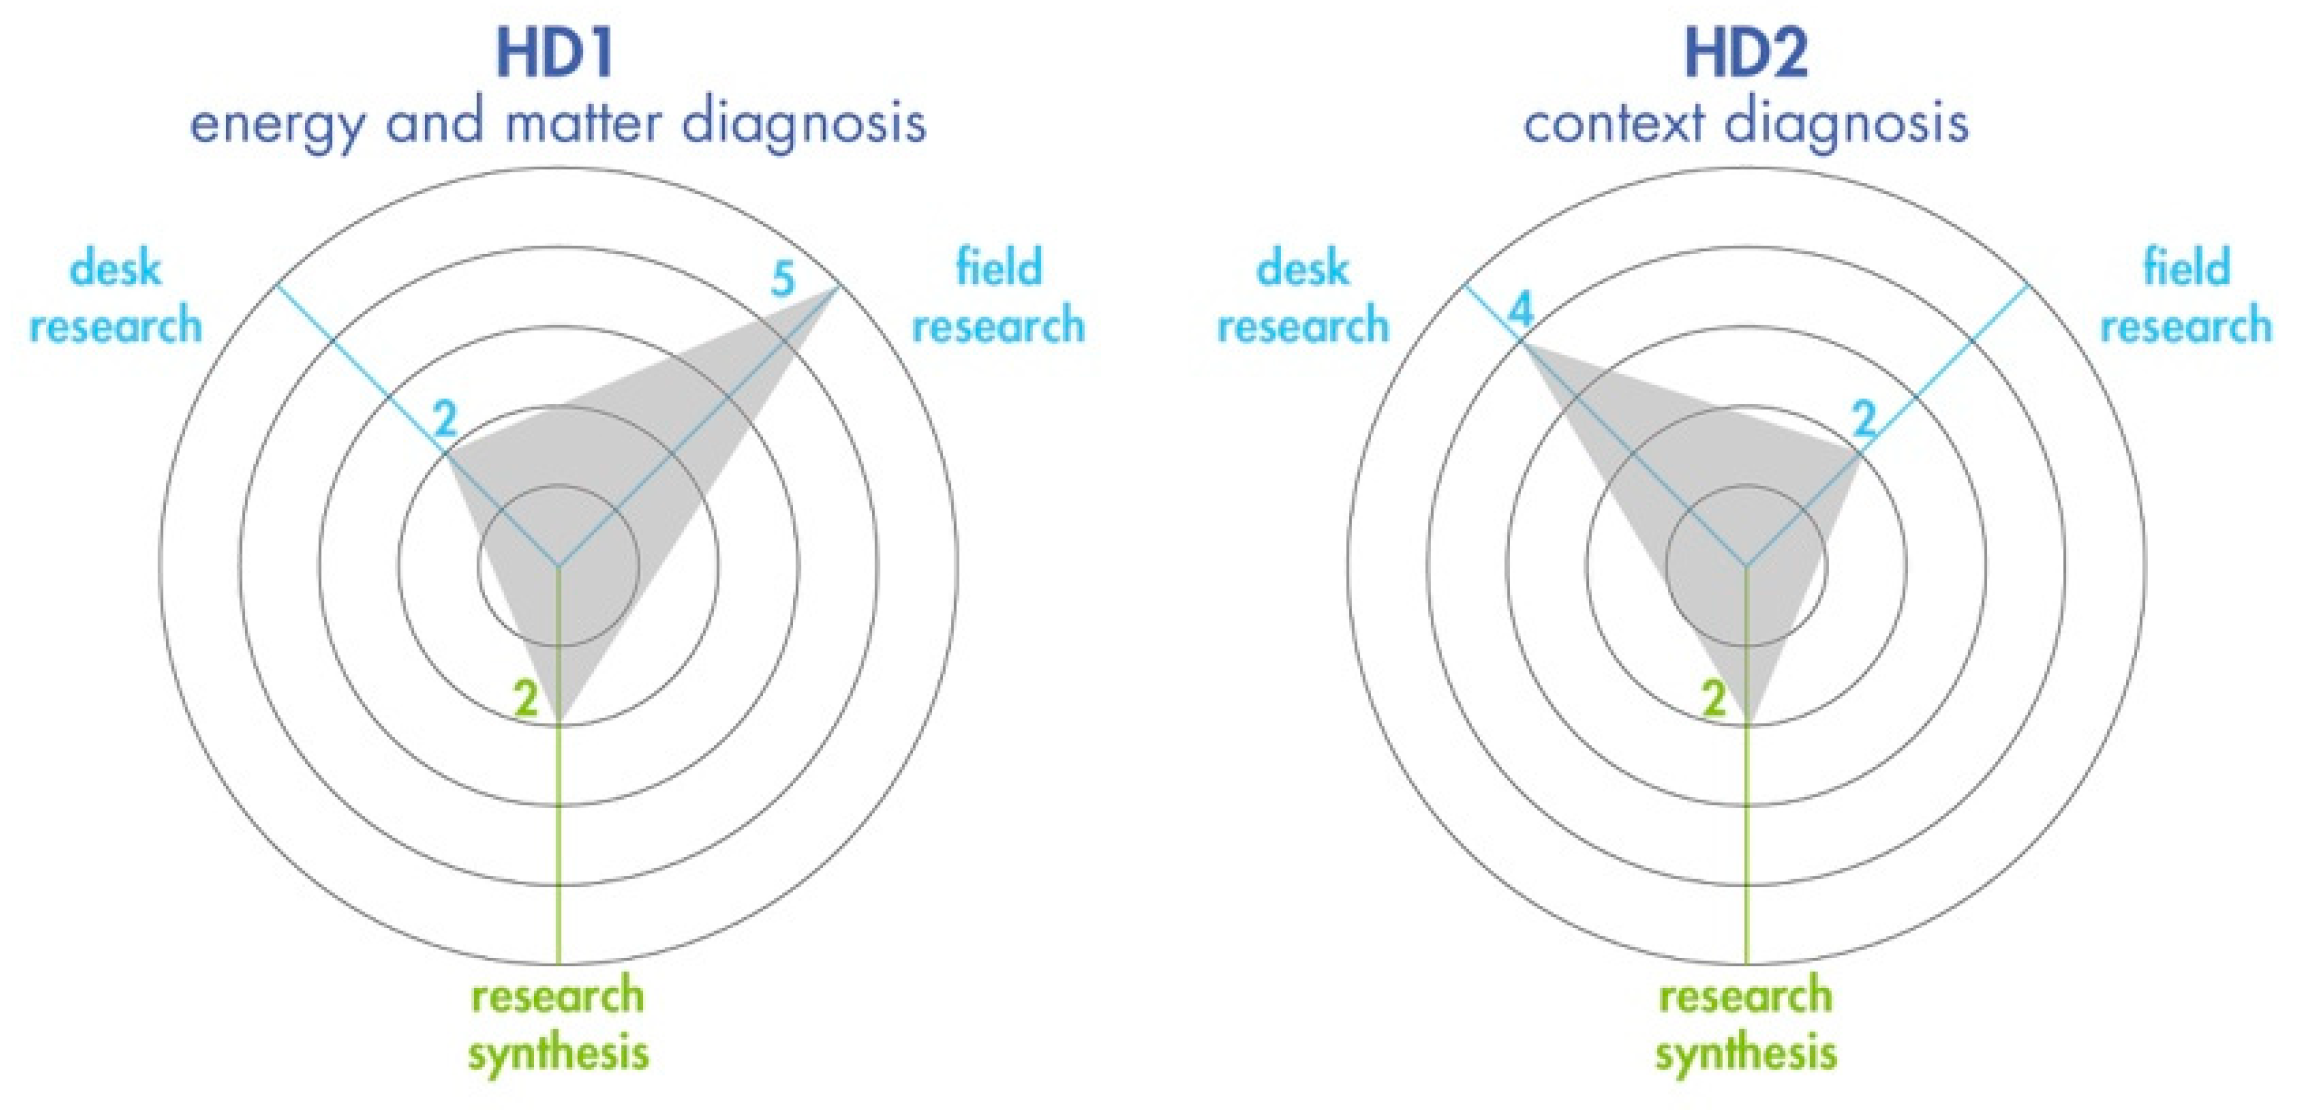
The HD, in this case, taking into consideration the level of detail and importance of each phase (desk and field research and research synthesis), can be evaluated as represented in Figure 8. This figure represents a solid starting point of dense of information used to develop the projects, which include the design and implementation of systemic and integrated production. A network of companies and zero-emission productions were created, working from the reduction of the water consumption in the cultivation process to the design of a new product, bean flakes, and their packaging, which gave new life to beans discarded in the selection process.
The role of the HD in industrial production can also be found in other projects, such as the project developed within the large food industry based on the large-scale production of biscuits [60], which required an active role for the employees and a deep analysis of the local territory.
3.3.2. Local Communities
In the case of a scenario with local communities, the HD tool underlines the recognition of the relationships between resources in a local context (and its actors) and know-how, which are usually reduced due to the lack of awareness regarding the impact of waste generation in a natural environment and the valorisation of human capital.
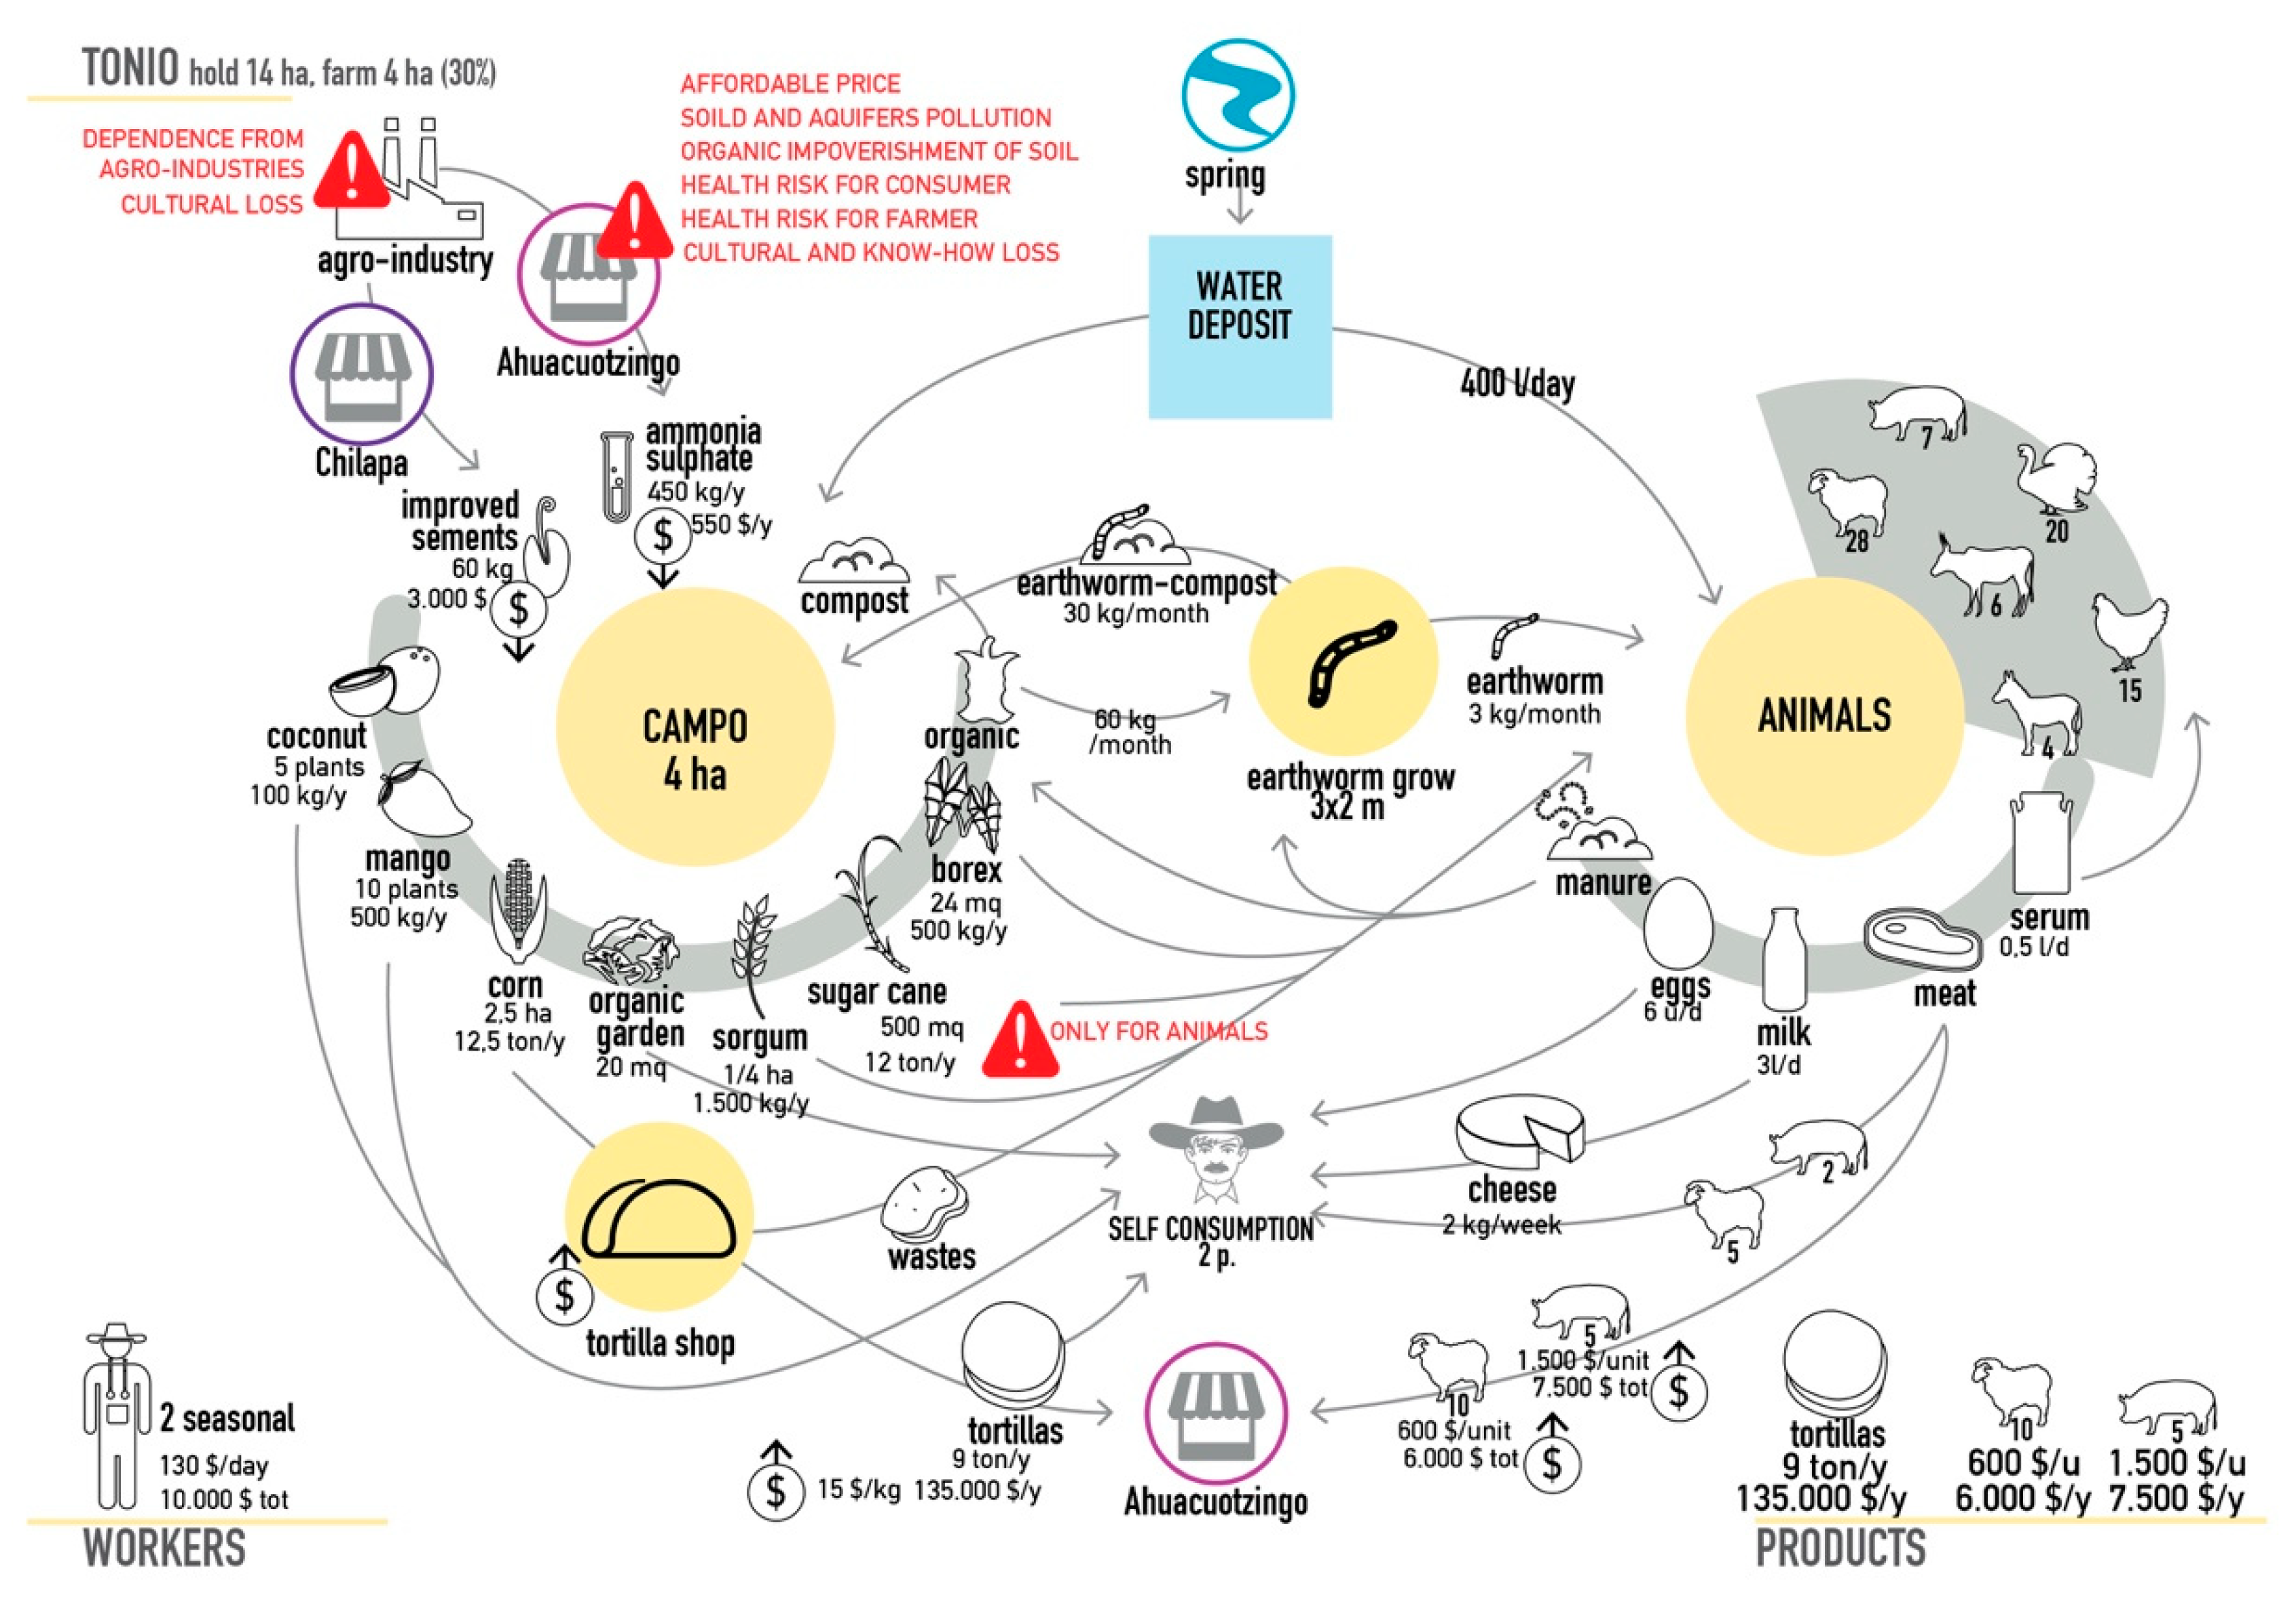
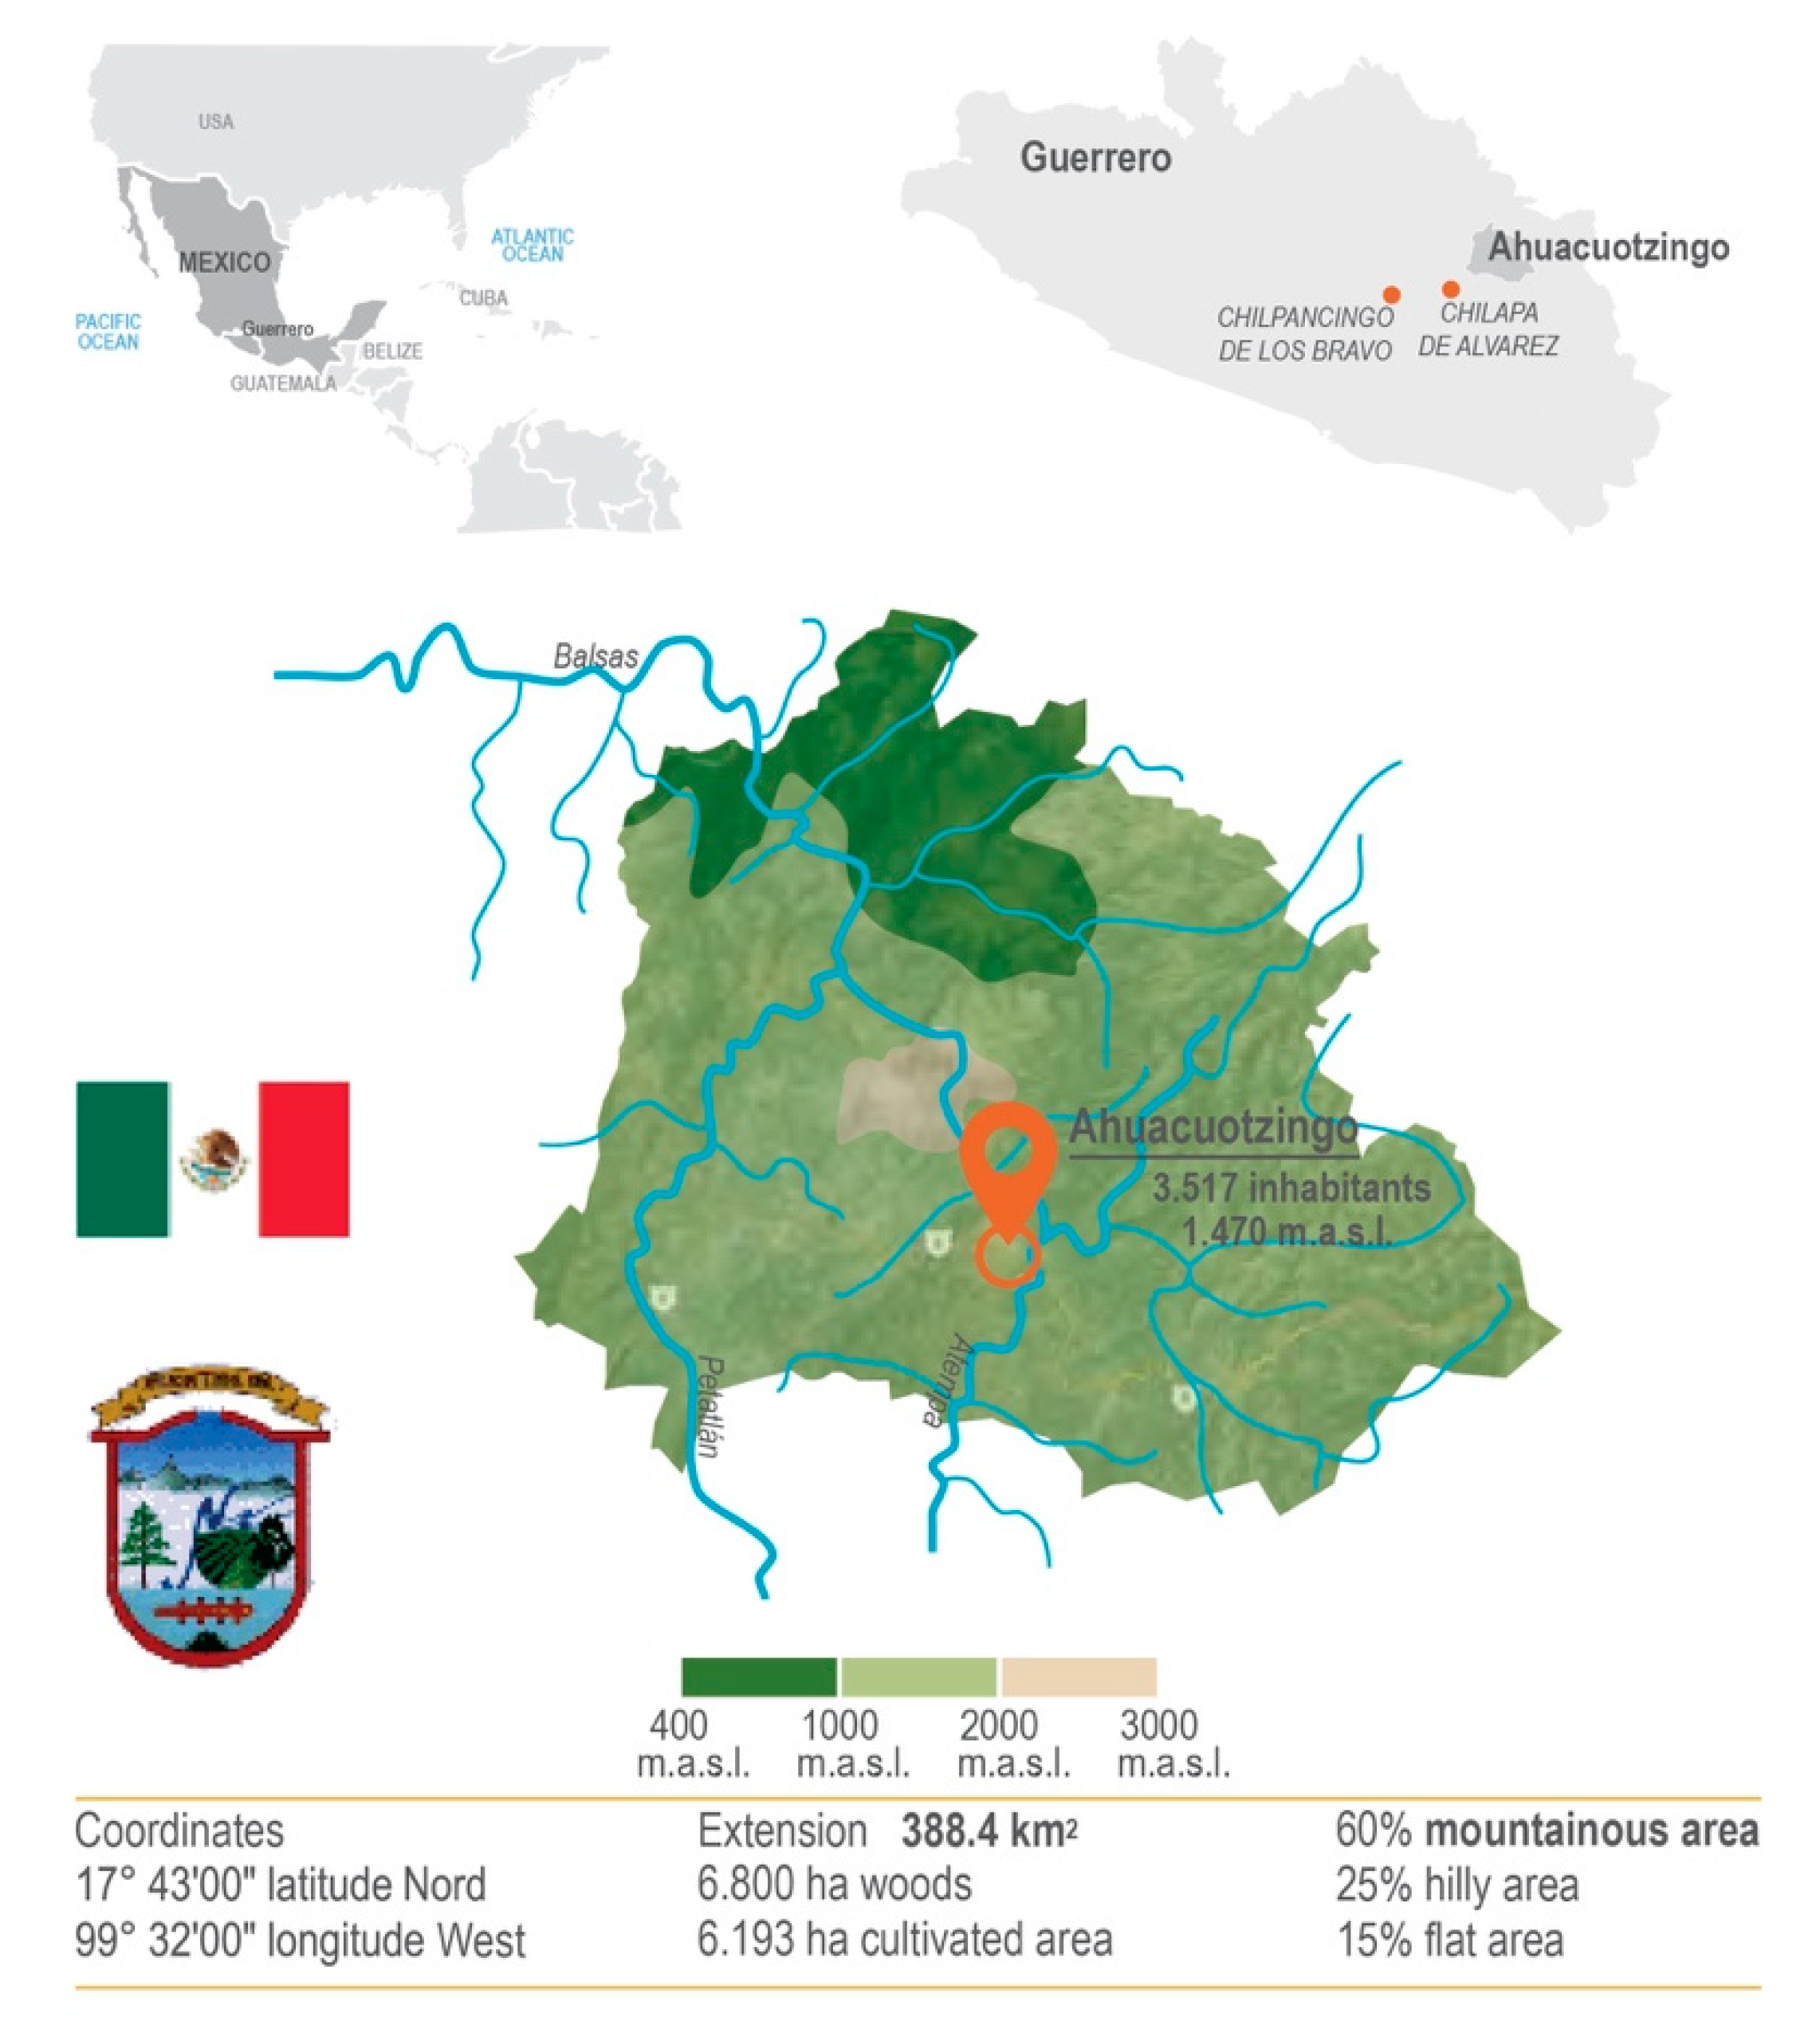
In this case study, we consider an applied study developed in Ahuacuotzingo (Mexico) within the context of a PhD thesis on SD [61], with the goal of implementing sustainable good-practices that could foster the economic and social relations of the farmers. The HD started, through desk studies in Italy, with a recognition of the Mexican territory (HD2) by the foreign PhD student to the community. Due to the lack of data around the different production processes present there, different periods of field research in the area were done with direct field visits and interviews thanks to the presence of a local connection actor who gained the trust of the community and facilitated interactions, welcoming the designer inside the community. The direct collaboration of the local community was a key element in analysing the different processes performed by different small farmers (HD1).
The strong sense of belonging to the territory and traditions among the community of farmers played a central role in the analysis and offered a significant advantage to the data collection process, both in HD1 and HD2, where the community was very active and proud to cooperate. The research synthesis (Figure 9 and Figure 10), in this case, was developed during the data collection process and greatly helped the student organize a large quantity of data and manage the complexity of the research, thereby obtaining a big picture to help start the gap analysis.
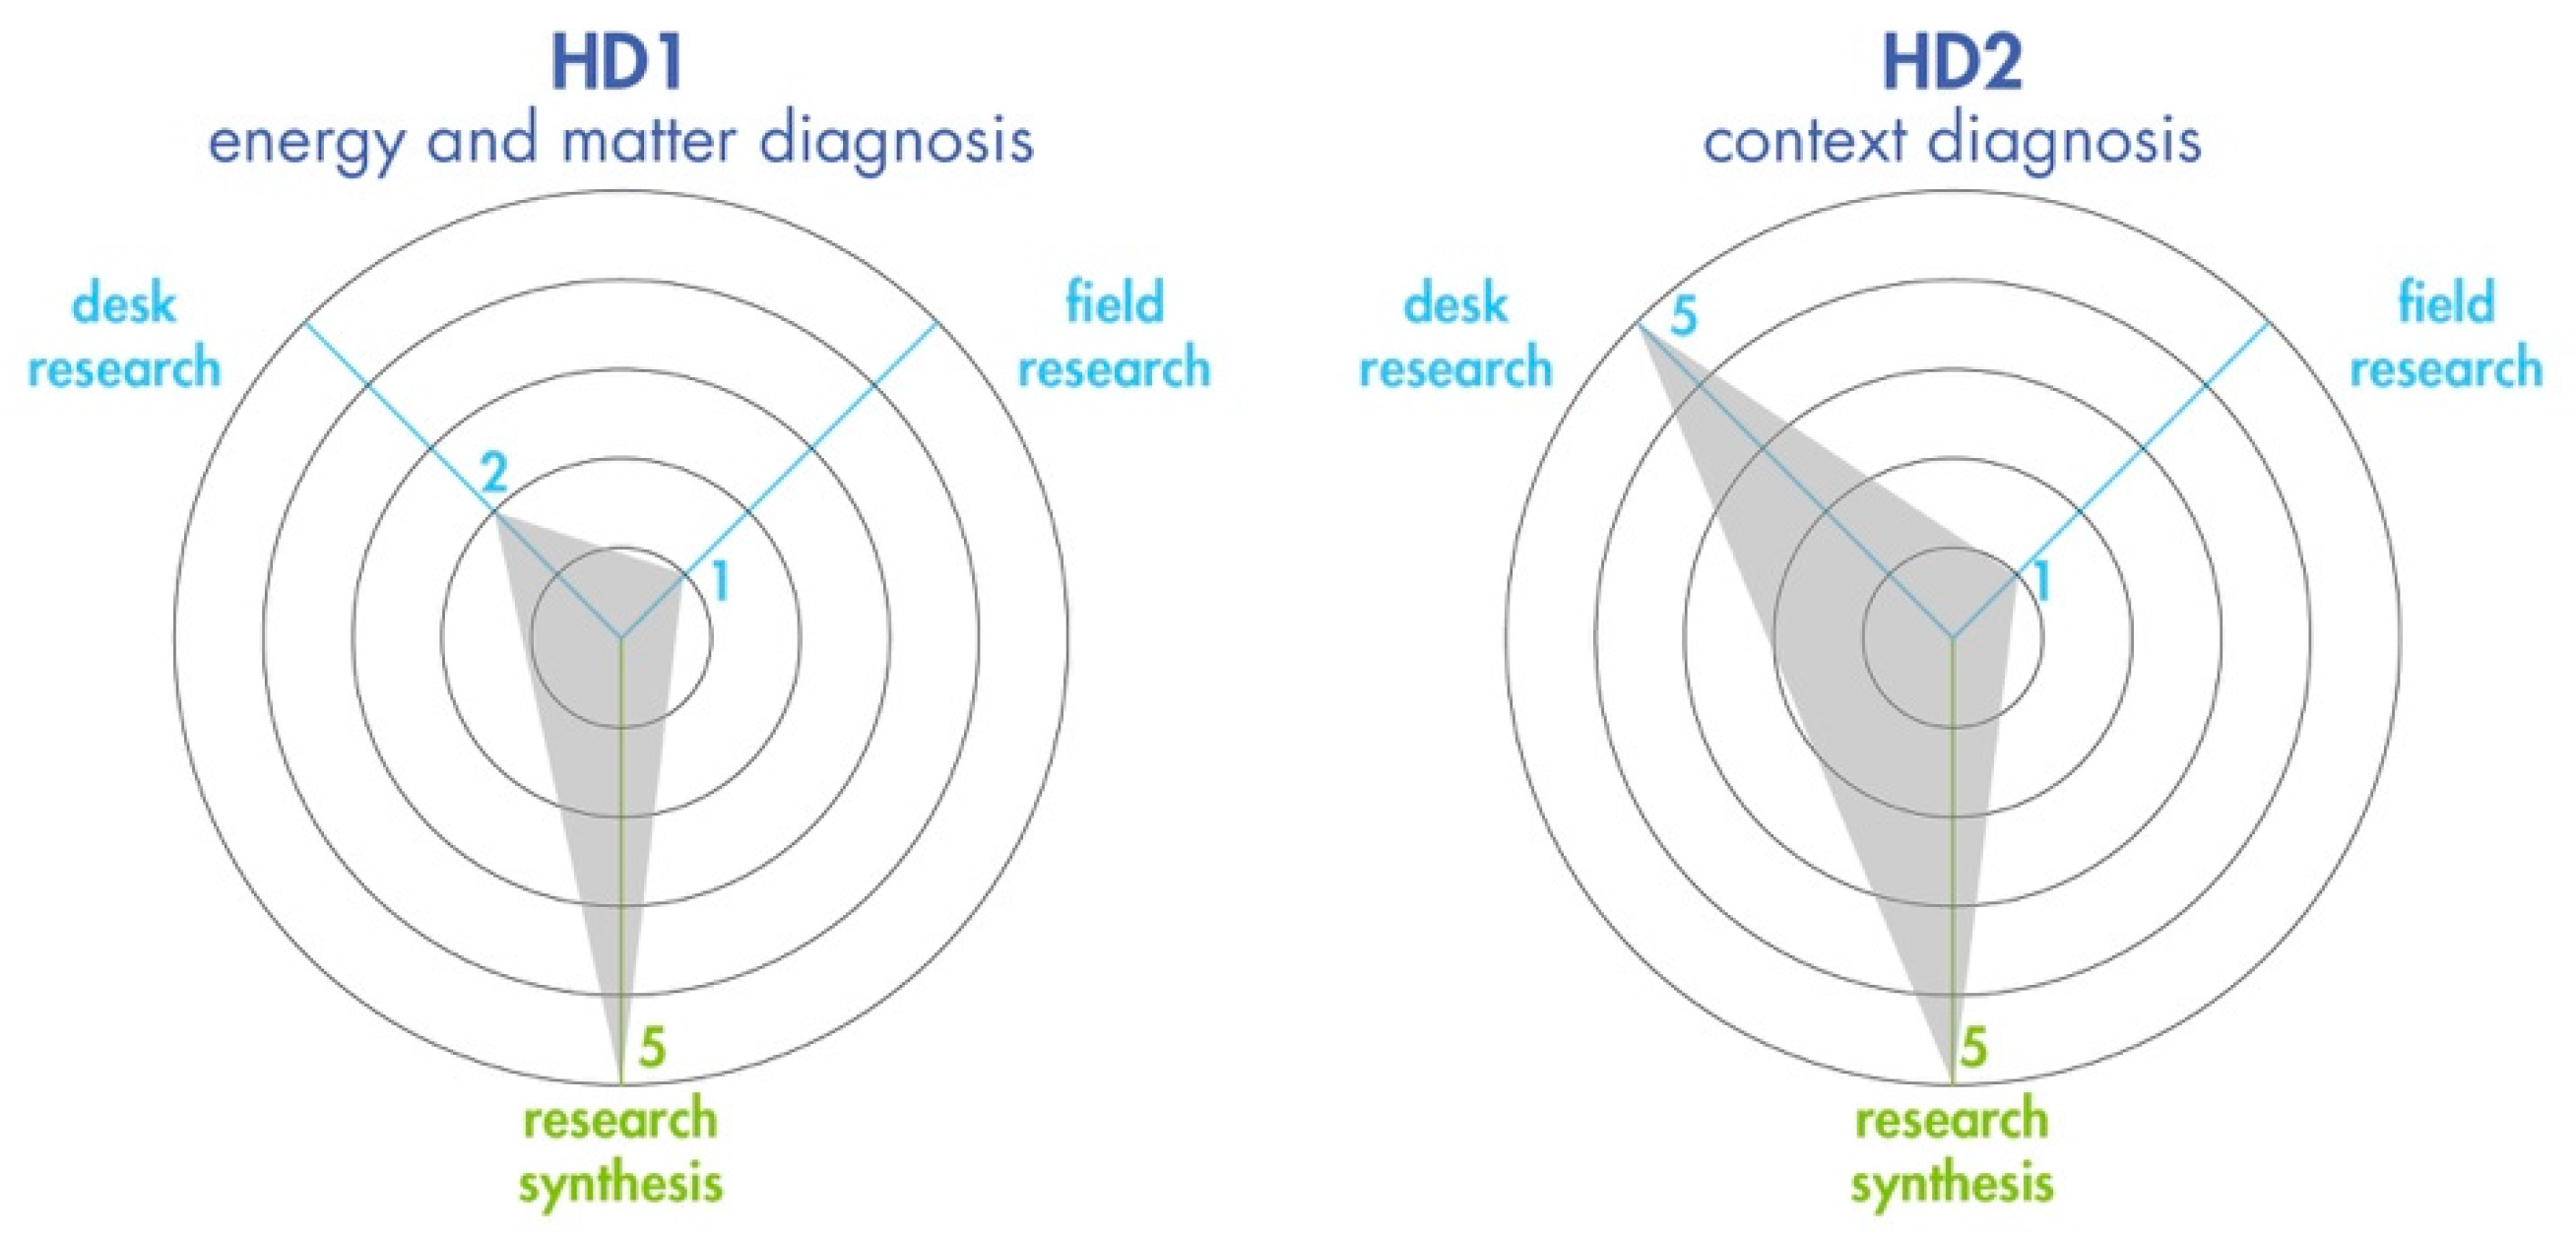
The overall HD process can be evaluated as represented in Figure 11, taking into consideration the level of detail and importance of each phase (desk and field research and research synthesis). In this particular case, the HD approach was, afterwards, turned into a key tool for developing strategies for social innovation in the territory and fostering rural livelihoods.
Another project with the goal of bonding the link between the territory and the community is the one performed in the area of Lea-Artibai in the Spanish Basque country [62].
3.3.3. Policy Making
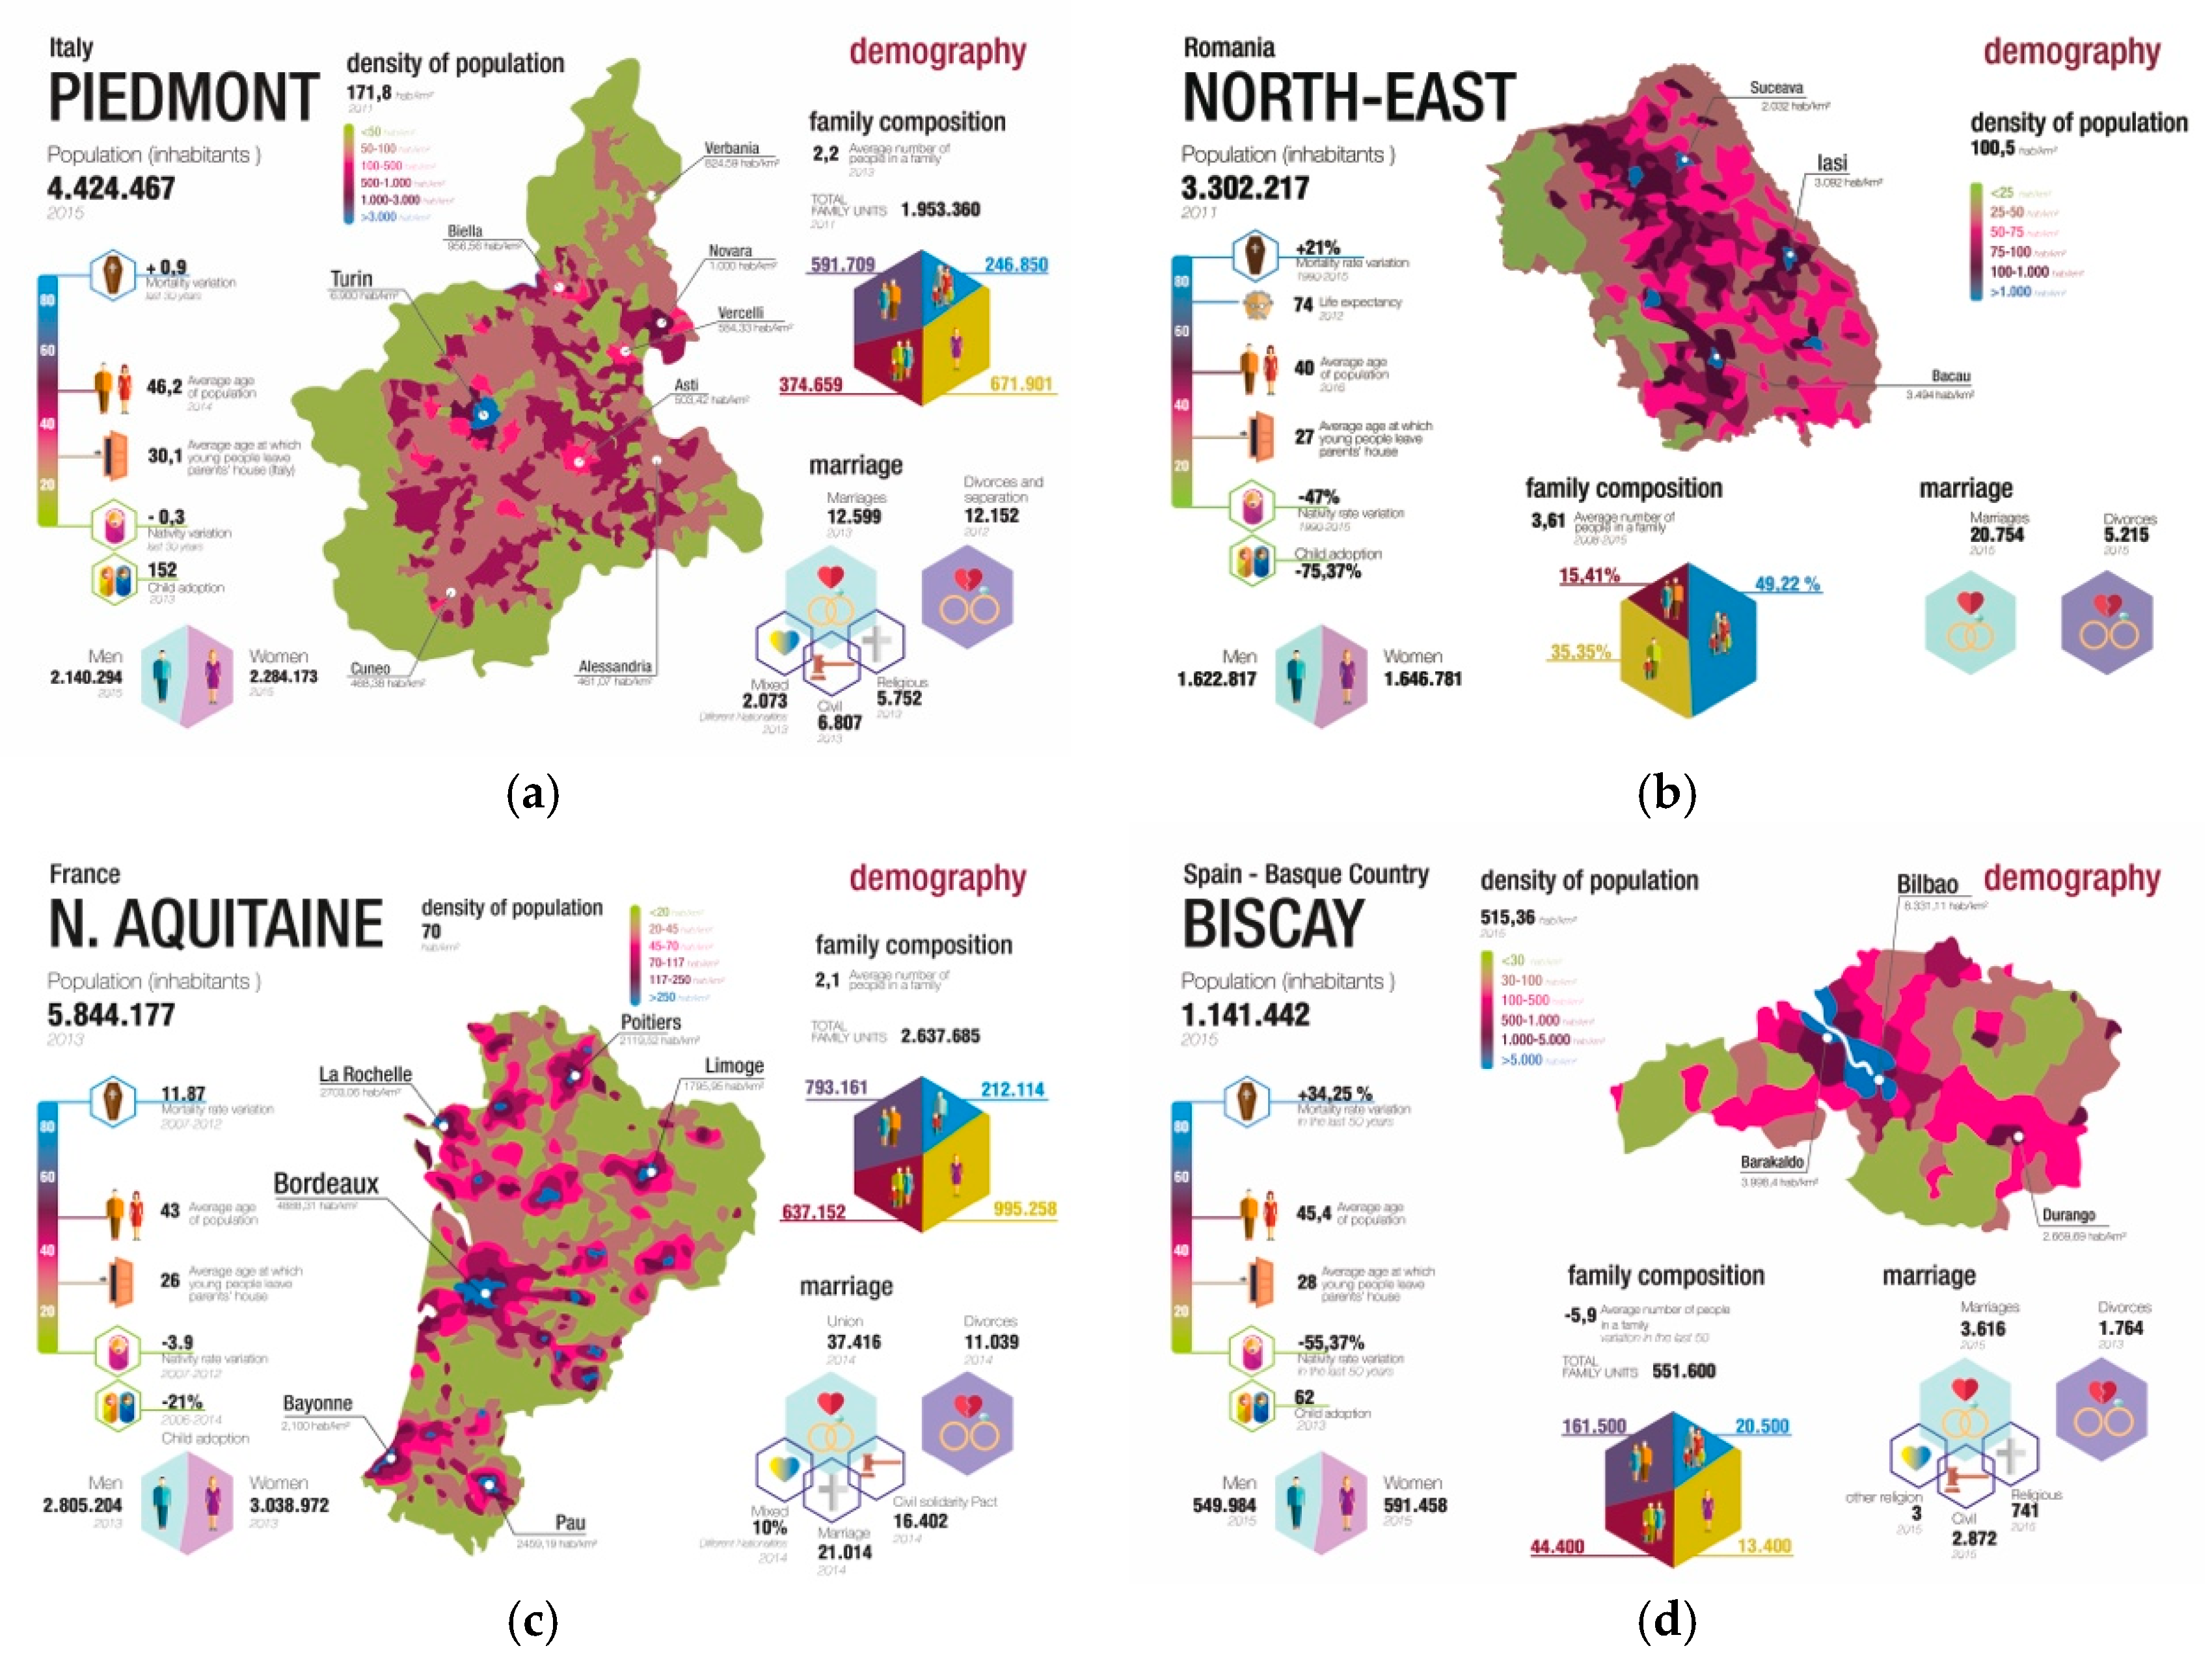
HD, as a tool for policymakers, still has limited research in the context of policy-making. Nevertheless, the implementation of the SD methodology in policy-making processes has proven the key role of these approaches in participatory processes. At first sight, it can be challenging for policymakers to understand the importance of HD because of traditional governments models. However, HD is regarded as a supporting tool to increase the effectiveness and innovation of the public-sector. This instrument aims to improve our ability to help authorities and policymakers deal with public issues through a qualitatively innovative approach in the process of policy-making. A current example of HD in policy-making is the RETRACE Interreg Europe project (a systemic approach for transition towards a Circular Economy) [18]. The aim of this project is to drive EU policies towards a Circular Economy by applying the SD Approach [63]. The project coordinated by the SD research group in the Department of Architecture and Design (DAD) at the Politecnico di Torino, involves eight private and public partners and more than 70 stakeholders from Italy, France, Spain, Slovenia, and Romania to foster the cooperation between EU regions. The HD tool, in this case, started from the HD2 of each different region involved to understand each region’s principal characteristics, and the productive sectors subsequently directed policies on the Circular Economy. The data required for the collection of information on the regions were decided by the lead partner (SD Research group), and the HD2 was implemented in every region thanks to coordinated work between universities, local authorities, government offices, associations, public administration, and local stakeholders requiring several months. After the research process, the information from all five involved regions (through desk research) was assembled by the lead partner (the SD Research group) in charge of the HD research synthesis (Figure 12) [56]. In the case of the Piedmont Region, the lead partner was in charge of both the data collection and the research synthesis. In this case, the visualisation phase for the HD2 delivered all the information collected to all the different actors involved in the data collection, providing a starting point to open discussions and receive more feedback.
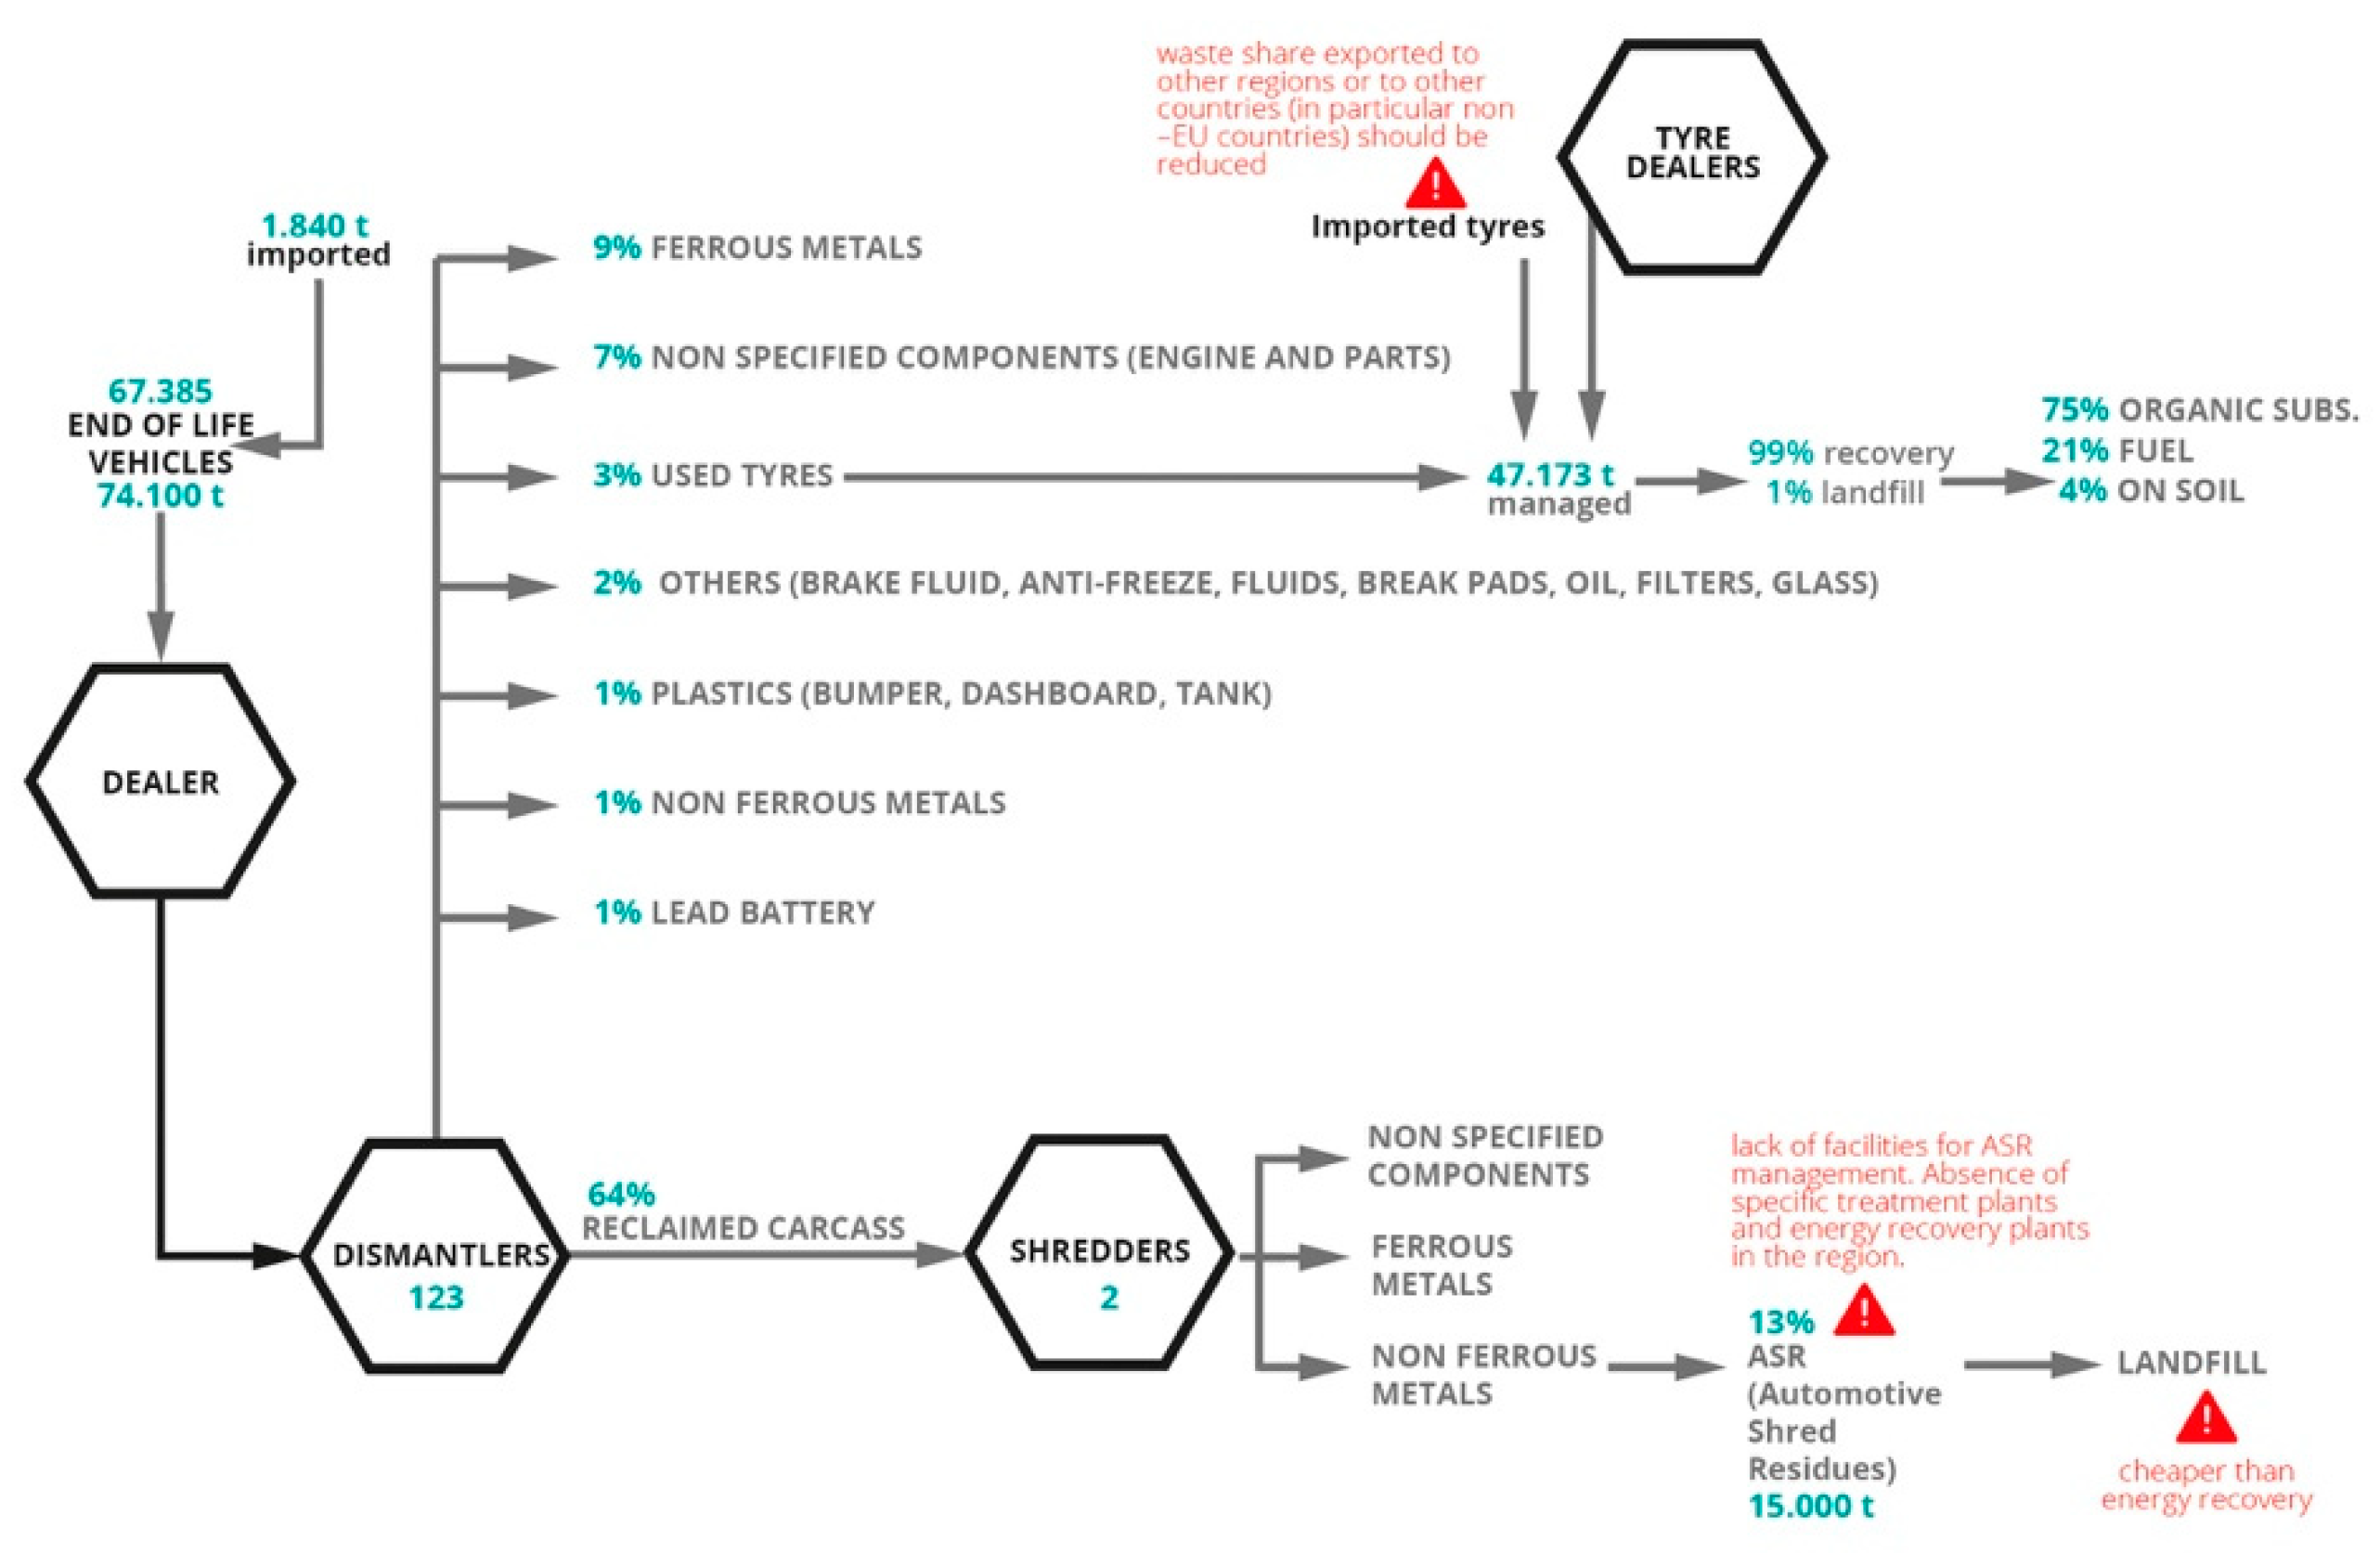
Subsequently, each region performed an HD1 of the main productive chains (Figure 13). This analysis aided in a better comprehension of the main complex industrial systems (productive chains) of each region, thereby obtaining a holistic panorama that facilitates policy-making processes to identify opportunities that can foster a transition into the Circular Economy, where waste (outputs) from one productive chain part becomes the input for another. In the case of the Piedmont Region, this analysis was implemented especially through desk research on official regional documents dealing with special waste management, such as [64].
In this project, the designers from Politecnico performed both roles, project managers and methodology leaders, so instructions for the content and execution guidelines were synchronized to execute and effectively perform this HD methodology.
For the purpose of the project, another step was added. This step focused on a deeper description of the policy instrument addressed by each country, in order to highlight the strengths and weaknesses related to its inclusion of the Circular Economy and SD.
The overall HD process can be evaluated as in Figure 14.
4. Discussion: A New HD Framework
Given the past experiences of former examples where HD was settled, implemented, and assessed with partners and stakeholders (universities, local authorities, government offices, associations, and public administration), these stakeholders can allow one to refine and perfect the framework. Moreover, they can help make the framework more accessible and comprehensible for transdisciplinary research toward sustainable development. After such processes, the result is the definition of a more structural and organized process to elaborate, create, generate, configure, draft, and perform the HD to frame and reveal problems efficiently in any complex context, thereby giving directions to design a sustainable future—from the research and visualize [54] stages to Assess, Research, Collect, Visualize, Interpret (ARCVI) (Figure 15). This classification is in line with the SD methodology identified by Ryan 2014 [66] and composed of the following steps: inquiring, framing, formulating, generating, facilitation, and reflecting.
4.1. Assessment of the Data Framework
In order to properly assess a data framework is vital to understand the scope of the projects which allows moreover to define the boundaries of the system, from the social, regional, urban or industrial system. However, “systems rarely have real boundaries” [48] (p. 95), but mankind has used them to define otherwise endless concepts according to their intended purposes [48]. Each project has a key topic from where to start the analysis: a particular industry, sector, value chain, or context. The preliminary conditions for each project frame this starting point. When dealing with territories (such as cities, regions or countries), these conditions can be defined by political, geographical or cultural borders, depending on the case.
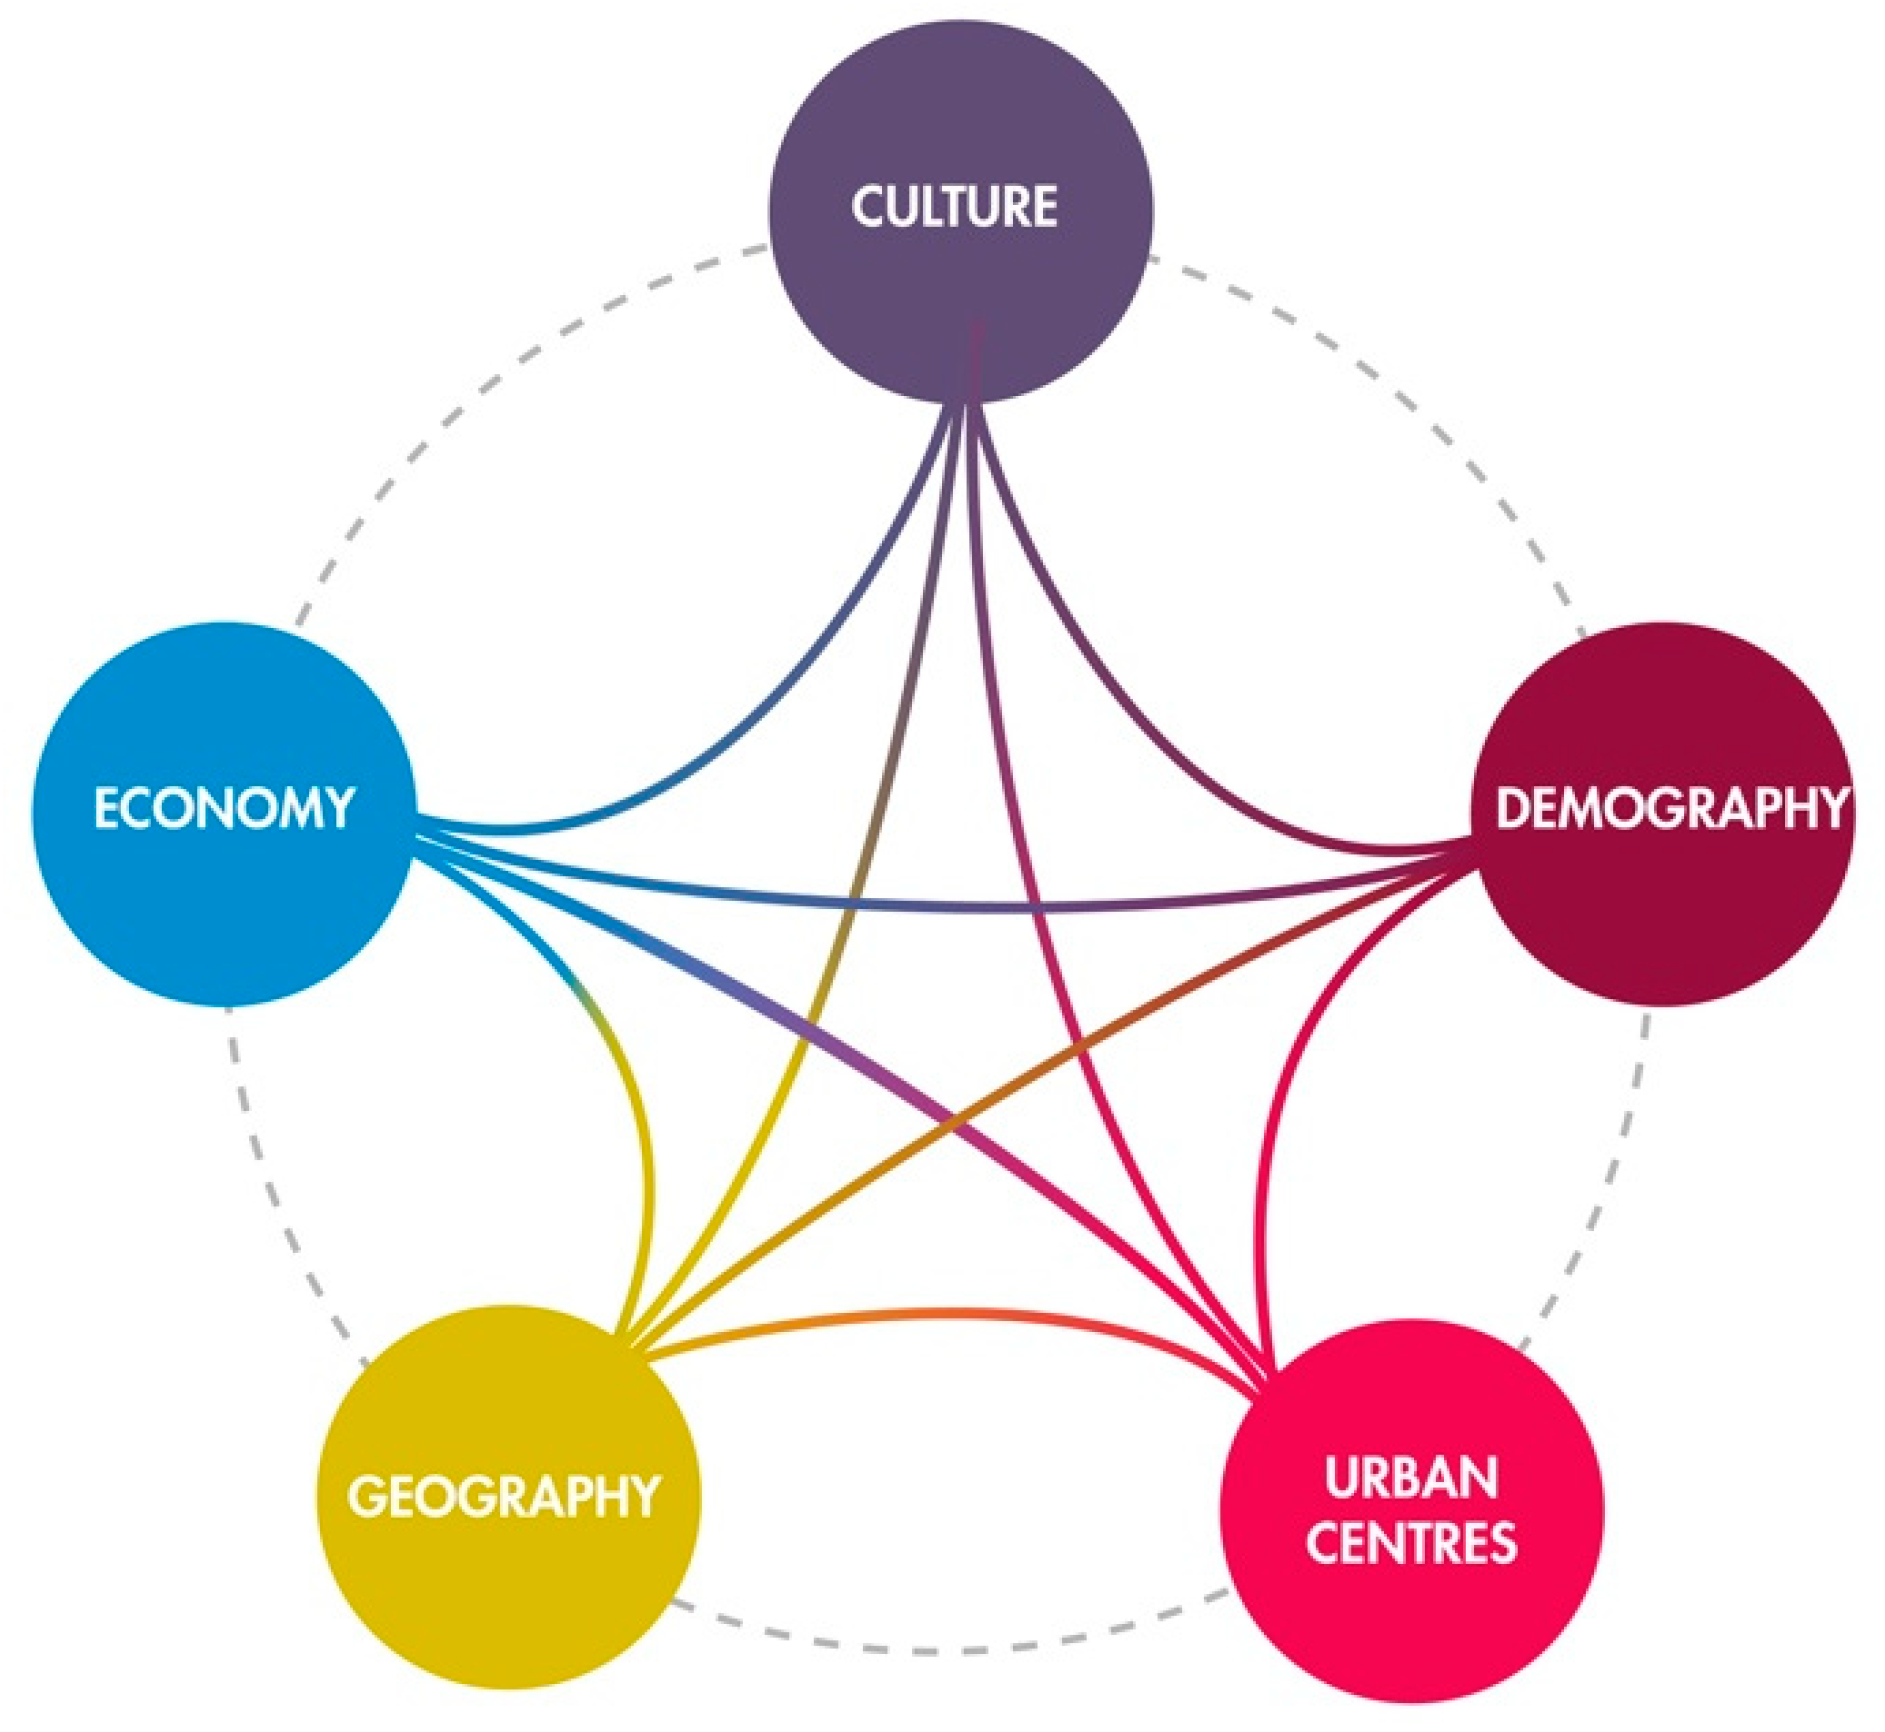
Afterwards, the definition passes to the categories in which the principal topic will be analysed. These categories are distributed into subjects depending on the scope of the research. For example, in the case of the case study on the RETRACE project, the main categories of data were geography, demography, culture (material culture—craft, art and architecture—, gastronomy, history), economy, and urban centres (Figure 16).
The geography part focused both on an understanding of the principal morphological features and on the use of the soil by anthropomorphic activities, such as the residential area and productive activities. Such categories deliver a frame for a wide analysis perspective of the area. Nevertheless, to avoid an overly broad perspective, it is essential to establish the level of detail (subcategories) according to the scope given and from the timeframe. The division into categories supports organized data collection that will be key in further stages of the method. It is essential to canalize the bundle of data to establish the scope of the investigation, which will delimit an early selection of the data that are considered inside the process. At the end of this stage, the main outcome should be the generation of a personalized format.
4.2. Research
This step was previously divided into desk and field research [54,55], using the terminology from [67]:
- Desk research: In this case, the review of information about the state-of-the-art is done through different sources, both conventional and unconventional. Conventional sources are understood as existing scientific literature, official reports, and databases. Unconventional sources are understood as official data found on social networks (Facebook, Twitter, Youtube, LinkedIn) and audiovisual media (T.V., News, Radio, Internet) that can be supported on verified portals (Over the years this trend has increased its popularity).
- Field research: This typology defines research taken to the place where the collection of data will be developed. This involves tools and informal activities, such as interviews, observations, and live descriptions of qualitative and quantitative information.
These two types of research methods are well known to the research community and have been developed by many scholars. They should happen simultaneously, as they complement one another. Furthermore, in some cases, it is necessary to verify, in the field, the information found with desk research. This verification is done to increase the level of accuracy of the research and verify if the given data are current. However, both quantitative and qualitative data are needed to frame a topic.
The research phase mainly depends on the level of detail of the data targeted. Sometimes the defined goal in the assessment phase cannot be reached due to many factors, as demonstrated in the multiple case-study analysis in Section 3.3. For HD in industrial production, the collection of data for HD1 usually finds its largest shortcoming in the lack of openness and trust by the industry to the researchers, through the signing of a non-disclosure agreement. It also requires many field visits inside a production plant to understand its qualitative aspects, which usually are not given by the industry, commonly because of the lack of analysis of particular aspects (e.g., the calculation of heat dispersion during the process). Indeed, from the evaluation graph (see Figure 8), it is possible to notice how the field research in this case is very relevant to the HD1 stage, and it has been evaluated with five, the maximum score. Moreover, in many contexts, the HD2 phase at the beginning is seen as a completely useless tool that needs to be developed by researchers without initial support. The RETRACE project, for example, finally demonstrated its potentialities after research synthesis, when each contributor to the analysis raised his or her level of awareness of the current situation and wanted to continue to add information. For this reason, research synthesis is evaluated with the maximum score (5) in both stages of the HD process (see Figure 14). Another critical point, for example, in this European project where the HD2 was performed at the same time in different contexts, was the accessibility of certain databases. The level of detail was not equal in all the regions involved due to the differences in the national census on agriculture, economy, and population (see Figure 17). Due to this problem, the feedback received at this moment was able to confirm or modify the categories of the data assessed previously.
Fundamental to this step is keeping track of the reference used to identify the data, the day when the research was performed, and the person in charge of the research, in the case of a large team.
4.3. Collect
The aim of this phase is to assemble the data gathered in the research phase. Such data are organized inside the format established in the ASSESSMENT step. Alongside this process, it is important to include the references for each data in order to guarantee accuracy inside the analysis and enable tracing of the information at all times. This organization will support the researcher in further steps. Once the format is completed, the main outcome should be a unified database.
One of the key aspects of this phase is the confrontation of ideas between all the actors of the multidisciplinary research team because it allows a collection of data under diverse disciplines, thereby giving the analysis a wider approach. One suggestion is to use a database that is common and well-known between all the actors to facilitate the integration of feedback. Here, the HD format becomes an important tool to reach a synchronized dialogue between the actors of the research, allowing them to add information into the format simultaneously. This advantage facilitates research collaboration between people in different places and countries (Table 1).
In the RETRACE project, for the collection of data related to the HD2, an excel file was used. This file was organized as represented in Table 1 and was able to keep track of each data collected. It was also able to simplify future checks by a third party and provide a reliable document for the party in charge of the research synthesis.
4.4. Visualize
The interpretation of the database on a first approach can be difficult, given the complexity of the context. At this stage, the information and the potential connections between the categories are only comprehensible by the research team. Therefore, this visualization phase is key to place the information on a common ground where all actors can access it and have a productive and collaborative horizontal dialogue. For an example created for the RETRACE project, please see Figure 12, Figure 13 and Figure 17.
To display the information smoothly and comprehensibly, it is necessary to use different graphics tools to elaborate visualizations and infographics [68]; these tools may range from payment/free software to freehand drawings. The display of this information allows one to glimpse potential connections between the different categories relating quantitative and qualitative information:
Using drawings or pictures as a way of representing problems or issues is widely used for collaborative problem-solving, and the power of diagrammatic representations to evoke and record human perspectives is widely acknowledged across a range of domains including sustainable development, social entrepreneurship, information visualisation and knowledge representation.[69] (p. 5)
Visualization should be in line with the goal of communication. Visualization changes every time, depending on the goal and its public. As Tufte wrote, context is essential to understand visualization, and “graphics must not quote data out of context and context is essential for graphical integrity” [68] (p. S1678). In this phase the role of the designer is highlighted as a mediator between complex data and all actors of a project, translating the given information into efficient and simple visual language. This is possible thanks to their skills in communication and user analysis. Each single category collected in a single paper permits the creation of infographic maps that should be made “through stages of refinements shifting between manual and digital media...helped the designer to internalize very large amounts of information...printing it out in hard copy and hanging it on the office or studio wall would make these large amounts of information immediately accessible at any time”, as Sevaldson suggested for the giga-maps [42] (p. 12).
As seen in the case studies, research synthesis acquires a central role in the management of complexity, proving to be a useful method for researchers to control a significant quantity of data (see the Mexican case and the EN.FA.SI project), where the research synthesis gains two points for its importance in the entire process--to be used as a platform where, on the printed giga-maps, all the stakeholders can comment, give their feedback, and have a big picture of the system during analysis, thereby scoring five points.
4.5. Interpretation of Complexity
The visualization of the data helps to ease one’s reading and interpretation of the complexity, which is considered a qualitative inductive method. This method allows one to reframe the so called wicked problems [30] of a territorial system, highlighting the driving factors and the sleeping assets. This means it aims to reach, adopt, and mirror the complexity and wickedness of real-life networks of interconnected problems [43]. This process allows an effective and holistic reading of the territory, enabling a deep and effective analysis of the context by locating connections among the data presented on each map. Moreover, visualization enables the interpretation of the data’s flows, as well as relational factors, encouraging an overview of the existing relationships between the components and processes. Such interpretation oversees the system’s criticalities beyond the immediate cause but from a wider perspective of how it can be addressed from a systemic point of view [70]. Therefore, these elements are not solved in a logical way, and the process is not taken over by the designer. On the contrary, visualization allows all members of the multidisciplinary research team to have access to the same kind of information to elaborate further analysis of a complex scenario, integrating all feedback. Ultimately this stage shows that this kind of method leaves the HD open and comprehensible to everyone, from experts in the field to common citizens.
In the case of the RETRACE project, an example of the ‘interpretation of the complexity’ delivered by the information collected in the HD process (see the case study on policy-making) was the recognition of a gap in the current policies activated at a regional level. In fact, at the regional level, there is a high presence of companies related to the food sector (based on more than 3000 data from the focus on economy) and a high amount of agricultural vocations (more than 1,000,000 ha of useful agricultural area, based on data from the focus on geography), as well as many well-known products at the international level (data from the focus on gastronomy culture). However, the companies working in the primary sector are not considered by the policies that currently focus on industrial sectors in decline, although these activities are great producers of organic waste, which can be improved and reduced using practises on Circular Economy.
4.6. Research Challenges
This research started in 2016 thanks to the reflections carried out for the European project. It is possible to individuate some challenges related both to the framework proposed and the research itself. Although the HD method has proven its effectiveness and accuracy, there are certain limitations to be considered, which were also pointed out in the description of the framework steps.
In all case studies, a large challenge is data accessibility. The most common issue is related to database consultation in different contexts. This is due to the lack of updates, language barriers, and the level of detail of the information delivered on such platforms. Parallel to this, the main issue relies on where date are incomplete or cannot be found. Moreover, the collection of quantitative and qualitative data requires a close partnership with local stakeholders, not only for access to tangible databases but also for the collection of intangible data as behavioural or cultural. In many cases, the HD has demonstrated itself to be an effective process for all actors in the territory and is able to increase awareness of the local resources. This happens because these actors were stimulated to think in a holistic way, thereby enlarging the borders of their scenario understanding outside the classic narrow approach and overpassing the ‘localism’ effect sometimes present inside a few kilometres. Another challenge is the cultural barrier rooted in the current cultural paradigm, linear thinking, and language. The method requires an interdisciplinary team, in some cases managing authorities or corporate teams (traditional structures), which will have a top-down approach. This will entail some troubles in assembling a team within the workgroup. For example, the HD within the RETRACE Interreg Europe project was a key element in the decision-making processes, helping to visualize, from a wider lens, multidisciplinary teamwork at a policy level, through the collection of different feedback from all stakeholders across the spectrum. At the same time, HD also provided the opportunity to visualize the main difficulties faced by actors who are not familiarized with the SD Approach, which disrupts the traditional linear top-down approach of governance and instead deals with multiple components and bottom-up approaches. HD promotes a multi-stakeholder approach, which passes from the general to the particular, and vice versa.
A crucial phase is the identification of system boundaries and the level of detail of the analysis in the assessment step, which can influence the system analysis and the final results because of its high level of dependence from the system observer. Certainly, this framework must be adapted to the preliminary conditions of each project, as demonstrated by the different case studies. Each project proposed for an HD has a specific topic for analysis: a particular industry, sector, value chain, or territory. The analysis of these topics within the HD method can define and highlight various potentialities and criticalities, helping to define new scenarios.
A challenge related to multidisciplinarity is the requirement of involving multiple experts in the working team alongside the designers. This can also represent a preliminary obstacle for funding reasons. However, HD offers a playground of collaborations, which take the interpretation phase to a higher level.
Moreover, the challenges can be related to the research itself. Effort was employed in framing the proposed design method to provide a framework adaptable to all the design requirements. For this goal, case-studies were selected among the previous studies in different sectors carried out by the department. Until now, HD was always guided by the SD research group in Politecnico di Torino and executed by a mixed group of stakeholders in the different territories where the projects were proposed. HD has not yet been proved to be effective without the leading role of systemic designers, which could represent a limit. However, this study opens the use of the HD method to the research community for a testing phase in multi-layered projects.
5. Conclusions
Today’s societal challenges require holistic approaches that are able to interpret and provide innovative and sustainable solutions. Within such scenarios are necessary creative and structured design methodologies, which represent the key to intervening in contemporary issues and shaping future designs for sustainability. New approaches like SD provide specific tools to help design new relations among the entities of a system, displaying their hidden relationships and potentialities and facilitating a proactive collaboration among the actors. This process of integrating ST in design allows contexts to be understood more deeply with a wider perspective. A key component of this disruptive approach is the HD tool, which can be applied to diverse contexts (from industrial production to local communities and policy-making), delivering effective strategies to frame and reveal problems efficiently in any complex context that, consequently, can facilitate decision-making processes.
HD, as a method, has been previously described and defined in different papers and books [14,41,54,55]. From that starting point, this article aimed to define and assess it as a detailed process step by step, to be applied in different fields to organize information about complex scenarios in a holistic and effective way. This method is poised to transcend beyond the design scene to be implemented by other scholars and workers in different sectors, thereby facilitating interdisciplinary discussions on SD. For more than over 10 years, this process has been proven in diverse case studies, from industry to communities to policy-making, allowing us to recognize and understand the benefits and limits of this method at different levels.
The HD overview of complex scenarios provides tools to encourage the generation of new cooperation channels among different local actors, generating more sustainable solutions. The information breakdown of complex phenomena into a holistic perspective for all stakeholders promotes horizontal dialogue between stakeholders. This aspect is delivered effectively through data infographics that improve decision-making processes and allows an overview of all potentialities and the so-called ‘sleeping assets’, which can activate new relations among the context components, thus generating new autopoietic systems. This method, through the generation of resilient systems, allows flexibility on multi-levels, passing from regional to national. At the same time, it delivers a structured methodology that facilitates effective implementation of the HD, producing more accurate results. Fostering a multidisciplinary approach that invites participants from different sectors to co-create within an interdisciplinary scenario will connect governments and citizens, to obtain more sustainable development.
After showing the wide range of applications of this method, one of the figures that stands out in the process as the main mediator between actors or stakeholders is the designer. This role, acquired by the designer during his/her experience in design practise, is required by disciplines that are multidisciplinary themselves. Certainly, the designer is a fundamental actor for the HD process because of his/her problem-solving and communication skills. These assets are key for the processing of information, thus transforming it into comprehensible and tangible reading for all stakeholders involved. To achieve this in an accurate way during the process, the designer has encounters with specialists in the areas involved in order to ensure a correct interpretation of the facts. This means the designer is in the spotlight of the HD method as a connector/mediator among all competencies and acts as a transdisciplinary team leader, who involves all actors inside the analytical framework. This proves that the design discipline has the necessary elements to use creative and structured innovation approaches to face the complexity in HD analysis.
Author Contributions
Conceptualization, C.B., C.G.N., and S.B.; Investigation, C.B. and C.G.N.; Methodology, C.B., C.G.N., and S.B.; Supervision, S.B.; Validation, S.B.; Visualization, C.B. and C.G.N.; Writing—original draft, C.B. and C.G.N.; Writing—review & editing, C.B., C.G.N., and S.B.
Funding
This research received no external funding.
Conflicts of Interest
The authors declare no conflict of interest.
Appendix A

Table A1.
Results of the literature review.
| Subject Area | Citation in Abstract | Year | Authors |
|---|---|---|---|
| SOCIAL SCIENCE—conflicts | “This article explores how quantitative risk and qualitative threat approaches led to incomplete analyses, and how bureaucratic processes stifled a holistic diagnosis of the situation in Mali.” | 2019 | Boeke, S., de Valk, G. |
| DESIGN and AGROECOLOGY | “It was structured around three main stakeholders’ workshops to support the holistic diagnosis, the design of a normative vision, and the backcasting approach of the transition pathway.” | 2019 | Audouin, E., Bergez, J.-E., Therond, O. |
| MEDICINE—clinical | “A holistic diagnostic approach is crucial to diagnose this condition and initiate therapy before complications set in.” | 2018 | Anand, P., Aggarwal, S., Garg, S. |
| ENGINEERING—materials | “We report results of systematic, holistic, diagnostic, and cell studies to elucidate the mechanistic role of the experimentally determined influence of the anode gas-diffusion layer (GDL…).” | 2018 | Steinbach, A.J., Allen, J.S., Borup, R.L., (...), Zenyuk, I.V., Weber, A.Z. |
| ENGINEERING—water | “We have tried to answer this question by a holistic diagnosis of water management and its projection in the future.” | 2018 | Merabet-Baghli, N., Bouanani, A., Billaud, J.P. |
| ENGINEERING—griculture | “Holistic diagnostic sugarcane supply chain studies are critical and have in the past identified several system-scale opportunities.” | Shongwe, M.I., Bezuidenhout, C.N. | |
| MEDICINE—ENGINEERING | “Integrated Assessment of Left Ventricular Electrical Activation and Myocardial Strain Mapping in Heart Failure Patients: A Holistic Diagnostic Approach for Endocardial Cardiac Resynchronization Therapy, Ablation of Ventricular Tachycardia, and Biological Therapy.” (in TITLE) | 2018 | Maffessanti, F., Prinzen, F.W., Conte, G., (...), Krause, R., Auricchio, A. |
| MEDICINE—ENGINEERING | “We report results of systematic, holistic, diagnostic, and cell studies to elucidate the mechanistic role of the experimentally determined influence of the anode gas-diffusion layer (GDL) on the performance of ultra-thin electrode polymer-electrolyte fuel cells, which can further enable fuel-cell market penetration.” | 2018 | Steinbach, A.J., Allen, J.S., Borup, R.L., (...), Zenyuk, I.V., Weber, A.Z. |
| ENGINEERING/ARCHITECTURE | “The wave-based NDT methods are found to be a value-added complement to routine methodologies for a holistic diagnosis of timber members.” | 2017 | Riggio, M., Macchioni, N., Riminesi, C. |
| MEDICINE—gynaecology | “The result implies the need for holistic diagnosis and counseling for patients with dryness complaints.” | 2017 | Ito, K., Takamatsu, K., Nohno, K., Sugano, A., Funayama, S., Katsura, K., Kaneko, N., Ogawa, M., Meurman, J.H., Inoue, M. |
| HUMAN-COMPUTER INTERACTIONS—data design | “Starting from an holistic diagnosis and the analysis of trends, the team define six personas, useful to write down essential guideline.” | 2017 | Montagner, F., Stabellini, B., di Salvo, A., Tamborrini, P.M., Marcengo, A., Geymonat, M. |
| MEDICINE—cardiology | “A Holistic Diagnostic Approach for Endocardial Cardiac Resynchronization Therapy, Ablation of Ventricular Tachycardia, and Biological Therapy.” | 2017 | Maffessanti, F., Prinzen, F.W., Conte, G., Regoli, F., Caputo, M.L., Suerder, D., Moccetti, T., Faletra, F., Krause, R., Auricchio, A. |
| SOCIAL SCIENCE—governance | “To this end, complex questions surrounding access to and control of information as well as pedagogical theory and practice need to be radically re-examined to ensure not only holistic diagnosis but also institutional arrangements that can connect remedial responses into some relatively coherent whole.” | 2017 | Camilleri, J. |
| MEDICINE—integrative | “Introduction Clinical holistic diagnosis (CHD) in Chinese medicine (CM) has tried to evaluate most of the whole body functions non-invasively but subjectively via pulse diagnosis (PD).” | 2016 | Luo, C.-H., Chung, C.-Y. |
| MEDICINE—integrative | “Introduction Pulse diagnosis (PD) in Chinese medicine (CM) is a well-established clinical tool used to aid holistic diagnosis.” | 2016 | Luo, C.-H., Su, C.-J., Huang, T.-Y., Chung, C.-Y. |
| MEDICINE—psychopathology | “In the process of critiquing this underside of MHE, psychopathologists are treated to a novel categorizing of themselves from a sociology of knowledge framework and psychopathology is offered a reframing of how to formulate holistic diagnostic impressions of ADP encompassing authentic culture.” | 2016 | Ajani ya Azibo, D. |
| ENGINEERING—mechanical | “The first approach is called symptom diagnostics, whereas the second is called holistic diagnosis…. Whereas in holistic diagnostics two kinds of models are used: linear and non-linear.” | 2015 | Żółtowski, B., Kostek, R. |
| COGNITIVE SCIENCE | “This mixed methods research examined how holistic diagnostic feedback (HDF) is processed by young learners with different profiles of reading skills, goal orientations, and perceived ability.” | 2015 | Jang, E.E., Dunlop, M., Park, G., van der Boom, E.H. |
| PHILOSOPHY | “Magic is neither modern nor traditional nor irrational per se, but has to be contextualized and described in terms of characteristics like holistic diagnosis, interpersonal congruence, the imaginations of agency, and efficacy.” | 2015 | Koch, A. |
| MEDICINE—pharmacology | “While still at early stages in the clinical phenome domain, there remains great promise that CZP can help us realize the application of personalized medicine and contribute to rational holistic diagnosis and treatment.” | 2015 | Yu, Y.-N., Liu, J., Zhang, L., Wang, Z., Duan, D.D., Wang, Y.-Y. |
| MEDICINE—biomedical | “Due to continuous development in advanced analytical techniques and in bioinformatics, metabolomics has been extensively applied as a novel, holistic diagnostic tool in clinical and biomedical studies.” | 2014 | Bujak, R., Struck-Lewicka, W., Markuszewski, M.J., Kaliszan, R. |
| ENGINEERING—environmental engineering | “Holistic diagnosis of pipeline system with impedance method.” | 2014 | Kim, S. |
| MEDICINE—Psychiatry and Psychotherapy | “Liaison psychiatry in Poland—Can we achieve a successful holistic diagnosis?” | 2013 | Sobieraj, A., Bracik, J., Paluch, K., Krysta, K., Krupka-Matuszczyk, I. |
| SAFETY | “Mature field subsurface integrity: Formulation of new paradigm through holistic diagnostic approach for D-field, Malaysia.” | 2013 | Ismail, W.R., Pradana, A.F. |
| MEDICINE—complementary and alternative | “Inspired by SCM practitioners’ holistic diagnostic processes, an integrated diagnostic model was then proposed by combining the four individual models.” | 2012 | Do, J.-H., Jang, E., Ku, B., Jang, J.-S., Kim, H., Kim, J.Y. |
| COMMUNICATION—CLIMATE SCIENCE | “To do this, we construct a holistic diagnostic rubric that allows us to examine atmospheric teleconnections, both energetically and dynamically, as produced by a general circulation model.” | 2011 | Shukla, S.P., Chandler, M.A., Rind, D., Sohl, L.E., Jonas, J., Lerner, J. |
| TRANSPORTATION—SUSTAINABILITY | “Another SHM solution has also been created that gathers raw vibration data and converts them into valuable information enabling analysts to provide a holistic diagnosis of a structure.” | 2011 | Matros, J. |
| MEDICINE—complementary and integrative | “Antioxidants work against degenerative processes in the central nervous system: Holistic diagnosis and therapy of Parkinson’s syndrome.” | 2009 | Kersteen, W. |
| MEDICINE—microbiology | “An holistic diagnostic approach is therefore necessary to interpret the test results optimally. Future studies should address this in further detail as well as the impact of empirical antifungal drug use and patient outcome.” | 2008 | Ellis, M., Al-Ramadi, B., Finkelman, M., Hedstrom, U., Kristensen, J., Ali-Zadeh, H., Klingspor, L. |
| MEDICINE—psychiatry | “Therefore, psychiatric evaluation should be integrated into a holistic diagnostic formulation.” | 2007 | Eytan, A. |
| MEDICINE—paediatrics | “If we regard functional dysphonia in a child as a symptom of a disturbed relationship between the child and his environment and as an indicator of a psychosocial conflict, e.g., within the family, we have to deal with this through holistic diagnosis and therapy.” | 2007 | Blaser, L., Seifert, E. |
| MEDICINE—complementary and integrative | “Coherence in medicine and holistic diagnosis.” | 2007 | Popp, F.-A. |
| MEDICINE—psychotherapy | “DSM-IV and the taxonomy of roles: How can the taxonomy of roles complement the DSM-IV to create a more holistic diagnostic tool?” | 2007 | Roten, R.G. |
| MEDICINE—gynaecology | “The successful dermatologic therapy requires the holistic diagnosis of the women with skin disorders described above and use the antiandrogenic treatment with conventional methods and laser depilation in hirsutismus.” | 2006 | Szpringer, E.A., Lutnicki, K.R., Zych, I.S. |
| MEDICINE | “Nature observation and mythology as basis for holistic diagnostics and therapy in Theophrastus von Hohenheim (Paracelsus).” | 2004 | Meier, P. |
| MEDICINE—paediatrics | “This is connected with general and multidimensional approach to the patient’s situation and therapy process and holistic diagnostical-therapeutical procedure.” | 2004 | Zegarlicka, M., Jarosz-Chobot, P., Kokoszka, A., Małecka-Tendera, E. |
| MANAGEMENT/HEALTH | “We document the recent emergence of health and safety concerns, assess the responses of employers and the Health and Safety Executive (HSE), critique the existing regulatory framework and present a holistic diagnostic model of occupationally induced ill-health.” | 2003 | Taylor, P., Baldry, C., Bain, P., Ellis, V. |
| MEDICINE—anaesthesiology | “By this way each component is mapped and a final (holistic) diagnosis can be made.” | 2003 | Poppe, C., Devulder, J., Mariman, A., Mortier, E. |
| MEDICINE—neurology | “Holistic diagnosis and therapy: My ‘heart’ from the psychosomatic point of view.” | 1995 | Peseschkian, N. |
| MANAGEMENT—PUBLIC ADMINISTRATION | “Hence the need to look at a broader institutional and policy context in an holistic diagnosis of the training process before actually addressing the detailed profiles of training needs. Three levels.” | 1992 | Collins, P.D., Mullen, J. |
References
- Rittel, H.W.J.; Webber, M.M. Dilemmas in a general theory of planning. Policy Sci. 1973, 4, 155–169. [Google Scholar] [CrossRef]
- Capra, F.; Luisi, P.L. Vita e Natura: Una Visione Sistemica; Aboca: Südharz, Hirsch-Apotheke, Germany, 2014; ISBN 978-88-95642-98-7. [Google Scholar]
- Capra, F. The Turning Point: Science, Society, and the Rising Culture; Bantam Books: Toronto, ON, Canada; New York, NY, USA, 1988; ISBN 978-0-553-34572-8. [Google Scholar]
- Raworth, K. Doughnut Economics: Seven Ways to Think Like a 21st-Century Economist; Random House Business Books: London, UK, 2017; ISBN 978-1-84794-139-8. [Google Scholar]
- Brown, T.; Wyatt, J. Design Thinking for Social Innovation. Dev. Outreach 2010, 12, 29–43. [Google Scholar] [CrossRef]
- Celaschi, F. Design as a mediation between areas of knowledge. In Man at the Center of the Project; Germak, C., Ed.; Allemandi and C.: Torino, Italy, 2008. [Google Scholar]
- Celaschi, F.; Formia, E.; Lupo, E. Do transdisciplinar ao indisciplinado modo de aprender design: Educar através de/para a Disruption. Strateg. Des. Res. J. 2013, 6, 1–10. [Google Scholar] [CrossRef]
- Weigand, K.; Flanagan, T.; Dye, K.; Jones, P. Collaborative foresight: Complementing long-horizon strategic planning. Technol. Forecast. Soc. Chang. 2014, 85, 134–152. [Google Scholar] [CrossRef]
- Jones, P.H. Systemic Design Principles for Complex Social Systems. In Social Systems and Design; Metcalf, G.S., Ed.; Springer: Tokyo, Japan, 2014; Volume 1, pp. 91–128. ISBN 978-4-431-54477-7. [Google Scholar]
- Jones, P.; Kijima, K. (Eds.) Systemic Design: Theory, Methods, and Practice. In Translational Systems Sciences; Springer: Tokyo, Japan, 2018; Volume 8, ISBN 978-4-431-55638-1. [Google Scholar]
- Systemic Design Research Network (SDRN). Available online: https://systemic-design.net/sdrn/ (accessed on 25 June 2019).
- Systemic Design Association. Available online: https://systemic-design.net/sdrn/ (accessed on 25 June 2019).
- ZERI Foundation. Available online: http://www.zeri.org/ (accessed on 10 June 2019).
- Bistagnino, L. Systemic Design. In Design the Production and Environmental Sustainability, 2nd ed.; Slow Food: Bra, Italy, 2011. [Google Scholar]
- Barbero, S. L’approccio metodologico del Design Sistemico. In Il Fare Ecologico; Lanzavecchia, C., Ed.; Edizioni Ambiente: Milano MI, Italia, 2012; ISBN 978-88-6627-062-1. [Google Scholar]
- Barbero, S.; Pallaro, A. Systemic design and policy making: The case of Retrace project. In Proceedings of the Relating Systems Thinking and Design (RSD5) Symposium, Toronto, ON, Canada, 13–15 October 2016. [Google Scholar]
- Battistoni, C.; Barbero, S. Systemic Design, from the content to the structure of education: New educational model. Des. J. 2017, 20, S1336–S1354. [Google Scholar] [CrossRef]
- RETRACE Project. Available online: https://www.interregeurope.eu/retrace/ (accessed on 5 June 2019).
- PROGIREG Project. Available online: http://www.progireg.eu/ (accessed on 20 June 2019).
- Yin, R.K. Case Study Research and Applications: Design and Methods; Sage Publications: Shawzend Oaks, CA, USA, 2017. [Google Scholar]
- Ceschin, F.; Gaziulusoy, I. Evolution of design for sustainability: From product design to design for system innovations and transitions. Des. Stud. 2016, 47, 118–163. [Google Scholar] [CrossRef]
- Bagheri, A.; Hjorth, P. Planning for sustainable development: A paradigm shift towards a process-based approach. Sustain. Dev. 2007, 15, 83–96. [Google Scholar] [CrossRef]
- Geels, F.W.; McMeekin, A.; Mylan, J.; Southerton, D. A critical appraisal of Sustainable Consumption and Production research: The reformist, revolutionary and reconfiguration positions. Glob. Environ. Chang. 2015, 34, 1–12. [Google Scholar] [CrossRef]
- Loorbach, D. Transition Management for Sustainable Development: A Prescriptive, Complexity-Based Governance Framework. Governance 2010, 23, 161–183. [Google Scholar] [CrossRef]
- Design Council. Eleven Lessons: Managing Design in Eleven Global Companies-Desk Research Report 2008; Design Council: London, UK, 2018. [Google Scholar]
- Gruber, M.; de Leon, N.; George, G.; Thompson, P. Managing by Design. Acad. Manag. J. 2015, 58, 1–7. [Google Scholar] [CrossRef] [Green Version]
- Meroni, A. Creative Communities. People Inventing Sustainable Ways of Living; Edizioni Polidesign: Milano MI, Italia, 2007. [Google Scholar]
- Ryan, C. Eco-Innovative Cities Australia. In System Innovation for Sustainability 1: Perspectives on Radical Changes to Sust; Greenleaf Publishing Limited: Sheffield, UK, 2008; pp. 197–213. ISBN 978-1-907643-36-1. [Google Scholar]
- Papanek, V.; Fuller, R.B. Design for the Real World; Thames and Hudson: London, UK, 1972. [Google Scholar]
- Buchanan, R. Wicked problems in design thinking. Des. Issues 1992, 8, 5–21. [Google Scholar] [CrossRef]
- Valade-Amland, S. Design for People, Profit, and Planet. Des. Manag. Rev. 2011, 22, 16–23. [Google Scholar] [CrossRef]
- De los Rios, I.C.; Charnley, F.J.S. Skills and capabilities for a sustainable and circular economy: The changing role of design. J. Clean. Prod. 2017, 160, 109–122. [Google Scholar] [CrossRef]
- Dorst, K. The core of ‘design thinking’ and its application. Des. Stud. 2011, 32, 521–532. [Google Scholar] [CrossRef]
- Van Manen, M. Beyond assumptions: Shifting the limits of action research. Theory Pract. 1990, 29, 152–157. [Google Scholar] [CrossRef]
- Ramage, M.; Shipp, K. Systems Thinkers; Springer: London, UK, 2009; ISBN 978-1-84882-524-6. [Google Scholar]
- Von Bertalanffy, L. General System Theory: Foundations, Development, Applications; George Braziller: New York, NY, USA, 1969. [Google Scholar]
- Wiener, N. Cybernetics or Control and Communication in the Animal and the Machine; The MIT Press: Cambridge, MA, USA, 1948. [Google Scholar]
- Charnley, F.; Lemon, M.; Evans, S. Exploring the process of whole system design. Des. Stud. 2011, 32, 156–179. [Google Scholar] [CrossRef]
- Bhamra, T.; Hernandez, R.; Mawle, R. Sustainability: Methods and Practices. In Handbook of Design for Sustainability; Bloomsbury: London, UK, 2013; pp. 106–120. [Google Scholar]
- Montagner, F.; Stabellini, B.; Di Salvo, A.; Tamborrini, P.M.; Marcengo, A.; Geymonat, M. Data Design for Wellness and Sustainability. In Universal Access in Human–Computer Interaction. Human and Technological Environments; Antona, M., Stephanidis, C., Eds.; Springer International Publishing: Cham, Switzerland, 2017; Volume 10279, pp. 562–578. ISBN 978-3-319-58699-1. [Google Scholar]
- Bistagnino, L. microMACRO. Micro Relations as a Vital Network of Economic and Productive System, 2nd ed.; Edizione Ambiente: Milano, Italy, 2017; ISBN 978-88-6627-211-3. [Google Scholar]
- Sevaldson, B. Systems Oriented Design: The emergence and development of a designerly approach to address complexity. In Proceedings of the 2nd International Conference for Design Education Researchers, Oslo, Norway, 14–17 May 2013; pp. 1–22. [Google Scholar]
- Sevaldson, B. Visualizing Complex Design: The Evolution of Gigamaps. In Systemic Design; Springer: Berlin/Heidelberg, Germany, 2018; pp. 243–269. [Google Scholar]
- Mollison, B. Permaculture: A Designer’s Manual; Tagari Publications: Tyalgum, New South Wales, Australia, 1988. [Google Scholar]
- Zhang, Y.; Yang, Z.; Yu, X. Urban metabolism: A review of current knowledge and directions for future study. Environ. Sci. Technol. 2015, 49, 11247–11263. [Google Scholar] [CrossRef]
- Eurostat. Economy-wide material flow accounts (EW-MFA). In Compilation Guide; Eurostat: Brussels, Belgium, 2013. [Google Scholar]
- Midmore, P.; Munday, M.; Roberts, A. Assessing industry linkages using regional input-output tables. Reg. Stud. 2006, 40, 329–343. [Google Scholar] [CrossRef]
- Meadows, D.H. Thinking in Systems: A Primer; Wright, D., Ed.; Chelsea Green Publishing: White River Junction, VT, USA, 2011; ISBN 978-1-60358-055-7. [Google Scholar]
- Agudelo-Vera, C.M.; Mels, A.; Keesman, K.; Rijnaarts, H. The urban harvest approach as an aid for sustainable urban resource planning. J. Ind. Ecol. 2012, 16, 839–850. [Google Scholar] [CrossRef]
- Wolf, M.-A.; Chomkhamsri, K.; Brandao, M.; Pant, R.; Ardente, F.; Pennington, D.W.; Manfredi, S.; De Camillis, C.; Goralczyk, M. ILCD handbook-general guide for life cycle assessment-detailed guidance. 2010. Available online: https://eplca.jrc.ec.europa.eu/uploads/ILCD-Handbook-General-guide-for-LCA-DETAILED-GUIDANCE-12March2010-ISBN-fin-v1.0-EN.pdf (accessed on 25 June 2019).
- Oxman, R. Think-maps: Teaching design thinking in design education. Des. Stud. 2004, 25, 63–91. [Google Scholar] [CrossRef]
- Berg, T.; Pooley, R. Rich Pictures: Collaborative Communication Through Icons. Syst. Pract. Action Res. 2013, 26, 361–376. [Google Scholar] [CrossRef]
- Buzan, T.; Buzan, B. How to Use Radiant Thinking to Maximize Your Brain’s Untapped Potential; Dutton: New York, NY, USA, 1996. [Google Scholar]
- Gaiardo, A. Innovation, Entrepreneurship and Sustainable Design. A Methodology Proposal for Sustainable Innovation Initiatives. Ph.D. Thesis, Politecnico di Torino, Turin, Italy, 2016. [Google Scholar]
- Barbero, S. Opportunities and challenges in teaching Systemic Design. In Proceedings of the Systems and Design: Beyond Processes and Thinking, Valencia, Spain, 22–24 June 2016. [Google Scholar]
- Battistoni, C.; Nohra, C.G. The Retrace Holistic Diagnosis. In Systemic Design Method Guide for Policymaking: A Circular Europe on the Way; Barbero, S., Ed.; Allemandi: Torino, Italy, 2017; Volume 1, ISBN 978-88-422-2444-0. [Google Scholar]
- Tamborrini, P.M. Food, Culture and Territory: EN.FA.SI for Cuneo bean. In Micro Relations as a Vital Network of Economic and Productive System; MicroMacro: Milano, Italy, 2017; ISBN 978-88-6627-211-3. [Google Scholar]
- Barbero, S.; Tamborrini, P. Systemic Design in AgroFood Sector: EN. FA. SI Project. In Proceedings of the International Conference on Designing Food and Designing For Food, London, UK, 28–29 June 2012; pp. 28–29. [Google Scholar]
- Dalle Nogare, G. Sistema di Comunicazione Nuovo Fagiolo Cuneo. Bachelor’s Thesis, Politecnico di Torino, Turin, Italy, 2014. [Google Scholar]
- Barbero, S.; Battistoni, C. From the Sustainable Biscuit Production to Territorial Development through Systemic Incubator; Croatian Association for PLM.: Zagreb, Croatian, 2016. [Google Scholar]
- Bicocca, M. Sviluppo Rurale e Innovazione Sostenibile. Come L’Approccio del Design Sistemico Può Favorire la Crescita Delle Aree Marginali. Ph.D. Thesis, Politecnico di Torino, Turin, Italy, 2016. [Google Scholar]
- Battistoni, C.; Pallaro, A.; Arrizabalaga Arambarri, L. Systemic Design for a sustainable local economic development: Lea-Artibai case study. In Proceedings of the Libro de Actas—Systems and Design: Beyond Processes and Thinking (IFDP-SD2016), Universitat Politècnica València, Valencia, Spain, 22–24 June 2016. [Google Scholar]
- Barbero, S. Systemic Design Method Guide for Policymaking: A Circular Europe on the Way; Allemandi: Torino, Italy, 2017; Volume 1, ISBN 978-88-422-2444-0. [Google Scholar]
- Regione Piemonte. Regione Piemonte Piano Regionale di Gestione dei Rifiuti Speciali (Allegato A); Regione Piemonte: Torino, Italy, 2015. [Google Scholar]
- Battistoni, C.; Barbero, S. The Holistic Diagnosis as a Method to Support urban Mining Actions: The Case Study of the European Project Retrace for Piedmont Region (Italy); CISA Publisher: Padova, PD, Italy, 2018. [Google Scholar]
- Ryan, A. A Framework for Systemic Design. FORMakademisk 2014, 7, 1–14. [Google Scholar] [CrossRef]
- Celaschi, F.; Deserti, A. Design e Innovazione: Strumenti e Pratiche per la Ricerca Applicata; Carocci: Roma, Italy, 2007. [Google Scholar]
- Stabellini, B.; Remondino, C.L.; Tamborrini, P. Data Visualization Collection. How graphical representation can inspect and communicate sustainability through Systemic Design. Des. J. 2017, 20, S1673–S1681. [Google Scholar] [CrossRef]
- Berg, T.; Bowen, T.; Smith, C.; Smith, S. Visualising the future: Surfacing student perspectives on post-graduation prospects using rich pictures. High. Educ. Res. Dev. 2017, 36, 1339–1354. [Google Scholar] [CrossRef]
- Ruttonsha, P. Towards a (Socio-ecological) Science of Settlement: Relational Dynamics as a Basis for Place. In Systemic Design; Springer: Berlin/Heidelberg, Germany, 2018; pp. 173–240. [Google Scholar]
Figure 1.
A graphic visualisation of the material flows in the Systemic Design approach at Politecnico di Torino (Italy).
Figure 1.
A graphic visualisation of the material flows in the Systemic Design approach at Politecnico di Torino (Italy).

Figure 2.
Graphic visualization of the Systemic Design (SD) methodology. Retrieved from a RETRACE project presentation. Courtesy of the author.
Figure 2.
Graphic visualization of the Systemic Design (SD) methodology. Retrieved from a RETRACE project presentation. Courtesy of the author.

Figure 3.
Example of a giga-map about holistic diagnosis (HD) phase 1 on a pastry shop placed in Anzasca Valley. Retrieved from [16].
Figure 3.
Example of a giga-map about holistic diagnosis (HD) phase 1 on a pastry shop placed in Anzasca Valley. Retrieved from [16].

Figure 4.
Example of a giga-map on HD phase 2 by the students of Systemic Design in Politecnico di Torino.
Figure 4.
Example of a giga-map on HD phase 2 by the students of Systemic Design in Politecnico di Torino.

Figure 5.
General schema of holistic diagnosis. Retrieved by [54]. Courtesy of the author.
Figure 5.
General schema of holistic diagnosis. Retrieved by [54]. Courtesy of the author.

Figure 6.
Giga-map of the HD1 in the EN.FA.SI project. Retrieved from [59]. Translated.
Figure 6.
Giga-map of the HD1 in the EN.FA.SI project. Retrieved from [59]. Translated.

Figure 7.
Giga-map of the HD2 in the EN.FA.SI project. Courtesy of the author.

Figure 8.
Evaluation of the HD process implemented in the EN.FA.SI project.

Figure 9.
An example of a giga-map on the HD1 of the Mexican project. Retrieved from [61]. Courtesy of the author. Translated by the authors.
Figure 9.
An example of a giga-map on the HD1 of the Mexican project. Retrieved from [61]. Courtesy of the author. Translated by the authors.

Figure 10.
An example of a giga-map on the HD1 of the Mexican project. Retrieved from [61]. Courtesy of the author. Translated by the authors.
Figure 10.
An example of a giga-map on the HD1 of the Mexican project. Retrieved from [61]. Courtesy of the author. Translated by the authors.

Figure 11.
Evaluation of the HD process for the Mexican project in Ahuacuotzingo.

Figure 12.
An example of a giga-map on the HD2 for the Piedmont Region in the project RETRACE. Retrieved from [56]. (a) The research synthesis of the demography part; (b) the research synthesis of the economy part.
Figure 12.
An example of a giga-map on the HD2 for the Piedmont Region in the project RETRACE. Retrieved from [56]. (a) The research synthesis of the demography part; (b) the research synthesis of the economy part.

Figure 13.
An example of a giga-map on HD1 in the project RETRACE on the ‘management of End of life vehicles’. Retrieved from [65].
Figure 13.
An example of a giga-map on HD1 in the project RETRACE on the ‘management of End of life vehicles’. Retrieved from [65].

Figure 14.
Evaluation of the HD process implemented in the EN.FA.SI project.

Figure 15.
Graphic scheme about the HD process Assess, Research, Collect, Visualize, Interpret (ARCVI).
Figure 15.
Graphic scheme about the HD process Assess, Research, Collect, Visualize, Interpret (ARCVI).

Figure 16.
Graphic scheme with an example of the categories analysed for the HD context analysis in the RETRACE project.
Figure 16.
Graphic scheme with an example of the categories analysed for the HD context analysis in the RETRACE project.

Figure 17.
Comparison between the giga-maps realized for the HD context analysis in the RETRACE project. Retrieved from [56]. (a) Demography part of the Piedmont Region, Italy; (b) demography part of north-east, Romania; (c) demography part of Nord Aquitaine, France; (d) the Biscay Region in Basque Country, Spain.

Table 1.
Example of a database used in RETRACE project.
| Person in Charge of the Research | Date of Research | Main Topic | Category | Sub-Category | Specific Data | Data | Unit | Reference | Year Related to the Data | More Info |
|---|---|---|---|---|---|---|---|---|---|---|
| Chiara | 20 January 2019 | Piedmont Region | GEOGRAPHY | USE OF THE SOIL | Urban area | 147,316 | ha | Regione Piemonte. Monitoraggio del consumo di suolo in Piemonte, 2015, p. 51. Retrieved from https://www.regione.piemonte.it/web/sites/default/files/media/documenti/2019-02/monitoraggio_consumosuolo_2015.pdf | 2013 | latest data |
© 2019 by the authors. Licensee MDPI, Basel, Switzerland. This article is an open access article distributed under the terms and conditions of the Creative Commons Attribution (CC BY) license (http://creativecommons.org/licenses/by/4.0/).
Share and Cite
MDPI and ACS Style
Battistoni, C.; Giraldo Nohra, C.; Barbero, S. A Systemic Design Method to Approach Future Complex Scenarios and Research Towards Sustainability: A Holistic Diagnosis Tool. Sustainability 2019, 11, 4458. https://doi.org/10.3390/su11164458
AMA Style
Battistoni C, Giraldo Nohra C, Barbero S. A Systemic Design Method to Approach Future Complex Scenarios and Research Towards Sustainability: A Holistic Diagnosis Tool. Sustainability. 2019; 11(16):4458. https://doi.org/10.3390/su11164458
Chicago/Turabian StyleBattistoni, Chiara, Carolina Giraldo Nohra, and Silvia Barbero. 2019. "A Systemic Design Method to Approach Future Complex Scenarios and Research Towards Sustainability: A Holistic Diagnosis Tool" Sustainability 11, no. 16: 4458. https://doi.org/10.3390/su11164458
Note that from the first issue of 2016, this journal uses article numbers instead of page numbers. See further details here.