Biodegradation of Malachite Green in Milkfish Pond Sediments

Department of Microbiology, Soochow University, Taipei 11101, Taiwan
*
Author to whom correspondence should be addressed.
Sustainability 2019, 11(15), 4179; https://doi.org/10.3390/su11154179
Submission received: 2 May 2019
/
Revised: 31 July 2019
/
Accepted: 1 August 2019
/
Published: 2 August 2019
(This article belongs to the Special Issue Sustainability of Microbial Ecosystems: Soil and Aquatic Microbial Diversity)
Abstract
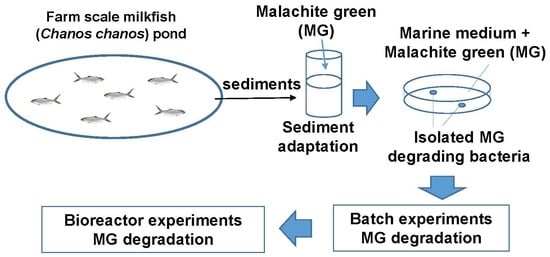
:Malachite green (MG) is usually applied as a biocide in aquaculture worldwide. The microbial degradation of MG and changes in the microbial community composition of milkfish (Chanos chanos) culture pond sediments were assessed in this study. Three MG-degrading bacteria strains—M6, M10, and M12—were isolated, identified, and characterized. Strains M6, M10, and M12 are closely related to Zhouia amylolytica, Tenacibaculum mesophilum, and Enterobacter cloacae, respectively. The bacterial strains M10 and M12 showed good ability to degrade MG in the sediment. The MG degradation rate was increased after adding MG three more times. The microbial community in the sediment changes with different treatments. The bacterial strains M10 and M12 provide a potential solution for the treatment of sediment of saline aquaculture ponds with MG contamination.
1. Introduction
Aquaculture is one of the largest food production methods due to the increasing global demand for quality protein. Milkfish (Chanos chanos) is a tropical saltwater fish that is cultivated in coastal areas of Indonesia, India, the Philippines, and Taiwan [1]. As a euryhaline fish, milkfish can be cultivated in a wide range of salinities in freshwater and marine environments [2]. Antibacterial agents can be used in aquaculture animals to prevent and treat diseases, promote growth, and improve the culture conditions [3]. Malachite green (MG) is a triphenyl methane dye that is used in aquaculture. MG is highly effective for the control of fungal infections and other parasites [4]. However, the use of MG generates concern because of its toxic effects in mammals [5]. The MG toxicity increased with exposure time, temperature, and the reduced metabolite leucomalachite green (LMG), whose degradation rate is very slow [5]. It is important to explore ways to remove MG from the treatment ponds.
The use of physicochemical methods to remove MG may pose a secondary pollutant threat [6]. Biological methods are environmentally friendly and convert organic pollutants into less toxic compounds. MG can be degraded using fungal species, such as Saccharomyces cerevisiae [7], Cunninghamella elegans [8], and Trichoderma asperellum [9]. Fungal species exhibit long growth cycles and moderate decolorization rates, and are non-specific for target contaminants [10]. The bacterial species can degrade MG, including Cosmarium sp. [11], Kocuria rosea [12], Mycobacterium sp. [13], Pandoraea pulmonicola YC32 [14], Sphingomonas paucimobilis [15], Xanthophyta sp. [16], and Pseudomonas sp. [17,18]. Several malachite green-degradation gene families and enzymes from mangrove sediment were revealed by metagenomics approaches [19]. Little information is available regarding MG degradation in saline milkfish ponds, which represent an artificially closed water system.
The use of high-throughput sequencing for metagenomics research can identify microbial diversity in environmental samples [20]. The bacterial community associated with the degradation of MG from saline milkfish pond sediments is unknown. In this study, we first compared the effects of temperature on MG degradation. MG-degrading bacteria were isolated from the sediment of a milkfish pond. The MG-degrading ability of the isolated bacteria was tested by the addition of these bacteria strains into saline milkfish pond sediments. The associated microbial community diversity was also revealed by using high-throughput sequencing.
2. Materials and Methods
2.1. Chemicals
MG, LMG, Michler’s ketone (MK) (99.0%), and other chemicals were obtained from the Sigma Chemical Co. (St. Louis, MO). Solvents were from Mallinckrodt Pharmaceuticals (Dublin, Ireland); marine broth 2216 was from BD Difco (Sparks, MD, USA).
2.2. Sample Collection
Sediment samples were collected from marine aquaculture farms in Tainan, Taiwan (23°12′15″ N; 120°08′00″ E) in October 2015. The cultured fish species was the milkfish (Chanos chanos). The sediment sample was made by mixing sediments collected from several sampling points. The measured physicochemical parameters of the milkfish pond sediment samples were pH (7.5 ± 0.3), temperatures (26.4 ± 1.8 °C), salinity (32.8 ± 2.1‰), total organic carbon (TOC) (0.97 ± 0.11%), total nitrogen (811.5 ± 12.1 mg/kg), and total phosphate (196.3 ± 13.7 mg/kg). The percentages of sand, silt, and clay were 59.4%, 25.2%, and 15.4%, respectively. The particle size of the sediment was sandy loam. The MG concentration was 0.21 ± 0.02 mg/kg.
2.3. Experimental Design
There are three sets of experiments. The first set was performed to compare MG degradation at different temperatures and concentrations. The second set was to isolate and identify MG-degrading bacteria, and add MG-degrading bacteria to the sediment. The third set was to repeat the addition of MG to explore MG degradation.
The first set experiments were conducted using 45 mL of medium, 5 g of sediment, and 10 mg/kg of MG. MG concentrations (10 mg/kg and 50 mg/kg) in the sediment, and incubated with shaking at temperatures of 25 °C and 30 °C in the dark. Sterile controls were autoclaved at 121 °C for 30 min. Each treatment was performed in triplicate.
The second set experiments were conducted to isolate, identify MG-degrading bacteria, and add degrading bacteria to the sediment. MG-degrading bacteria were isolated from the enriched sediments. The enrichment procedure was conducted as described previously [21]. Agar plates (composed of K2HPO4, 65.3 mg/L; KH2PO4, 25.5 mg/L; Na2HPO4∙12H2O, 133.8 mg/L; NH4Cl, 5.1 mg/L; CaCl2, 82.5 mg/L; MgSO4∙7H2O, 67.5 mg/L; and FeCl3∙6H2O, 0.75 mg/L.) containing 1 mg/L of MG were used to isolate bacterial strains in an anaerobic condition. To confirm that the isolated bacterial strains were MG-degrading bacteria, the degradation experiment was performed using 5 mL of the bacterial strains, 45 mL of medium, and 1 mg/L MG on a shaker (120 rpm) at 30 °C in the dark. Samples were taken periodically to analyze residual MG. Then, each individual colony was purified and identified by 16S rDNA gene sequencing after amplification of the gene by PCR with the primers F8 and R1510. The PCR products were sequenced using an ABI Prism automatic sequencer. The 16S rRNA gene sequences of the three isolated bacterial strains were used to search the National Center for Biotechnology Information 16S rRNA database by blast. The top five sequences (with the highest scores) in the blast result of each isolated bacterial strain were retrieved and used to construct the phylogenetic tree. Phylogenetic analysis was performed using Clustal X 2.0 with 1000 repetitions of bootstrapping [22]. We also assessed MG degradation in sediment-containing samples by the addition of MG-degrading bacteria M10 and M12. The experiments were performed using 5 mL of MG-degrading bacteria, 5 g sediment, 40 mL of medium, and 10 mg/kg of MG on a shaker (120 rpm) at 30 °C in the dark. MG-degrading bacteria were centrifuged at 3000 g for 15 min, washed twice with sterile medium, and resuspended in the medium. Five milliliters of the three MG-degrading bacteria were inoculated into each bottle at the beginning of each degradation experiment.
The third set experiments were conducted using 450 mL of medium, 50 g of sediment and with or without 5 mL of MG-degrading bacteria and incubated with shaking at 30 °C in the dark. Concentrations of 10 mg/kg, 10 mg/kg, and 50 mg/kg of MG were added for the first, second, and third addition, respectively. MG was readded when the MG level decreased to be not detected (ND). The detection limits for MG in water and sediment were 0.1 mg/L. The experiments lasted for 80 days. MG concentration and bacterial community composition were analyzed periodically.
2.4. Analytical Methods
The sediment samples were analyzed for pH value, salinity, temperature, TOC, total nitrogen, total phosphate, particle size, and MG concentration. pH values were measured with a pH meter (HI 9017, Hanna, USA). The salinity and temperature were measured by salinity/temperature meter (model 30, YSl, USA). TOC was determined from the difference of total carbon minus total inorganic carbon, and was measured using a TOC Analyzer (OI Analytical 1030W, USA). Total nitrogen was analyzed using the Kjeldahl method [23]. Total phosphorus was analyzed in each sample by digestion with perchloric acid, the dilution of digest with distilled deionised water, filtration of the resulting solution, and utilization of the stannous chloride method to determine P in mg/kg [24]. The distribution of sediment particle sizes (<2 mm) was followed after destroying the organic material and carbonates by applying 15% H2O2 overnight and 10% HCl, respectively, and neutralizing the particle charges by treating the samples with a dispersing agent (0.4N Na4P2O7). The sand fraction (0.063–2 mm) was analyzed by sieving, while the silt (0.002–0.063 mm) and the clay (<0.002 mm) fractions were determined in hydrometers by the interrelations of the settling velocity, diameter of the sphere, specific weights of the sphere and the fluid, as well as fluid viscosity (Stoke’s law) [25].
MG was extracted from the experimental samples twice with acetonitrile. The extracts were analyzed by use of a high-performance liquid chromatography (Agilent 1260) equipped with a Poroshell 120 EC-C18 column and a photodiode array detector monitoring at 615 nm, 259 nm, and 366 nm for MG, LMG, and MK, respectively. Acetonitrile and water (with 0.1% formic acid) at a ratio of 30% to 70% was used as mobile phase for 3 min; then, the ratio was changed to 10% to 90% for 7 min. The flow rate was 1 mL/min. The average MG recovery rate was 95.2 ± 2.8%, and the detection limit was 0.1 mg/L.
MG biotransformation in the sediment was studied. Extracts of all the collected sediment samples were pooled and evaporated to near dryness under a gentle stream of nitrogen and analyzed by 6890N GC system gas chromatograph (Agilent Technologies) coupled with a 5973 mass selective detector (Agilent Technologies) single quadrupole mass spectrometer equipped with an autosampler (ALS) injector. The mass spectrometer was operated in the Electron Impact (EI) positive mode (70 eV). The MS transfer line temperature was 280 °C, the MS ion source temperature was kept at 230 °C, and the MS quadrupole temperature was at 150 °C. The mass spectrometer operated in the EI positive mode (70 eV). For the gas chromatographic separation, a ZB-5 fused silica capillary column (5% phenyl – 95% dimethylpolysiloxane, 15 m × 0.25 mm i.d., 0.25-μm film thickness, Zebron ZB-5 Capillary GC) was used. The carrier gas was used in the constant flow mode (He, purity 99.9995%) at 1.1 mL/min. The split/splitless injection port was used in split mode at 280 °C. The chromatographic oven was programmed as follows: 50 °C, isothermal for 1 min, 10 °C/min up to 200 °C, 200 °C/min up to 290 °C, and isothermal for 8 min.
The remaining percentage of MG was computed by the formula: (residue MG concentration/initial MG concentration) × 100. The coefficient of determination (R2) was 0.951 to 0.995, which fit a first-order kinetics: S = S0 exp(−kt) and t1/2 = ln(2/k), where S0 is the initial MG concentration, S is the residue MG concentration, t is the time, and k is the degradation rate constant.
2.5. DNA Extraction, PCR, Illumina Sequencing, and Data Analysis
The DNA of experimental samples were isolated by the PowerSoil DNA isolation kit (MO BIO Laboratories). 16S rRNA gene sequences with V5 to V8 variable regions were amplified using the 5’-primer (5’-CCTACGGGNBGCASCAG-3’) and the 3’-primer (5’-GACTACNVGGGTATCTAATCC-3’). The PCRs were performed as previously described [26]. Sequencing was performed at the Genome Center, National Yang-Ming University, Taiwan using the Illumina MiSeq plateform. The Chimera Check using the DECIPHER software v2.0 [27] was used to remove chimeric sequences. The 16S rRNA gene sequences were analyzed using the Ribosomal Database Project web site (https://rdp.cme.msu.edu/) [28]. The Classifier software and a cutoff value of 95% similarity was used to assign taxonomic groups of 16S rRNA gene sequences. The heatmap was plotted using the pheatmap [29] package of R (https://www.r-project.org/). The color scale is based on the normalization of data. The normalization was done by the formula: z = (Xi − μ)/σ, where Xi is the value of the i-th sample, μ is the sample mean, and σ is the sample standard deviation.
3. Results and Discussion
3.1. Effect of Different Conditions on MG Degradation in Milkfish Pond Sediments
As shown in Figure 1, the remaining percentages of MG in the sediment of sterile controls were within a range from 91.3 ± 1.2% to 96.1 ± 6.8%. There was 4% to 9% degradation observed in the sediment of sterile controls which, may reflect the level of spontaneous MG or light degradation. The results suggested that MG was degraded by microbial action. The effect of temperature on MG degradation in the milkfish pond sediment was tested. The samples of 10 mg/kg MG were completely degraded by 26 and 20 d at 25 °C and 30 °C, respectively. In contrast, for the samples treated with 50 mg/kg MG, the remaining percentages of MG after 32 d were 28.1% and 12.3% for 25 °C and 30 °C, respectively. The half-life of 10 mg/kg MG was 6.0 and 4.6 d, and that of 50 mg/kg MG was 15.1 and 10.3 d, for 25 °C and 30 °C, respectively (Table 1). The MG degradation rates were higher at 30 °C. Higher concentrations of MG might increase toxicity, inhibit microbial activity, and reduce MG degradation [30]. The optimal temperature for MG degradation was 30 °C. These results are consistent with the study of MG degradation by Pseudomonas sp. strain DY1 [6]. The degradation of MG at 10 mg/kg and 30 °C was used in the following experiments.
The major microbial community composition in milkfish pond sediments with MG at different temperatures is shown in Figure 2. At the class level, the proportion of Alphaproteobacteria at 25 °C and 30 °C increased from 0.1 to 0.5. In contrast, Deltaproteobacteria at 25 °C and 30 °C decreased from 0.4 to 0.02. Gammaproteobacteria increased in the 25 °C treatment, and Flavobacteriia increased at 30 °C (Figure 2A). At the genus level, only two bacterial genera (Kordiimonas and Methylophaga) exhibited great changes of proportion (difference greater than 10%) (Figure 2B). Robiginitalea is the only genus to significantly increase in proportion between 25–30 °C. These results indicate that changing temperatures led to a great change of microbial composition in milkfish pond sediments. As the temperature increased, Kordiimonas and Methylophaga became major bacterial genera in the milkfish pond sediments. One bacterial genus (Halomonas) that has been reported as MG-degrading increased in proportion as the temperature rose (Figure 2B) [31].
3.2. Isolation and Characterization of the MG-Degrading Bacteria
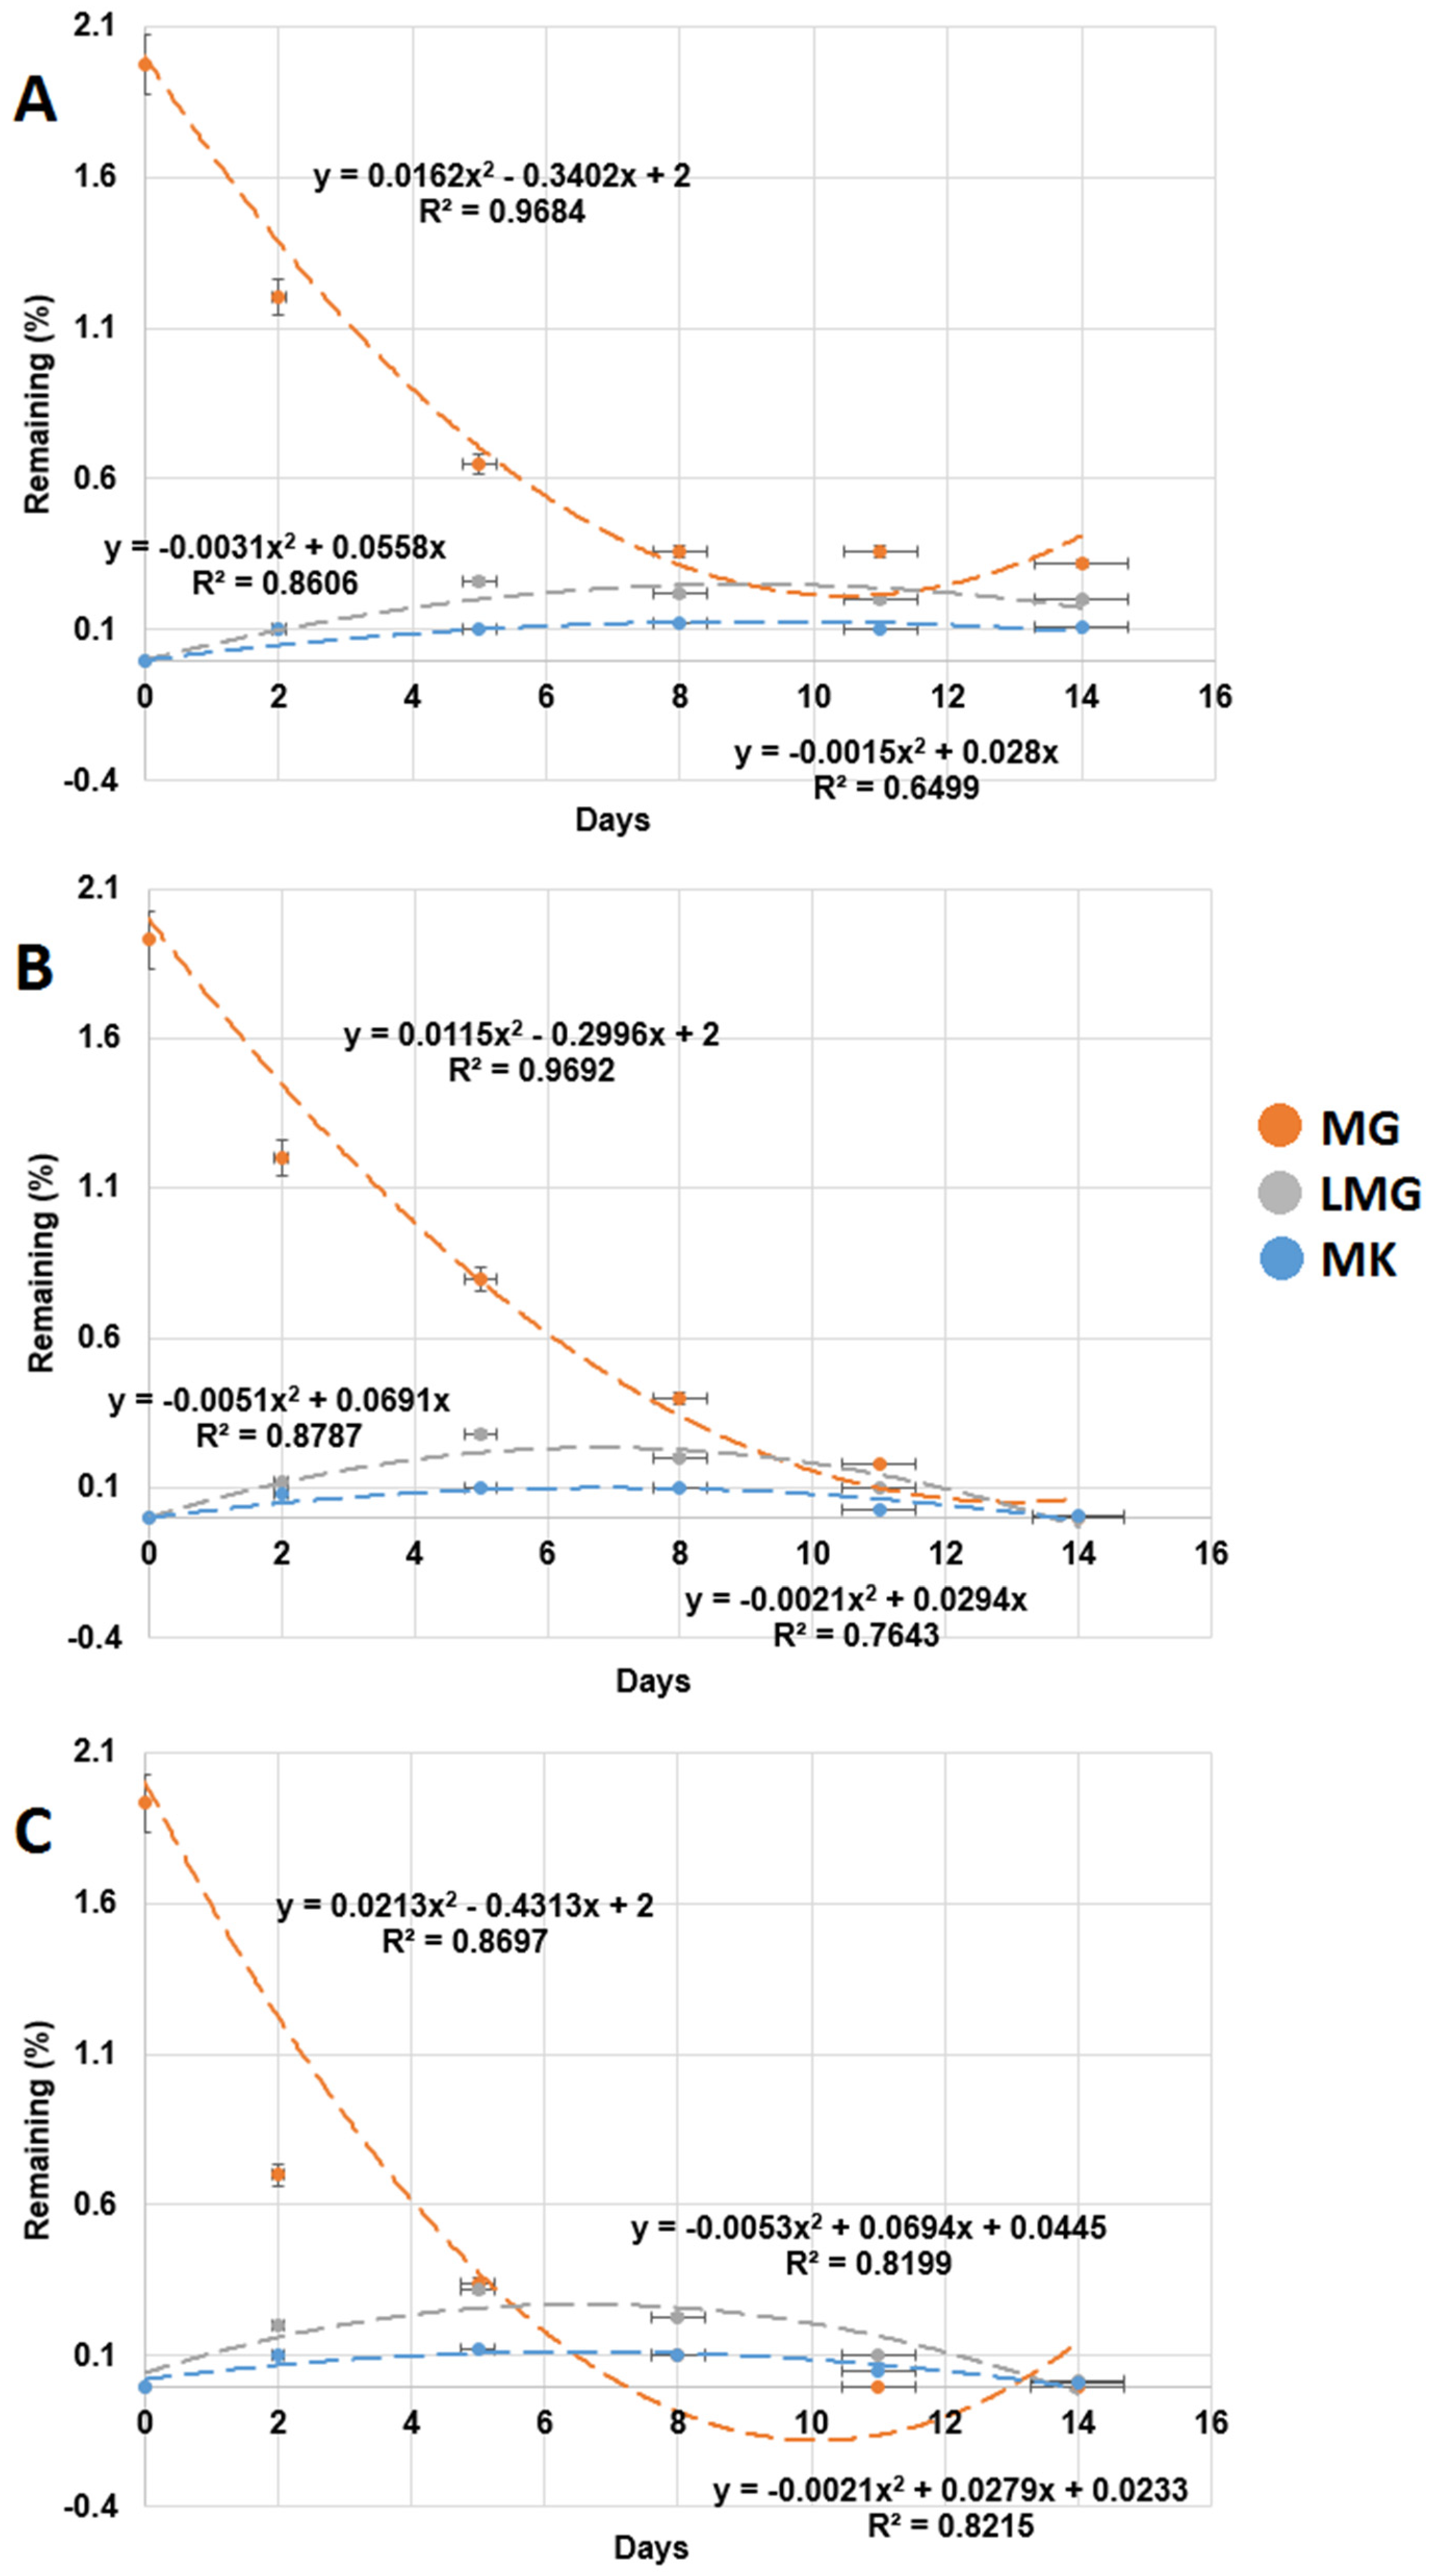
Pure bacterial strains were isolated from the milkfish pond sediments, and 10 strains with the ability to use MG as a carbon source were found. Three isolated clones M6, M10, and M12 exhibited the greatest MG-degrading capability. As shown in Figure 3, after 14 d of incubation, 85.1% MG was degraded by strain M6, and MG was completely degraded by strains M10 and M12. The degradation half-lives of MG were 4.1 d, 2.5 d, and 1.9 d by strains M6, M10, and M12, respectively (Table 2). The order of MG-degrading ability was bacterial strain M12 > strain M10 > strain M6.
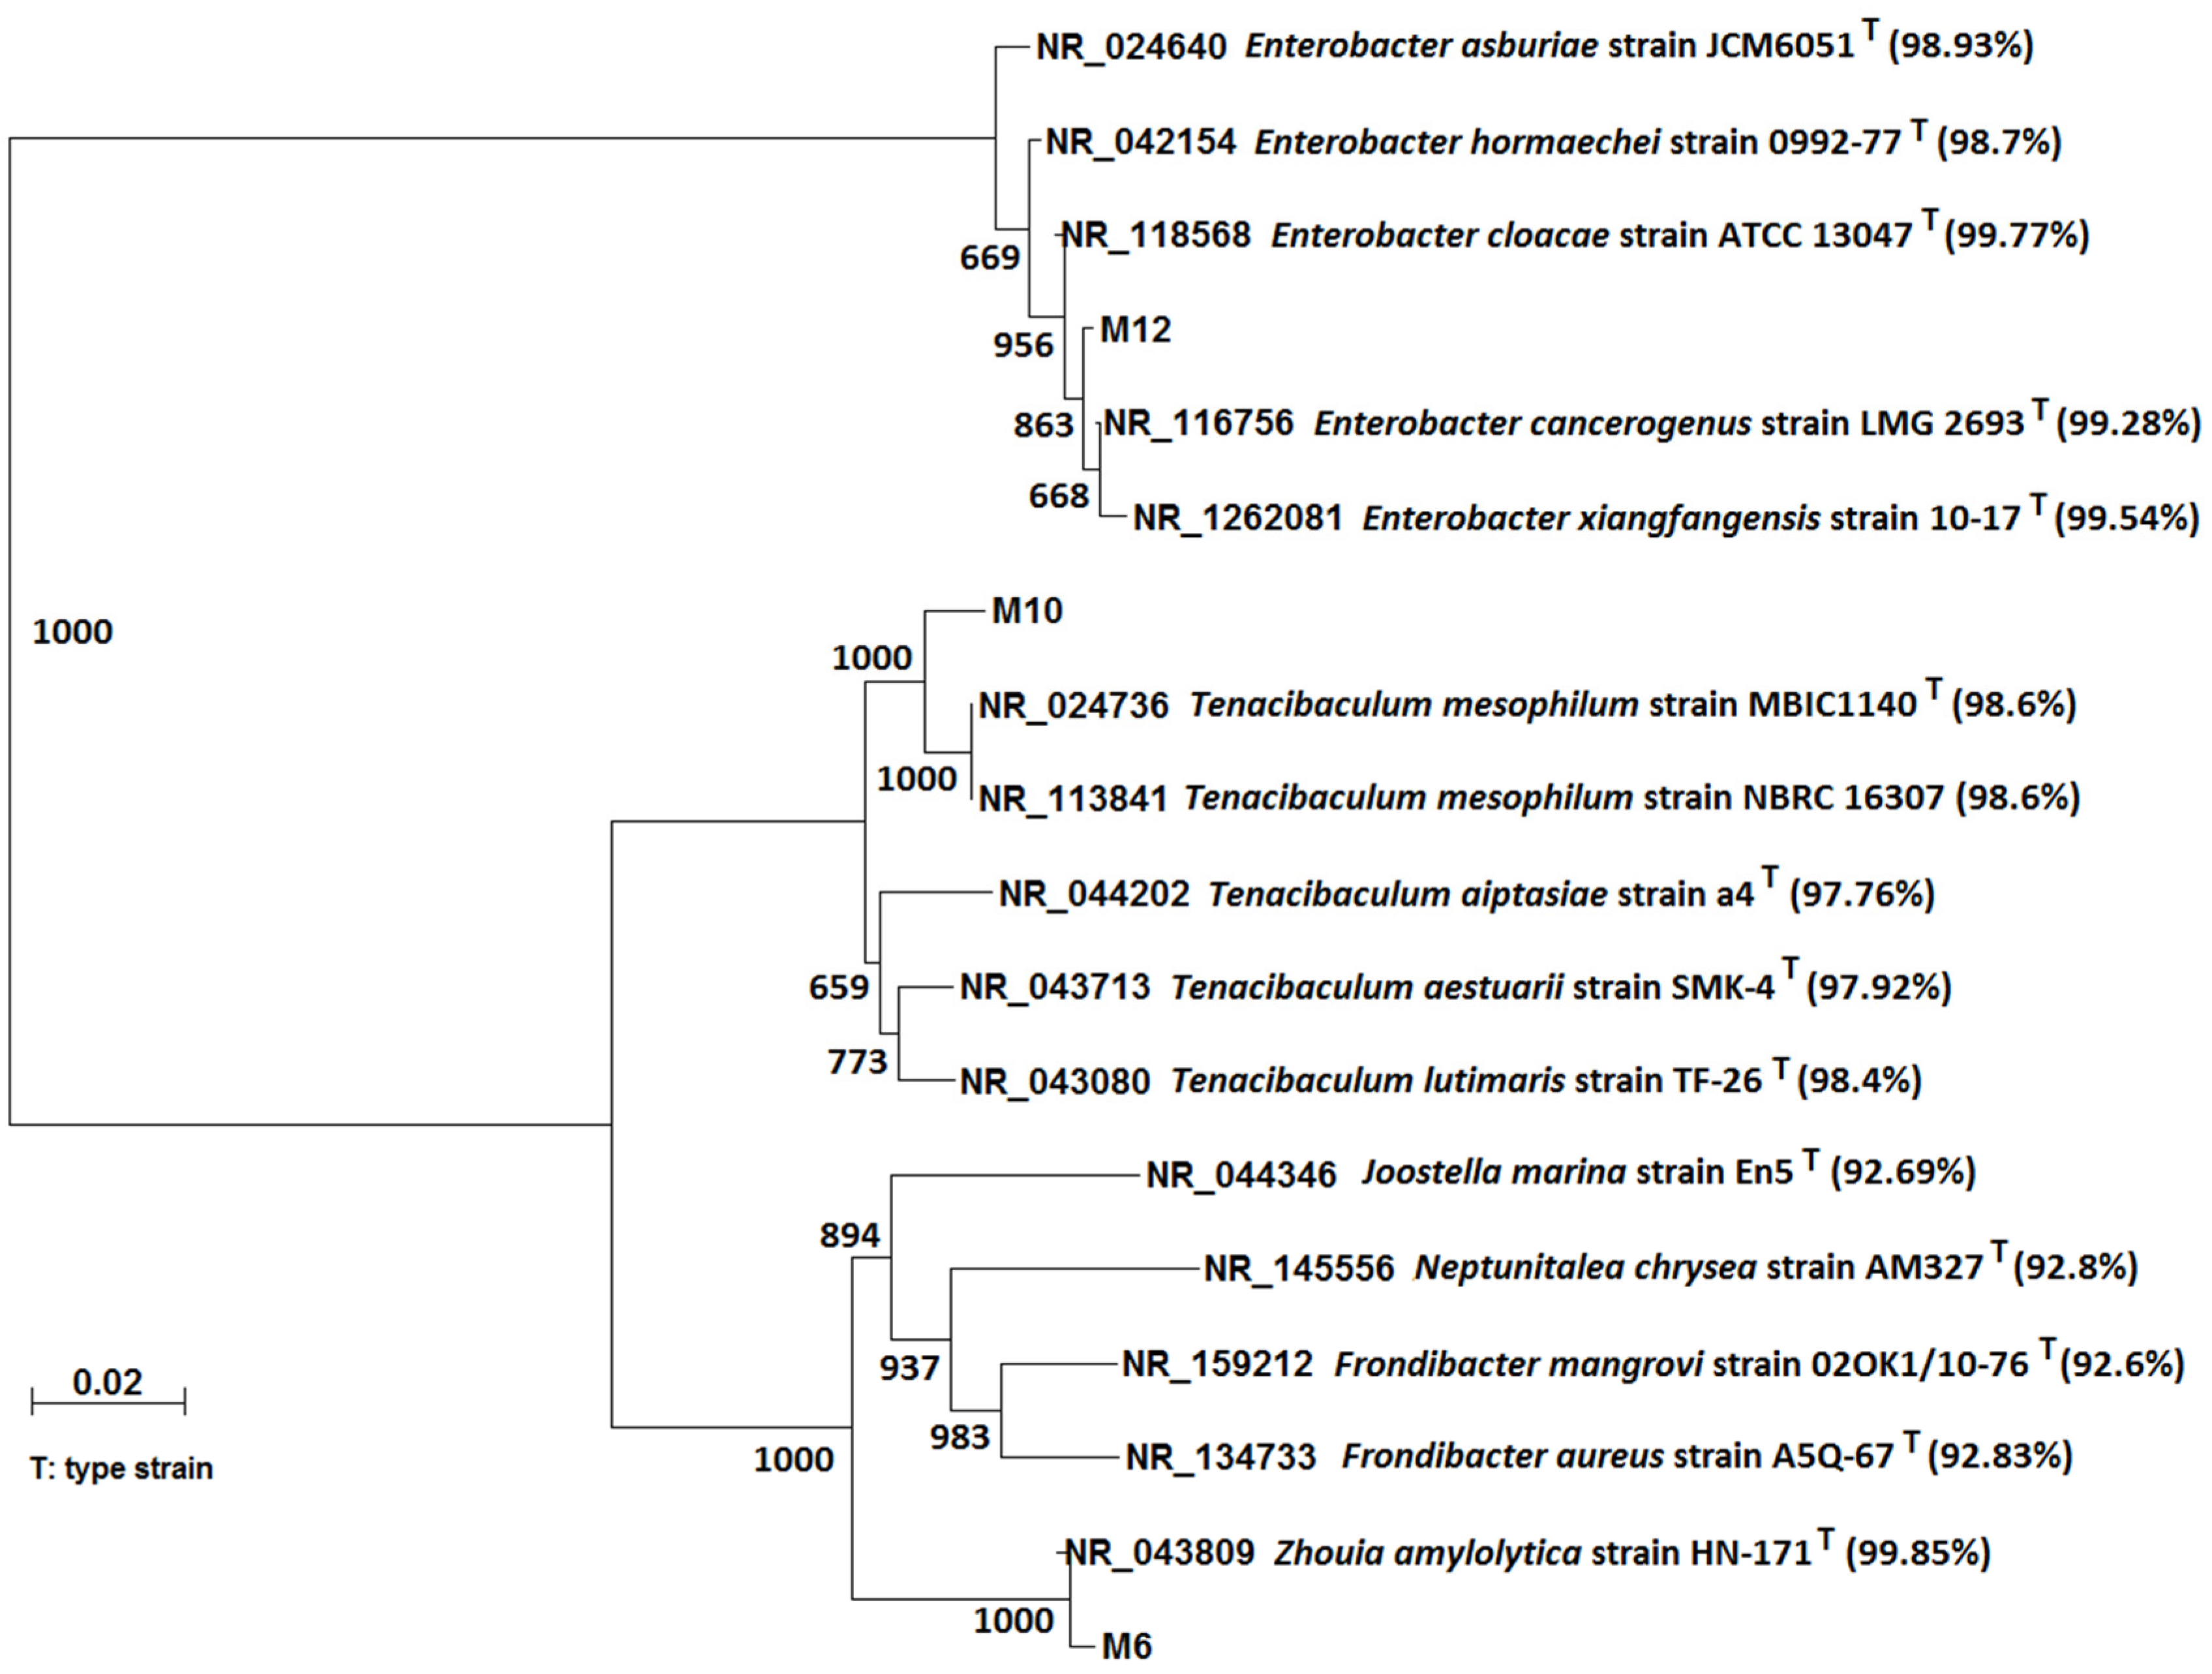
Figure 4 shows the 16S rRNA gene phylogenetic analysis of three MG-degrading strains: M6, M10, and M12. The bacterial strain M6 is closely related to Zhouia amylolytica, and the similarity is 99.84%. The bacterial strain M10 is closely related to Tenacibaculum mesophilum, and the similarity is 98.62%. The bacterial strain M12 is closely related to Enterobacter cloacae, and the similarity is 99.77%. Zhouia amylolytica was isolated from sediment of the South China Sea. This bacterium is a Gram-negative, non-spore-forming strain, which grows at 30 °C, pH 7.2–7.4, 4.5–5.0 NaCl % (w/v) [32]. Tenacibaculum maritimum, a Gram-negative and filamentous bacterium, is reported as an etiological agent of tenacibaculosis in marine fish [33]. Enterobacter is a genus of common Gram-negative, facultatively anaerobic, rod-shaped, and non-spore-forming bacteria. Enterobacter species are found in water, sewage, soil, and vegetables; some species are found in human and animal species [34].
3.3. Test of MG Degradation Ability in Milkfish Pond Sediment
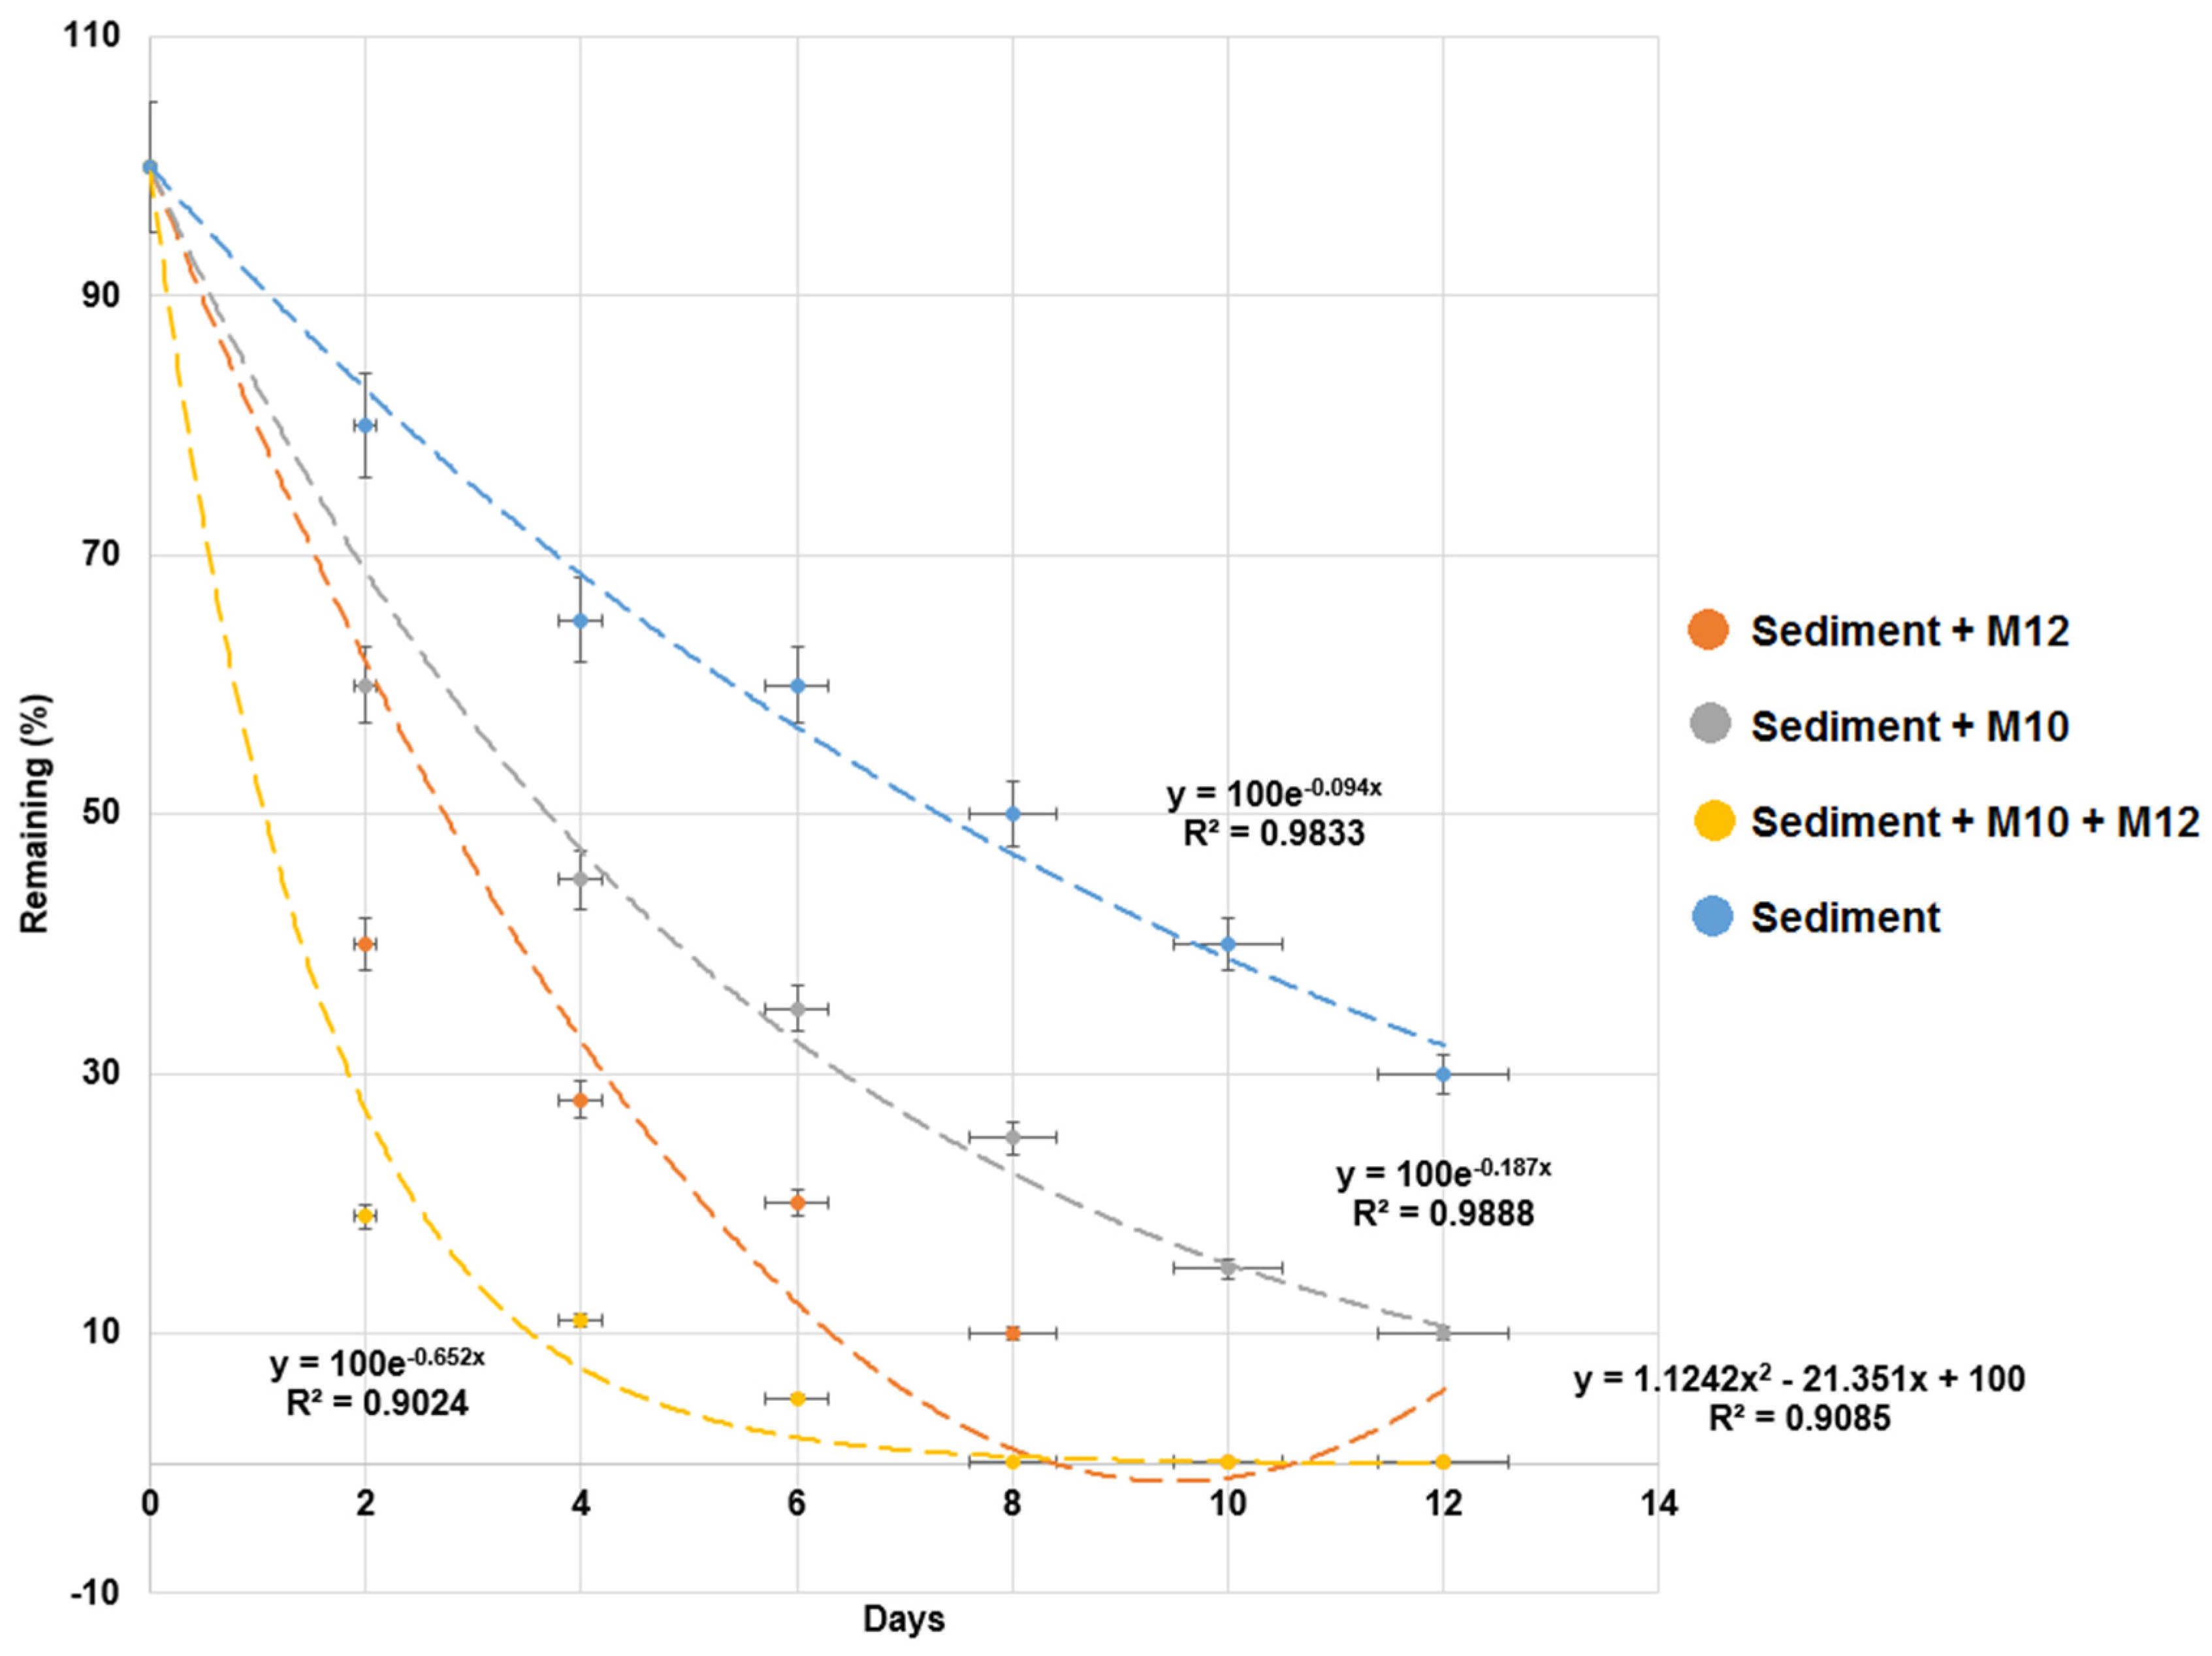
As shown in Figure 5, the bacterial strains M10 and M12 were added into the milkfish pond sediment to test their MG-degrading ability in sediment. The degradation half-lives of MG were 1.3 d, 2.4 d, 3.8 d, and 7.7 d for experiments with the addition of both strains M10 and M12, strain M10 alone, stain M12 alone, and a control (without strain M10 and strain M12), respectively (Table 3).
As shown in Table 1, the MG degradation rate without sediment samples was higher than that with sediment samples. The adsorption of sediment particles may decrease the bioavailability of MG to microbes and inhibit the degradation process [35]. However, even though there is sorption of MG on sediment, the adsorbed MG will be extracted from samples and detected by HPLC. Therefore, these results revealed that strains M10 and M12 can enhance the MG degradation in milkfish pond sediment. The addition of both bacterial strains M10 and M12 produced the best results. These results are similar to those previously reported in which the mixed consortium enhanced the degradation of nonylphenol in the sediments [36]. Therefore, a combination of bacterial strains M10 and M12 was used in the following experiments.
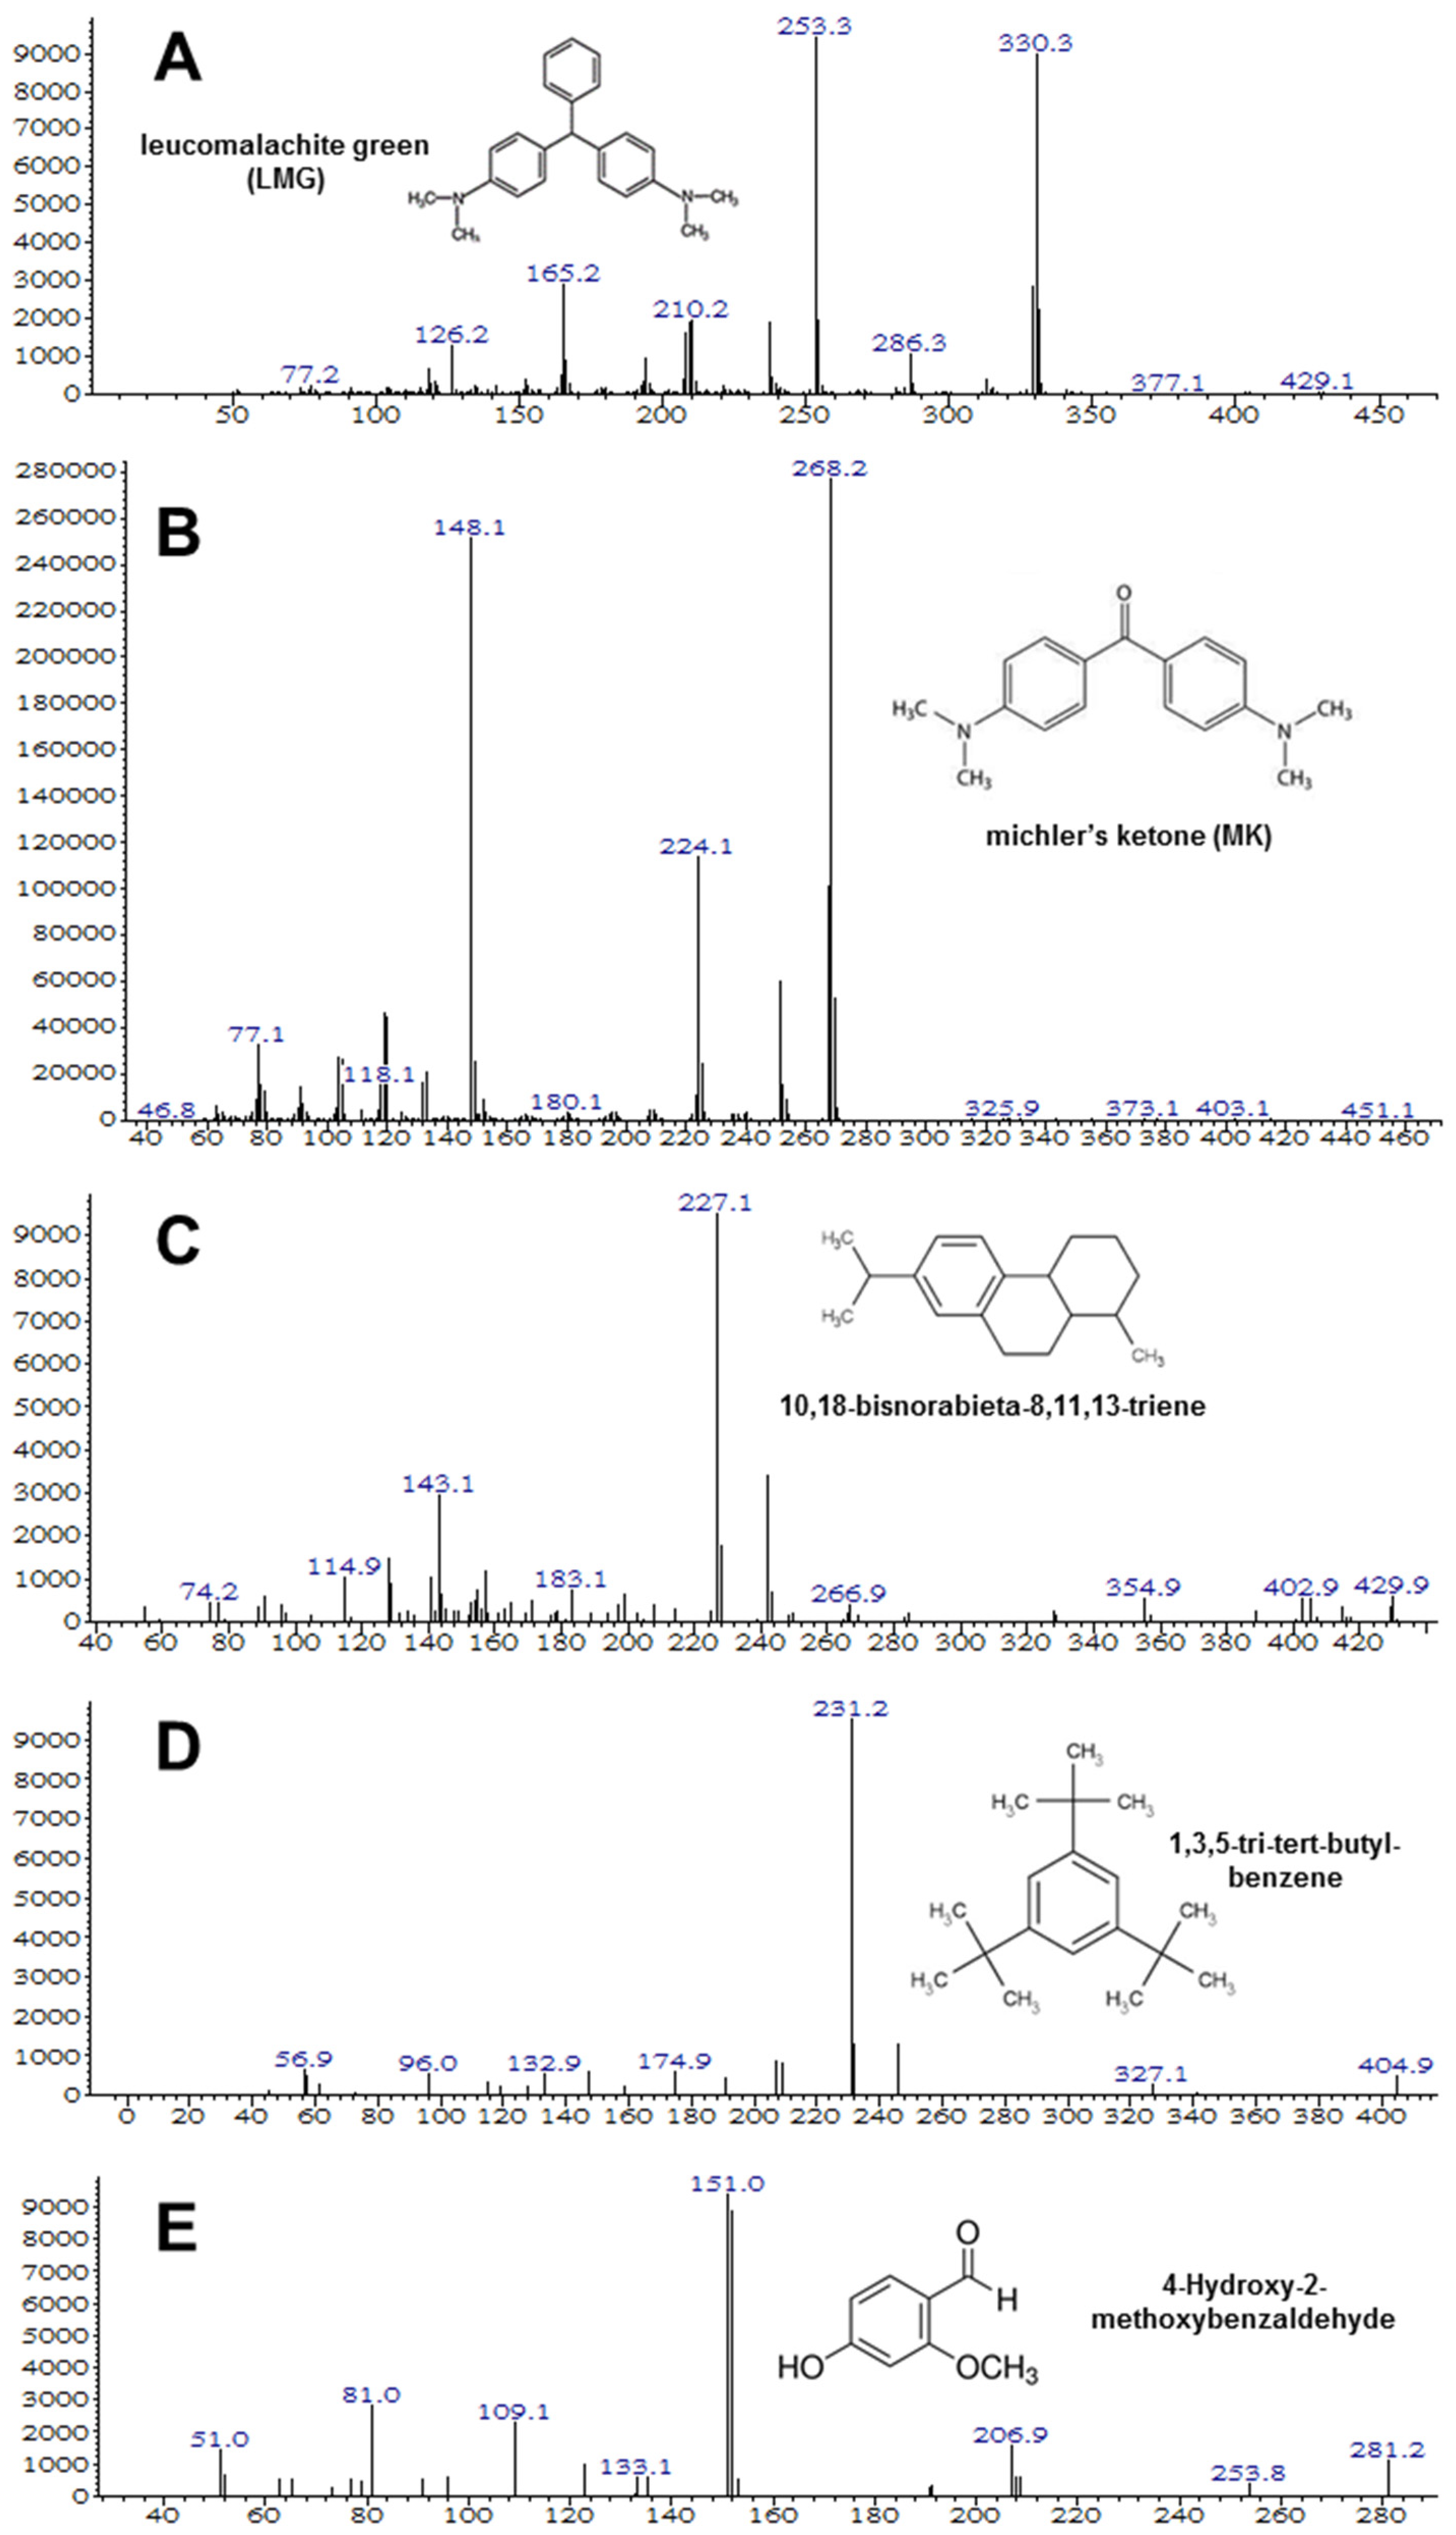
In the experiment using milkfish pond sediment with both strains M10 and M12, the MG biotransformation in the sediment was monitored by GC/MS (Figure 6). The intermediate products LMG (m/z 330), MK (m/z 268), 10,18-bisnorabieta-8,11,13-triene (m/z 227), 1,3,5-tri-tert-butyl-benzene (m/z 231), and 4-hydroxy-2-methoxybenzaldehyde (m/z 151) were identified.
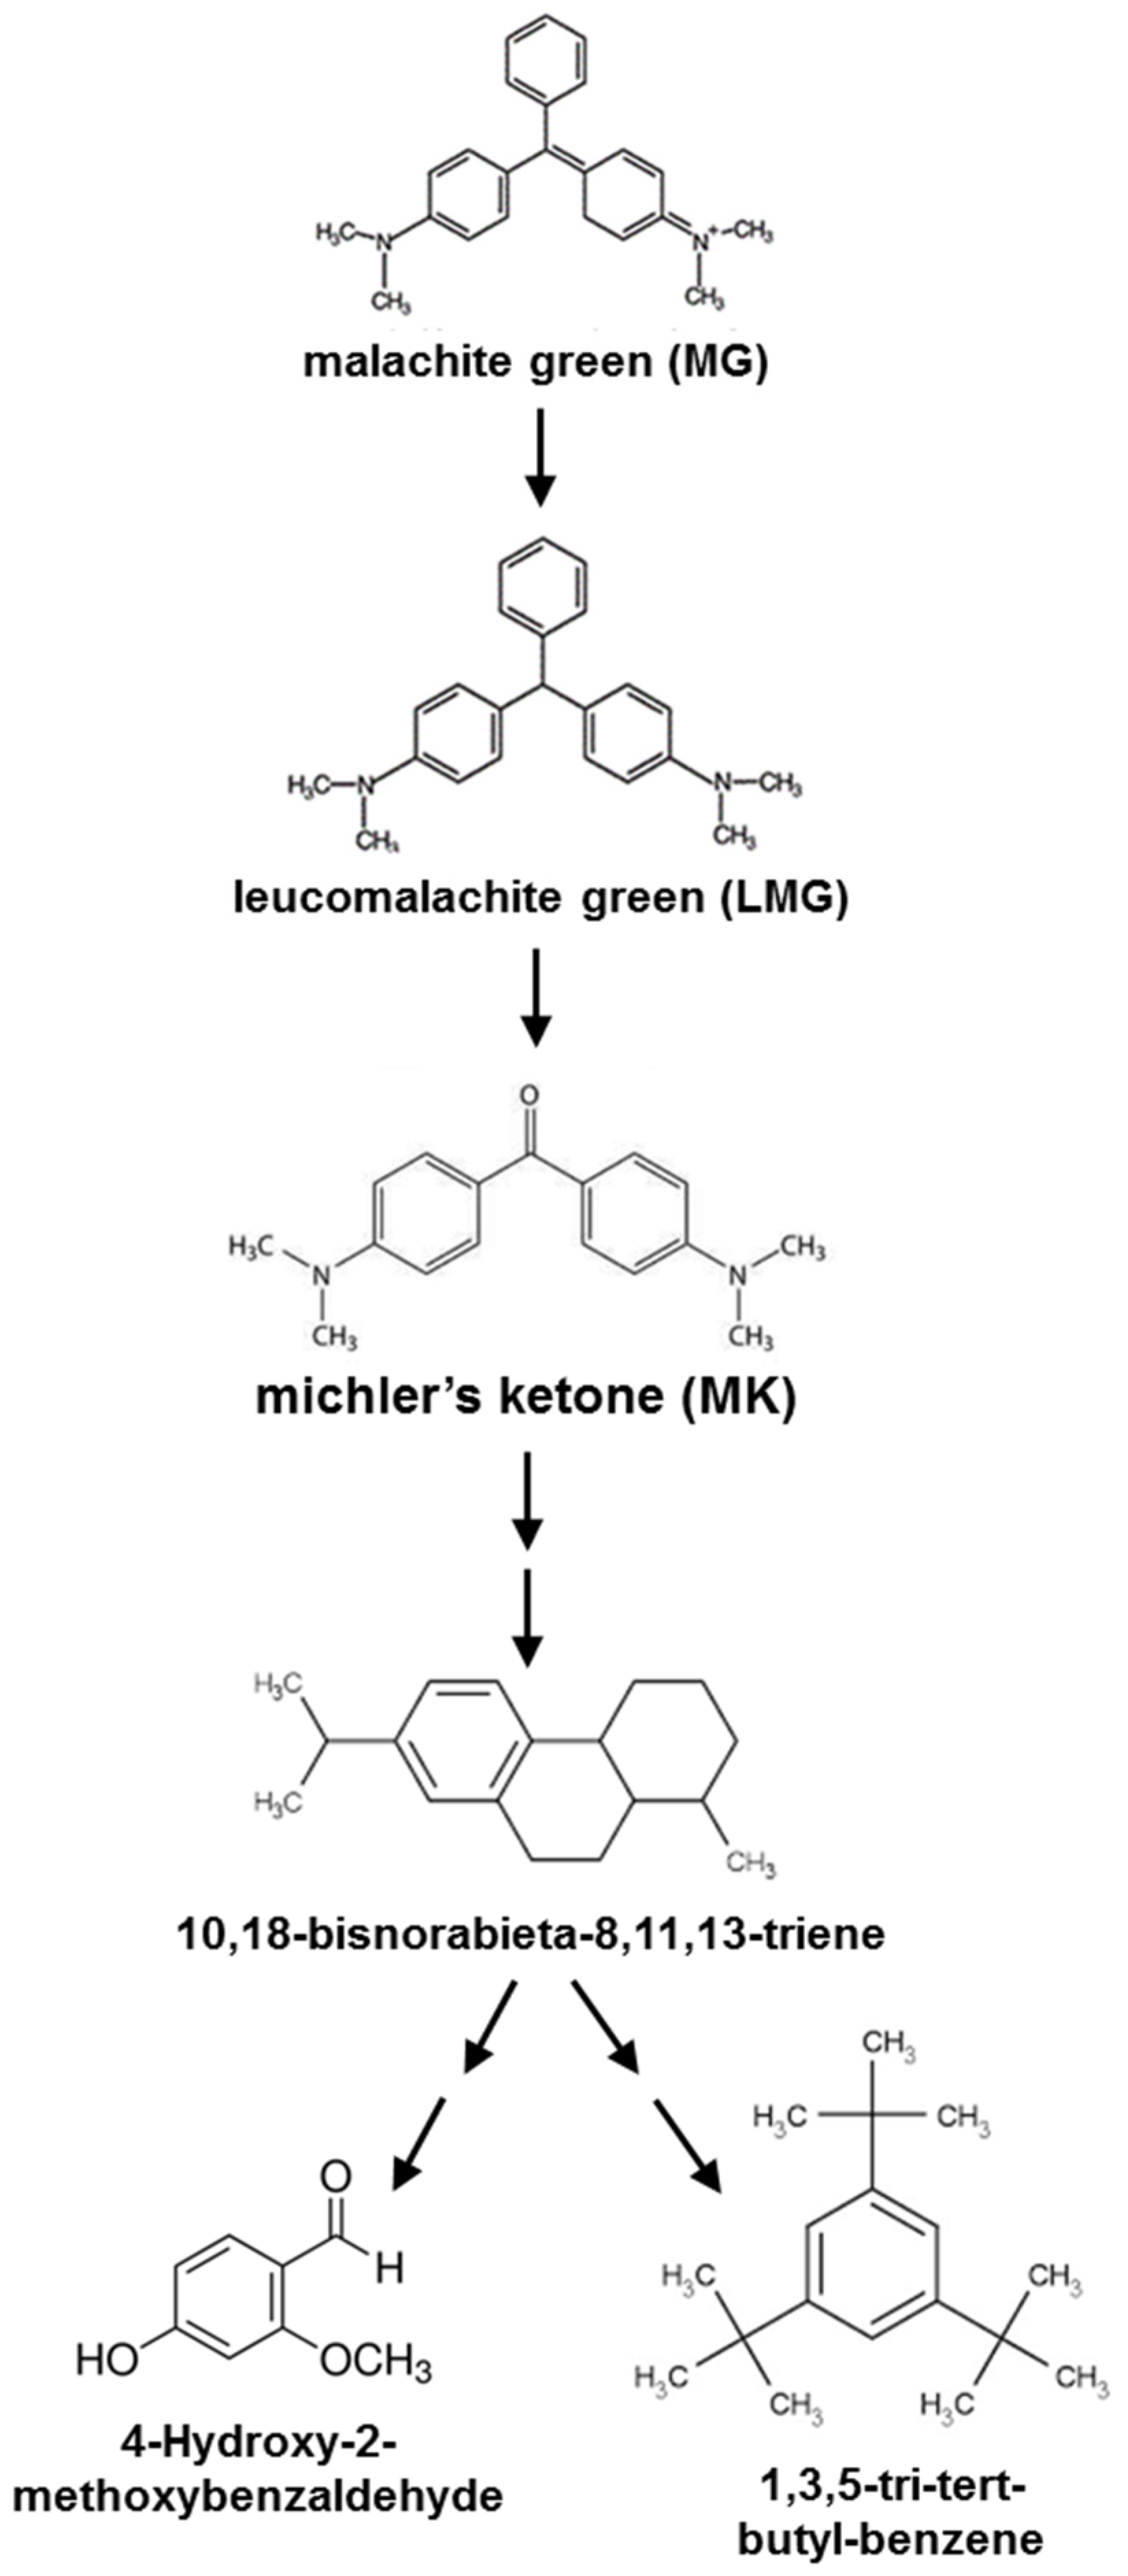
A proposed degradation pathway of MG for the biotransformation of MG in the sediment is simulated in Figure 7. The degradation of MG by Ochrobactrum pseudogrignonense strain GGUPV1 involved the formation of metabolites such as LMG, methanone, [4-(dimethyl amino), pheny] phenyl, phenol, 3-(dimethylamino), and phenol, 3,5,-dimethoxy [37]. The intermediates of MG degradation were malachite green carbinol, (dimethyl amino-phenyl)-phenyl-methanone, N,N-dimethylaniline, (amino phenyl)-phenyl methanone, (methyl amino-phenyl)-phenyl-methanone, and dibenzoylmethane [6]. There may be unidentified intermediates (reactions) between the two compounds. Our results revealed that different ecosystems present different microbial communities, resulting in various degradation rates and intermediate products from MG in the sediment.
3.4. Repeated Addition of MG Influencing MG Degradation in the Sediments
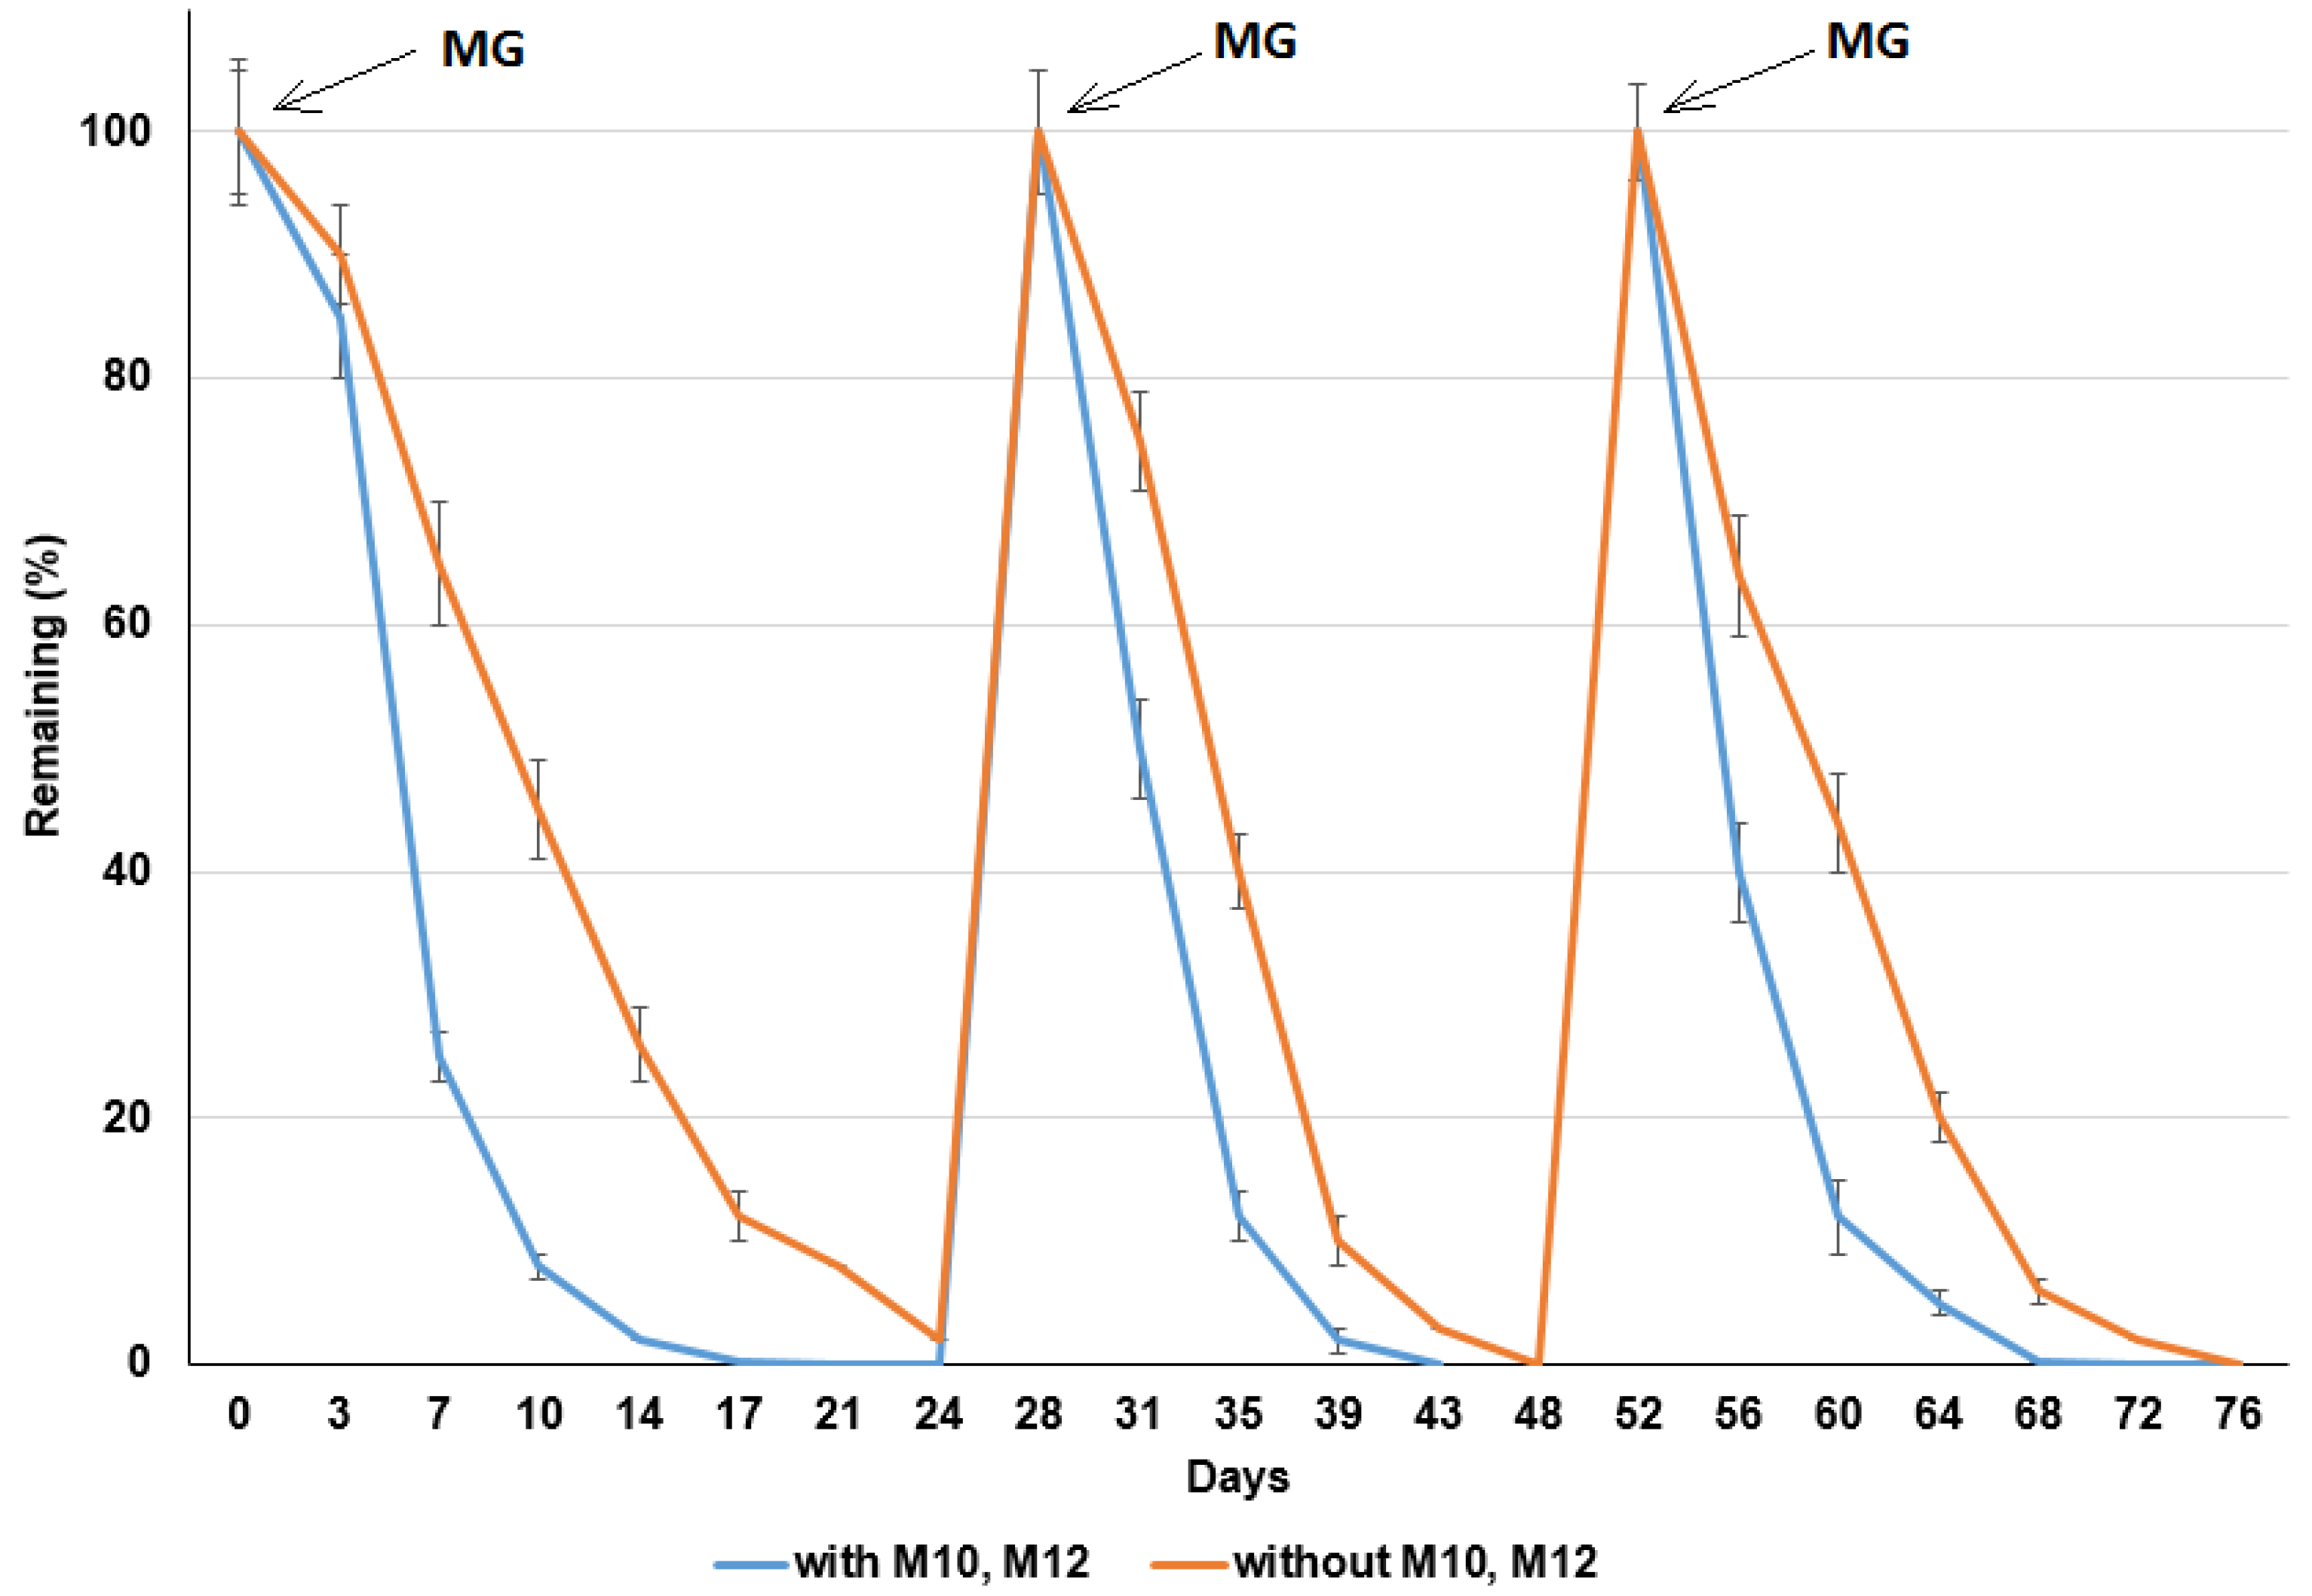
To test the long-term MG degradation ability of bacterial strains M10 and M12 in milkfish pond sediments, experiments with repeated additions of MG were performed (Figure 8). For the experiments with additions of strains M10 and M12, 10 mg/kg, 10 mg/kg, and 50 mg/kg MG was degraded at d 21, 48, and 72 after the first, second, and third additions of MG, respectively. The half-lives of MG were 2.4 d, 2.2 d, and 2.0 d after the first, second, and third additions, respectively. For the experiments without the addition of strains M10 and M12, 10 mg/kg, 10 mg/kg, and 50 mg/kg of MG was degraded at d 24, 52, and 76 after the first, second, and third additions of MG, respectively. The half-lives of MG were 5.4 d, 3.2 d, and 2.7 d after the first, second, and third additions, respectively (Table 4). The results indicated that the MG degradation rate was higher with the addition of strains M10 and M12 in the sediments. The MG-degrading ability of bacterial strains M10 and M12 can be maintained for 72 d. The degradation rate increased with the continuous addition of MG. The repeated addition of MG for the second and third time might increase the abundance of microbes with MG-degrading ability. This observation is similar to our previous study of dibromodiphenyl ether degradation in sediments [21]. The velocity of degradation in the first order decreases down to almost zero before the new MG was added. If MG is added earlier, the overall kinetics would be faster.
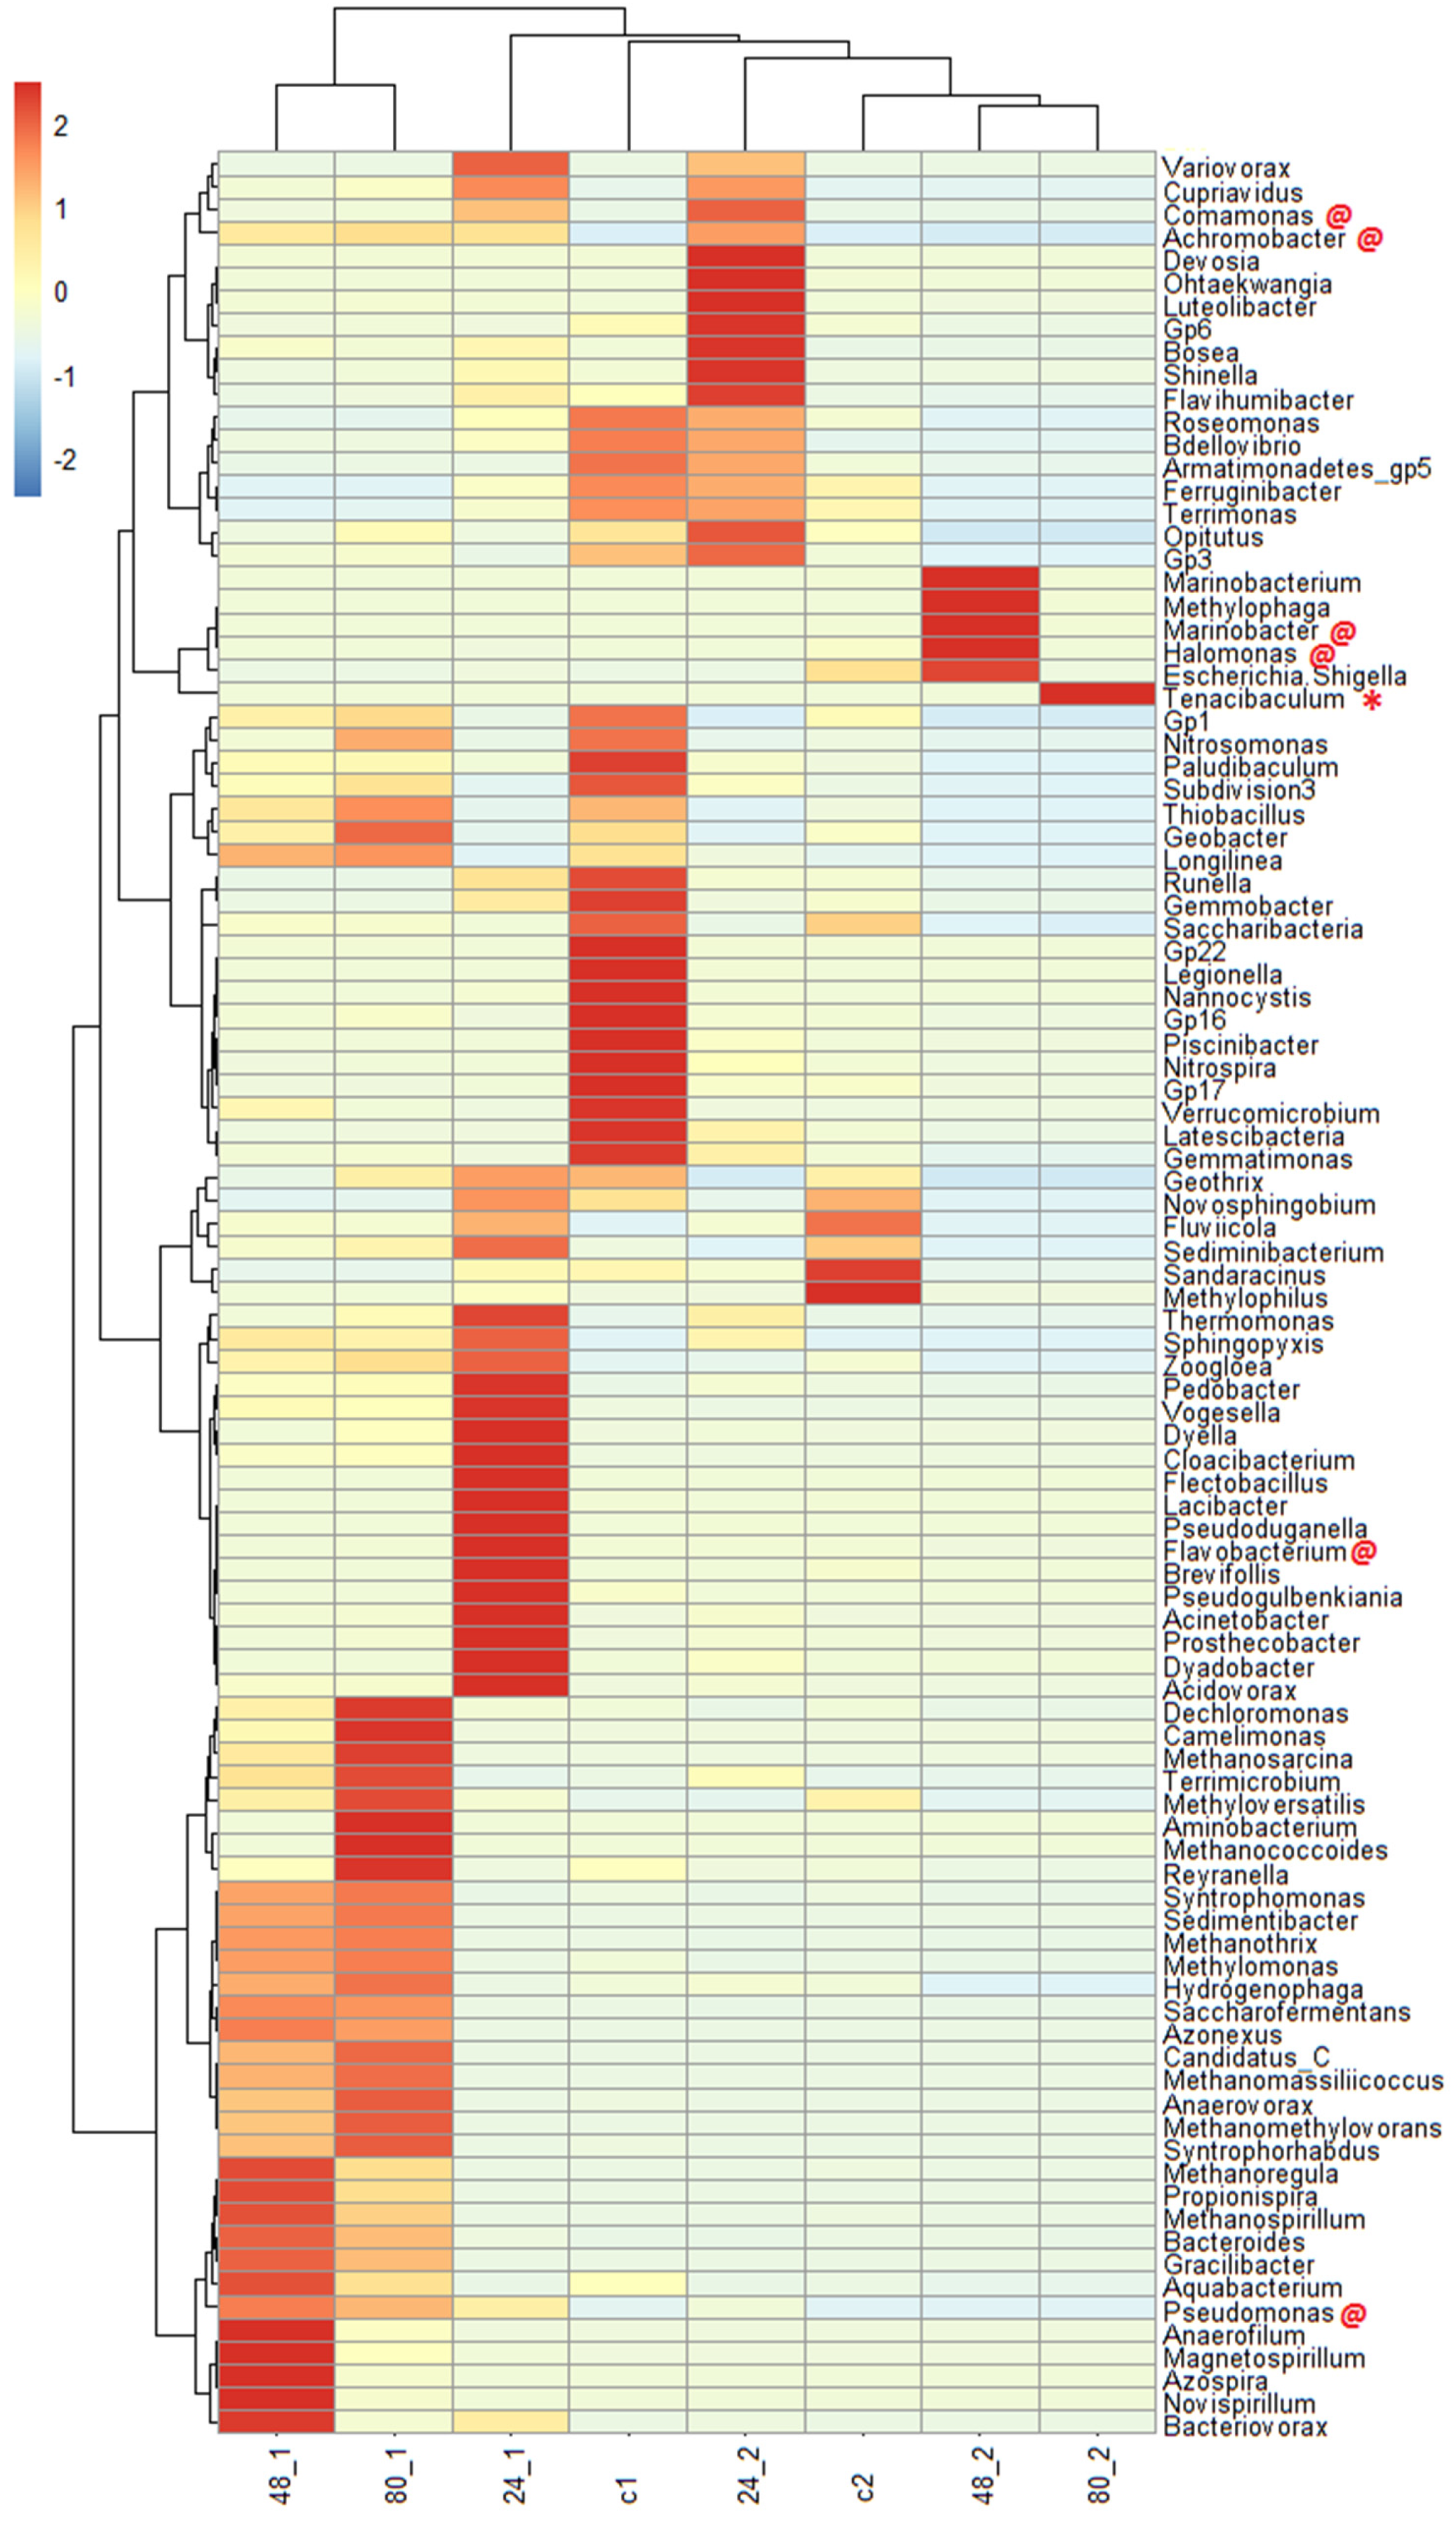
To obtain deeper insight, the microbial community compositions in the experiments using milkfish pond sediment with and without the addition of bacterial strains M10, M12, and the repeated addition of MG were analyzed by high-throughput sequencing. As shown in Figure 9, Tenacibaculum (the genus of strain M10) was present in the major community composition at the end of the experiment (red star). However, Enterobacter was not present in the major community at the end of the experiment. These results indicate that Tenacibaculum is more persistent in the experimental conditions and contributes more to MG degradation. In addition, four bacterial genera (Achromobacter, Halomonas, Comamonas, and Marinobacter), which have been reported as MG-degrading bacteria, increased in the experiments with the addition of bacterial strains M10 and M12 [31,38,39,40]. Another two bacterial genera (Pseudomonas and Flavobacterium), which have been reported as MG-degrading bacteria, increased in the experiments without the addition of bacterial strains M10 and M12 [17,41]. The addition of isolated bacteria results in higher proportions of natural degraders in the community and enhances MG degradation. The results indicated that these bacteria have good potential to degrade MG in the saline sediments.
4. Conclusions
Biodegradation is a major process of the removal of MG from milkfish pond sediments. The bacterial strains Tenacibaculum mesophilum (M10) and Enterobacter cloacae (M12) exhibited good degradation ability in the milkfish pond sediment under aerobic conditions. MG degradation rates were enhanced after three repeated additions. Tenacibaculum mesophilum was more persistent and may provide a greater contribution to MG degradation. In addition, Achromobacter, Halomonas, Comamonas, Marinobacter, Pseudomonas, and Flavobacterium were major microbial communities for MG-degradation in milkfish pond sediments. The intermediates of MG biodegradation were LMG, MK, 10,18-bisnorabieta-8,11,13-triene, 4-hydroxy-2-methoxybenzaldehyde, and 1,3,5-tri-tert-butyl-benzene. The bacterial strains M10 and M12 provide a potential solution for the treatment of sediment of high-salinity aquaculture ponds with MG contamination. These bacteria may also useful for the bioremediation of MG-contaminated mangrove, estuarine, and coastal sediments.
Author Contributions
Data Curation, C.-W.Y.; Funding Acquisition, W.-L.C. and B.-V.C.; Investigation, C.-W.Y., W.-L.C. and C.-Y.H.; Methodology, C.-Y.H.; Software, C.-W.Y.; Supervision, B.-V.C.; Writing—Original Draft, C.-W.Y.; Writing—Review & Editing, B.-V.C.
Funding
This research was supported by the Ministry of Science and Technology, Taiwan (Grant No. MOST 106-2632-B-031-001).
Conflicts of Interest
The authors declare that they have no conflict of interest.
References
- Bagarinao, T. Systematics, distribution, genetics and life history of Milkfish Chanos Chanos. Environ. Biol. Fish. 1994, 39, 25–41. [Google Scholar] [CrossRef]
- Martinez, F.S.; Tseng, M.C.; Yeh, S.P. Milkfish (Chanos chanos) culture: Situations and trends. J. Fish. Soc. Taiwan. 2006, 33, 229–244. [Google Scholar]
- Sarmah, A.K.; Meyer, M.T.; Boxall, A.B. A global perspective on the use, sales, exposure pathways, occurrence, fate and effects of veterinary antibiotics (VAs) in the environment. Chemosphere 2006, 65, 725–759. [Google Scholar] [CrossRef] [PubMed]
- Maalej-Kammoun, M.; Zouari-Mechichi, H.; Belbahri, L.; Woodward, S.; Mechichi, T. Malachite green decolourization and detoxification by the laccase from a newly isolated strain of Trametes sp. Int. Biodeterior. Biodegrad. 2009, 63, 600–606. [Google Scholar] [CrossRef]
- Srivastava, S.; Sinha, R.; Roy, D. Toxicological effects of malachite green. Aquat. Toxicol. 2004, 66, 319–329. [Google Scholar] [CrossRef] [PubMed]
- Du, L.N.; Wang, S.; Li, G.; Wang, B.; Jia, X.M.; Zhao, Y.H.; Chen, Y.L. Biodegradation of malachite green by Pseudomonas sp. strain DY1 under aerobic condition: Characteristics, degradation products, enzyme analysis and phytotoxicity. Ecotoxicology 2011, 20, 438–446. [Google Scholar] [CrossRef] [PubMed]
- Jadhav, J.P.; Govindwar, S.P. Biotransformation of malachite green by Saccharomyces Cerevisiae MTCC 463. Yeast 2006, 23, 315–323. [Google Scholar] [CrossRef]
- Chang, C.J.; Doerge, D.R.; Cerniglia, C.E. Biotransformation of malachite green by the fungus Cunninghamella Elegans. Appl. Environ. Microbiol. 2001, 67, 4358–4360. [Google Scholar]
- Shanmugam, S.; Ulaganathan, P.; Swaminathan, K.; Sadhasivam, S.; Wu, Y.R. Enhanced biodegradation and detoxification of malachite green by Trichoderma asperellum laccase: Degradation pathway and product analysis. Int. Biodeterior. Biodegrad. 2018, 125, 258–268. [Google Scholar] [CrossRef]
- Banet, I.M.; Nigam, P.; Singh, D.; Marchant, R. Microbial decolorization of textile dye containing effluent a review. Bioresour. Technol. 1996, 58, 217–227. [Google Scholar] [CrossRef]
- Daneshvar, N.; Ayazloo, M.; Khataee, A.R.; Pourhassan, M. Biological decolourization of dye solution containing malachite green by microalgae Cosmarium sp. Bioresour. Technol. 2007, 98, 1176–1182. [Google Scholar] [CrossRef]
- Parshetti, G.; Kalme, S.; Saratale, G.; Govindwar, S. Biodegradation of malachite green by Kocuria rosea MTCC 15. Acta Chim. Slov. 2006, 53, 493–498. [Google Scholar]
- Jefferson, J.; Joseph, O.F. Decolorization of malachite green and crystal violet by waterborne pathogenic mycobacteria. Antimicrob. Agents Chemother. 2003, 47, 2323–2326. [Google Scholar]
- Chen, C.Y.; Kuo, J.T.; Cheng, C.Y.; Huang, Y.T.; Ho, I.H.; Chung, Y.C. Biological decolorization of dye solution containing malachite green by Pandoraea pulmonicola YC32 using a batch and continuous system. J. Hazard Mater. 2009, 172, 1439–1445. [Google Scholar] [CrossRef]
- Ayed, L.; Chaieb, K.; Cheref, A.; Bakhrouf, A. Biodegradation of triphenylmethane dye malachite green by Sphingomonas Paucimobilis. World J. Microbiol. Biotechnol. 2009, 25, 705–711. [Google Scholar] [CrossRef]
- Khataee, A.R.; Zarei, M.; Dehghan, G.; Ebadi, E.; Pourhassan, M. Biotreatment of a triphenylmethane dye solution using a Xanthophyta alga: Modeling of key factors by neural network. J. Taiwan Inst. Chem. Eng. 2011, 42, 380–386. [Google Scholar] [CrossRef]
- Tao, Y.; Wang, F.; Meng, L.; Guo, Y.; Han, M.; Li, J.; Sun, C.; Wang, S. Biological decolorization and degradation of malachite green by Pseudomonas sp. YB2: Process optimization and biodegradation pathway. Curr. Microbiol. 2017, 74, 1210–1215. [Google Scholar] [CrossRef]
- Jung, J.; Seo, H.; Lee, S.H.; Jeon, C.O.; Park, W. The effect of toxic malachite green on the bacterial community in Antarctic soil and the physiology of malachite green-degrading Pseudomonas sp. MGO. Appl. Microbiol. Biotechnol. 2013, 97, 4511–4521. [Google Scholar] [CrossRef]
- Qu, W.; Liu, T.; Wang, D.; Hong, G.; Zhao, J. Metagenomics-based discovery of malachite green-degradation gene families and enzymes from mangrove sediment. Front. Microbiol. 2018, 9, 2187. [Google Scholar] [CrossRef]
- Zhou, J.; He, Z.; Yang, Y.; Deng, Y.; Tringe, S.G.; Alvarez-Cohen, L. High-Throughput metagenomic technologies for complex microbial community analysis: Open and closed formats. MBio 2015, 6, e02288-14. [Google Scholar] [CrossRef]
- Huang, H.W.; Chang, B.V.; Cheng, C.H. Biodegradation of dibromodiphenyl ether in river sediment. Int. Biodeterior. Biodegrad. 2012, 68, 1–6. [Google Scholar] [CrossRef]
- Larkin, M.A.; Blackshields, G.; Brown, N.P.; Chenna, R.; McGettigan, P.A.; McWilliam, H.; Valentin, F.; Wallace, I.M.; Wilm, A.; Lopez, R.; et al. Clustal W and Clustal X version 2.0. Bioinformatics 2007, 23, 2947–2948. [Google Scholar] [CrossRef] [Green Version]
- Sáez-Plaza, P.; Navas, M.J.; Wybraniec, S.; Michałowski, T.; Asuero, A.G. An overview of the Kjeldahl method of nitrogen determination. Part II. Sample preparation, working scale, instrumental finish, and quality control. Crit. Rev. Anal. Chem. 2013, 43, 224–272. [Google Scholar] [CrossRef]
- APHA. Standard Methods for the Examination of Water and Wastewater, 21st ed.; American Public Health Association/American Water Works Association/Water Environment Federation: Washington, DC, USA, 2005. [Google Scholar]
- Gerbersdorf, S.U.; Jancke, T.; Westrich, B. Physico-chemical and biological sediment properties determining erosion resistance of contaminated riverine sediments–Temporal and vertical pattern at the Lauffen reservoir/River Neckar, Germany. Limnologica 2005, 35, 132–144. [Google Scholar] [CrossRef]
- Yang, C.W.; Tsai, L.L.; Chang, B.V. Anaerobic degradation of sulfamethoxazole in mangrove sediments. Sci. Total. Environ. 2018, 643, 1446–1455. [Google Scholar] [CrossRef]
- Wright, E.S. Using DECIPHER v2.0 to Analyze Big Biological Sequence Data in R. R J. 2016, 8, 352–359. [Google Scholar] [CrossRef] [Green Version]
- Cole, J.R.; Wang, Q.; Fish, J.A.; Chai, B.; McGarrell, D.M.; Sun, Y.; Brown, C.T.; Porras-Alfaro, A.; Kuske, C.R.; Tiedje, J.M. Ribosomal Database Project: Data and tools for high throughput rRNA analysis. Nucleic Acids Res. 2014, 42, D633–D642. [Google Scholar] [CrossRef]
- Kolde, R. Pheatmap: Pretty Heatmaps. v.1.0.12 2019. Available online: https://cran.r-project.org/web/packages/pheatmap/index.html (accessed on 4 January 2019).
- Ting, W.T.E.; Yuan, S.Y.; Wu, S.D.; Chang, B.V. Biodegradation of phenanthrene and pyrene by Ganoderma Lucidum. Int. Biodeterior. Biodegrad. 2011, 65, 238–242. [Google Scholar] [CrossRef]
- Farha, A.K.; Tr, T.; Purushothaman, A.; Salam, J.A.; Hatha, A.M. Phylogenetic diversity and biotechnological potentials of marine bacteria from continental slope of eastern Arabian Sea. J. Genet. Eng. Biotechnol. 2018, 16, 253–258. [Google Scholar] [CrossRef]
- Liu, Z.P.; Wang, B.J.; Dai, X.; Liu, X.Y.; Liu, S.J. Zhouia Amylolytica gen. nov., sp. nov., a novel member of the family Flavobacteriaceae isolated from sediment of the South China Sea. Int. J. Syst. Evol. Microbiol. 2006, 56, 2825–2829. [Google Scholar] [CrossRef]
- Avendaño-Herrera, R.; Toranzo, A.E.; Magariños, B. Tenacibaculosis infection in marine fish caused by Tenacibaculum Maritimum: A review. Dis. Aquat. Org. 2006, 71, 255–266. [Google Scholar] [CrossRef]
- Ren, Y.; Zhou, Z.; Guo, X.; Li, Y.; Feng, L.; Wang, L. Complete genome sequence of Enterobacter Cloacae Subsp. Cloacae type strain ATCC 13047. J. Bacteriol. 2010, 192, 2463–2464. [Google Scholar]
- Pepper, L.L.; Gerba, C.P.; Gentry, T.J. Environmental microbiology. In Microorganisms and Organic Pollutants; Maier, M.M., Gentry, T.J., Eds.; Elsevier Inc.: Berkeley, CA, USA, 2015. [Google Scholar]
- Chang, B.V.; Liu, C.L.; Yuan, S.Y.; Cheng, C.Y.; Ding, W.H. Biodegradation of nonylphenol in mangrove sediment. Int. Biodeterior. Biodegrad. 2008, 61, 325–330. [Google Scholar] [CrossRef]
- Chaturvedi, V.; Verma, P. Biodegradation of malachite green by a novel copper-tolerant Ochrobactrum Pseudogrignonense strain GGUPV1 isolated from copper mine waste water. Bioresour. Bioprocess 2015, 2, 42–50. [Google Scholar] [CrossRef]
- Arun Prasad, A.S.; Satyanarayana, V.S.; Bhaskara Rao, K.V. Biotransformation of Direct Blue 1 by a moderately halophilic bacterium Marinobacter sp. strain HBRA and toxicity assessment of degraded metabolites. J. Hazard Mater. 2013, 262, 674–684. [Google Scholar] [CrossRef]
- Stolze, Y.; Eikmeyer, F.; Wibberg, D.; Brandis, G.; Karsten, C.; Krahn, I.; Schneiker-Bekel, S.; Viehöver, P.; Barsch, A.; Keck, M.; et al. IncP-1β plasmids of Comamonas sp. and Delftia sp. strains isolated from a wastewater treatment plant mediate resistance to and decolorization of the triphenylmethane dye crystal violet. Microbiology 2012, 158, 2060–2072. [Google Scholar] [CrossRef]
- Wang, J.; Qiao, M.; Wei, K.; Ding, J.; Liu, Z.; Zhang, K.Q.; Huang, X. Decolorizing activity of malachite green and its mechanisms involved in dye biodegradation by Achromobacter Xylosoxidans MG1. J. Mol. Microbiol. Biotechnol. 2011, 20, 220–227. [Google Scholar] [CrossRef]
- Liu, Y.; Jin, J.H.; Zhou, Y.G.; Liu, H.C.; Liu, Z.P. Flavobacterium Caeni sp. nov., isolated from a sequencing batch reactor for the treatment of malachite green effluents. Int. J. Syst. Evol. Microbiol. 2010, 60, 417–421. [Google Scholar] [CrossRef]
Figure 1.
Effects of temperature and concentration on malachite green (MG) degradation in milkfish pond sediments. “Sterile” indicates autoclaved sediments used as control. Y-axis represents the remaining percentage of MG in sediments. X-axis represents the execution times of experiments. Data from three independent experiments are presented as the mean ± SE (vertical lines on the data points). Regression lines, equations, and coefficients of determination (R2) are shown. The horizontal error bars indicate the 95% confidence interval of the regression line. The vertical error bars indicate the standard error of the data points.
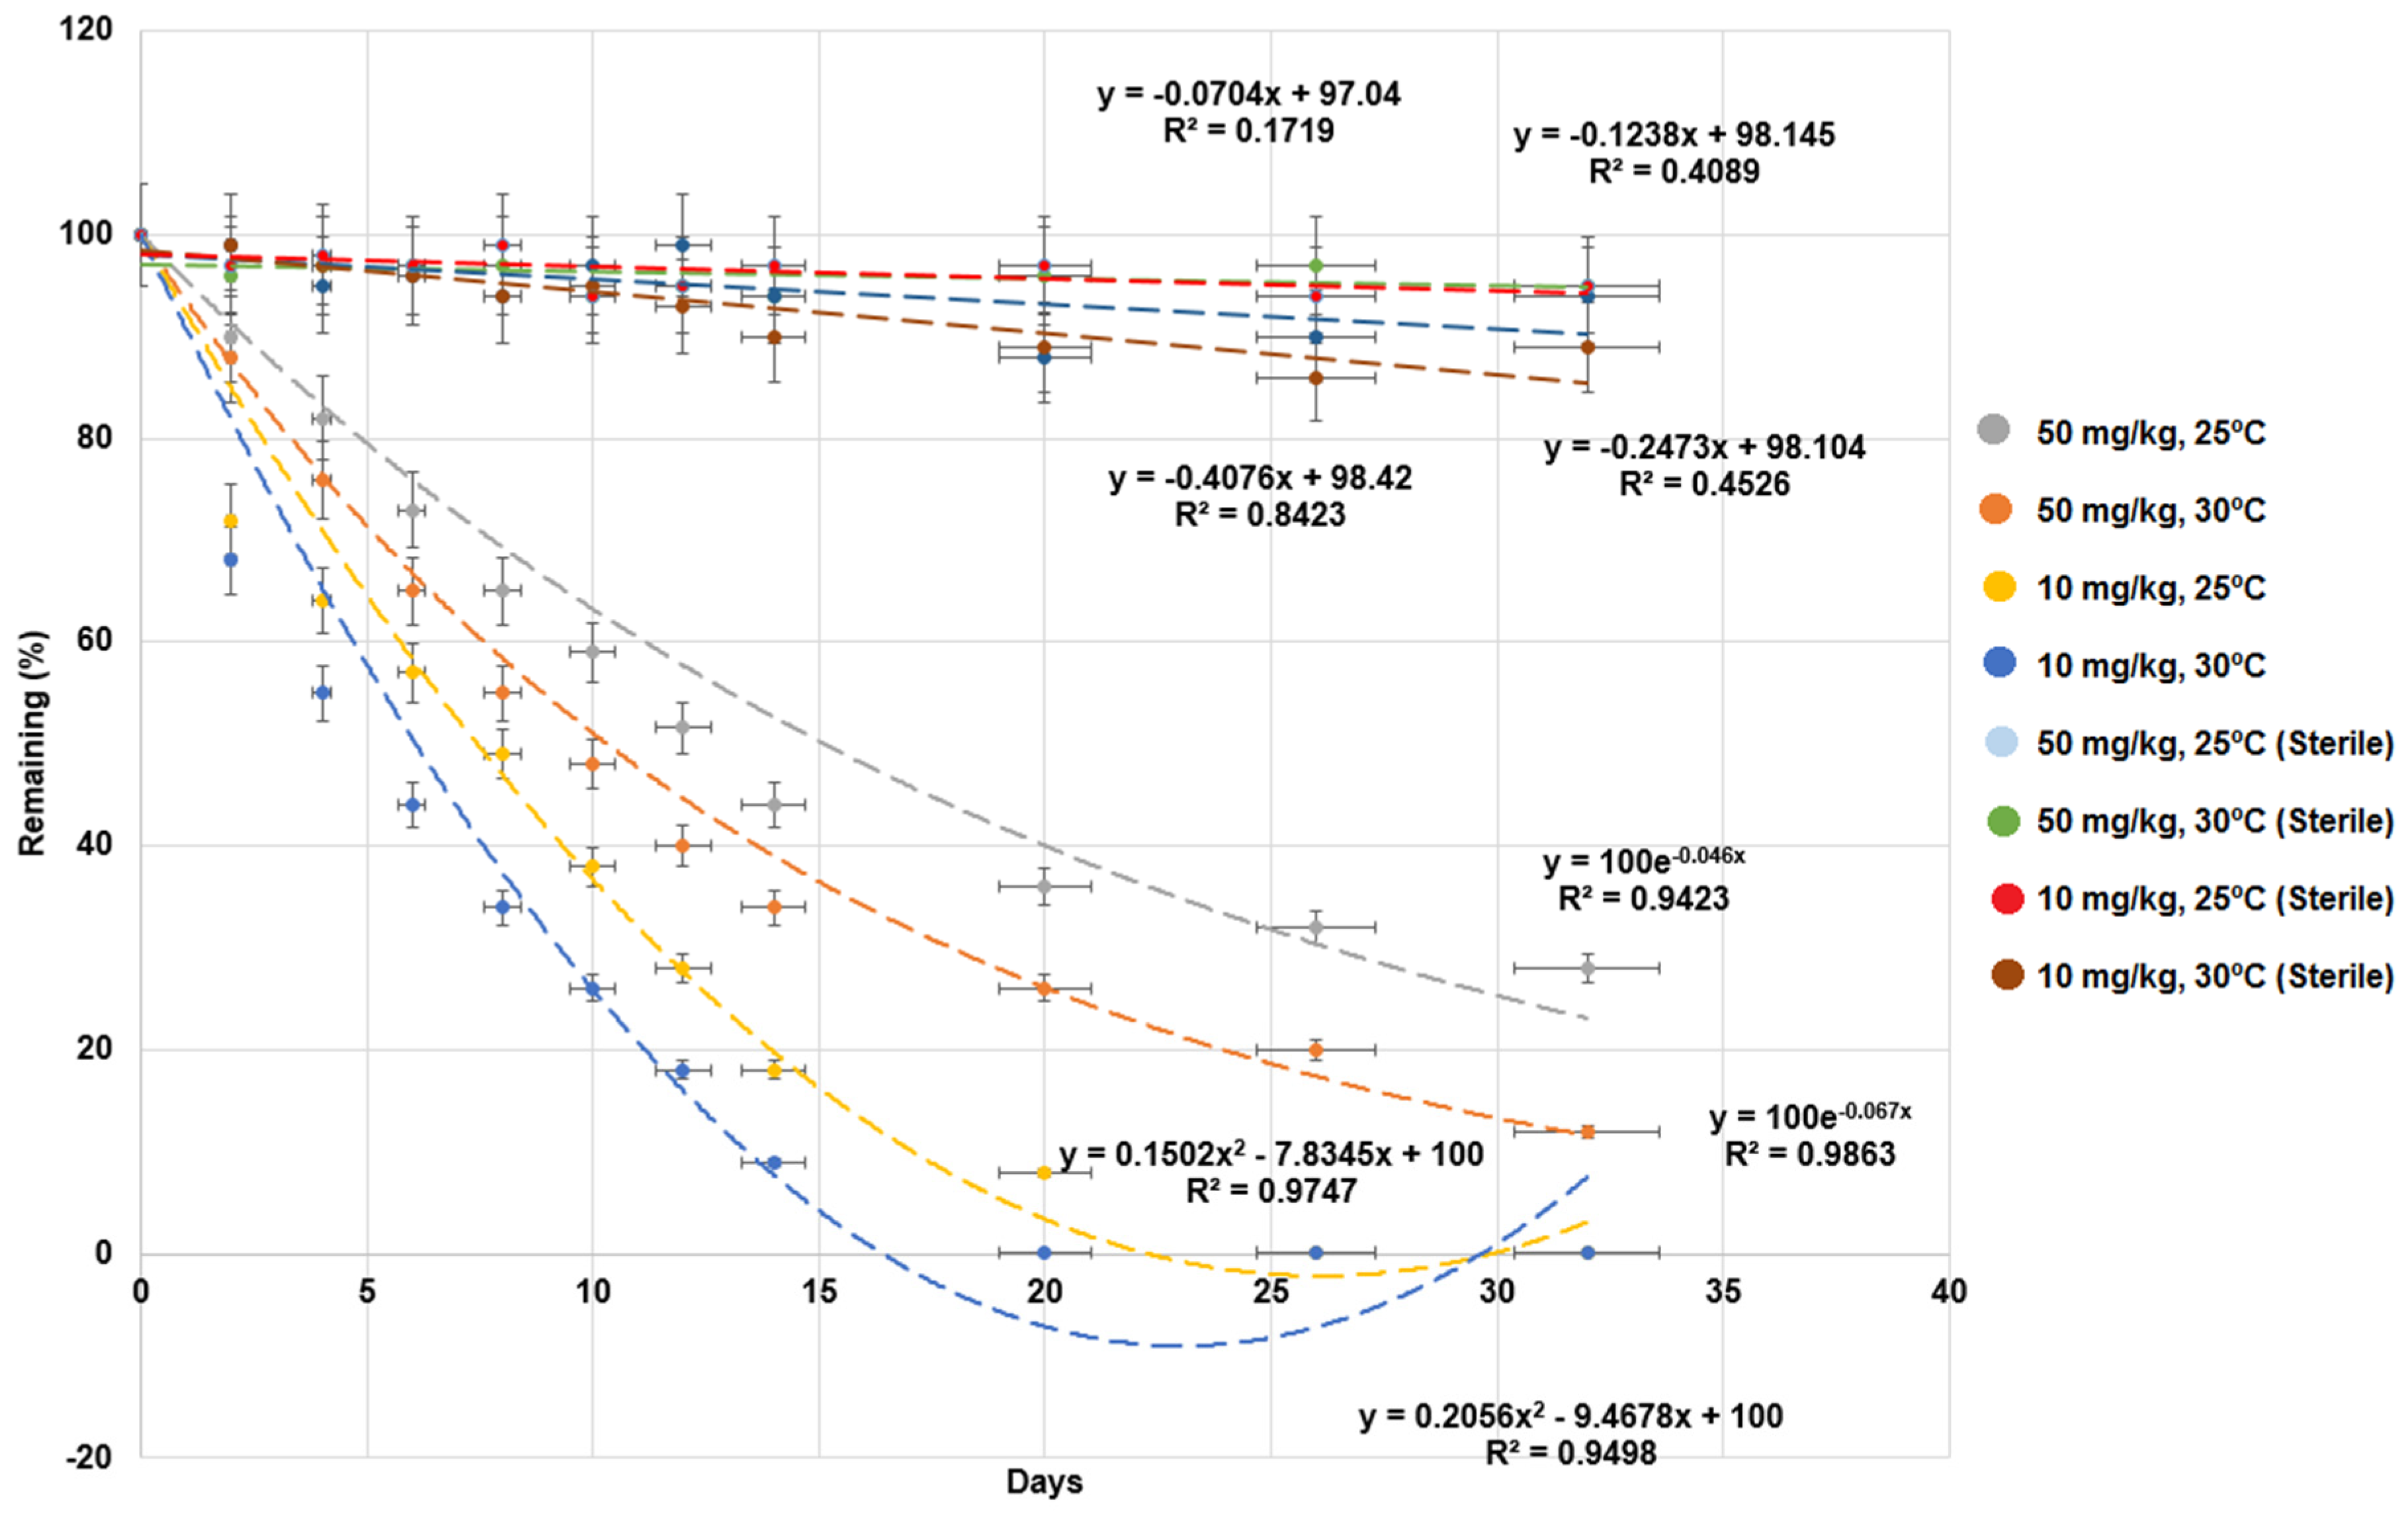
Figure 2.
Major microbial community changes in milkfish pond sediments with MG under different temperatures. A–C: Major microbial classes. D–F: Major microbial genera. A,D: Original milkfish pond sediments. B,E: Milkfish pond sediments with MG under 25 °C for 32 d. C,F: Milkfish pond sediment with MG under 30 °C for 32 d.
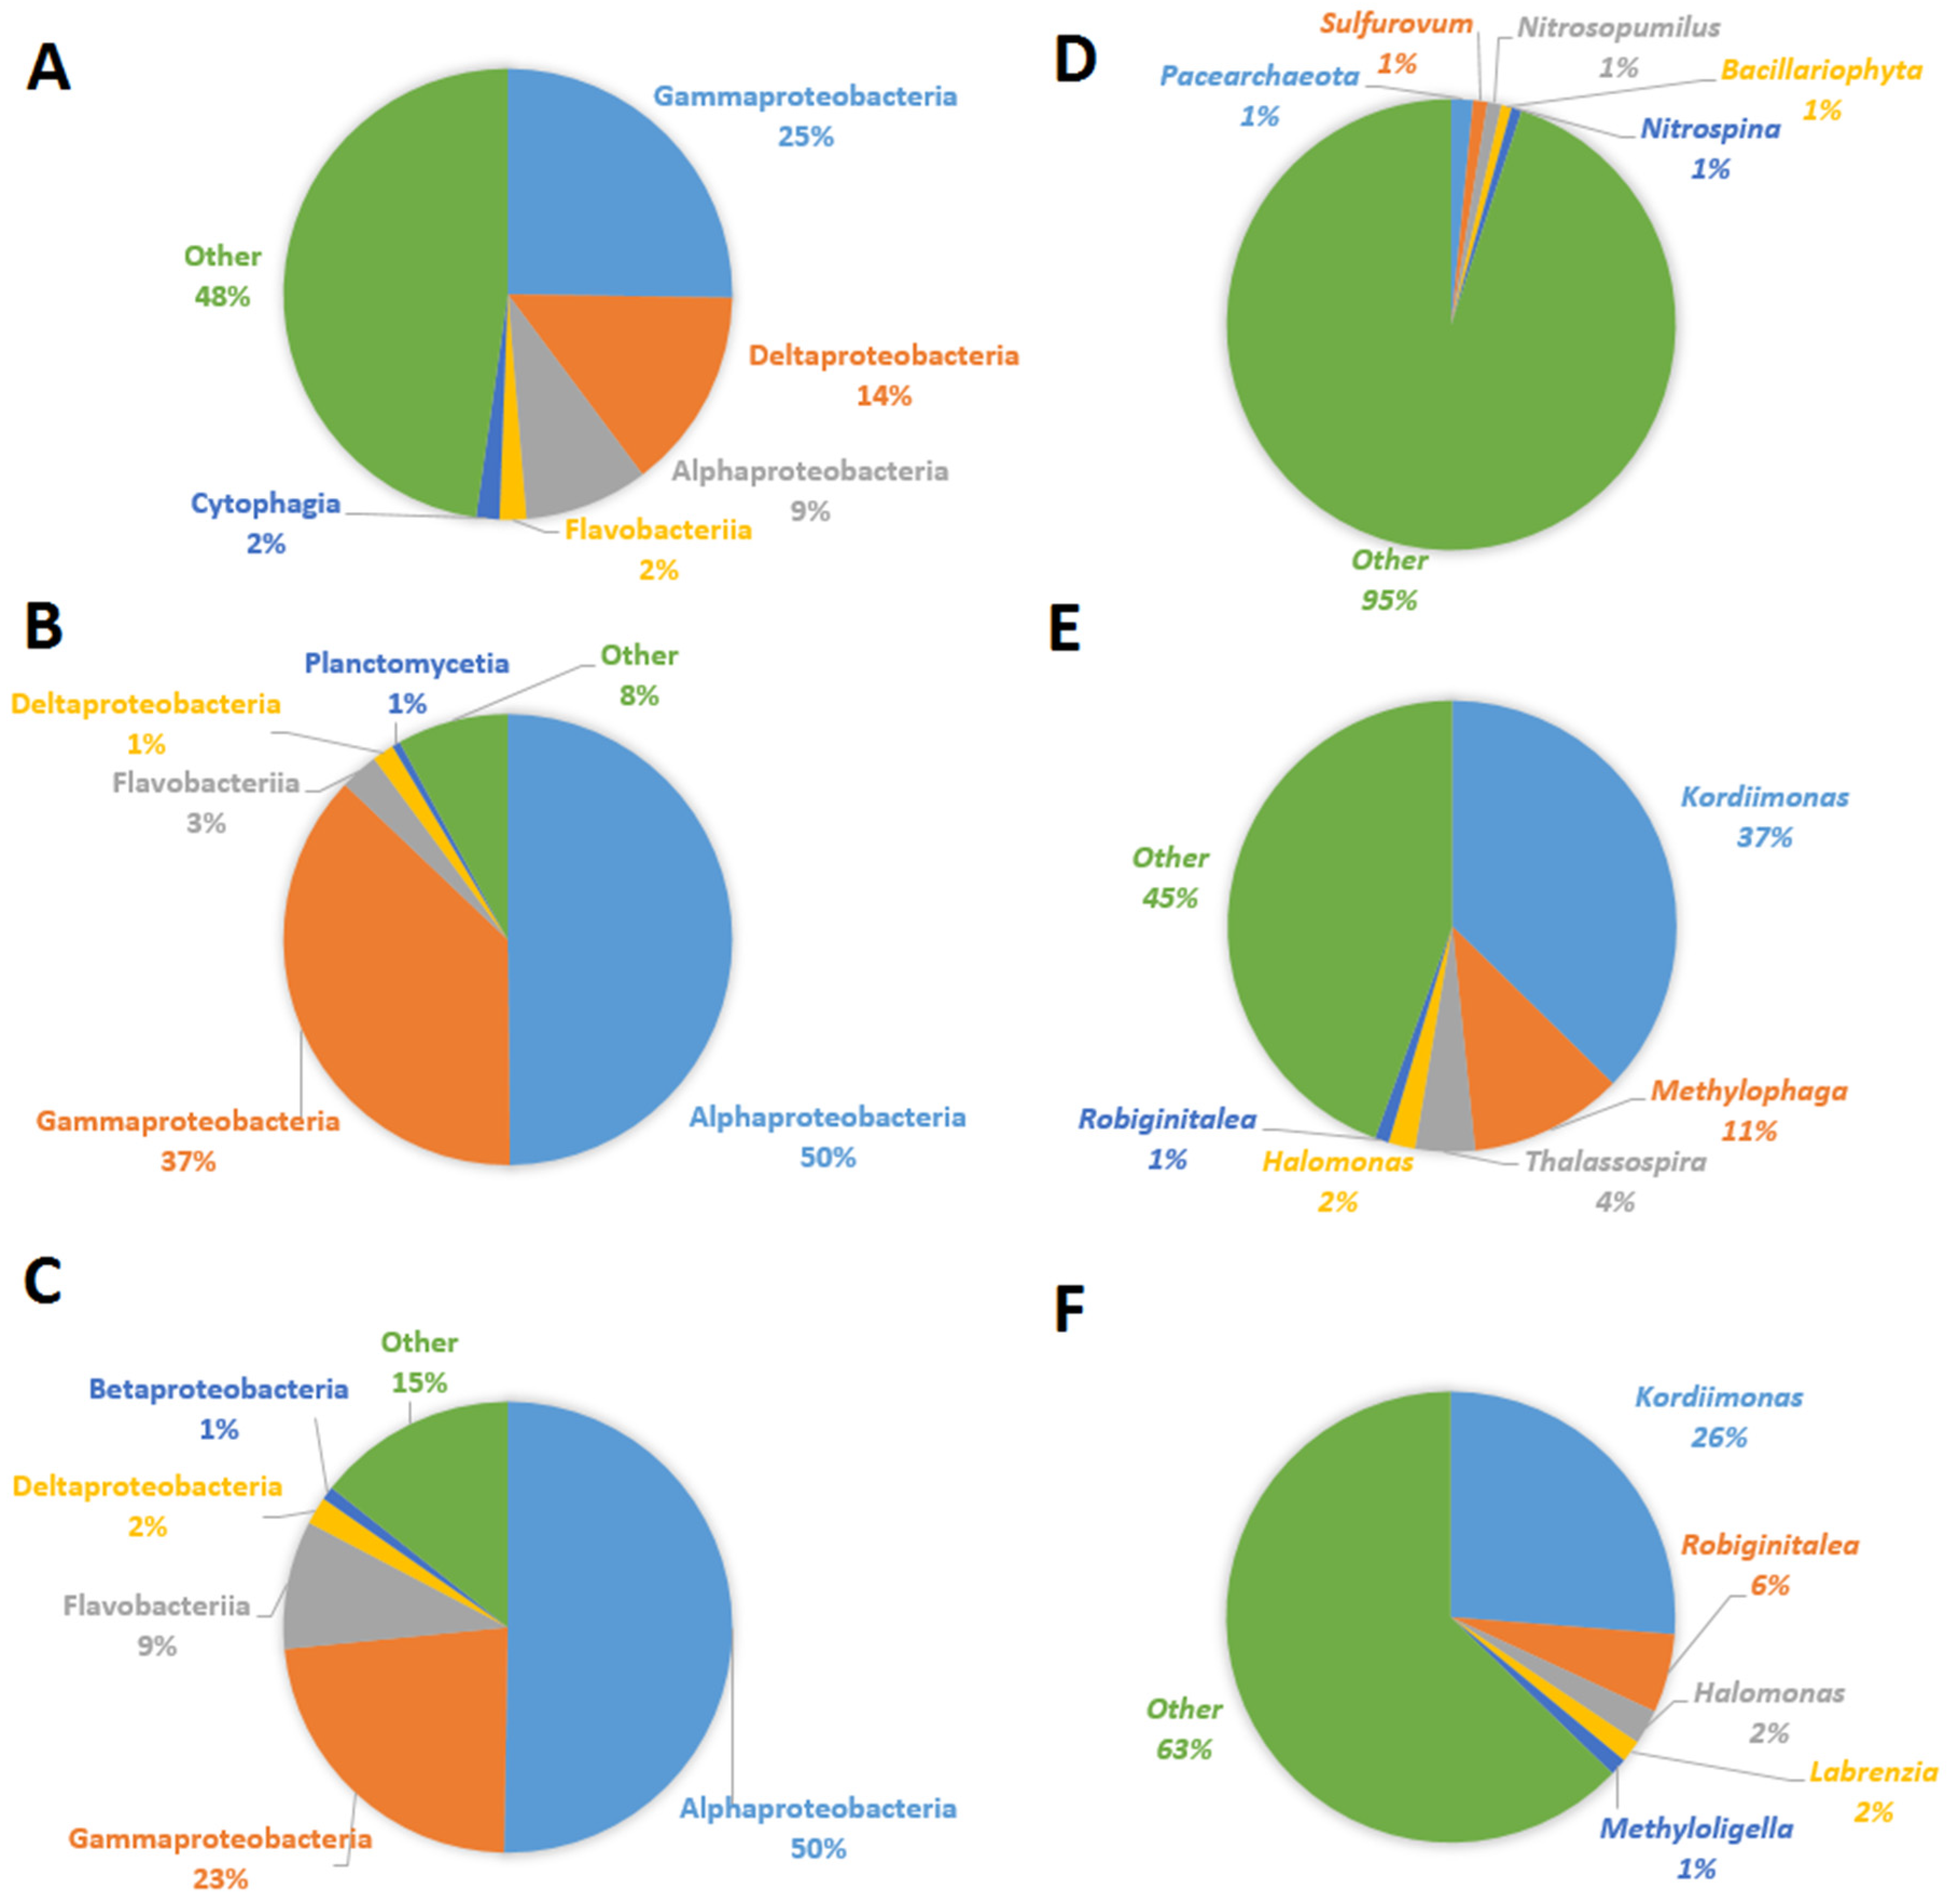
Figure 3.
Test of MG degradation ability of the three isolated bacterial strains. (A) Strain M6, (B) strain M10, and (C) strain M12. MG: malachite green, LMG: leucomalachite green, MK: Michler’s ketone. Y-axis represents remaining percentage of MG, LMG, and MK in experiments. X-axis represents the execution times of the experiments. Data from three independent experiments are presented as the mean ± SE. The horizontal error bars indicate 95% confidence interval of the regression line. The vertical error bars indicate standard error of the data points.

Figure 4.
16S rRNA gene phylogenetic analysis of isolated MG degrading bacterial strains: M6, M10, and M12. The ruler indicates the scale of the branch length of the tree, which estimates the average number of nucleotide substitutions per site. The superscript Ts indicates that the 16S rRNA sequences were from type strains. The bootstrapping values at each branch point indicate the times out of 1000 that the same branch was observed when repeating the phylogenetic reconstruction. The values in the small brackets are the similarity between the 16S rRNA sequences from the National Center for Biotechnology Information (NCBI) database and the sequences of isolated bacterial strains.

Figure 5.
Biodegradation of malachite green (MG) in milkfish pond sediment with the addition of bacterial strains M10 and M12. The y-axis represents the remaining percentage of MG in sediments. The x-axis represents the execution times of the experiments. Data from three independent experiments are presented as the mean ± SE (vertical lines on the data points). Regression lines, equations, and coefficients of determination (R2) are shown. The horizontal error bars indicate the 95% confidence interval of the regression line. The vertical error bars indicate the standard error of the data points.

Figure 6.
Degradation intermediates of MG detected by GC/MS analysis. (A) Leucomalachite green, (B) Michler’s ketone (B,C) 10,18-bisnorabieta-8,11,13-triene, (D) 1,3,5-tri-tert-butyl-benzene, and (E) 4-hydroxy-2-methoxybenzaldehyde.
Figure 6.
Degradation intermediates of MG detected by GC/MS analysis. (A) Leucomalachite green, (B) Michler’s ketone (B,C) 10,18-bisnorabieta-8,11,13-triene, (D) 1,3,5-tri-tert-butyl-benzene, and (E) 4-hydroxy-2-methoxybenzaldehyde.

Figure 7.
Proposed degradation pathway of MG in milkfish pond sediment with the addition of MG-degrading strains M10 and M12. Two consecutive arrows indicate that there may be unidentified intermediates (reactions) between the two compounds.
Figure 7.
Proposed degradation pathway of MG in milkfish pond sediment with the addition of MG-degrading strains M10 and M12. Two consecutive arrows indicate that there may be unidentified intermediates (reactions) between the two compounds.

Figure 8.
MG degradation in milkfish pond sediment with bacterial strains M10 and M12 and the repeated addition of malachite green (MG). Y-axis represents the remaining percentage of MG in sediments. X-axis represents the execution times of experiments. Data from three independent experiments are presented as the mean ± SE.

Figure 9.
Major microbial communities in the milkfish pond sediment with and without the addition of strains M10 and M12 and the repeated addition of MG. c1, 24_1, 48_1 and 80_1: d 0, 24, 48, and 80 of the experiment without strains M10 and M12. c2, 24_2, 48_2 and 80_2: d 0, 24, 48, and 80 of the experiment with strains M10 and M12. Red star indicates the genus Tenacibaculum (M10). Red “@” indicates previously reported MG–degrading bacterial genera. The color scale is based on the normalization of data.


Table 1.
Comparison of various treatments on MG degradation rate constants (k) and half-lives (t1/2) in the sediment.
Table 1.
Comparison of various treatments on MG degradation rate constants (k) and half-lives (t1/2) in the sediment.
| Treatments | k (1/day) | t1/2 (day) | R2 |
|---|---|---|---|
| 10 mg/kg and 25 °C (Sterile) | 0.0046 ± 0.00023 | 107.40 ± 5.4 | 0.905 |
| 10 mg/kg and 30 °C (Sterile) | 0.0055 ± 0.00027 | 90.90 ± 4.5 | 0.940 |
| 50 mg/kg and 25 °C (Sterile) | 0.0029 ± 0.00014 | 172.80 ± 8.6 | 0.905 |
| 50 mg/kg and 30 °C (Sterile) | 0.0033 ± 0.00016 | 149.80 ± 7.5 | 0.955 |
| 10 mg/kg and 25 °C | 0.117 ± 0.006 | 6.0 ± 0.3 | 0.951 |
| 10 mg/kg and 30 °C | 0.151 ± 0.007 | 4.6 ± 0.2 | 0.962 |
| 50 mg/kg and 25 °C | 0.046 ± 0.002 | 15.1 ± 0.7 | 0.958 |
| 50 mg/kg and 30 °C | 0.067 ± 0.004 | 10.3 ± 0.5 | 0.987 |
The half-life of each treatment was significantly different from their corresponding control (t test P < 0.05). R2: the coefficient of determination.
Table 2.
Strains M10 and M12 on the MG degradation rate constants (k) and half-lives (t1/2).
| Strains | k (1/day) | t1/2 (day) | R2 |
|---|---|---|---|
| M6 | 0.169 ± 0.008 | 4.1 ± 0.205 | 0.958 |
| M10 | 0.273 ± 0.014 | 2.5 ± 0.123 | 0.991 |
| M12 | 0.377 ± 0.019 | 1.9 ± 0.095 | 0.951 |
The half-life of each treatment was significantly different from the other treatments (t-test P < 0.05). R2: the coefficient of determination.
Table 3.
MG degradation rate constants (k) and half-lives (t1/2) in milkfish pond sediment with or without the addition of bacterial strains M10 and M12.
Table 3.
MG degradation rate constants (k) and half-lives (t1/2) in milkfish pond sediment with or without the addition of bacterial strains M10 and M12.
| Treatment | With Sediment | Without Sediment | ||||
|---|---|---|---|---|---|---|
| k (1/day) | t1/2 (day) | R2 | k (1/day) | t1/2 (day) | R2 | |
| Without bacteria | 0.090 ± 0.005 | 7.7 ± 0.385 | 0.983 | __ | __ | __ |
| M10 | 0.182 ± 0.001 | 3.8 ± 0.193 | 0.959 | 0.273 ± 0.014 | 2.5 ± 0.123 | 0.991 |
| M12 | 0.292 ± 0.015 | 2.4 ± 0.127 | 0.966 | 0.377 ± 0.019 | 1.9 ± 0.095 | 0.951 |
| M10 and M12 | 0.538 ± 0.027 | 1.3 ± 0.065 | 0.958 | 0.693 ± 0.035 | 1.0 ± 0.042 | 0.964 |
The half-lives of all the treatment pairs between with and without sediment were significantly different (paired t-test P < 0.05). The half-lives of all the treatments compared with control (without bacteria) were significantly different (t-test P < 0.05). R2: the coefficient of determination.
Table 4.
The MG degradation rate constants (k) and half-lives (t1/2) following the first, second, and third additions of MG during 72 d of incubation.
Table 4.
The MG degradation rate constants (k) and half-lives (t1/2) following the first, second, and third additions of MG during 72 d of incubation.
| Treatments | With Degrading Bacteria | Without Degrading Bacteria | ||||
|---|---|---|---|---|---|---|
| k (1/day) | t1/2 (day) | R2 | k (1/day) | t1/2 (day) | R2 | |
| 1st addition | 0.289 ± 0.014 | 3.46 ± 0.173 | 0.961 | 0.128 ± 0.006 | 7.81 ± 0.391 | 0.974 |
| 2nd addition | 0.315 ± 0.016 | 3.17 ± 0.158 | 0.972 | 0.217 ± 0.011 | 4.6 ± 0.230 | 0.994 |
| 3rd addition | 0.347 ± 0.017 | 2.88 ± 0.144 | 0.964 | 0.257 ± 0.013 | 3.8 ± 0.194 | 0.953 |
The half-lives of all treatment pairs with and without bacteria were significantly different (paired t-test P < 0.05). R2: the coefficient of determination.
© 2019 by the authors. Licensee MDPI, Basel, Switzerland. This article is an open access article distributed under the terms and conditions of the Creative Commons Attribution (CC BY) license (http://creativecommons.org/licenses/by/4.0/).
Share and Cite
MDPI and ACS Style
Yang, C.-W.; Chao, W.-L.; Hsieh, C.-Y.; Chang, B.-V. Biodegradation of Malachite Green in Milkfish Pond Sediments. Sustainability 2019, 11, 4179. https://doi.org/10.3390/su11154179
AMA Style
Yang C-W, Chao W-L, Hsieh C-Y, Chang B-V. Biodegradation of Malachite Green in Milkfish Pond Sediments. Sustainability. 2019; 11(15):4179. https://doi.org/10.3390/su11154179
Chicago/Turabian StyleYang, Chu-Wen, Wei-Liang Chao, Chi-Yen Hsieh, and Bea-Ven Chang. 2019. "Biodegradation of Malachite Green in Milkfish Pond Sediments" Sustainability 11, no. 15: 4179. https://doi.org/10.3390/su11154179
Note that from the first issue of 2016, this journal uses article numbers instead of page numbers. See further details here.