Thermal Perception in Mild Climate: Adaptive Thermal Models for Schools


Instituto Universitario de Arquitectura y Ciencias de la Construcción, Escuela Técnica Superior de Arquitectura, Universidad de Sevilla. Reina Mercedes Avenue 2, 41012 Seville, Spain
*
Author to whom correspondence should be addressed.
Sustainability 2019, 11(14), 3948; https://doi.org/10.3390/su11143948
Submission received: 3 June 2019
/
Revised: 15 July 2019
/
Accepted: 16 July 2019
/
Published: 19 July 2019
Abstract
:A comprehensive assessment of indoor environmental conditions is performed on a representative sample of classrooms in schools across southern Spain (Mediterranean climate) to evaluate the thermal comfort level, thermal perception and preference, and the relationship with HVAC systems, with a comparison of seasons and personal clothing. Almost fifty classrooms were studied and around one thousand pool-surveys distributed among their occupants, aged 12 to 17. These measurements were performed during spring, autumn, and winter, considered the most representative periods of use for schools. A new proposed protocol has been developed for the collection and subsequent analysis of data, applying thermal comfort indicators and using the most frequent predictive models, rational (RTC) and adaptive (ATC), for comparison. Cooling is not provided in any of the rooms and natural ventilation is found in most of the spaces during midseasons. Despite the existence of a general heating service in almost all classrooms in the cold period, the use of mechanical ventilation is limited. Heating did not usually provide standard set-point temperatures. However, this did not lead to widespread complaints, as occupants perceive the thermal environment as neutral—varying greatly between users—and show a preference for slightly colder environments. Comparison of these thermal comfort votes and the thermal comfort indicators used showed a better fit of thermal preference over thermal sensation and more reliable results when using regional ATC indicators than the ASHRAE adaptive model. This highlights the significance of inhabitants’ actual thermal perception. These findings provide useful insight for a more accurate design of this type of building, as well as a suitable tool for the improvement of existing spaces, improving the conditions for both comfort and wellbeing in these spaces, as well as providing a better fit of energy use for actual comfort conditions.
1. Introduction
Nonuniversity schools are one of the most common and widespread building typologies. Given their constant use over long hours and the sensitivity of their occupants, indoor thermal comfort must be guaranteed [1].
In the early days of thermal comfort model theory [2,3,4,5], a series of combined studies was carried out on preschool, elementary, and secondary school classrooms in the United States and the United Kingdom in order to assess the thermal sensation of the occupants. Significant differences were observed between the thermal preference of children and teenagers and that of adults [6,7,8,9], including differences in metabolic rate values and the difficulty encountered by pupils—especially those under 11—in understanding the questions. It was established that a new approach was required as the use of thermal indicators developed was not valid for nonuniversity classrooms, beyond allowing a relative comparison between different environments and thermal systems.
The review of thermal comfort in educational buildings performed by Zomorodian et al. [10] from 1969 to 2015 also found that previous studies argued that Rational Thermal Comfort (RTC) models, many of which were described in EN 15251: 2007 [11], could not predict the thermal comfort level in nonuniversity classrooms accurately. This was due, among other factors, to the wide disparity in thermal neutralities in the same climate zones and educational stages. Thus, research by Mors et al. [12] in Dutch primary schools (up to 11 years old) concluded that a significant difference was observed between the students’ mean thermal sensation vote (TSV) and that calculated using thermophysiological parameters such as the predicted mean vote [5] (PMV) indicator, since this indicator underestimated the real thermal sensation by over 1.5 points in its thermal scale of −3 to +3. Finally, adaptive thermal comfort (ATC) indicators showed higher temperature limits than those reported by the students.
Studies by Corgnati et al. [13], Fabbri [14], and De Giuli et al. [15,16] in classrooms in northern Italy, by Teli [17,18] in UK primary schools, and by Hyunjun et al. [19] in Korean nursery schools obtained similar results to those of Zomorodian [10] and Mors [12]. In addition, a microclimate study carried out by De Giuli [16] inside four classrooms showed major divergence in relation to the thermal sensation results and clothing insulation levels reported in the survey, with no correlation to relative position inside the classrooms. However, given the young age of the students (9–11), clothing insulation was evaluated through direct observation instead of questionnaires. The thermal discomfort results obtained near the outer walls were higher than in the rest of the classrooms, and it was also found that the higher the classroom’s outer envelope surface, the higher the thermal dissatisfaction of the occupants. No clear correspondence was observed between the occupants’ thermal sensation and the indoor environmental parameters, further supporting the inherently subjective nature of environmental comfort.
Once the ATC model was developed, several studies were performed in schools using ATC indicators. However, as in the case of the RTC model, only a few studies revealed good approaches between predictions and TSV [10]. Therefore, the comparisons between RTC and ATC results from the distribution of surveys in schools are complex, given the difficulties in evaluating input parameters such as clothing insulation or metabolic rate values or in understanding the questions (especially by young students).
In order to improve the RTC model to be able to deal with adaptation phenomena, especially for naturally ventilated spaces, Fanger et al. [20] developed an extension of the predicted mean vote (PMV) model for non-conditioned spaces, incorporating an “expectancy factor” coefficient which solves the PMV overestimation of TSV due to low expectations and high metabolic rate values under warm conditions [21,22].
In keeping with this, d’Ambrosio et al. [23] performed a thermal comfort study with 200 Italian naturally ventilated classrooms and more than 4000 students. This study obtained an expectancy factor value of 0.9 for PMV for Mediterranean climate schools.
Objectives
The main aim of this research is the comprehensive assessment of the indoor environment of typical classrooms in primary and secondary schools (aged 12–17 years) across a wide area of southern Spain. Thermal comfort level, thermal perception, and the relationship with HVAC systems, comparing seasons and personal clothing, have been evaluated and the indoor conditions indexes derived: the thermal sensation vote (TSV) and the thermal preference vote (TPV) of occupants, depending on clothing insulation level and season. The actual thermal comfort level determines the efficiency of the thermal exchanges produced by different heating, ventilation, and air-conditioning (HVAC) systems.
Data were obtained using on-site measurements and surveys during a type day in winter and spring and autumn (midseason) conditions, as more representative of normal use, on a sample of almost one hundred classrooms selected from the four most representative climate subzones in the Mediterranean area. Study in summer conditions was ruled out, given that schools close for holidays for most of the summer and that the effect of this use is negligible on the actual performance. This analysis was therefore performed using both rational (RTC) and adaptive thermal comfort (ATC) indicators.
As a secondary objective, a comparison was performed between the thermal sensation vote (TSV) obtained from surveys and some of the existing main thermal comfort indicators, calculated from measurements, including the predicted mean vote (PMV) [5] and ASHRAE ATC indicator [24]. This study also incorporated an ATC indicator optimized for the climate of the Iberian Peninsula for its comparison.
2. Materials and Methods
The thermal behavior of several multipurpose classrooms was analyzed during a normal school day in all the schools (ages 12–17). Two data collection sets were established on each of the school days in winter and in midseasons: early morning at the beginning of the school-day and before the midmorning break.
A set of thermal indicators was generated from the data collected to evaluate the thermal comfort level of these spaces and the factors that influence them.
Both thermal indicators and data collected were treated and statistically analyzed.
2.1. Selection of the Study Sample
In the selection of the sample, different factors have been taken into consideration, particularly those with greater weight in thermal response, thus ensuring an accurate population representation of the sample: building type, climatic area, envelope characteristics, and indoor load presence. The most common building typology in the area is a detached building with linear or comb shape, either elementary/primary (C.P.E.I.P.) or secondary/high schools (I.E.S.). The characteristics of buildings erected since 2006 are in compliance with the Spanish Technical Building Code (CTE) [25], especially as regards energy performance—derived from the transposition of the Energy Performance of Buildings Directive (EPBD). Older buildings constructed under previous regulations are less demanding in their energy control, often resulting in a considerable lack of envelope thermal insulation.
In general, the climatic area of Andalusia can be defined as a temperate climate of warm summers or Mediterranean climate (Köppen Csa). Subregional variants found within it include cold to temperate areas in winter (types C, B, or A), as well as warm or average summers (four or three) so that Spanish energy performance zoning [26] is of interest when identifying and representing within the sample. All the main climate areas in southern Spain [27], A4, B4, C3, and C4, are covered, with their equivalence according to the Köppen climate classification [28] (Table 1).
For each case under analysis, a set of classrooms was selected: multipurpose classrooms measuring approximately 50 m2 in compliance with Andalusian standards for school facilities [29]. Average occupation is 30 students (plus teacher) with dimensions around 7.70 × 6.00 m and 3.00 m high, with windows to the left of the seats. The space is usually defined by horizontal and vertical partitions between classrooms of similar size and use, and a common access corridor (Figure 1).
In order to homogenize the operational conditions, cases with the greatest interest for the future were chosen, including a sizable sample of computer-equipped classrooms which are part of the Spanish “Escuela T.I.C. 2.0” program [30]. All schools are heated by hot water (HW) radiators [30], with some options for cooling. Schools in southern Europe have traditionally relied on window opening and uncontrolled infiltrations through the building envelope for ventilation. Although the Spanish standard on Thermal Installations in Buildings (RITE) [31] establishes the mandatory use of mechanical ventilation in nonresidential buildings, these systems are seldom operated in schools equipped with them.
2.2. Characterization and Measurements
All the construction and morphological building specifications and running conditions were compiled to establish the boundary conditions of the analysis.
The composition of two of the most common walls of the classrooms under study is shown in Table 2, using the examples of a center built following CTE standards and another predating this regulation (2006).
Alongside the classroom’s characterization and operation, the physical parameters relating to thermal comfort [32] were measured in multiple locations, both outdoor and indoor [33] (Figure 2 and Table 2).
Detailed information on characteristics of instruments used is presented in Table 3.
All the instruments listed comply with the minimum requirements of ISO 7726 [34] for class C (comfort).
Table 4 shows the measured values of one of the classrooms under study with hot water radiators and a partially open window in the back (A5 position).
The operative temperature for each location (to, in °C) [25] was calculated based on air velocity (va, in m/s), dry bulb air temperature (Ta, in °C), and mean radiant temperature (, in °C) from black globe temperature (tg, in °C), globe diameter (D, in m), and emissivity (ε, dimensionless; 0.95 for black globe), using Equations (1), (2) [4], and (3) [35]:
The personal perception of the thermal environment was evaluated and the physical parameters measured using thermal comfort surveys according to the Spanish version of Standard ISO 10551 [36], where the essential values affecting the determination of thermal comfort indicators correlate with their position in the classrooms. The main parameters of perception and personal experience analyzed include gender and age, thermal sensation vote (TSV), thermal comfort level, thermal preference vote (TPV), vertical air temperature gradient sensation, acceptability/unacceptability of the local thermal environment, clothing worn, and occupant location in the classroom.
When strange answers were found for the multiple choices for the same question, the survey was ignored and excluded from the analysis process.
A total of 977 students were surveyed during the measurements on site (Table 5).
2.3. Thermal Comfort Indicators
To improve the comparison of the data obtained, both subjective (thermal comfort surveys) and objective (environmental parameter measurement and insulation clothing level) data were analyzed using thermal comfort indicators. This is in compliance with the recommendations of ISO 15265 [37], ISO 7933 [38], EN ISO 7730 [39], and EN ISO 11079 [40] standards on Ergonomics of the thermal environment, which allow common parameters to be established according to the thermal sensation experienced by humans (Table 6).
The metabolic rate value considered for these calculations was 1.30 met for teenagers as described in previous studies [24,25,26,27,28,29,30,31,32,33,34,35,36,37,38,39,40,41], given that the metabolic rate values and methods of ISO 8996 focus on adults [42]. The clothing insulation values were obtained from the clothing worn by the occupants as described in the surveys, later quantified according to EN ISO 7730 [39] and EN ISO 9920 [43], and corrected according to Havenith et al. [41] for seated occupants, Icl < 1.84 clo and air velocities <0.15 m/s.
This later index, developed by the National Laboratory for Civil Engineering of Portugal, was chosen instead of the ACA [48] and CEN [11,12,13,14,15,16,17,18,19,20,21,22,23,24,25,26,27,28,29,30,31,32,33,34,35,36,37,38,39,40,41,42,43,44,45,46,47,48,49] ATC indicators because it is a variant of the ASHRAE ATC indicator [25]. This was specially adapted to Mediterranean climate conditions (Iberian Peninsula) and many of its surveys and measurements on site were developed in schools. Its main strength is that it can be applied both for thermal controlled spaces and free-running conditions.
The predictor indexes are calculated based on the data measured for each survey node (A points) of Figure 2 (Ta, RH, Va, , to) allowing average classroom value and standard deviation to be calculated.
3. Results and Discussion
The main results of the study, part of a PhD dissertation [50], are grouped into four sections:
- Room characteristics.
- Objective thermal parameters.
- Occupants’ clothing thermal insulation.
- Thermal environment evaluation.
3.1. Room Characteristics
On a building level, regional educational institutions under study have an envelope with thermal bridges through slabs and pillars which account for energy losses (Figure 3). However, given their limited scale, a thermography study according to EN 13187: 1998 [51] shows no significant impact on indoor conditions and heat loss. As regards lighting, direct sunlight entry should not be considered a significant factor in energy demand as it only enters 10% of the classrooms under study due to the presence of solar protections. In contrast, artificial lighting was in use in 73% of the classrooms and disconnected in around 60% of cases when the projector was in use.
Although the maximum capacity was 30 students per classroom, an internal load with a mean value of 20.5 students per classroom was observed during measurements. In addition, both the projector and the teacher’s PC were used in 20% of the measurements, while students’ laptops were in operation in only 12% of these.
Analysis of existing HVAC systems of the institutions under study shows that hot water radiators are the most common system for winter heating, with the odd exception in which electric heaters are used. Sixty percent of classrooms used heating systems often in winter, with 80% of this use concentrated in the morning. There is a strong relationship with climatic subzoning as hot water radiators were barely used in zone A, but remained in use over 70% of the time in the case study in climate zone C. Moreover, cooling systems were found in only a third of the classrooms studied and, in all cases, these were retrofitted direct expansion type. During heating, almost all classrooms kept the windows closed (87%), so that ventilation was not adequate. However, in classrooms without heating systems, windows were kept open in 54% of cases. Moreover, 78% of the classrooms measured in this study kept the windows closed even in midseasons.
3.2. Objective Thermal Parameters
During this study, in winter heated classrooms mean operative temperature was around 20.5 °C (Table 7), a half degree below the usually accepted value of 21 °C, established as the lower limit for operative temperature set by Spanish RITE [31]. This occurred because the measured mean radiant temperature usually has a low value—an average of 20.3 °C which the mean air temperature, 20.5 °C, is unable to compensate for. Therefore, existing heating systems do not actually solve the classrooms’ heat losses with the usual standard approaches, an issue shared by all the climate zones under study.
In midseasons, the mean operative temperature in free-running occupied classrooms is around 21.3 °C, matching the value recommended by RITE regulation [31] and the typical comfort standards. The mean air temperature is around 22.1 °C, while the mean radiant temperature displays the lower value of 20.5 °C.
3.3. Occupants’ Clothing Thermal Insulation
Responses on occupants’ clothing clearly show two models of behavior, linked to the season (Figure 4). In winter, the use of clothes presents a certain homogeneity, with an almost normal distribution of clothing insulation around 0.9 clo (median), a situation common to all the climate zones analyzed, with almost no variations in clothing, even on warm winter days. In the case of the intermediate seasons, this response is more variable, with a more skewed and asymmetrical distribution and less clothing. The median for this season is 0.74 clo, although the most frequent value is 0.60, with values ranging from 0.4 to more than 1.40 clo (STD of 0.23 clo).
During winter, there is a more stable response regardless of climatic conditions. This situation is altered during midseason, with a more direct response to the warm episodes and clearly differentiated probability curve adjustments. This aspect is represented clearly in Figure 5, where the clothing insulation variation of the occupants in relation to the internal operative temperature is low and presents a very horizontal trend line, but with weak adjustment due to high variability. There are differences between individuals of up to 1.2 clo for the same operative temperature (this value is of the order of 0.2 clo between the average values added per classroom for the same temperature). In the case of the mean season, this behavior has a greater influence, which is also scattered, and with more pronounced variability than in winter (especially with low operative temperatures).
It is worth noting that while the deviation in clothing insulation between the different classrooms is small, less than 0.10 clo, it does become significant within rooms, with a range of variation between 0.19 clo in winter and 0.23 clo in midseason. Data show that in the early hours of the day, clothing insulation usually has a slightly higher value in the area closest to the windows, but this variability has no statistical significance when compared to the whole room (ANOVA p-value > 0.05), or even in relation to the inner zone (T-test > 0.05), so that the actual difference of 0.03 observed is not relevant (95%). Equally, in the afternoon, the difference between inner and outer classroom rows does not reach a level of significance (T-test > 0.05 at 95% confidence), although evidence shows that the users nearer the windows tend to have a lower clothing insulation level (median z-score of −0.29 vs 0.11). When compared to the group as a whole, although there is no significant difference (ANOVA p-value > 0.05), an underlying trend is observed towards slightly lighter clothing (difference of 0.02 clo) in the rows nearer the windows versus those further away (Fisher’s minimum significant difference LSD 0.349 over a limit of 0.308 between these zones).
Clothing insulation figures from the sample do not present a good fit to the dynamic environmental limits set by the IREQmin and IREQneu —both calculated with the corrections proposed by d’Ambrosio et al. [45] and used as partial references, given that the IREQ model was designed for operative temperature values below 10 °C. Most of the values are above the minimum reference limits and, as a result, the clothing insulation level in most situations may be considered acceptable at least, with most of the cases located over the neutral line. There is a low/moderate To-clothing linear correlation—R2 values for both seasons of −0.26 analyzed by occupant and −0.64 if grouped by classroom—but the IREQ models presented with temperature evolution, used as an approximate guide, do not converge with the trends of the actual values of To-clothing on both stations, nor is there a grouping around the line of neutral IREQ that could be expected according to the IREQ model. Based on the classical interpretation, this situation could result in a certain lack of thermal balance, with some occupants conserving more energy than required, thus reporting votes outside thermal neutrality areas and demanding a somewhat cooler environment. Despite this, the mean values of clothing insulation in relation to operative temperature for winter, midseasons, and the three seasons are very close to those proposed by IREQneu, as can be seen in Table 8.
The main conclusion reached is that the habitual models may not allow an adequate prediction for the degree of clothing to be expected according to the temperature, although the mean of the clothing insulation value is practically the same as IREQneu, with a deviation of more than 0.20 clo and a divergence from the trends of the actual values of To-clothing. This divergence introduces uncertainty in other procedures for the prediction or analysis of the conditions of comfort based on environmental parameters, as well as in those associated with design strategies of dress systems associated with comfort and sanitation conditions (i.e., uniforms and school attire). It therefore becomes necessary to revise these methods and include corrective factors linked to sociocultural aspects, climatic localization, and specific types of activity (environments where these take place) as Humphreys [52] explained in his seminal study of the discipline. This has also been discussed in other studies [18,53,54,55]
3.4. Thermal Environment Evaluation
The thermal environment evaluation was carried out using the thermal sensation vote (TSV), thermal preference vote (TPV) and the percentage of people who voted acceptance or rejection of the thermal environment [36], according to surveys and ATC, even taking into consideration their limitations when describing the thermal environment perception [56,57,58,59].
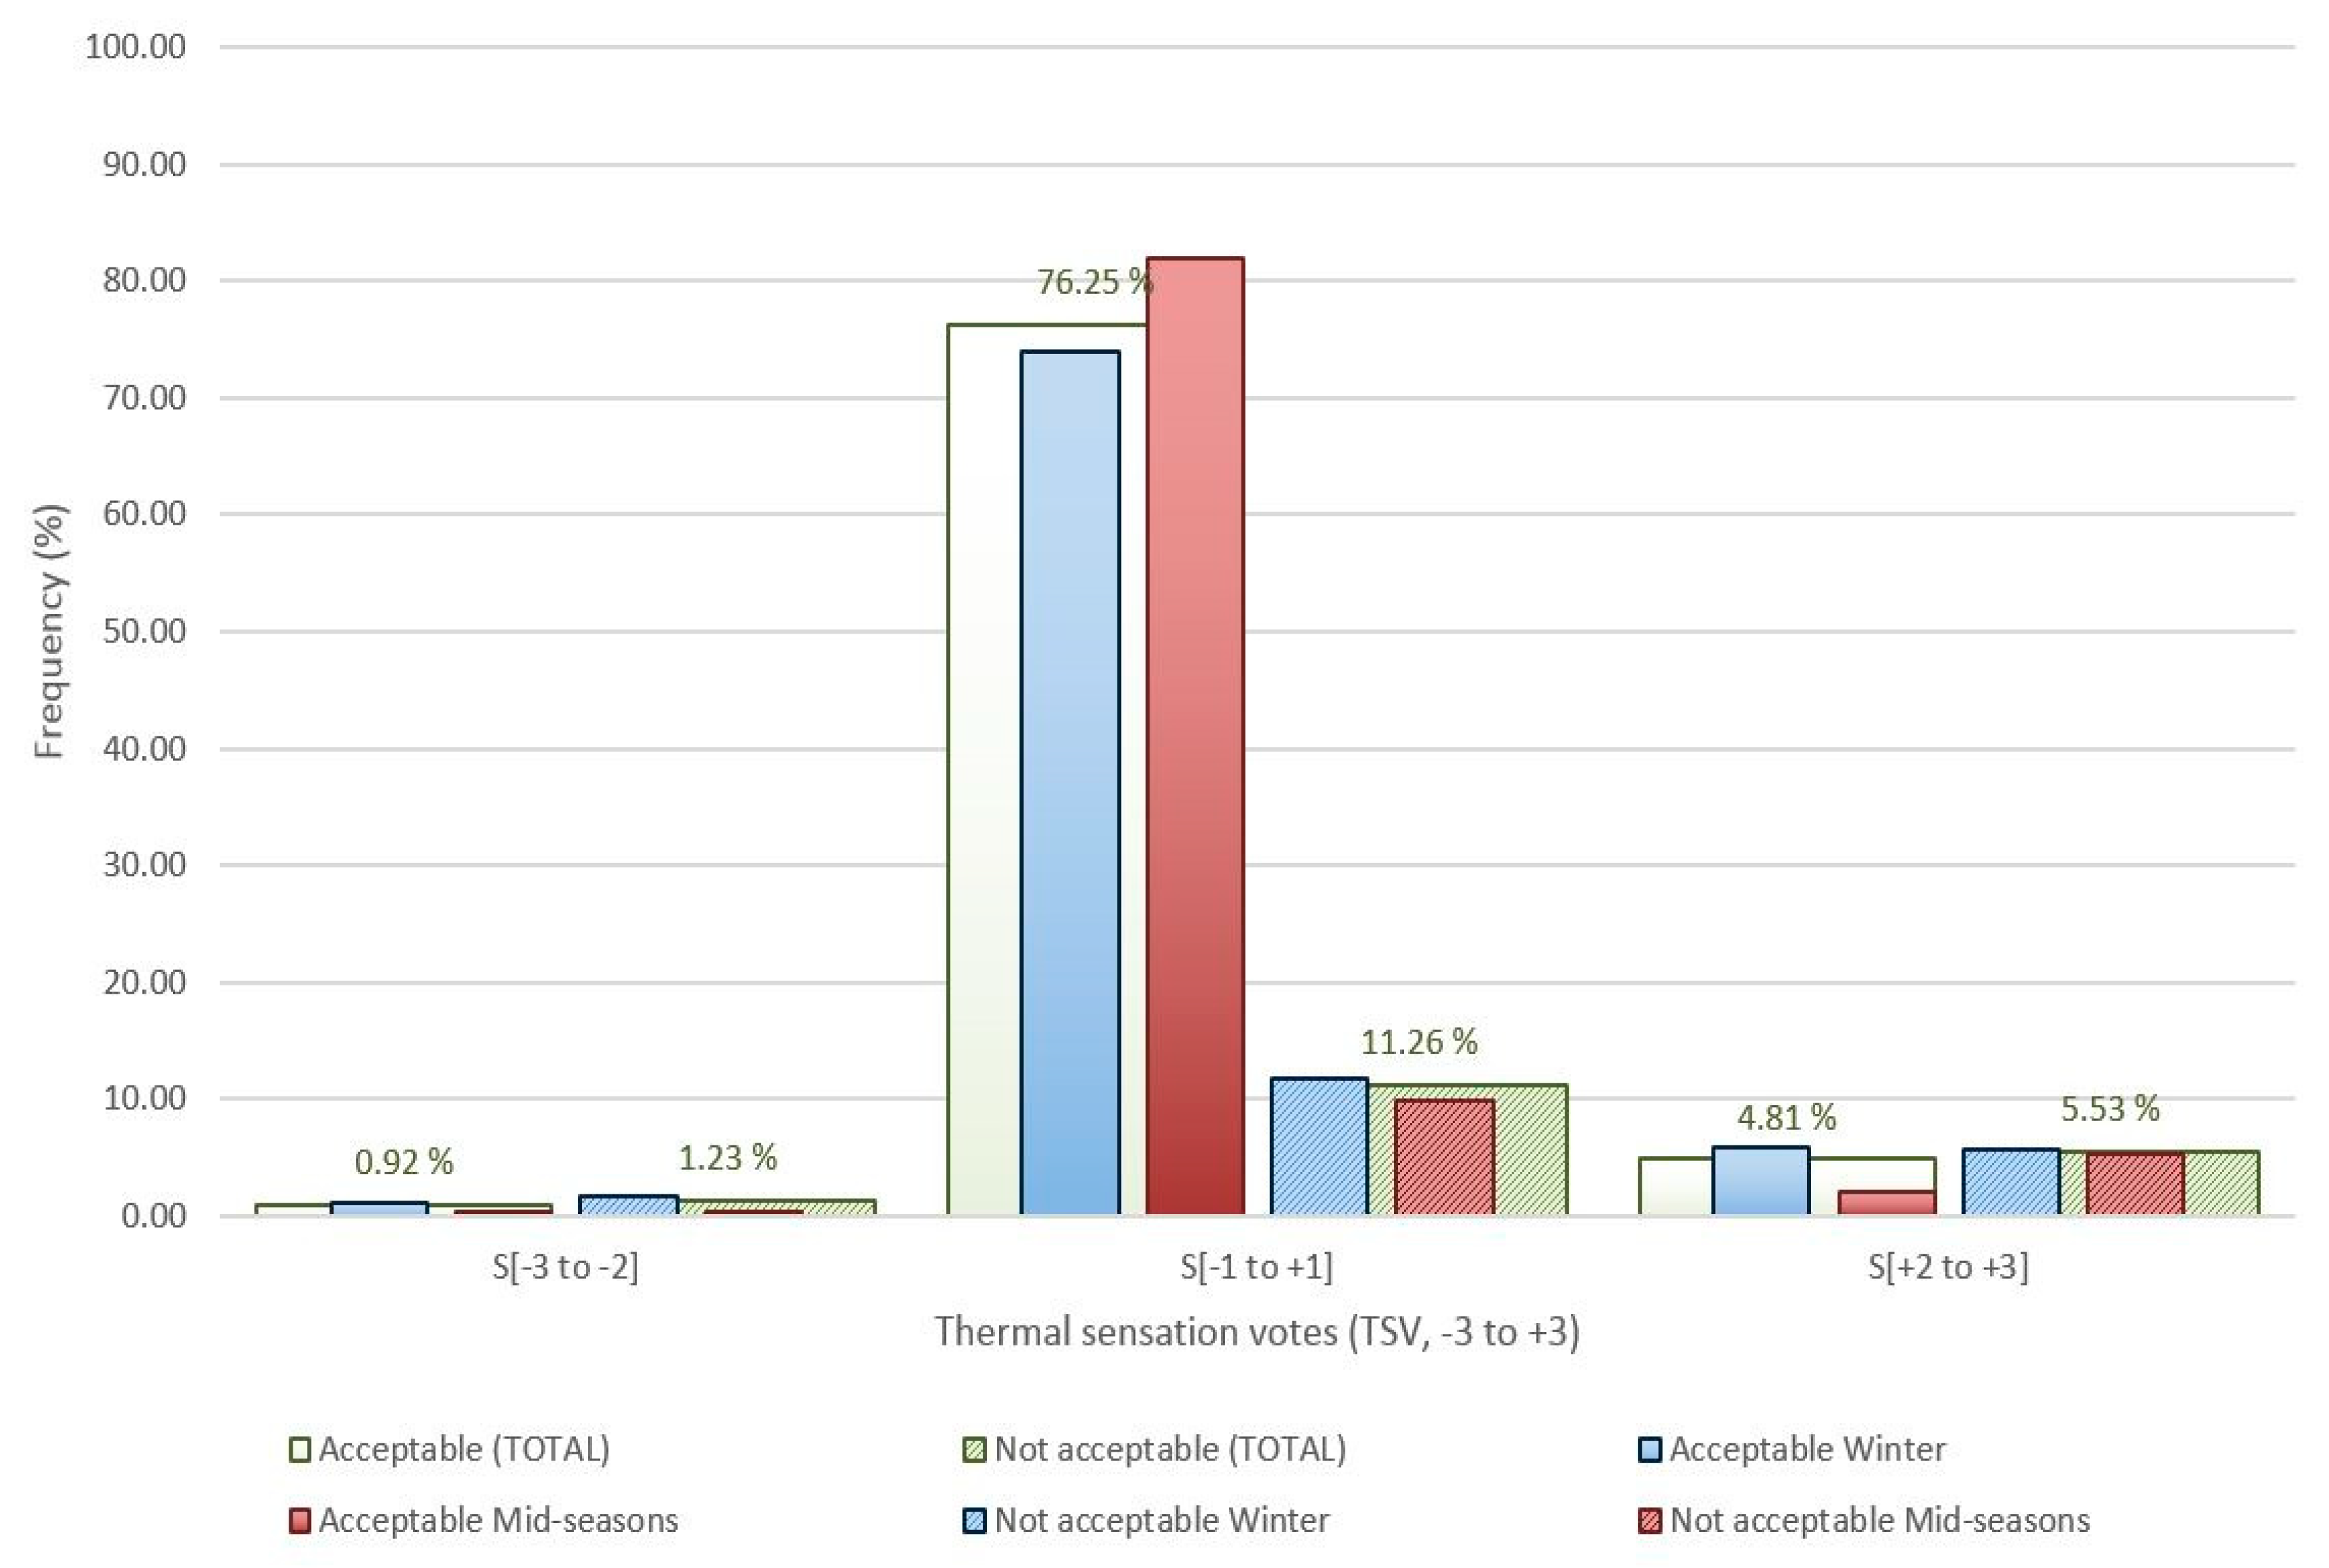
In contrast to what might appear from the reading of the temperatures found in the classrooms, the acceptance rate is significantly high (82%) with an apparently adequate perception of the characteristics of the environment by the users. If TSV is used as the initial indicator, most of the occupants—around 88% of TSV votes—also perceive the environment in the environment as thermally neutral (−1 to +1) in both winter and midseason. Most of these users define the environment as neutral (0) or with slight deviation—mainly reporting perception as slightly warm (+1). This last aspect may account for the answer of unacceptability within the +1/−1 band with occupants with little tolerance or, in many cases, with inadequate adaptation of their clothing to the environment or cross situations where the heating of the classroom may be connected with inadequate ventilation (Figure 6 and Figure 7).
Users prefer the feeling of a warm atmosphere, that is, although thermal neutrality is recognized in temperatures that are lower than usual and adapted to them, they would prefer an environment where they could perceive warmth, as they do not consider “neutrality” a thermal value in itself (Figure 8).
In winter, the classroom thermal sensation vote is mostly neutral positive—total mean slightly over 0 (with a tendency to perceive the environment as slightly warm—+0.32 on the Fanger scale)while the predicted mean vote (PMV) indicator would forecast this thermal environment as neutral ±0.00), as can be seen in Figure 9.
In midseasons, the mean thermal sensation vote is slightly warm (+0.38 on the Fanger scale), a value which contrasts with that of the PMV result, which qualifies this thermal environment as slightly cold—+0.24.
During the two seasons, classrooms are perceived by the users as slightly warmer spaces than those predicted by PMV(+ 0.34 against +0.07). In both cases, the standard deviation of TSV is high, about 0.90 points on the Fanger scale, as Zomorodian et al. [10] stated, and there is no clear correlation to the relative position in the classrooms, as obtained by Giuli et al. [16], considering that this study was performed over only four classrooms, with 9–11 year-old students and a metabolic rate value of 1.2 met. Therefore, the PMV indicator obtained slightly underestimated the students’ TSV. When studying the correlation between mean thermal sensation vote and the predicted mean vote calculated index, it is concluded that this is generally very low, with a value of +0.06 when calculated by individual, and low, with a value of +0.33 when grouped by classroom.
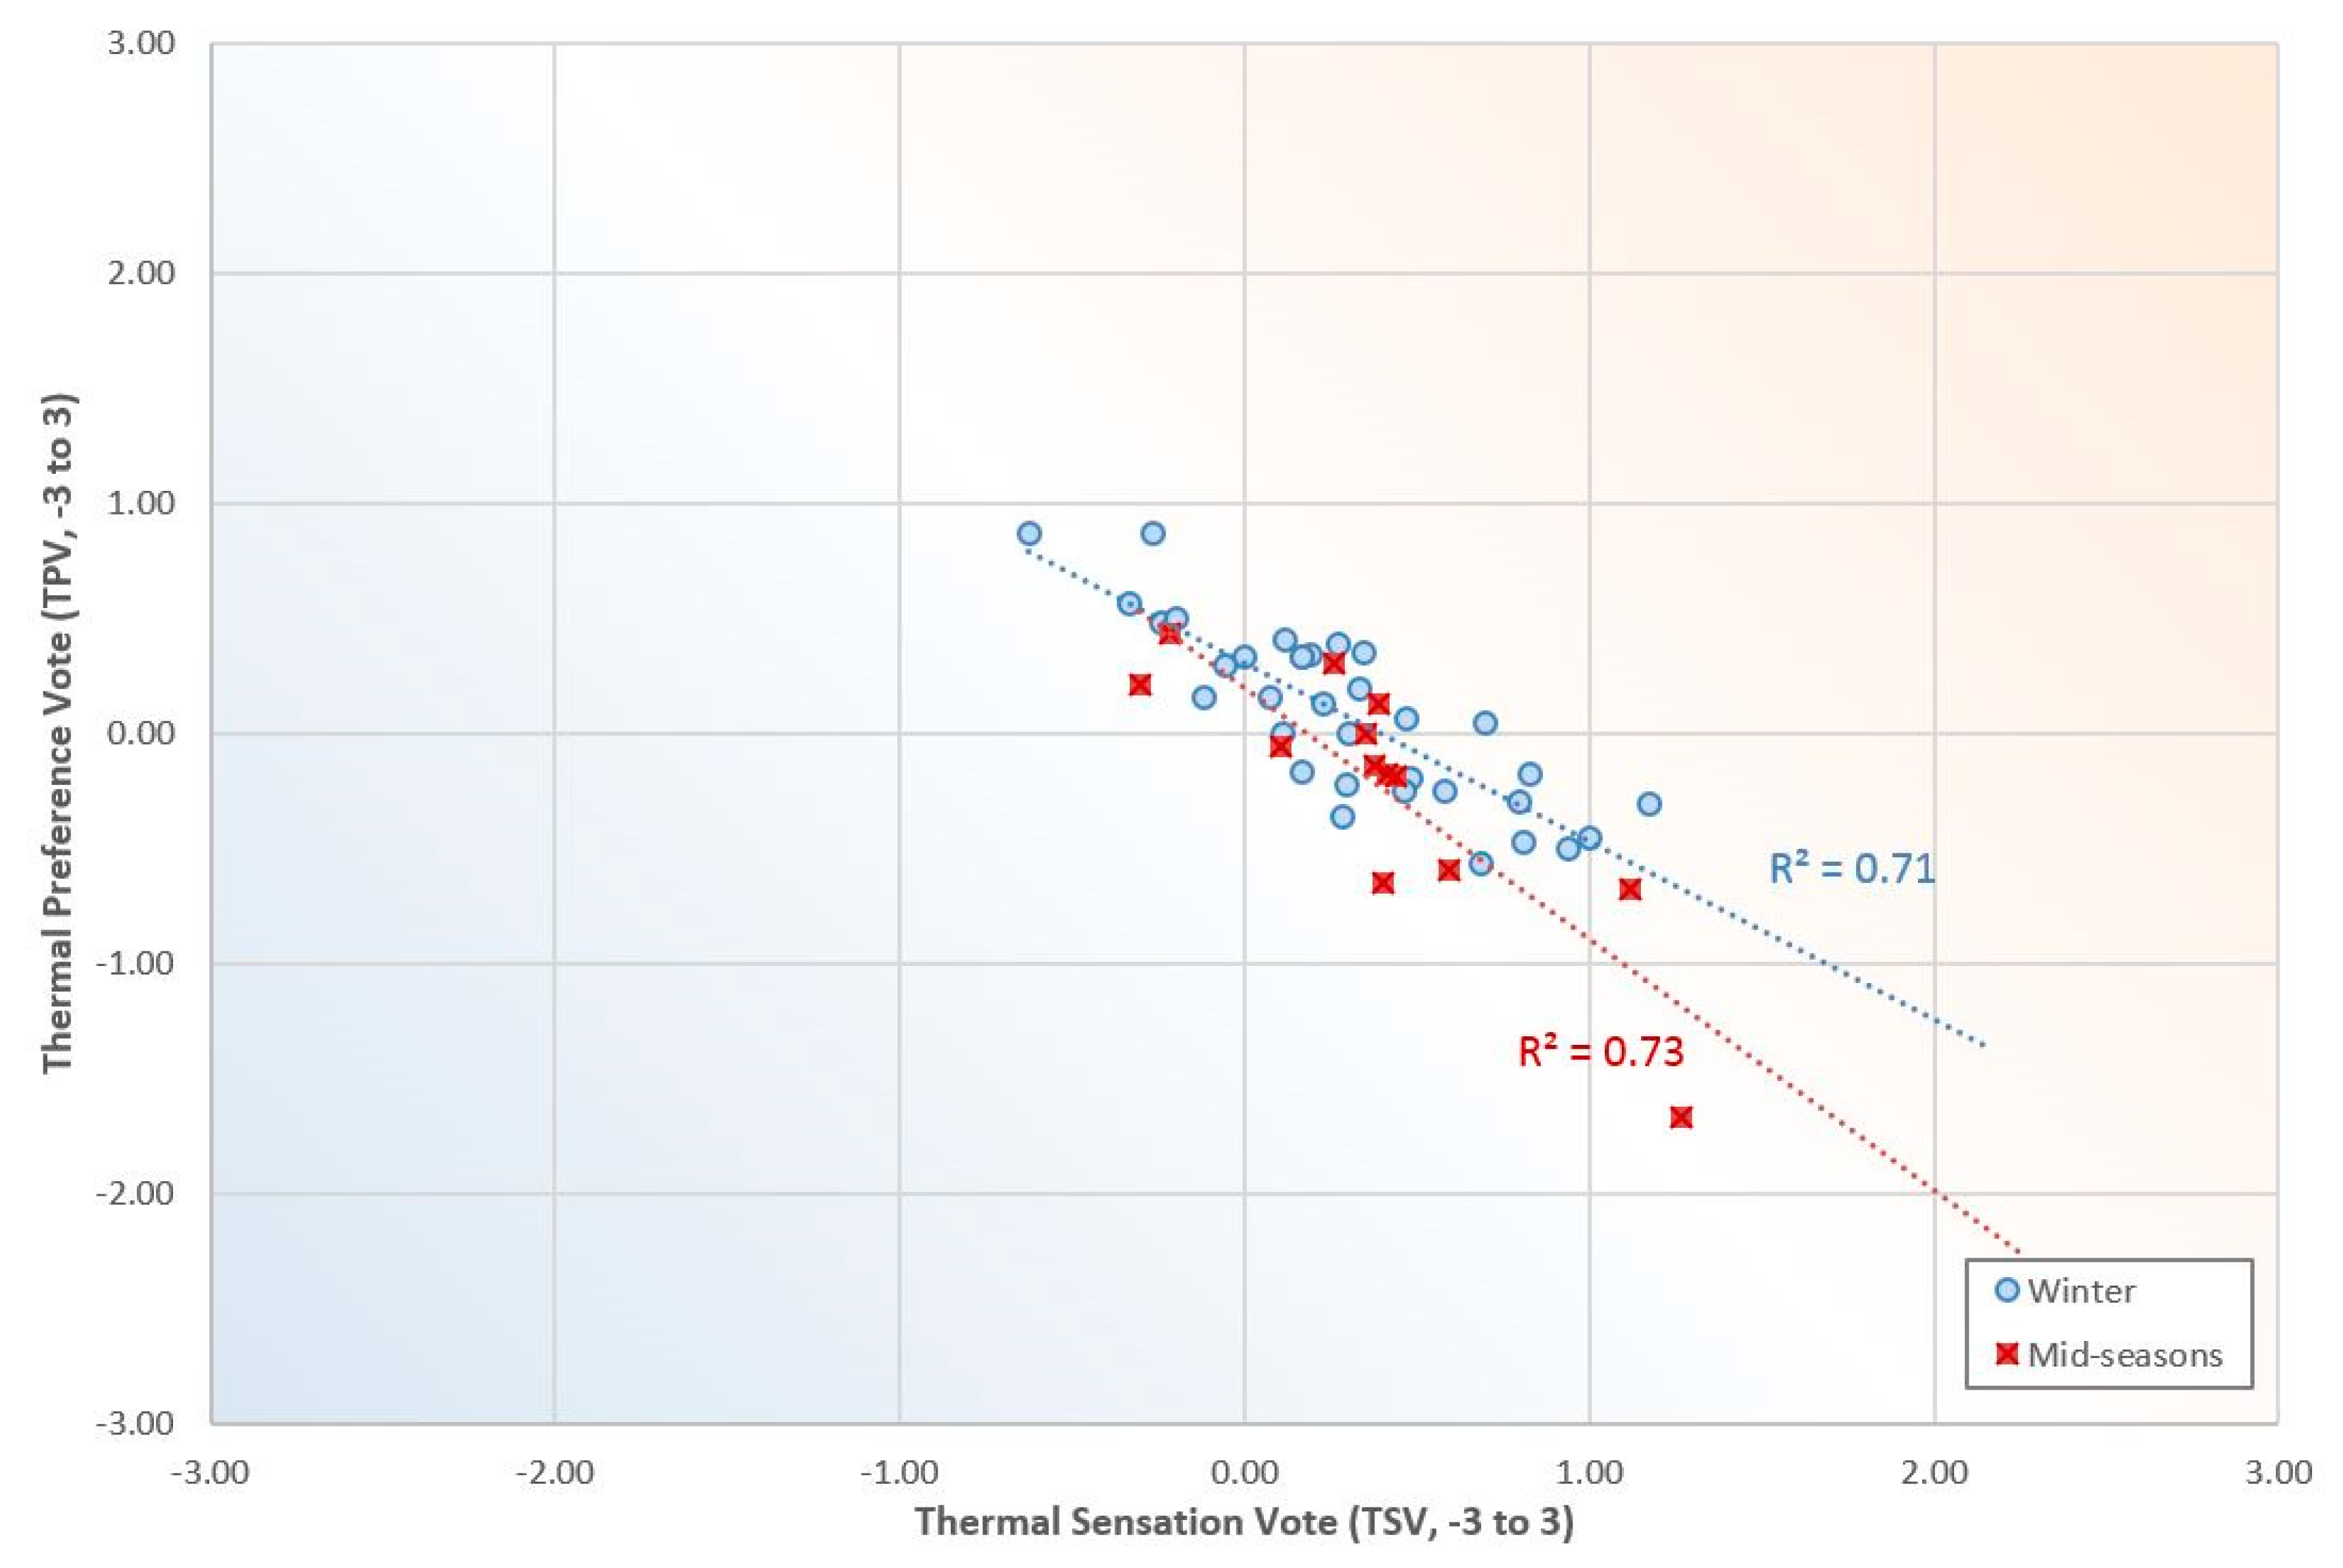
The occupants’ general thermal preference (TPV) as regards the possible modification of the thermal environment in response to their perceived thermal sensation depends on the seasonal climate. In the cases studied in winter, the occupants generally wish to maintain exactly the same thermal environment (+0.06 on the Fanger scale), despite perceiving it as slightly warm, although the deviation within each classroom is quite pronounced, 0.57 (Figure 10). When TPV is reversed to emulate thermal sensation vote, TSV (+0.06 is considered as −0.06), its comparison with PMV (with a value of ±0.00) presents a better fit than TSV (+0.32).
In midseasons, the occupants generally prefer a colder thermal environment, with a value of −0.20 on the Fanger scale, perceiving this as warm. The preference deviation remains high, 0.56. The reverse TPV also fits PMV better than TSV (with a reverse value of +0.20 in contrast to a PMV of +0.24 and a TSV of +0.38).
In both seasons, the mean thermal preference, TPV (with a reverse value of +0.01), has a better fit to the mean annual value of PMV (with a value of +0.07) than TSV (with a value of +0.34), as can be seen in Table 9. In addition, the correlation between thermal preference vote and predicted mean vote is very low, as in the case of TSV (a value of −0.08) when it is calculated by student and moderate (a value of −0.42) when it is grouped by classroom. In this study, the reverse value of TPV obtains a better fit to PMV than TSV.
These mean thermal preferences (TPV), analyzed by climate zone, do not correspond with the perceived thermal sensations, as research by Teli et al. [17,18] shows.
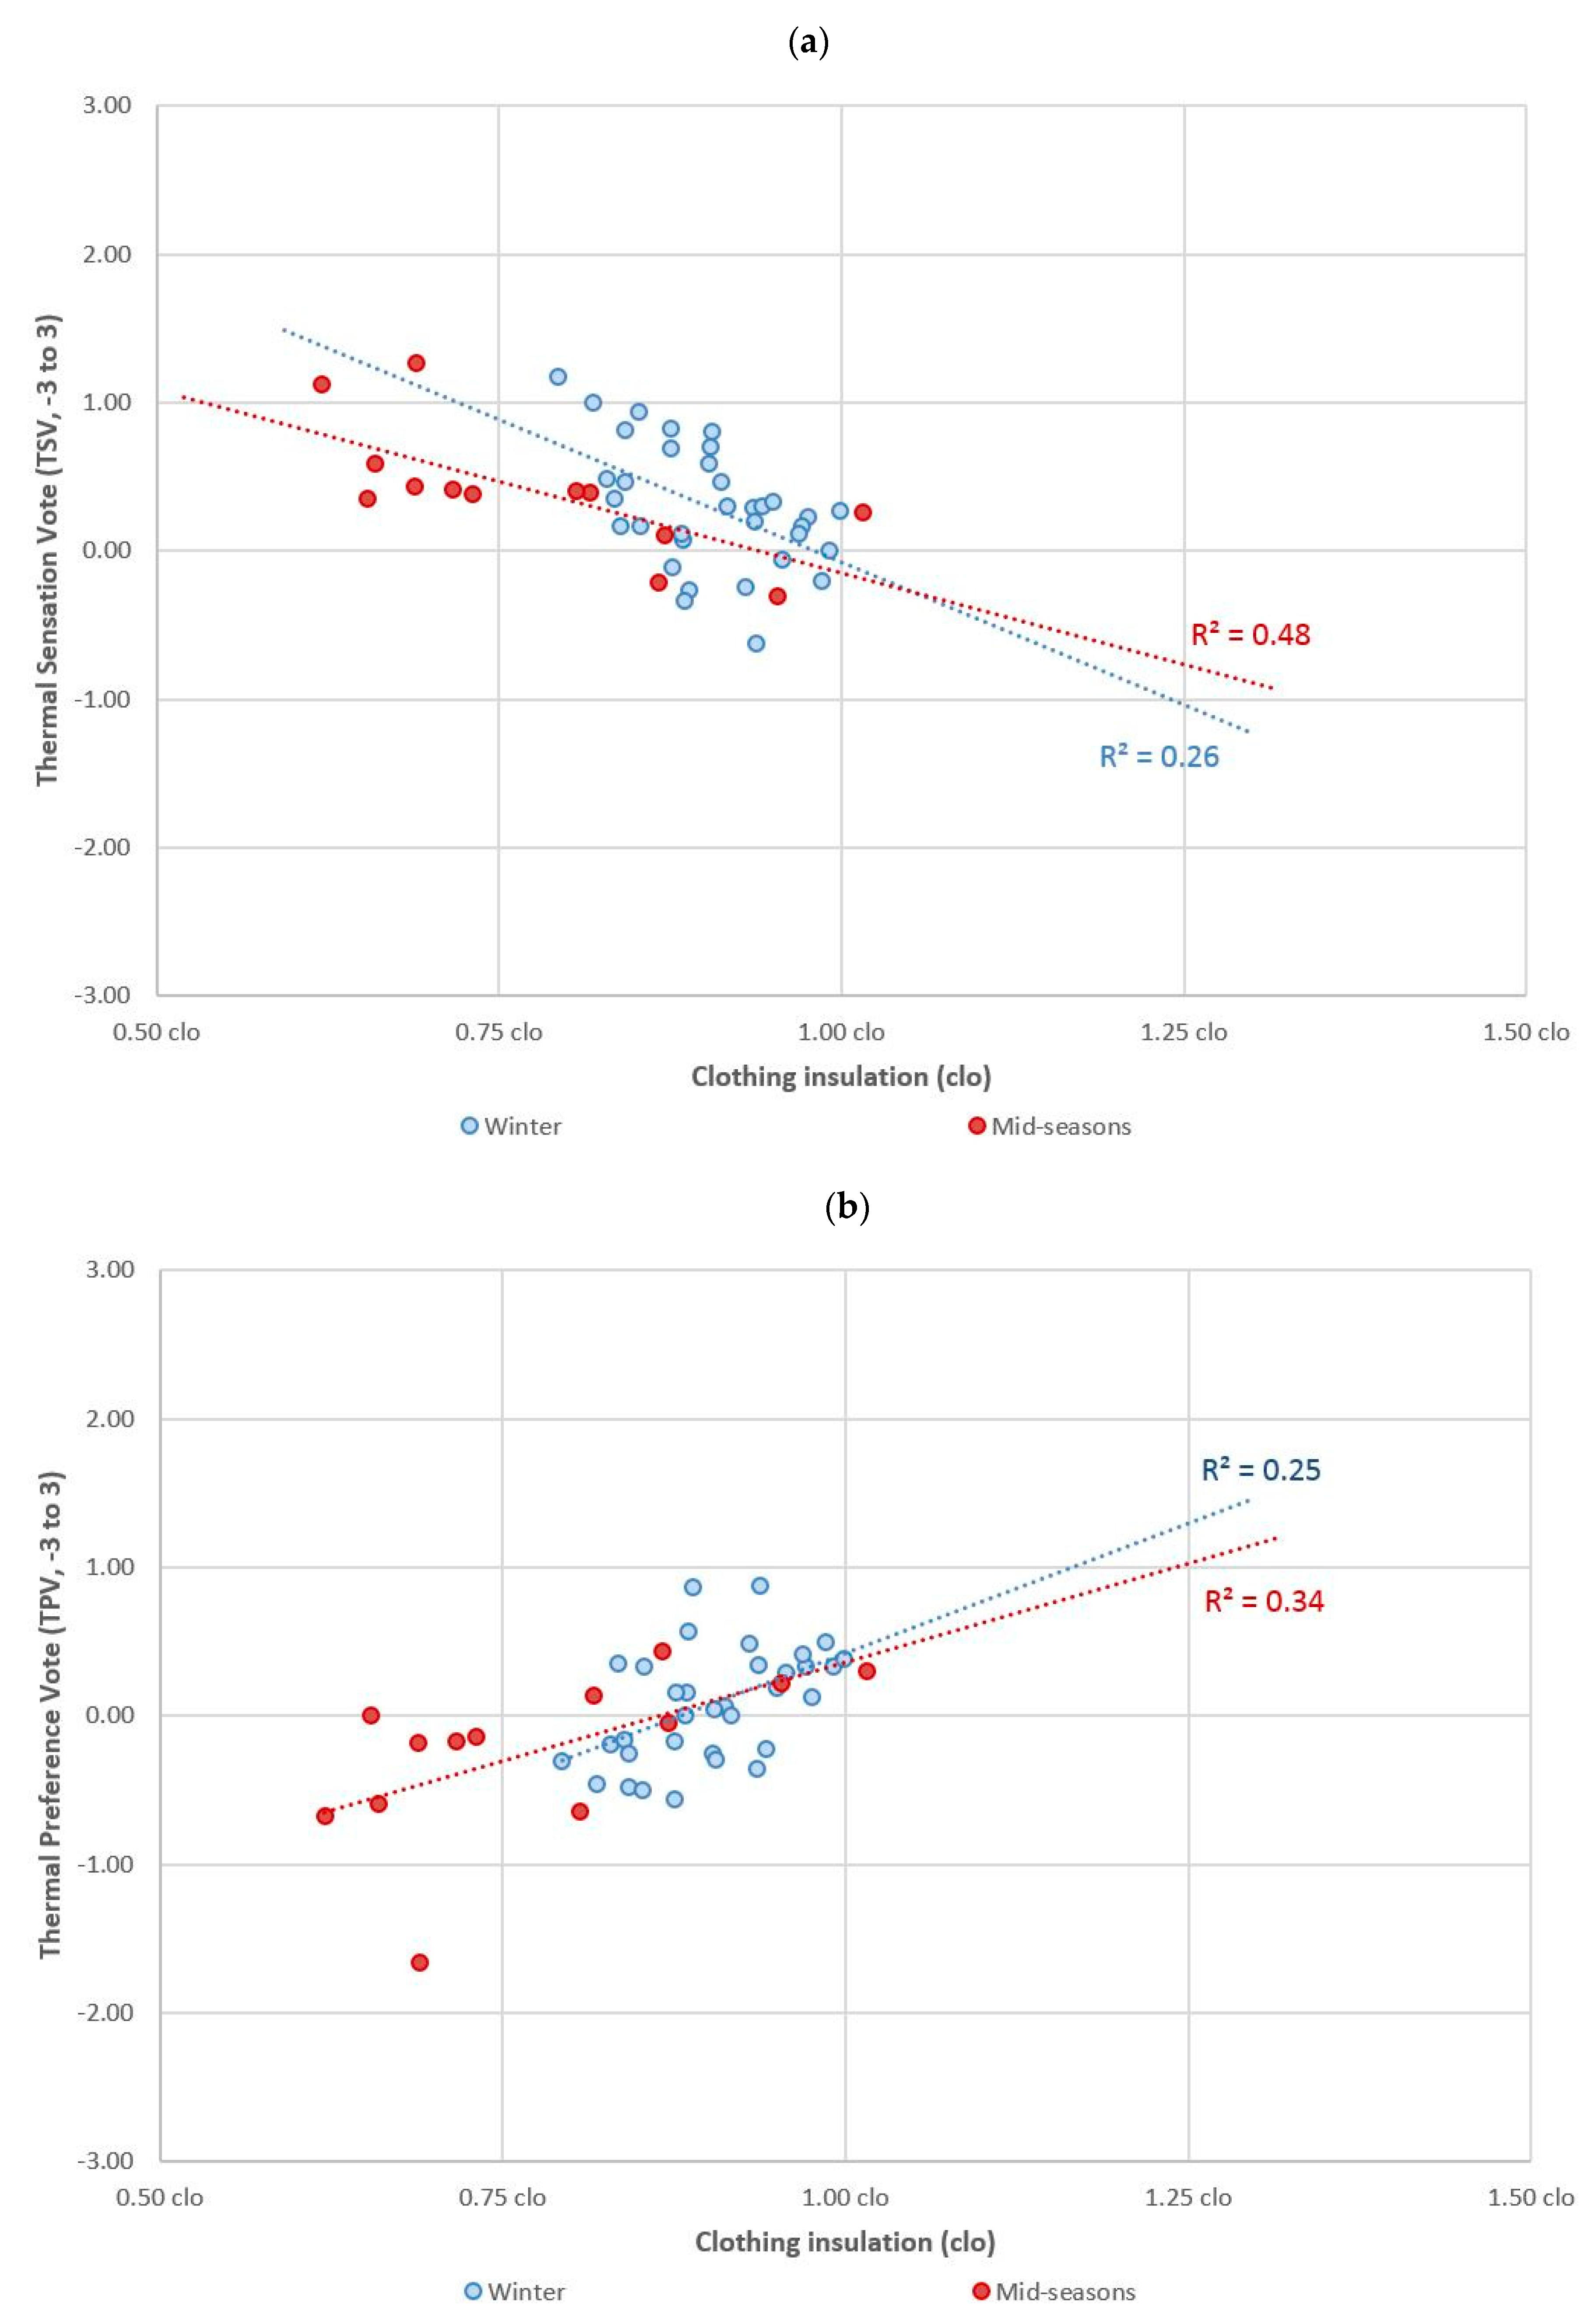
Thermal sensation vote can also be related to clothing insulation (Figure 11). It can be seen that in winter, people wearing less clothing feel colder, so that clothing insulation thermal perception can be interpreted as inverse matching.
In the case of intermediate seasons, the results are similar, although the range of responses to clo is much broader, as indicated in the previous section.
If comparing the thermal preference vote with clothing insulation, the results are similar; occupants with the lowest clo values demand a warmer environment and those with a higher value of clo demand a cooler environment, although the values are usually located in the range of −1 and 1, except in one of the classrooms studied. Occupants’ thermal comfort can thus be controlled with small modifications to the clothing insulation which is well adapted to the temperatures experienced.
When location is added as an analysis factor, it shows no relation with thermal sensation in southern Spain (0.007), nor does it affect the possible relationship between thermal sensation and PMV. Finally, the seasonal climate interacts slightly with the occupants’ thermal sensation (0.017), but barely affects the possible correlation between thermal sensation and PMV.
It is also worth noting that, according to the surveys, there is widespread stratification among more than 25% of occupants, both in winter and in midseasons, and this is not considered acceptable.
Actual perception and comparison with rational (RTC) and adaptive (ATC) comfort models
The mean thermal environment rejection percentage (PDacc) found in regional educational institutions is very low and homogeneous with a mean value of 0.81 on a scale from 0 (rejection) to 1 (acceptance) in winter conditions (PDacc,winter), with a deviation of ±0.39, and a mean value of 0.85 for midseasons (PDacc,midseason), with a deviation of ±0.36. When this indicator is compared with the predicted percentage of dissatisfied (PPD), obtained from PMV calculations, as well as the percentage of dissatisfied developed by d’Ambrosio et al. [23], based on the judgment of ±2 and ±3 TSV values through Equation (4) [23], it can be seen that most of the votes—grouped by classroom—are included in the ranges of Equation (4) (Figure 12). However, it should be noted that there is a slight deviation of the acceptance rate according to the thermal environment sensation, given that there is more acceptance for slightly warmer environments (R2 = 0.40).
In contrast, when comparing the mean thermal opinion to ASHRAE 55 ATC [24], the discrepancy between sensation and ATC prediction is even higher than RTC indicators. However, the comparison of Matias’ ATC indicator [46,47] with the mean thermal opinion shows that the results are perceived as similar by classroom, despite a slight discrepancy in feeling and similar ATC prediction (Figure 13).
Therefore, the ATC indicator developed by Matias et al. [47] and RTC indicators can be considered more reliable than the ASHRAE 55 ATC model [24] for Andalusian primary and secondary schools in winter and midseasons, although it can still be used as a comparison tool, especially in midseasons.
Table 10 shows the individual mean values of percentages of dissatisfied obtained, both from surveys (PDacc from the acceptability/unacceptability question, PDF from ±2 and ±3 TSV values, and PDacc,d’Ambrosio from TSV) and calculations (PPD from PMV and PDMATIAS and PDASHRAE from their respective ATC models). It can be seen that PPD (85%) and PDacc,d’Ambrosio obtain a good fit, especially with PDacc, but overestimate PDF, while PDMATIAS slightly overestimates the occupants’ acceptance, despite its better fit when grouped by classrooms. In the case of PDASHRAE, results are more than double those of PDacc and more than triple those of PDF, so it seems it is not suitable for this kind of regional climate conditions.
The findings suggest that, in general, Mediterranean people are better accustomed to spending time outside their homes and outside conventional ATC conditions, mainly due to the low thermal insulation level of traditional envelopes and the widespread lack of use of heating systems [60,61,62,63,64]. Thus, these conditions act as psychological and social factors that probably influence occupants’ thermal sensation, and further research on the topic is required
4. Conclusions
The occupants’ mean thermal sensation (TSV) in southern Spanish classrooms (Mediterranean climate) is of thermal neutrality during winter (+0.32 on the Fanger scale), and slight warmth (+0.38), during spring and autumn (midseasons). In both cases, there are major deviations in the opinions expressed by occupants (about 0.90 points on the Fanger scale, subjectivity of perception), and, in many cases, these are not equivalent to the thermal preference expressed (mean value of +0.06 in winter and −0.20 in spring and autumn), in line with the findings of Zomorodian et al. [10]. Widespread stratification was reported for a quarter of the occupants, both during winter and during midseasons, and this is not considered acceptable. In addition, the mean operative temperature in heated classrooms was 20.5 °C in winter, so the existing heating systems (hot water radiators) do not completely solve the classrooms’ thermal loads.
When these regional thermal perceptions are compared with the theoretical values obtained using the thermal comfort indicators, it can be seen that predicted mean vote (PMV) rational (RTC) indicator slightly underestimates TSV by 0.3 points on a thermal scale from −3 to +3, but this is not a clear relation. In addition, occupants’ mean thermal preference (TPV) showed a better fit to PMV than the thermal sensation, given the slight mean deviation of 0.35 between TSV and TSV. In contrast, the ASHRAE 55 adaptive (ATC) model can be considered less reliable than the PMV indicator for the study sample, since there is a high discrepancy between the mean discomfort rate and this adaptive prediction. However, Matias’ ATC indicator obtains a better approach than the ASHRAE ATC model to this mean discomfort rate in Mediterranean climate, although there continues to be a slight discrepancy between them. It is suspected that this difference between ATC models is influenced by psychological and social factors, since Mediterranean occupants are, in general, accustomed to being outside conventional ATC conditions in their dwellings. Further research on this topic is required.
Author Contributions
Conceptualization, M.Á.C.; methodology, M.Á.C., J.J.S. and S.D.-A.; investigation, M.Á.C., S.D.-A. and J.F.-A.; writing—original draft preparation, M.Á.C., S.D.-A., J.F.-A. and J.J.S.; writing—review and editing, M.Á.C., S.D.-A. and J.F.-A.; supervision, M.Á.C., S.D.-A., J.F.-A. and J.J.S.; funding acquisition, M.Á.C., S.D.-A. and J.J.S.
Funding
This research was partially funded by the government of Spain through the research project “Energy Rehabilitation of tertiary buildings in Mediterranean climate by optimizing Solar Protection Systems” (ref. BIA2014-53949-R). M.Á.C. wishes to acknowledge the financial support provided by the PIF Program of the Universidad de Sevilla (V Plan Propio).
Conflicts of Interest
The authors declare no conflict of interest.
References
- Houghten, F.C.; Yagloglou, C.P. Determination of comfort zone. ASHVE Trans. 1923, 29, 349–361. [Google Scholar]
- Gagge, A.P.; Burton, A.C.; Bazett, H.C. A Practical System of Units for The Description of the Heat Exchange of Man with His Environment. Science 1941, 94, 428–430. [Google Scholar] [CrossRef]
- Gagge, A.P.; Fobelets, A.P.; Berglund, L.G. A standard predictive index of human response to the thermal environment. ASHRAE Trans. 1986, 92, 709–731. [Google Scholar]
- Winslow, C.-E.A.; Herrington, L.P.; Gagge, A.P. Physiological Reactions of the Human Body to Varying Environmental Temperatures. Am. J. Physiol. Content 1937, 120, 1–22. [Google Scholar] [CrossRef]
- Fanger, P. Thermal Comfort: Analysis and Applications in Environmental Engineering; Copenhagen Danish Technical Press: Copenhagen, Denmark, 1970. [Google Scholar]
- Lane, W.R. Education, Children and Comfort; University of Iowa: Ames, IA, USA, 1965. [Google Scholar]
- Auliciems, A. Thermal sensations of secondary school children in summer time. J. Hyg. 1973, 71, 453–458. [Google Scholar] [CrossRef] [PubMed]
- Humphreys, M. A study of the thermal comfort of primary school children in summer. Build. Environ. 1977, 12, 231–239. [Google Scholar] [CrossRef]
- Pepler, R.D. The thermal comfort of students in climate-controlled and non–climate-controlled schools. ASHRAE Trans. 1972, 78, 97–109. [Google Scholar]
- Zomorodian, Z.S.; Tahsildoost, M.; Hafezi, M. Thermal comfort in educational buildings: A review article Renew. Sust. Energy Rev. 2016, 59, 895–906. [Google Scholar] [CrossRef]
- CEN (2007) Indoor Environmental Input Parameters for Design and Assessment of Energy Performance of Buildings Addressing Indoor Air Quality, Thermal Environment, Lighting and Acoustics; CEN Standard EN 15251:2007; Comité Européen de Normalisation: Brussels, Belgium, 2007.
- Ter Mors, S.; Hensen, J.L.; Loomans, M.G.; Boerstra, A.C. Adaptive thermal comfort in primary school classrooms: Creating and validating PMV-based comfort charts. Build. Environ. 2011, 46, 2454–2461. [Google Scholar] [CrossRef] [Green Version]
- Corgnati, S.P.; Ansaldi, R.; Filippi, M. Thermal comfort in Italian classrooms under free running conditions during mid seasons: Assessment through objective and subjective approaches. Build. Environ. 2009, 44, 785–792. [Google Scholar] [CrossRef]
- Fabbri, K. Thermal comfort evaluation in kindergarten: PMV and PPD measurement through datalogger and questionnaire. Build. Environ. 2013, 68, 202–214. [Google Scholar] [CrossRef]
- De Giuli, V.; Da Pos, O.; De Carli, M. Indoor environmental quality and pupil perception in Italian primary schools. Build. Environ. 2012, 56, 335–345. [Google Scholar] [CrossRef]
- De Giuli, V.; Zecchin, R.; Corain, L.; Salmaso, L. Measured and perceived environmental comfort: Field monitoring in an Italian school. Appl. Ergon. 2014, 45, 1035–1047. [Google Scholar] [CrossRef]
- Teli, D.; Jentsch, M.F.; James, P.A. Naturally ventilated classrooms: An assessment of existing comfort models for predicting the thermal sensation and preference of primary school children. Energy Build. 2012, 53, 166–182. [Google Scholar] [CrossRef]
- Teli, D.; James, P.A.B.; Jentsch, M.F. Thermal comfort in naturally ventilated primary school classrooms. Build. Res. Inf. 2013, 41, 301–316. [Google Scholar] [CrossRef]
- Hyunjun, Y.; Insick, N.; Jinman, K.; Jinho, Y.; Kyoungho, L.; Jongryeul, S. A field study of thermal comfort for kindergarten children in Korea: An assessment of existing models and preferences of children. Build Environ. 2014, 75, 182–189. [Google Scholar]
- Fanger, P.O.; Toftum, J. Extension of the PMV model to non-air-conditioned buildings in warm climates. Energy Build. 2002, 34, 533–536. [Google Scholar] [CrossRef]
- D’Ambrosio, F.R.; Olesen, B.W.; Palella, B.I.; Povl, O. Fanger’s impact ten years later. Energy Build. 2017, 152, 243–249. [Google Scholar] [CrossRef]
- Alfano, F.R.D.; Palella, B.I.; Riccio, G.; Toftum, J. Fifty years of Fanger’s equation: Is there anything to discover yet? Int. J. Ind. Ergon. 2018, 66, 157–160. [Google Scholar] [CrossRef]
- D’Ambrosio Alfano, F.R.; Ianniello, E.; Palella, B.I. PMV-PPD and acceptability in naturally ventilated schools. Build Environ. 2013, 67, 129–137. [Google Scholar] [CrossRef]
- ASHRAE. Thermal Environmental Conditions for Human Occupancy; ASHRAE Standard 55-2017; American Society of Heating, Refrigerating and Air Conditioning Engineers: Atlanta, GA, USA, 2017. [Google Scholar]
- Ministerio de Fomento del Gobierno de España. Código Técnico de la Edificación. 2006. Available online: http://www.codigotecnico.org (accessed on 20 August 2015.).
- Consejería de Innovación, Ciencia y Empresa de la Junta de Andalucía. Orden VIV/1744/2008 de 9 de junio, por la que se aprueba la “Zonificación Climática de Andalucía por Municipios para su uso en el Código Técnico de la Edificación en su sección de Ahorro de Energía apartado de Limitación de Demanda Energética (CTE-HE1)”. Boletín Oficial de la Junta de Andalucía 2008, 254, 4216. [Google Scholar]
- De La Flor, F.J.S.; Domínguez, S.Á.; Félix, J.L.M.; Falcón, R.G. Climatic zoning and its application to Spanish building energy performance regulations. Energy Build. 2008, 40, 1984–1990. [Google Scholar] [CrossRef]
- Kottek, M.; Grieser, J.; Beck, C.; Rudolf, B.; Rubel, F. World Map of the Köppen-Geiger climate classification updated. Meteorol. Z. 2006, 15, 259–263. [Google Scholar] [CrossRef]
- Junta de Andalucía. Orden de 24 de enero de 2003 de la Consejería de Educación y Ciencia de la Junta de Andalucía por la que se aprueban las “Normas de diseño y constructivas para los edificios de uso docente”. Boletín Oficial de la Junta de Andalucía 2003, 43, 4669. [Google Scholar]
- Gobierno de España. Resolución 18258/2009, de 16 de noviembre, por la que se aprueba el “Convenio para la aplicación del proyecto Escuela 2.0 con la Consejería de Educación de la Comunidad Autónoma de Andalucía”, de 2 de noviembre. Boletín Oficial del Estado 2009, 276, 97448. [Google Scholar]
- Gobierno de España. Real Decreto 1826/2009, de 11 de diciembre, por el que se modifica el Reglamento de Instalaciones Térmicas en los Edificios, aprobado por el Real Decreto 1027/2007. Boletín Oficial del Estado 2009, 298, 104924–104927. [Google Scholar]
- ISO. Ergonomics of the Thermal Environment—Vocabulary and Symbols; ISO 13731:2001; International Standardization Organization: Geneva, Switzerland, 2001. [Google Scholar]
- Campano, M.A.; Sendra, J.J.; Domínguez, S.; Domínguez-Amarillo, S. Analysis of Thermal Emissions from Radiators in Classrooms in Mediterranean Climates. Procedia Eng. 2011, 21, 106–113. [Google Scholar] [CrossRef] [Green Version]
- ISO. Ergonomics of the Thermal Environment—Instruments for Measuring Physical Quantities; ISO 7726:1998; International Standardization Organization: Geneva, Switzerland, 1998. [Google Scholar]
- American Society of Heating, Refrigerating and Air Conditioning Engineers, 2017 ASHRAE Handbook-Fundamentals; ASHRAE Handbook Committee: Atlanta, GA, USA, 2017.
- ISO. Ergonomics of the Physical Environment—Subjective Judgement Scales for Assessing Physical Environments; ISO 10551:1995; International Organization for Standardization: Geneva, Switzerland, 1995. [Google Scholar]
- ISO. Ergonomics of Thermal Environments—Strategy of Evaluation of the Risk for the Prevention of Constraints or Discomfort under Thermal Working Conditions; ISO 15265:2004; International Organization for Standardization: Geneva, Switzerland, 2004. [Google Scholar]
- ISO. Ergonomics of the Thermal Environment e Analytical Determination and Interpretation of Heat Stress Using Calculation of the Predicted Heat Strain; ISO 7933:2004; International Organization for Standardization: Geneva, Switzerland, 2004. [Google Scholar]
- ISO. Ergonomics of the Thermal Environment—Analytical Determination and Interpretation of Thermal Comfort Using Calculation of the PMV and PPD Indices and Local Thermal Comfort Criteria; ISO 7730:2005; International Organization for Standardization: Geneva, Switzerland, 2005. [Google Scholar]
- ISO. Ergonomics of the Thermal Environment—Determination and Interpretation of Cold Stress When Using Required Clothing Insulation (IREQ) and Local Cooling Effects; ISO 11079:2009; International Organization for Standardization: Geneva, Switzerland, 2009. [Google Scholar]
- Havenith, G.; Holmér, I.; Parsons, K. Personals factors in thermal comfort assessment: Clothing properties and metabolic heat reduction. Energy Build. 2002, 34, 581–591. [Google Scholar] [CrossRef]
- ISO. Ergonomics of the Thermal Environment e Determination of Metabolic Rate; ISO 8996:2004; International Organization for Standardization: Geneva, Switzerland, 2004. [Google Scholar]
- ISO. Ergonomics of the Thermal Environment e Estimation of the Thermal Insulation and Evaporative Resistance of a Clothing Ensemble; ISO 9920:2007; International Organization for Standardization: Geneva, Switzerland, 2007. [Google Scholar]
- D’Ambrosio Alfano, F.R.; Palella, B.I.; Riccio, G.; Malchaire, J. On the Effect of Thermophysical Properties of Clothing on the Heat Strain Predicted by PHS Model. Ann. Occup. Hyg. 2016, 60, 231–251. [Google Scholar] [CrossRef]
- D’Ambrosio Alfano, F.R.; Palella, B.I.; Riccio, G. Notes on the implementation of the IREQ model for the assessment of extreme cold environments. Ergonomics 2013, 56, 707–724. [Google Scholar] [CrossRef] [Green Version]
- Guedes, M.C.; Matias, L.; Santos, C.P. Thermal comfort criteria and building design: Field work in Portugal. Renew. Energy 2009, 34, 2357–2361. [Google Scholar] [CrossRef]
- Matias, L. Desenvolvimento de um Modelo Adaptativo Para Definição das Condições de Conforto Térmico em Portugal. Ph.D. Thesis, Universidade técnica de Lisboa, Lisboa, Portugal, 2010. [Google Scholar]
- McCartney, K.J.; Nicol, J.F. Developing an adaptive control algorithm for Europe. Energy Build. 2002, 34, 623–635. [Google Scholar] [CrossRef]
- Nicol, J.F.; Humphreys, M.A. Derivation of the adaptive equations for thermal comfort in free-running buildings in European standard EN15251. Build Environ. 2010, 45, 11–17. [Google Scholar] [CrossRef]
- Campano, M.A. Confort Térmico y Eficiencia Energética en Espacios con Alta Carga Interna Climatizados: Aplicación a Espacios Docentes no Universitarios en Andalucía. Ph.D. Thesis, Universidad de Sevilla, Sevilla, Spain, 2015. [Google Scholar]
- CEN. Thermal Performance of Buildings. Qualitative Detection of Thermal Irregularities in Building Envelopes. Infrared Method; Standard EN 13187:1998; Comité Européen de Normalisation: Brussels, Belgium, 1998. [Google Scholar]
- Humphreys, M. Classroom temperature, clothing and thermal comfort—A study of secondary school children in summertime. Build. Serv. Eng. 1973, 41, 191–202. [Google Scholar]
- De Dear, R.; Kim, J.; Candido, C.; Deuble, M. Adaptive thermal comfort in Australian school classrooms. Build. Res. Inf. 2015, 43, 383–398. [Google Scholar] [CrossRef]
- Haddad, S.; King, S.; Osmond, P. Enhancing thermal comfort in school buildings. In Proceedings of the 10th International Conference on Healthy Buildings, Brisbane, Australia, 8–12 July 2012. [Google Scholar]
- Teli, D.; Jentsch, M.F.; James, P.A. The role of a building’s thermal properties on pupils’ thermal comfort in junior school classrooms as determined in field studies. Build. Environ. 2014, 82, 640–654. [Google Scholar] [CrossRef]
- Schweiker, M.; Fuchs, X.; Becker, S.; Shukuya, M.; Dovjak, M.; Hawighorst, M.; Kolarik, J. Challenging the assumptions for thermal sensation scales. Build. Res. Inf. 2017, 45, 572–589. [Google Scholar] [CrossRef]
- Yau, Y.H.; Chew, B.T. A review on predicted mean vote and adaptive thermal comfort models. Build. Serv. Eng. Res. Technol. 2014, 35, 23–35. [Google Scholar] [CrossRef]
- Humphreys, M.A.; Nicol, J.F. The validity of ISO-PMV for predicting comfort votes in every-day thermal environments. Energy Build. 2002, 34, 667–684. [Google Scholar] [CrossRef]
- Jones, B.W. Capabilities and limitations of thermal models for use in thermal comfort standards. Energy Build. 2002, 34, 653–659. [Google Scholar] [CrossRef]
- Domínguez-Amarillo, S. Building Envelopes and Social Housing in Southern Europe Energy Assessment of the Residential Social Stock of the City of Seville Under the Climate Change Scenario. Ph.D. Thesis, Universidad de Sevilla, Sevilla, Spain, 2016. [Google Scholar]
- Fernández-Aguera, J.; Sendra, J.J.; Suárez, R. Correlation between airtightness and IAQ in subsidized Dwellings units in Spain. In Proceedings of the 36th AIVC 5th TightVent & 3rd Venticool Conference, Madrid, Spain, 23–24 September 2015. [Google Scholar]
- Sendra, J.J.; Domínguez-Amarillo, S.; Bustamante, P.; León, A.L. Energy intervention in the residential sector in the south of Spain: Current challenges. Inf. Constr. 2013, 65, 457–464. [Google Scholar] [CrossRef]
- Dominguez-Amarillo, S.; Fernández-Agüera, J.; Sendra, J.J.; Arroyo, J. Methodology for the analysis of energy and water performance in social housing: Its application in the case of Malaga, Proceedings of Obsolescence and Renovation. In Proceedings of the 20th Century Housing in the New Millenium, Seville, Spain, 14–15 December 2015. [Google Scholar]
- Domínguez-Amarillo, S.; Fernández-Agüera, J.; Sendra, J.J.; Roaf, S. Rethinking User Behaviour Comfort Patterns in the South of Spain—What Users Really Do. Sustainability 2018, 10, 4448. [Google Scholar] [CrossRef]
Figure 1.
Multipurpose classroom following design standards for educational institutions.

Figure 2.
Array of measurement points in a classroom under study.

Figure 3.
Thermal bridges through slabs and pillars in one of the centers under study.

Figure 4.
Clothing insulation distribution of occupants (differentiated by season).

Figure 5.
Clothing insulation in relation to operative temperature with metabolic rate value of 1.30 met: (a) individual; (b) classroom aggregated.
Figure 5.
Clothing insulation in relation to operative temperature with metabolic rate value of 1.30 met: (a) individual; (b) classroom aggregated.

Figure 6.
Sample of individual thermal sensation vote distribution (differentiated by season and global).
Figure 6.
Sample of individual thermal sensation vote distribution (differentiated by season and global).

Figure 7.
Sample of individual thermal sensation vote bands aggregation including acceptability criterion from surveys (differentiated by season and global).
Figure 7.
Sample of individual thermal sensation vote bands aggregation including acceptability criterion from surveys (differentiated by season and global).

Figure 8.
Thermal classroom-aggregated votes related to temperatures: (a) operative temperature [To °C], (b) indoor air temperature [Ta °C].
Figure 8.
Thermal classroom-aggregated votes related to temperatures: (a) operative temperature [To °C], (b) indoor air temperature [Ta °C].

Figure 9.
Thermal sensation vote vs, PMV in classrooms by seasons.

Figure 10.
Thermal preference vote vs thermal sensation vote by seasons.

Figure 11.
Clothing insulation vs thermal sensation vote (a) and thermal preference vote (b) in classrooms by season.
Figure 11.
Clothing insulation vs thermal sensation vote (a) and thermal preference vote (b) in classrooms by season.

Figure 12.
Comparison of the percentage of people who voted acceptable/unacceptable according to surveys (PDacc) with that predicted by Fanger (PPD from PMV) and that predicted by TSV according to d’Ambrosio et al. [23] (PDacc,d’Ambrosio).
Figure 12.
Comparison of the percentage of people who voted acceptable/unacceptable according to surveys (PDacc) with that predicted by Fanger (PPD from PMV) and that predicted by TSV according to d’Ambrosio et al. [23] (PDacc,d’Ambrosio).

Figure 13.
Adaptive thermal comfort in Andalusian classrooms according to climate zone, classroom aggregated.
Figure 13.
Adaptive thermal comfort in Andalusian classrooms according to climate zone, classroom aggregated.


Table 1.
Classroom sample from each of the subclimate zones.
| Köppen Climate Zone | Climate Subzone | Construction Year | Municipality (Province) | Educational Institution Type | Classes under Study | Number of Surveys | Seasons | |
|---|---|---|---|---|---|---|---|---|
| (Spanish CTE) | ||||||||
| Winter | Summer | |||||||
| BSk | A | 4 | 2008 | Almería (Almería) | Primary School | 4 | 89 | Midseasons |
| 2009 | Almería (Almería) | Primary School | 4 | 0 | Midseasons | |||
| Csa | B | 4 | 2010 | Aljaraque (Huelva) | Secondary school | 10 | 185 | Winter and midseasons |
| 1987 | Dos Hermanas (Seville) | Secondary school | 5 | 228 | Winter and midseasons | |||
| 2010 | Dos Hermanas (Seville) | Primary School | 6 | 40 | Winter | |||
| Csa | C | 3 | 2009 | Churriana de la Vega (Granada) | Secondary school | 7 | 304 | Winter and midseasons |
| 2010 | Cullar Vega (Granada) | Primary School | 3 | 0 | Winter | |||
| 1973 | Guadix (Granada) | Secondary school | 3 | 58 | Winter | |||
| Csa | C | 4 | 2008 | Jaén (Jaén) | Primary School | 4 | 73 | Winter |
| Total | 46 | 977 | ||||||
Table 2.
Classroom wall composition sample (with and without CTE standards).
| Composition | Transmittance U (W/(m2K)) | Thickness (cm) | |
|---|---|---|---|
| Facade (predating CTE) | Cement mortar (1.5 cm); 6 inch perforated metric brick (11.5 cm); air chamber without ventilation (5 cm); simple hollow brick wall (5 cm); plaster cladding (1.5 cm). | 1.42 | 24.5 |
| Facade (with CTE) | Cement mortar (1.5 cm); 6 inch perforated metric brick (11.5 cm); air chamber without ventilation (3 cm); Mineral wood (4 cm); 2× laminated plasterboard (1 cm). | 0.50 | 22.0 |
Table 3.
Characteristics of sensors used.
| Parameter | Units | Sensor | Uncertainty |
|---|---|---|---|
| Air temperature (Ta) | °C | Testo 0635.1535 (PT100) | ±0.3 °C |
| Surface temperature (ts) | °C | Testo 0602.0393 (Thermocouple type K) | ±0.3 °C |
| Mean radiant temperature (tr) | °C | Testo 0602.0743 (Globe probe with Thermocouple type K) | ±0.3 °C |
| Globe temperature (tg) | °C | Testo 0602 0743 | ±1.5 °C |
| Relative humidity (RH) | % | Testo 0635.1535 (Capacitive) | ±2% |
| Air velocity (Va) | m/s | Testo 0635.1535 (Hot wire) | ±0.03 m/s |
| Data acquisition system | - | Data Logger Testo 435-2 | - |
| Thermography | °C | FLIR thermacam b4 | ±2.0 °C |
Table 4.
Measured values in a classroom of a secondary school in Seville in winter conditions.
| Parameter Type A | 1-1 | 1-2 | 2-1 | 2-2 | 3-1 | 3-2 | 4-1 | 4-2 | 5-1 | 5-2 | 6-1 | 6-2 | Out |
| Air temperature (°C) | 19.9 | 20.0 | 20.0 | 20.0 | 19.6 | 19.7 | 19.8 | 19.7 | 19.2 | 19.1 | 19.5 | 19.5 | 6.4 |
| Globe temperature (°C) | 20.2 | - | 20.2 | - | 20.0 | - | 19.9 | - | 20.8 | - | 20.2 | - | - |
| Relative humidity (%) | 57.0 | 57.3 | 58.2 | 58.7 | 58.5 | 58.2 | 58.2 | 58.9 | 58.5 | 59.0 | 58.5 | 59.1 | 81.4 |
| Air velocity (m/s) | 0.0 | 0.0 | 0.0 | 0.0 | 0.1 | 0.0 | 0.0 | 0.0 | 0.0 | 0.0 | 0.0 | 0.0 | 0.1 |
| Parameter Type B | 1 | 2 | 3 | 4 | 5 | 6 | 7 | 8 | 9 | Floor | Ceiling | ||
| Mean radiant temperature (°C) at 0.6 m (B-1) | 16.4 | 17.2 | 17.3 | 16.7 | 17.0 | 18.1 | 14.5 | 15.9 | 15.8 | 15.7 | 15.8 | ||
| Mean radiant temperature (°C) at 1.7 m (B-2) | 17.2 | 17.6 | 19.0 | 17.4 | 16.5 | 17.5 | 16.0 | 16.5 | 16.5 | - | - | ||
Table 5.
Statistical data of students participating in the measurement campaign.
| Students | Students per Classroom | Percentage | |
|---|---|---|---|
| Students surveyed | 977 | 21.2 | - |
| Male students surveyed | 504 | 10.9 | (51.6%) |
| Female students surveyed | 473 | 10.3 | (48.4%) |
Table 6.
Thermal comfort indicators.
| Fanger method | Predicted Mean Vote | PMV | [5,21,39] |
| Predicted Percentage of Dissatisfied | PPD | ||
| Local discomfort | Local thermal discomfort due to draught rate | DR | [39] |
| Required clothing insulation (IREQ) | Maintaining thermal equilibrium with high physiological response | (IREQminimum) | [40,41,42,43,44,45] |
| Maintaining thermal equilibrium without physiological response | (IREQneutral) | ||
| Adaptive comfort index | ASHRAE ATC indicator | [25] | |
| Matias’ ATC indicator, optimized for the climate of the Iberian Peninsula. | [46,47] |
Table 7.
Mean objective thermal parameters in classrooms with standard deviations between classrooms. Where: “ ” is the mean outdoor temperature (°C); “Ta” is the air temperature (°C); “ ” is the mean radiant temperature (°C); “Va” is the air velocity (m/s); “to” is the operative temperature (°C); “RH” is the relative humidity (%). “AND” is the mean value for Andalusia; “3” and “4” are the mean values for the TBC climate zones 3 and 4 (midseasons); “A”, “B”, “C” and “D” are the mean values for the TBC climate zones A, B, C and (winter); “NO COOLING” is the mean value for classrooms with no cooling treatment in midseasons; “NO HEATING” is the mean value for classrooms with no heating treatment in winter; “RAD” is the mean value for classrooms heated with radiators in winter.
| (°C) | Ta (°C) | (°C) | Va (m/s) | to (°C) | RH (%) | |
|---|---|---|---|---|---|---|
| AND_MIDSEASONS_NO COOLING | 16.9 (σ = 4.3) | 22.1 (σ = 3.7) | 20.5 (σ = 4.6) | 0.00 (σ = 0.00) | 21.3 (σ = 4) | 43.2 (σ = 7.6) |
| 3_MIDSEASONS _NO COOLING | 16.4 (σ = 0.0) | 23.2 (σ = 1.6) | 22.0 (σ = 5.5) | 0.00 (σ = 0.00) | 22.6 (σ = 3.5) | 40.6 (σ = 7.6) |
| 4_MIDSEASONS _NO COOLING | 17.0 (σ = 4.8) | 21.9 (σ = 4.0) | 20.2 (σ = 4.4) | 0.00 (σ = 0.01) | 21.0 (σ = 4.1) | 43.8 (σ = 7.6) |
| AND_WINTER_NO HEATING | 9.2 (σ = 1.6) | 20.2 (σ = 2.1) | 18.2 (σ = 3.4) | 0.04 (σ = 0.01) | 19.2 (σ = 2.6) | 51.5 (σ = 5.2) |
| AND_WINTER_RAD | 9.0 (σ = 1.4) | 20.6 (σ = 1.6) | 20.3 (σ = 2.0) | 0.03 (σ = 0.01) | 20.5 (σ = 1.3) | 51.4 (σ = 4.9) |
| B_WINTER_NO HEATING | 10.3 (σ = 0.4) | 20.3 (σ = 2.2) | 18.2 (σ = 2.8) | 0.05 (σ = 0.01) | 19.2 (σ = 2.3) | 52.8 (σ = 5.5) |
| B_WINTER_RAD | 10.2 (σ = 0.4) | 20.1 (σ = 1.9) | 20.2 (σ = 2.2) | 0.03 (σ = 0.01) | 20.1 (σ = 1.5) | 51.9 (σ = 5.1) |
| C_WINTER_NO HEATING | 7.9 (σ = 1.5) | 20.0 (σ = 2) | 18.2 (σ = 4.1) | 0.04 (σ = 0.01) | 19.1 (σ = 3.0) | 50.0 (σ = 4.7) |
| C_WINTER_HW RAD | 7.9 (σ = 1.1) | 21.2 (σ = 0.9) | 20.4 (σ = 2.0) | 0.03 (σ = 0.01) | 20.8 (σ = 1.0) | 51.0 (σ = 4.8) |
Table 8.
Comparison of the mean clothing insulation value with IREQneu and IREQmin indicators, according to operative temperature.
Table 8.
Comparison of the mean clothing insulation value with IREQneu and IREQmin indicators, according to operative temperature.
| Operative Temperature (°C) | Clothing Insulation Value (clo) | IREQmin (clo) | IREQneu (clo) | |
|---|---|---|---|---|
| Annual | 21.8 (σ = 1.9) | 0.86 (σ = 0.21) | 0.49 | 0.85 |
| Winter | 21.5 (σ = 1.3) | 0.90 (σ = 0.19) | 0.52 | 0.89 |
| Midseasons | 22.7 (σ = 2.7) | 0.78 (σ = 0.23) | 0.40 | 0.76 |
Table 9.
Mean value of clothing insulation, thermal sensation vote (TSV), thermal preference vote (TPV) and predicted mean vote (PMV).
Table 9.
Mean value of clothing insulation, thermal sensation vote (TSV), thermal preference vote (TPV) and predicted mean vote (PMV).
| Clothing Insulation (clo) | TSV (−3 to +3) | TPV (−3 to +3) | PMV (−3 to +3) | |
|---|---|---|---|---|
| Annual | 0.86 clo | 0.34 | −0.01 | 0.07 |
| Winter | 0.90 clo | 0.32 | 0.06 | 0.00 |
| Midseasons | 0.78 clo | 0.38 | −0.20 | 0.24 |
Table 10.
Comparison of mean percentage of dissatisfied occupants (PD) per classroom: PD calculated on the base of acceptability criterion from surveys (PDacc) and on the opinions of those who voted ±2 or ±3 (PDF, according to Fanger’s model), percentage of people dissatisfied (PPD) from predicted mean vote (PMV) with an acceptability criterion of 5% and 15%, PD calculated from TSV according to d’Ambrosio et al. [23] and PD calculated using the Matias’ ATC model (PDMATIAS) [46,47] and ASHRAE 55 ATC model (PDASHRAE) [24].
| PDacc | PPD | PDacc,d’Ambrosio | PDMATIAS | PDASHRAE | |||
|---|---|---|---|---|---|---|---|
| (95%) | (85%) | (85%) | |||||
| Annual | 18.0% | 12.5% | 6.7% | 16.6% | 22.7% | 9.2% | 41.1% |
| Winter | 19.6% | 13.9% | 6.3% | 16.2% | 22.0% | 9.8% | 52.9% |
| Midseasons | 16.9% | 8.6% | 7.8% | 17.5% | 24.4% | 7.7% | 10.1% |
© 2019 by the authors. Licensee MDPI, Basel, Switzerland. This article is an open access article distributed under the terms and conditions of the Creative Commons Attribution (CC BY) license (http://creativecommons.org/licenses/by/4.0/).
Share and Cite
MDPI and ACS Style
Campano, M.Á.; Domínguez-Amarillo, S.; Fernández-Agüera, J.; Sendra, J.J. Thermal Perception in Mild Climate: Adaptive Thermal Models for Schools. Sustainability 2019, 11, 3948. https://doi.org/10.3390/su11143948
AMA Style
Campano MÁ, Domínguez-Amarillo S, Fernández-Agüera J, Sendra JJ. Thermal Perception in Mild Climate: Adaptive Thermal Models for Schools. Sustainability. 2019; 11(14):3948. https://doi.org/10.3390/su11143948
Chicago/Turabian StyleCampano, Miguel Ángel, Samuel Domínguez-Amarillo, Jesica Fernández-Agüera, and Juan José Sendra. 2019. "Thermal Perception in Mild Climate: Adaptive Thermal Models for Schools" Sustainability 11, no. 14: 3948. https://doi.org/10.3390/su11143948
Note that from the first issue of 2016, this journal uses article numbers instead of page numbers. See further details here.