Assessing Sidewalk and Corridor Walkability in Developing Countries


Department of Civil Engineering/Qatar Transportation and Traffic Safety Center, Qatar University, P.O. Box 2713, Doha, Qatar
Sustainability 2019, 11(14), 3865; https://doi.org/10.3390/su11143865
Submission received: 31 May 2019
/
Revised: 24 June 2019
/
Accepted: 1 July 2019
/
Published: 16 July 2019
(This article belongs to the Special Issue Future Cities: Urban Planning, Infrastructure and Sustainability)
Abstract
:Finding a simple and less expensive method to assess and improve sidewalk and corridor conditions in developing countries is essential in order to motivate more people to walk. This study aimed to design and test a method that uses direct observations of driver behavior and street measurements to assess sidewalk and corridor walkability in developing countries. The proposed method includes different walkability indicators related to sidewalk features, crossing facilities, sidewalk facilities, and driver behavior to provide one score that represents the walkability of a sidewalk and one that represents the walkability of a corridor. The method was tested on streets from 10 neighborhoods in the city of Doha, Qatar. The results indicated that the developed method was easy to use and could efficiently measure various indicators, illustrating that it can be used to evaluate corridors with different characteristics to identify and rank areas that require improvement. The study’s findings will provide maintenance agencies, policymakers, and practitioners in developing countries with a simple, efficient, and cost-effective method to evaluate, plan, rank, and improve the walkability of sidewalks and corridors.
1. Introduction
Walking is one of the easiest and least expensive forms of physical activity. Walking is needed to keep people healthy as it can help prevent many diseases, such as cardiovascular disease, diabetes, and hypertension. Walking also promotes social interaction between people, which in turn can improve their mental health and well-being [1,2,3]. It is also one of the most sustainable forms of transportation and contributes to the reduction of air pollution by reducing the use of personal vehicles [4].
Walkability is an indication of the built environment’s suitability for walking on a street or in a neighborhood and the way a residential neighborhood is built affects its walkability [5,6,7]. The walkability of any neighborhood will increase when pedestrians are provided with a safe, comfortable, and accessible infrastructure [6,7,8]. Designing a properly built environment is a key factor in promoting walkability because it fosters more attractive, convenient, healthy, and efficient neighborhoods [8,9], which in turn provide significant health benefits and independence, especially among children and elderly who rely more on their local neighborhoods [10]. For these reasons, there is a need to measure the characteristics of the built environment and its impact on walkability. By doing this, the proper improvements can be made based on the obtained data. Importantly, the method of measurement must provide relevant, easy-to-comprehend, and reliable measurable characteristics as data [11].
Improving walkability is not an easy task for public agencies, especially in developing countries. According to the United Nations, a developing country is a country with a relatively low living standard, an undeveloped industrial base, and a moderate-to-low Human Development Index, which is an index measuring poverty, literacy, education, and life expectancy, in addition to other factors. A key characteristic of a developing country is poor infrastructure. Some of these problems include narrow streets [12,13], obstructions [14,15], lack of shaded corridors [16], appealing elements [17], and aggressive driving against pedestrians [18].
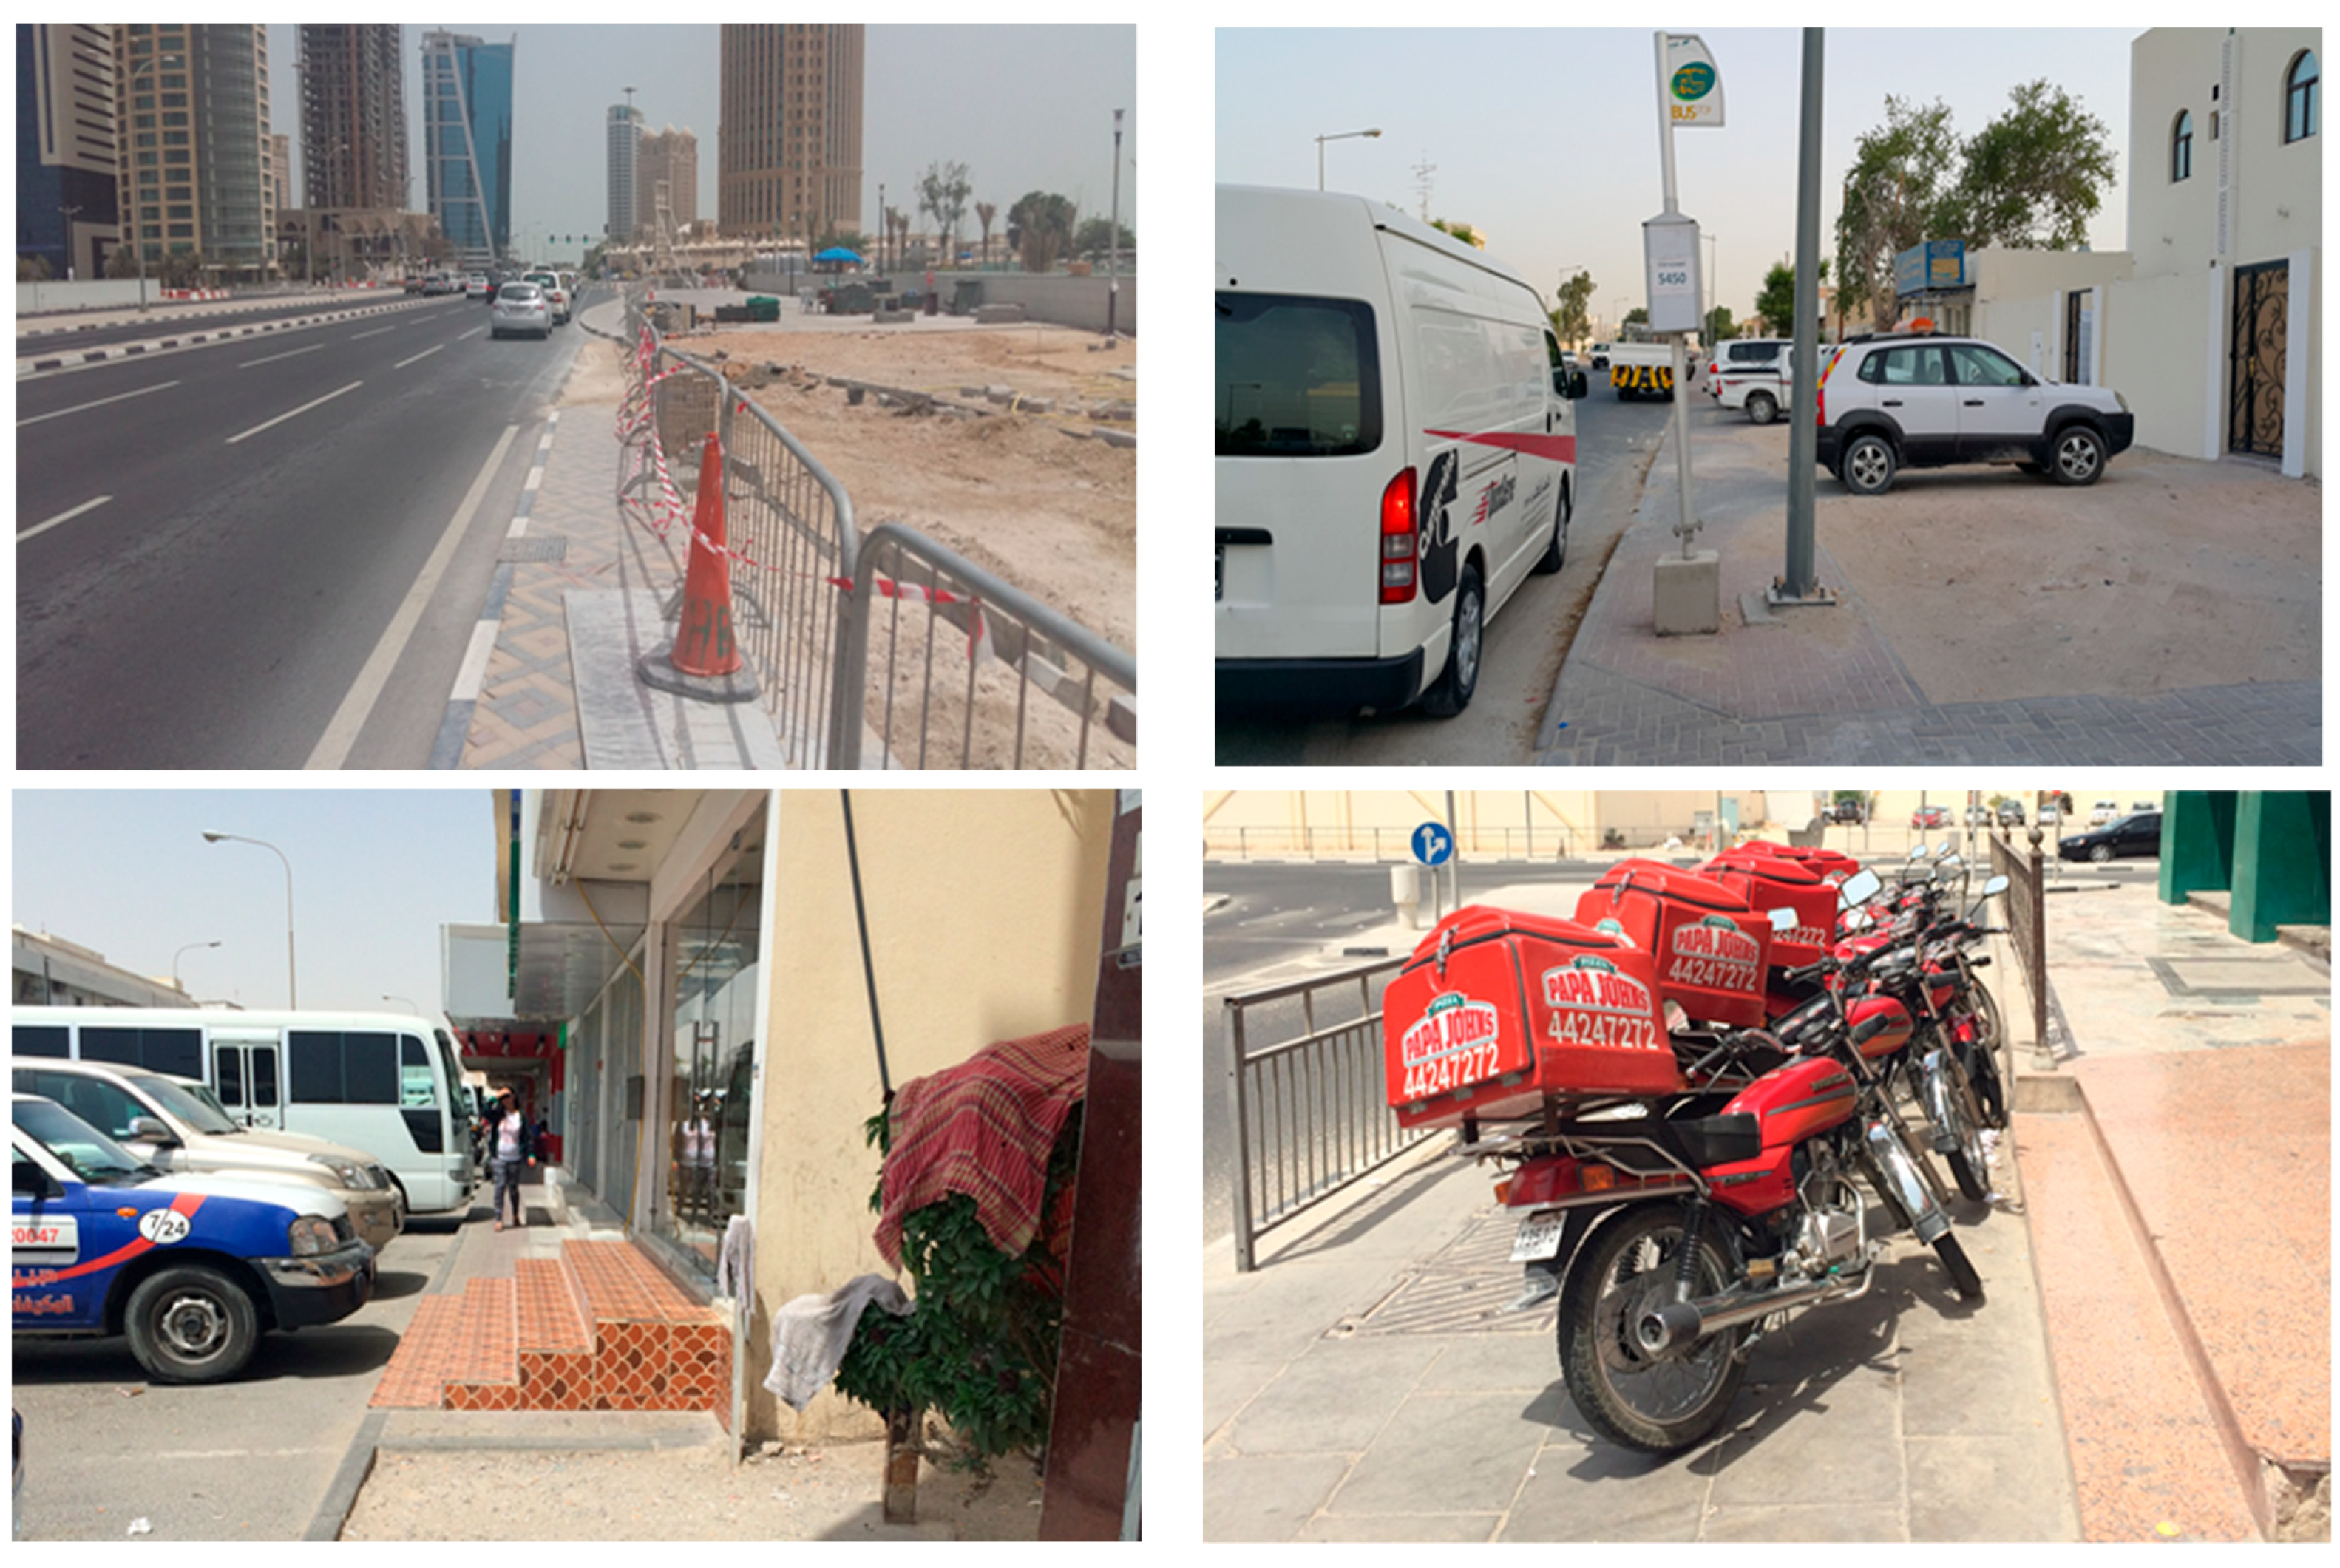
Sidewalks are the main infrastructure for pedestrian mobility. Although studying the condition of sidewalks and their impact on walkability has received considerable attention in different countries, few studies investigating sidewalks in developing countries exist. As such, the present study strives to investigate walkability in a developing country properly. The first aim of this study is to design a simple measuring method that assesses sidewalks and corridors in developing countries. The second aim is to apply the method to real-life data to check its ability to assess the sidewalk walkability in Qatar, a developing country, effectively. As a developing country in the Middle East, Qatar is a unique case. Even though Qatar is considered as one of the most advanced countries in the region—thanks to having one of the highest gross domestic product per capita in the world—the country is still considered a developing country according to the United Nations for several reasons. For instance, Qatar’s infrastructure, particularly the transportation one, is facing problems. Some of these problems were caused by the rapid continuous growth of the population, resulting in heavy pressure on the existing transportation infrastructure, a low-quality non-motorized transportation infrastructure, traffic safety problems, noise and air pollution concerns, coordination issues between different public agencies, and a shortage in experienced transportation professionals for management, planning, and operation. Although Qatar is investing heavily in improving its infrastructure, the conditions of the non-motorized transportation infrastructure remain a problem. Incentives for walking are limited in many cases, given that the sidewalks either have problems (are obstructed, too narrow, dirty, etc.) or may not even be provided in some cases (Figure 1).
The lifestyle of the population has shifted toward one that is less physically active, resulting in fewer pedestrians on the streets [19,20,21]. Unfortunately, this shift is associated with higher levels of obesity and an increased risk of cardiovascular disease, strokes, diabetes, hypertension, and high cholesterol due to less walking [22,23,24]. Therefore, there is a need to increase the walking activities of people living in such regions to decrease the risk of health problems. In developed countries, public agencies have policies to develop sustainable mobility plans for pedestrians and methods to evaluate the infrastructure for motorized and non-motorized modes are widely available. On the other hand, in developing countries, public agencies are struggling to find simple and inexpensive ways to assess, install, evaluate, and maintain sidewalks to provide pedestrians good walking infrastructure. So, community leaders and public health officials in developing countries could use a method to help improve the physical, mental, and social well-being of the public by improving walkability. Together, the main aim of this study is to address the need for a simple method to assess sidewalk walkability in developing countries. This method should depend directly on observing and reporting existing conditions in the field, with special attention to new, important factors for developing countries (e.g., the presence of patrolling police and driver behavior).
2. Literature Review
Walking and its relationship with the built environment have been studied widely by various studies using specific tools. For example, in a study by La Riccia et al., they used geospatial databases and Geographical Information Systems (GIS) to assess multiple indicators to evaluate the walkability in Torino, a city in Italy [25]. The GIS tool was useful for preparing, presenting, and interpreting pedestrian paths. Parks and Schofer [26] developed objective measures of the pedestrian environment that used three main classes of variables, including network design (block length, census-block density, and intersection type), sidewalks, and the roadside built environment (setbacks and parking). The data were collected for 23 neighborhoods in the Chicago region using GIS. The data were used to identify the best combination of laboratory measures to represent the pedestrian environment factor and pedestrian friendliness index.
Despite the potential benefits of GIS, there are some factors that hinder its effectiveness in developing countries. One of these factors is the availability of qualified personnel and proper training, which have been deemed an important challenge for the implementation of GIS [27]. Public agencies need qualified and skilled personnel in the form of team leaders, analysts, and administrators to develop a proper GIS system [28]. Not having qualified and skilled personnel may create a false representation of the existing conditions, potentially causing measurement errors or missing information, which is another considerable challenge regarding the effectiveness of GIS [29].
Collecting relevant and comprehensive spatial data for GIS is another challenge because it needs to be updated frequently to be a useful system [30]. Nevertheless, the availability of trained and qualified personnel does not guarantee the effective use of GIS. Another challenge that affects the possible implementation of GIS is the lack of adequate funding. Although the cost for its hardware and software has decreased over the past decades [27], the funding [31], cost of finding and hiring qualified trained staff [32], and the availability of geo-information infrastructure [33] are still considered major challenges to set up the GIS system, something that especially applies for developing countries due to their lack of financial strength in many cases [34,35]. Overall, there is a need for additional methods besides the GIS that are less expensive, require less personnel, can be taught by simple training procedures, and still provide accurate results.
Various studies have used questionnaires to measure walkability [36,37,38,39,40,41]. For example, Kelly et al. [36] used a stated preference survey to determine the relative values of a range of factors in the pedestrian environment, an on-street survey that was designed to investigate values and attitudes toward different attributes of the pedestrian environment along a route, and an “on the move survey”, where pedestrian volunteers were interviewed while walking along the route in order to get an actual account of their experiences as they walked. From the stated preference survey of users, 47 pedestrian attributes were evaluated using a five-point scale (from “not important” to “extremely important”). From the results of this survey, nine parameters influencing walkability were judged. These parameters included car speed, cyclists on the pavement, detours, pavement width, road crossings, street lighting, traffic volume, pavement cleanliness, and pavement evenness.
Park and Kang [42] developed a walkability index using multiple numbers of walkability measurement variables based on walker perception. The walkers’ perception was measured using five values—sense of safety (from traffic), sense of security, comfort, convenience, and visual interest—derived from 13 components. The path walkability was measured by 52 walkability indicators divided into different sections, including indicators related to pedestrian crossings, buffer zones, sidewalk condition, sidewalk facilities, street scale and enclosure, and nearby buildings and properties. Table 1 shows a summary of the different considered factors in studies conducted using questionnaires.
However, this method may not be easy to implement in developing countries due to cultural, social, and security reasons. Inviting pedestrians in the street to participate in a questionnaire in developing countries generally requires a lengthy approval process and specific training. In addition, the process requires a high number of data collectors, which is challenging due to the involved costs for labor. Furthermore, the number of pedestrians who choose to participate in these type of surveys is low, as many pedestrians usually refuse to participate.
Several studies have used actual field observations to measure actual walkability conditions. Stevens [44] performed a walkability assessment at the street level by collecting twenty key indicators of walkability in the field. These twenty variables were chosen from seventy-seven indicators, including safe for walking, attractive for walking, traffic volume, sidewalk condition, segment continuity, sidewalk complete, land use, number of street lanes, buffer zone, speed limit, building setbacks, path setbacks, on-street parking, traffic control devices, transit stops, walk through parking lots, crossing aids, lighting, number of trees, and driveways. Each street segment received a score based on the presence or absence of a particular indicator, or more points depending on the quality and quantity of the indicator.
Gallimore et al. [45] studied the walkability of students based on environmental and perceptional correlates for a new urban community and a standard suburban community in the US for neighborhoods with different levels of walkability. Students living within 1.5 miles of route length were chosen for this study. Irvine–Minnesota Inventory (IMI) walkability audits were conducted and traffic safety difference scores were calculated along with perception and socio-demographic data from parents and children. The IMI scale included six attributes: Traffic safety, accessibility, pleasurability, crime safety, density, diversity, and block factor.
Gori et al. [46] focused on the analysis of walking indicators related to the structure of the road network, namely measures of connectivity, measures of quality, and measures of proximity, to provide useful information and establish a performance standard in terms of walkability for new and/or existing development areas. The walking indicators were applied to different zones within different cities in Italy.
One of the factors overlooked by these type of studies is driver behavior, which involves issues related to walkability, such as not yielding to pedestrians, aggressive driving, driver distraction, running a red light, not obeying traffic signs, etc. These issues are considered a major concern for developing countries as indicated by previous studies [47,48,49,50] and can impact the walkability of a sidewalk or a corridor. For this reason, this study aimed to design and test a simple assessment method that uses direct observations of driver behavior and street measurements suitable for evaluating the parameters of sidewalk and corridor walkability at the micro level. By applying this approach, a score and rank of the sidewalks and corridors can be formulated that represents their conditions. Based on this ranking, future improvements can be determined for those locations. Because these observations are conducted manually, data collectors are also able to record their observations regarding the behavior of drivers in those investigated areas.
3. Methods
3.1. Walkability Indicators
The proposed method in this study measures the walkability of sidewalks and corridors using different quantitative and qualitative indicators. For the sidewalk level assessment, nine sidewalk indicators were used, including the sidewalk’s obstructions, continuity, physical condition, encroachments, cleanliness, width, slope, shade from trees, and buffer zone. The description for each sidewalk indicator is listed in Table 2 and the different levels for each indicator are listed in Table 3. These indicators were collected for each side of the street and for segments of 200 feet in length.
The method used a combination of two low-point scales (three and four-point) depending on the indicator. The combination of different scales in the same investigation gave the flexibility to select the most suitable scale for each indicator and the ability to assign more weight to some of the indicators as needed. This type of approach was used in several previous studies. For instance, Clark et al. used a combination of four-point and seven-point scales and Cools et al. used a combination of seven-point and 10-point scales [51,52]. Also, the use of a low-point scale instead of a high-point one might be easier to use when collecting data in the field because the average person does not usually make meaningful distinctions anymore when there are more than seven levels of a given indicator score [53,54]. In case there is a unified scale needed by the public agency, the proposed scale can be easily modified since most statistical programs have the option to standardize variables and can save them as new ones with an adjusted scale.
For the corridor level assessment, 16 indicators were used. The crossing facilities were measured using four variables, including crossing availability, crossing sight distance, pedestrian signal availability, and curb ramp availability. The sidewalk facilities were measured using five variables, including seats and benches (rest areas), shelters for rain and sun, security and safety (police or guards patrolling), transit stops, and street lighting. Next, driver behavior was measured using nine variables, including driver’s yield to pedestrians, obedience to stop/yield signs, obedience to traffic signals, speeding, obedience toward crosswalk regulations, traffic volume, and calming measures against traffic. The description for each indicator to assess corridors is listed in Table 4 and the different levels for each indicator are listed in Table 5.
Indicators related to the driver behavior were captured and recorded on tally sheets using a small sample of 10 vehicles per location. Although the data collectors were able to record observations regarding driver behavior—including the drivers running through red lights, the drivers obeying yield/stop signs, etc.—the counts were labor-intensive as they were conducted manually, therefore, increasing the duration of the data collection process.
The reason for using 10 vehicles in this study was to capture a small sample of a specific location and keep data collection simple, fast, and convenient. This could be especially helpful for neighborhoods where the number of side streets per corridor is high. In addition, some of the side streets were entrances to residential compounds with low traffic volume, which made the data collection challenging and time-consuming. Another reason was to reduce the time and cost involved throughout the data collection process. In many cases, public agencies in developing countries have limited staff and funding resources for the data collection process; high spending on the data collection could also result in a reduction of the resources available to other programs and projects. The concept of using a small vehicle sample to represent driver behavior has been used before. For example, Xiong et al. used a sample size of seven to nine vehicles and Ferman proposed a sample number of 12 vehicles [55,56]. Then, there is also the concept that focuses on the observation time of each location and using very short periods, in which some studies used an observation time as little as 3 min [57,58]. However, during our pilot study, the data collectors were not able to observe any vehicles at multiple locations within such a short period due to the absence of traffic. Therefore, it was decided to proceed with the 10-vehicle concept to ensure the collection of data for all locations regarding driver behavior. In the case of time and budget availability or a smaller project/corridor size, a higher number of vehicles should be considered.
3.2. Site Selection
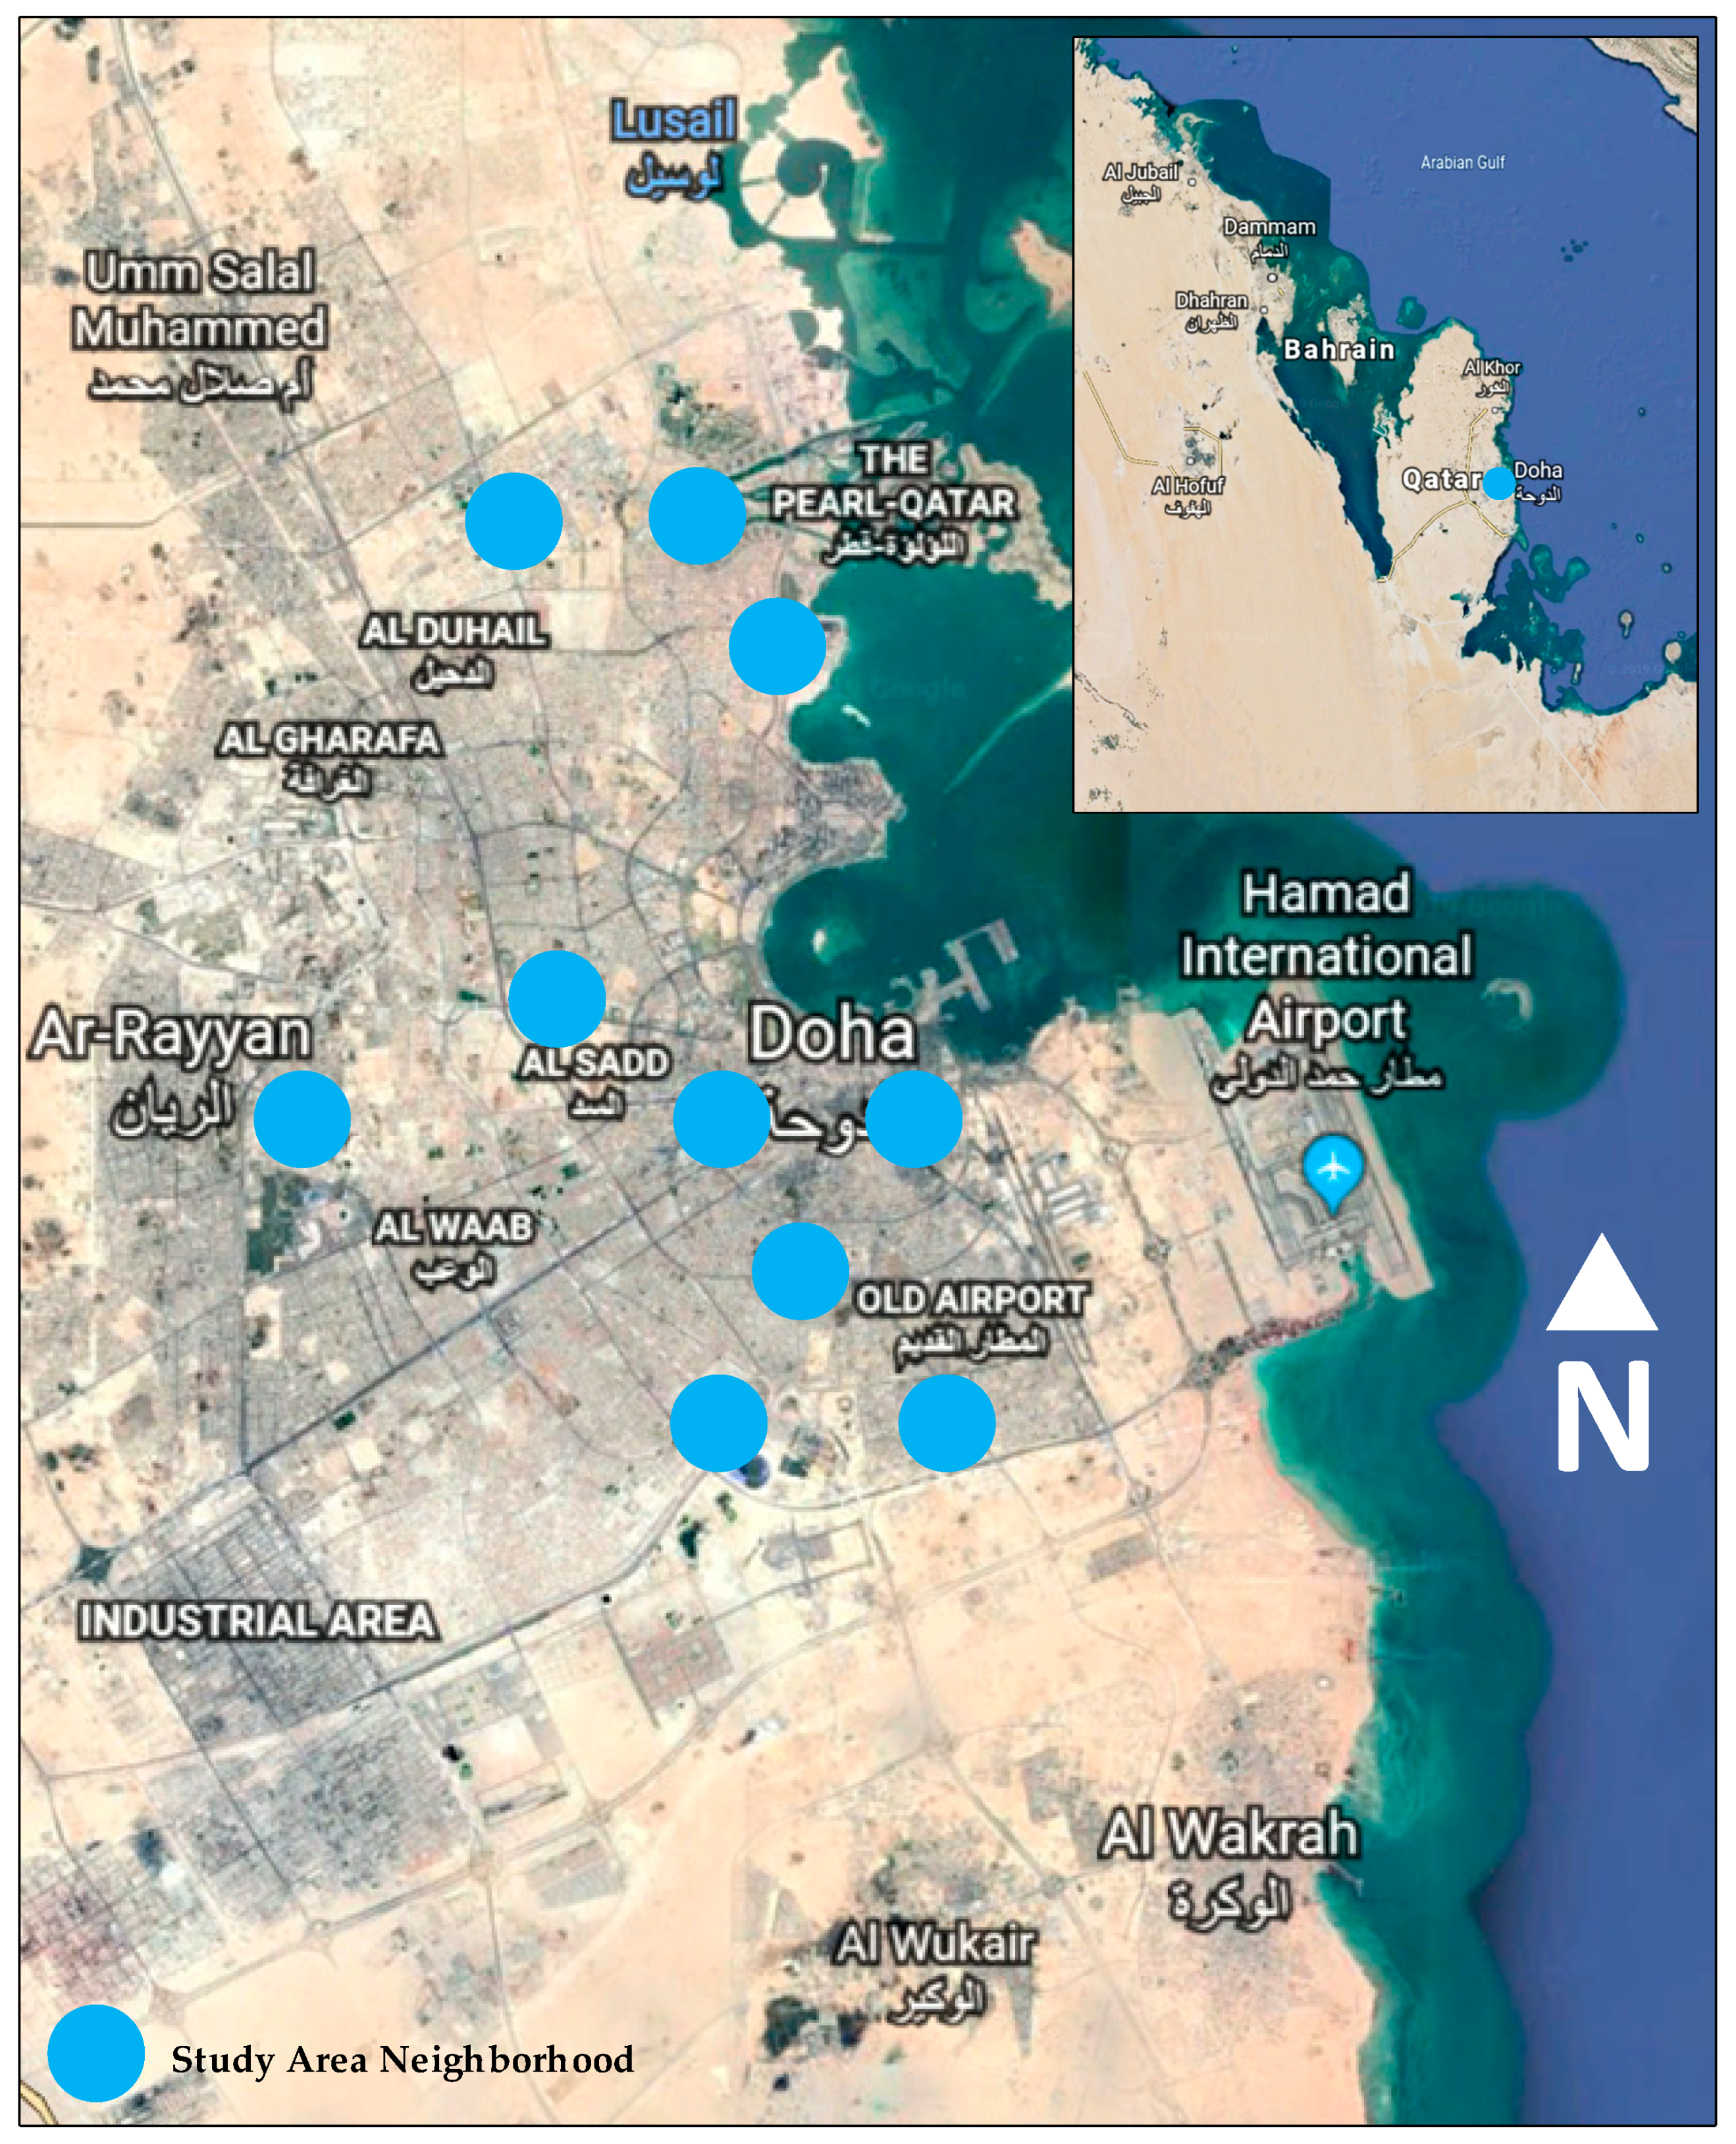
Various streets with different conditions were selected to test the developed method. This was crucial as it is important to select communities in a manner that properly represents different types of communities in a developing country. For this reason, the method was tested using data from different communities in the city of Doha, Qatar (a developing country). The criteria for its selection included its community demographics, population, diversity, ethnicity, healthy and safe environments, mixed-use developments, distance from the city center of Doha, diverse modes of transportation, and local planning and zoning ordinances. After considering multiple neighborhoods, a total of 10 were selected. The locations of the neighborhoods are shown in Figure 2.
As far as the selection of a suitable street from each neighborhood, previous studies suggested that studying all streets in a neighborhood is unnecessary due to the likely substantial homogeneity within street types, which applies especially to residential streets [59]. Therefore, a small sample of the neighborhood street segments may sufficiently represent the pedestrian built environment and reduce the burden of exhaustive neighborhood data collection to increase efficiency and reduce costs. A sample of arterial streets in a neighborhood is enough to capture the depth and influence of the environment on pedestrians, as the ones with a mixed usage introduce much greater variability and richness in data compared to other residential streets in the neighborhood [60,61]. Characteristics such as sidewalks, traffic volumes, posted speeds, number of traffic lanes, and safe crossings will vary more significantly for the arterial streets than for the residential ones. With a relatively high number of arterial streets in the 10 selected neighborhoods, it was important to maximize the range of the included conditions. Thus, before site selection, a detailed study was conducted to investigate the variety of activities for pedestrians and bicyclists on all streets. Then, one arterial street was selected per neighborhood as its representative for the other streets [20,21].
4. Data Collection
Before the field measurements, the data collection sheets were designed. This was done in such a way to make the field measurement process and entry into an electronic format easy and simple. Data collectors received specific training on how to collect and record the required data using the data collection sheets to maximize measurement consistency and minimize error occurrence. After the completion of the training, the data collection process took place for the selected sidewalks and corridors.
The process was typically done by one data collector. Data were collected during normal weekdays and good weather conditions. In the field, the data collection process involved surveying both sides of the street. The data collector walked along the sidewalk from the starting point to the end point and identified all walkability features, captured photographs for future verification, and filled out the forms. Each segment or corridor received a score according to the absence or presence of each indicator. The level of scoring also depended on the quantity and/or quality of a specific indicator, in which a better quantity and/or quality resulted in more points. For a list of the selected arterials, please see Table 6.
5. Analysis
The main purpose of the analysis was to determine a score for each indicator of the sidewalks and corridors and use those to calculate a cumulative score to provide meaningful information for public agencies concerning the walkability of those evaluated areas.
5.1. Sidewalk Assessment
Table 7 shows the average score for each indicator. All indicators were marked using a three-or four-point scale, of which the highest value showed the best walking conditions. Below is a description of the sidewalk conditions in all neighborhoods.
Fereej Abdul Aziz—The sidewalks were clean but in poor condition with several missing sections, many obstructions, encroachments, and cracks. They were narrow with only a small separation from the traffic, were not easily accessible by wheelchair, and had a few trees.
Al Dafna—The sidewalks were clean and in good condition with only a few missing sections, obstructions, and cracks. They had a sufficient width, good wheelchair accessibility, and a few trees.
Al Doha Al Jadeeda—The sidewalks were dirty and in poor condition with missing sections, obstructions, and cracks. They had a narrow width, were not easily accessible by wheelchair, and had a few trees.
Al Hilal—The sidewalks were clean and in good condition with a few missing sections, obstructions, and cracks. They had an acceptable width, were easily accessible by wheelchair, and had some trees.
Al Sadd—The sidewalks were mostly clean and in good condition with some missing sections, obstructions, and cracks. They had a narrow width, were at certain points easily accessible by wheelchair, and had a few trees.
Fereej Al Soudan—The sidewalks were dirty and in poor condition with missing sections, many obstructions, and many cracks. They had a narrow width, were not easily accessible by wheelchair, and had a few trees.
Leqtaifiya—The sidewalks were somewhat clean and in good condition with a few obstructions and no cracks but still had several missing sections. They had a narrow width and were not easily accessible by wheelchair. Some trees were also present but did not really provide shelter against the sun or rain.
Nuaija—The sidewalks were somewhat clean and in good condition with no obstructions, missing sections, or cracks. They had a narrow width with a small separation from the traffic, were not easily accessible by wheelchair, and had a few trees.
Old Airport—The sidewalks were mostly in good condition but did have some cracks. They were mostly obstructed by some furniture from adjacent shops or stairs (Figure 1). Also, some small street shops occupied the sidewalk space, leaving a narrow section for pedestrians to walk on. Furthermore, the sidewalks were accessible by wheelchair and had a few trees.
The Pearl—The sidewalks were clean and in excellent condition with no missing sections or cracks. They were wide enough and well-designed for pedestrian use. For some segments, excessive use of landscape features was observed.
5.2. Corridor Assessment
The results of the crossing facilities, sidewalk facilities, and driver behavior were collected for each side separately and are shown in Table 8 for all corridors. Below is a description of the corridor conditions in all neighborhoods.
Fereej Abdul Aziz—The corridor had no suitable crossing points, pedestrian signals, or curb ramps. The land use alongside the corridor was commercial. Neither side had any rest areas, shelter, or patrolling police. There were also no transit stops. The corridor had sufficient lighting. All drivers gave way to pedestrians and obeyed traffic rules.
Al Dafna—The corridor had a high number of suitable crossing points with a clear view of the traffic, the presence of pedestrian signals, and curb ramp facilities. The land alongside the corridor was used for commercial purposes. Neither side had any rest areas, but they did have some shelter and patrolling police to instill a sense of safety. There were also several transit stops and the corridor had proper lighting, making it well-lit after sunset. Some drivers were giving way to pedestrians and obeyed the traffic rules, portraying an overall moderate driving behavior.
Al Doha Al Jadeeda—The corridor had no suitable crossing points, pedestrian signals, or curb ramp facilities. The land alongside the corridor was used mostly by a mix of residential and commercial buildings. Neither side any rest areas, shelters, or patrolling police. There were also no transit stops. The corridor had moderate lighting. All evaluated drivers showed good driving behavior by giving way to pedestrians and obeying traffic rules.
Al Hilal—The corridor had some suitable crossing points with appropriate curb ramp facilities, but had some blockage of the traffic view and no pedestrian signals. The land alongside the corridor was used by residential and commercial buildings. Neither side had any rest areas, shelter, or patrolling police. There were also no transit stops. There was street lighting available along both sides of the corridor. Many drivers were showing aggressive driving behavior by not giving way to pedestrians or obeying traffic rules.
Al Sadd—The corridor had some suitable crossing points with some of the traffic view blocked, but had an absence of pedestrian signals and poor ramp facilities. The land alongside the corridor was commercial. Neither side had any rest areas or patrolling police. There were also no transit stops available. However, the corridor had sufficient lighting. Most drivers were showing good driving behavior by giving way to pedestrians and obeying traffic rules.
Fereej Al Soudan—The corridor had some suitable crossing points with a clear view of the traffic and cut ramp facilities, but no pedestrian signals. The land alongside the corridor was used for residential buildings. Neither side had any rest areas, shelter, or patrolling police. No transit stops were available either. The corridor was irregularly lit by some scattered light poles and by the lights from the houses next to it. The drivers were showing aggressive driving behavior by not giving way to pedestrians and not obeying traffic rules.
Leqtaifiya—The corridor had some crossing points available with a clear view of the traffic, pedestrian signals, and curb ramp facilities. The land alongside the corridor was used for residential and commercial purposes. Both sides of the corridor had rest areas, shelters, and patrolling police. There were no transit stops. However, street lighting was available on both sides of the corridor. A moderate number of drivers were giving way to pedestrians and obeyed traffic rules.
Nuaija—The corridor had some suitable crossing points with a clear view of the traffic and curb ramp facilities, but no pedestrian signals were available. The land alongside the corridor was used for residential and commercial purposes. Neither side have any rest areas or shelters, but they did have some security guards. There were limited transit stops available. The lighting was available from light poles on one side and from business buildings on the other. The drivers were showing aggressive driving behavior, did not give way to pedestrians, and did not obey traffic rules.
Old Airport—The corridor had a moderate number of crossing points with some blockage of the traffic view but no pedestrian signals or up-to-standard curb ramp facilities. The land alongside the corridor was used for commercial purposes at both sides. Furthermore, there were no rest areas or shelters. Some police patrolling activities were recorded and multiple transit stops were available. The street lighting was available through scattered poles and businesses alongside the corridor. Some drivers were giving way to pedestrians and obeyed traffic rules, resulting in moderate driving behavior.
The Pearl—The corridor had some suitable crossing points with some blockage of the street view, but there were no pedestrian signals or curb ramp facilities. The land alongside the corridor was used for residential purposes. Neither side any rest areas or shelters. Some police patrolling activities were recorded. There were no transit stops. Street lighting was available on both sides. However, the drivers were showing aggressive driving behavior by not giving way to pedestrians or obeying traffic rules.
6. Conclusions
This study aimed to develop a method that uses direct observations and street measurements to obtain a score that represents the walkability of a sidewalk and a score that represents the walkability of a corridor. The proposed method includes several indicators (e.g., the width of a sidewalk, the presence of crossings, and fixed object obstructions) that can be measured and quantified. A number of these indicators are temporary or behavioral, for example, the vehicles parked on the sidewalk, the presence of police or security guards, the driver compliance with traffic laws, etc. The use of field observations makes the method a more reliable and powerful tool to measure actual walkability conditions. The developed method can be used to accomplish several goals, including the creation of a detailed record of sidewalks and corridors and the identification of priority areas in need of improvement. Overall, the method can be used to evaluate, plan, rank, and improve sidewalks and corridors.
The method was tested on streets from 10 neighborhoods with different characteristics located in a developing country (Doha, the capital of Qatar). The method was easy to use and successful in producing a score to rank the studied streets based on their conditions. Additionally, the evaluation method also considered the behavior of drivers near the chosen location, which is a major concern in developing countries and has not been taken into account before in previous studies [44,45,46].
An additional advantage of the developed method is that it does not require intensive labor. The indicator counts can typically be done by only one data collector, saving valuable manpower and cost. Thus, as a whole, this simple method will make it easier to measure and evaluate the conditions of sidewalks and corridors for their walkability.
The first major practical contribution of the present research is that it provides a much-needed simplified method for assessing sidewalk and corridor walkability. This method is important, given that comparable methods such as GIS may lack actual updated field measurements. The proposed method will allow policymakers, practitioners, consultants, and others to make fast and accurate decisions regarding required improvements. In this sense, this research is timely, since promoting walkability has become a challenge which applies especially to developing countries.
A second implication is that methods requiring extensive resources are not necessary anymore. For instance, researchers may be driven toward the more advanced—and often more costly—methods such as GIS. However, not all public agencies in developing countries have enough funding, qualified personnel, or proper hardware and software to utilize GIS. In this sense, although this research falls short of developing a fully automated tool, it clearly provides a simple method that only needs limited resources and personnel. Since the idea of this research was based on the need for simpler methods for analyzing and planning sidewalks, contacts have already been established with the appropriate public agencies to explore how the proposed method can be used effectively in the near future.
A third important implication of the study involves its inclusion of driver behavior. Previous research in developing countries has indicated that drivers leave most of the responsibility of avoiding accidents to pedestrians, even in residential areas [18,49,62]. Accordingly, the proposed method suggests that driver behavior is a key factor that needs to be measured and evaluated in terms of how such behavior impacts walkability in certain neighborhoods.
Finally, this study also suggests that multiple approaches and solutions are required to improve overall walkability. The outcomes of this study can be integrated into an existing framework for a public agency in addition to its existing methods or as a fully standalone one when no other methods are available.
There are several limitations to this study that should be mentioned. For instance, paper forms were used to document the measurements in the field. In the future, automating the data collection process using a phone application or a computer program should be considered to reduce the amount of time spent on field and office work. Another limitation involves the obtained information about driver behavior, as only 10 vehicles per indicator per location were used. In the case of time and budget availability or a smaller project/corridor size, more vehicles should be considered. Increasing the sample size could improve the reliability of the score.
In summary, the outcome of this study will provide public agencies, practitioners, policymakers, and local authorities in developing countries with an efficient, simple, and cost-effective method to evaluate, plan, and rank sidewalks and corridors for their walkability. Here, improving sidewalks and corridors could offer many benefits, such as better living and working environments, an enhanced sense of pride in the community, and alternative transportation options.
Author Contributions
The author confirms sole responsibility for the following: Study conception and design, data collection, analysis and interpretation of results, and manuscript preparation.
Funding
This report was made possible by a UREP grant [UREP 15-085-3-020] from the Qatar National Research Fund (a member of The Qatar Foundation).
Acknowledgments
The statements made herein are solely the responsibility of the author(s). The author would like to express his sincere acknowledgment to the team members, especially Mohamed Nabil, Saher Hisham, Saleem Samir, and Yehia Ahmed for their hard work during data collection and processing.
Conflicts of Interest
The author declares no conflict of interest.
References
- Edwards, P.; Tsouros, A.D. Promoting Physical Activity and Active Living in Urban. Environments: The Role of Local Governments; WHO Regional Office Europe: Marmorvej, Denmark, 2006. [Google Scholar]
- Coffee, N.T.; Howard, N.; Paquet, C.; Hugo, G.; Daniel, M. Is walkability associated with a lower cardiometabolic risk? Health Place 2013, 21, 163–169. [Google Scholar] [CrossRef] [PubMed]
- Saelens, B.E.; Handy, S.L. Built environment correlates of walking: A review. Med. Sci. Sports Exerc. 2008, 40, S550. [Google Scholar] [CrossRef] [PubMed]
- Frank, L.D.; Saelens, B.E.; Powell, K.E.; Chapman, J.E. Stepping towards causation: Do built environments or neighborhood and travel preferences explain physical activity, driving, and obesity? Soc. Sci. Med. 2007, 65, 1898–1914. [Google Scholar] [CrossRef] [PubMed]
- National Research Council (US); Committee on Physical Activity, Transportation, Land Use, Transportation Research Board, and Institute of Medicine. Does the Built Environment Influence Physical Activity? Examining the Evidence; Transportation Research Board: Washington, DC, USA, 2005; Volume 282.
- Forsyth, A.; Oakes, J.M.; Lee, B.; Schmitz, K.H. The built environment, walking, and physical activity: Is the environment more important to some people than others? Transp. Res. Part D Transp. Environ. 2009, 14, 42–49. [Google Scholar] [CrossRef]
- Richardson, E.A.; Mitchell, R.; Hartig, T.; de Vries, S.; Astell-Burt, T.; Frumkin, H. Green cities and health: A question of scale? J. Epidemiol. Community Health 2012, 66, 160–165. [Google Scholar] [CrossRef] [PubMed]
- Forsyth, A.; Krizek, K.J. Promoting walking and bicycling: Assessing the evidence to assist planners. Built Environ. 2010, 36, 429–446. [Google Scholar] [CrossRef]
- Dannenberg, A.; Jackson, R.; Frumkin, H.; Schieber, R.; Pratt, M. The impact of community design and land-use choices on public health: A scientific research agenda. Am. J. Public Health 2003, 93, 1500–1508. [Google Scholar] [CrossRef] [PubMed]
- Berke, E.M.; Koepsell, T.D.; Moudon, A.V.; Hoskins, R.E.; Larson, E.B. Association of the built environment with physical activity and obesity in older persons. Am. J. Public Health 2007, 97, 486–492. [Google Scholar] [CrossRef] [PubMed]
- Brownson, R.C.; Hoehner, C.M.; Day, K.; Forsyth, A.; Sallis, J.F. Measuring the built environment for physical activity: State of the science. Am. J. Prev. Med. 2009, 36, S99–S123. [Google Scholar] [CrossRef]
- Asadi-Shekari, Z.; Moeinaddini, M.; Shah, M.Z. A pedestrian level of service method for evaluating and promoting walking facilities on campus streets. Land Use Policy 2014, 38, 175–193. [Google Scholar] [CrossRef]
- Martínez, L.M.; Barros, A.P. Understanding the Factors That Influence Pedestrian Environment Quality. In Transportation Research Board 93rd Annual Meeting Compendium of Papers; Transportation Research Board: Washington, DC, USA, 2014; pp. 1–15. [Google Scholar]
- Zainol, R.; Ahmad, F.; Nordin, N.A.; Aripin, A.W.M. Evaluation of users’ satisfaction on pedestrian facilities using pair-wise comparison approach. In IOP Conference Series: Earth and Environmental Science; IOP Publishing: Kuching, Malaysia, 2014; p. 012175. [Google Scholar]
- Kim, S.; Park, S.; Lee, J.S. Meso-or micro-scale? Environmental factors influencing pedestrian satisfaction. Transp. Res. Part D Transp. Environ. 2014, 30, 10–20. [Google Scholar] [CrossRef]
- Sotoude, H.; Ziari, K.; Gharakhlo, M. Evaluation of Satisfaction of Pedestrian Safety to Vehicles in Urban Environment, Case Study: Old Context of Marvdasht City. Curr. World Environ. 2015, 10, 268–275. [Google Scholar] [CrossRef] [Green Version]
- Ujang, N. Pedestrian satisfaction with aesthetic, attractiveness and pleasurability: Evaluating the walkability of ChaharaghAbbasi Street in Isfahan, Iran. ALAM CIPTA J. Sustain. Trop. Des. Res. Pract. 2013, 6, 13–22. [Google Scholar]
- Shaaban, K.; Muley, D.; Mohammed, A. Analysis of illegal pedestrian crossing behavior on a major divided arterial road. Transp. Res. Part F 2018, 54, 124–137. [Google Scholar] [CrossRef]
- Shaaban, K.; Muley, D.; Elnashar, D. Evaluating the effect of seasonal variations on walking behaviour in a hot weather country using logistic regression. Int. J. Urban Sci. 2018, 22, 382–391. [Google Scholar] [CrossRef]
- Shaaban, K.; Muley, D.; Elnashar, D. Temporal variation in walking behavior: An empirical study. Case Stud. Transp. Policy 2017, 5, 671–680. [Google Scholar] [CrossRef]
- Shaaban, K.; Muley, D. Investigation of weather impacts on pedestrian volumes. Transp. Res. Procedia 2016, 14, 115–122. [Google Scholar] [CrossRef]
- Qatar Second National Development Strategy 2018–2022. 2018. Available online: https://www.mdps.gov.qa/en/knowledge/Documents/NDS2Final.pdf (accessed on 1 May 2019).
- Astorri, F. Survey Finds Half the Population at Risk of Developing Lifestyle Diseases. The Peninsula Newspaper. Available online: http://thepeninsulaqatar.com/news/qatar/207259/survey-finds-half-the-population-at-risk-of-developing-lifestyle-diseases (accessed on 1 May 2019).
- Slackman, M. Privilege Pulls Qatar Toward Unhealthy Choices. The New York Times. Available online: http://www.nytimes.com/2010/04/27/world/middleeast/27qatar.html?_r=0 (accessed on 1 May 2019).
- LaRiccia, L.; Cittadino, A.; Fiermonte, F.; Garnero, G.; Guerreschi, P.; Vico, F. The Walkability of the Cities: Improving It Through the Reuse of Available Data and Raster Analyses. In Spatial Planning in the Big Data Revolution; IGI Global: Hershey, PA, USA, 2019; pp. 113–137. [Google Scholar]
- Parks, J.R.; Schofer, J.L. Characterizing neighborhood pedestrian environments with secondary data. Transp. Res. Part D Transp. Environ. 2006, 11, 250–263. [Google Scholar] [CrossRef]
- Elwood, S. Critical issues in participatory GIS: Deconstructions, reconstructions, and new research directions. Trans. GIS 2006, 10, 693–708. [Google Scholar] [CrossRef]
- Tomlinson, R.F. Thinking about GIS: Geographic Information System Planning for Managers; ESRI, Inc.: Redlands, CA, USA, 2007. [Google Scholar]
- Sipe, N.G.; Dale, P. Challenges in using geographic information systems (GIS) to understand and control malaria in Indonesia. Malar. J. 2003, 2, 36. [Google Scholar] [CrossRef]
- Yianna, F.; Poulicos, P. GIS Contribution for the Evaluation and Planning of Tourism: A Sustainable Tourism Perspective. 2011. Available online: http://www.gipsynoise.gr/HellasGI/KoinonikesPraktikes/papers/Farsaki.pdf (accessed on 1 May 2019).
- Göçmen, Z.A.; Ventura, S.J. Barriers to GIS use in planning. J. Am. Plan. Assoc. 2010, 76, 172–183. [Google Scholar] [CrossRef]
- Marais, H.J. The Status Quo of GIS in Municipal Town Planning Departments in Gauteng and in the Education of Town Planners. Ph.D. Thesie, University of Johannesburg, Johannesburg, South Afria, 2008. [Google Scholar]
- Poplin, A. Methodology for Measuring the Demand Geoinformation Transaction Costs: Based on Experiments in Berlin, Vienna and Zurich. IJSDIR 2010, 5, 168–193. [Google Scholar]
- Kyem, P.A.K. Power, participation, and inflexible institutions: An examination of the challenges to community empowerment in participatory GIS applications. Cartogr. Int. J. Geogr. Inf. Geovisualization 2001, 38, 5–17. [Google Scholar] [CrossRef]
- Elwood, S.; Ghose, R. PPGIS in community development planning: Framing the organizational context. Cartogr. Int. J. Geogr. Inf. Geovisualization 2001, 38, 19–33. [Google Scholar] [CrossRef]
- Kelly, C.; Tight, M.; Hodgson, F.; Page, M. A comparison of three methods for assessing the walkability of the pedestrian environment. J. Transp. Geogr. 2011, 19, 1500–1508. [Google Scholar] [CrossRef]
- Khisty, C.J. Evaluation of Pedestrian Facilities: Beyond the Level-of-Service Concept; Transportation Research Board: Washington, DC, USA, 1994. [Google Scholar]
- Landis, B.; Vattikuti, V.; Ottenberg, R.; McLeod, D.; Guttenplan, M. Modeling the roadside walking environment: Pedestrian level of service. Transp. Res. Rec. J. Transp. Res. Board 2001, 1773, 82–88. [Google Scholar] [CrossRef]
- Muraleetharan, T.; Adachi, T.; Uchida, K.-E.; Hagiwara, T.; Kagaya, S. A study on evaluation of pedestrian level of service along sidewalks and at crosswalks using conjoint analysis. Infrastruct. Plan. Rev. 2004, 21, 727–735. [Google Scholar] [CrossRef]
- Jaskiewicz, F. Pedestrian level of service based on trip quality. Transp. Res. Circ. TRB 2000, 21, 727–735. [Google Scholar]
- Jensen, S. Pedestrian and bicyclist level of service on roadway segments. Transp. Res. Rec. J. Transp. Res. Board 2007, 2031, 43–51. [Google Scholar] [CrossRef]
- Park, S.; Kang, J. Operationalizing walkability: Pilot study for a new composite walkability index based on walker perception. In Transportation Research Board 90th Annual Meeting; Transportation Research Board: Washington, DC, USA, 2011. [Google Scholar]
- Aghaabbasi, M.; Moeinaddini, M.; Shah, M.Z.; Asadi-Shekari, Z. A new assessment model to evaluate the microscale sidewalk design factors at the neighbourhood level. J. Transp. Health 2017, 5, 97–112. [Google Scholar] [CrossRef]
- Stevens, R.D. Walkability around Neighborhood Parks: An assessment of four parks in Springfield, Oregon. Ph.D. Thesis, University of Oregon, Eugene, OR, USA, 2005. [Google Scholar]
- Gallimore, J.M.; Brown, B.B.; Werner, C.M. Walking routes to school in new urban and suburban neighborhoods: An environmental walkability analysis of blocks and routes. J. Environ. Psychol. 2011, 31, 184–191. [Google Scholar] [CrossRef]
- Gori, S.; Petrelli, M. Walkability indicators for pedestrian friendly design walkability indicators for pedestrian friendly design walkability indicators for pedestrian friendly design. Transp. Res. Rec. 2014, 2464, 38–45. [Google Scholar] [CrossRef]
- Shaaban, K.; Gaweesh, S.; Ahmed, M. Characteristics and Mitigation Strategies for Cell Phone Use While Driving Among Young Drivers in Qatar. J. Transp. Health 2018, 8, 6–14. [Google Scholar] [CrossRef]
- Shaaban, K.; Pande, A. Evaluation of Red Light Camera Enforcement Using Traffic Violations. J. Traffic Transp. Eng. (Engl. Ed.) 2018, 5, 66–72. [Google Scholar] [CrossRef]
- Shaaban, K.; Wood, J.S.; Gayah, V.V. Investigating driver behavior at minor-street stop-controlled intersections in Qatar. Transp. Res. Rec. J. Transp. Res. Board 2017, 2663, 109–116. [Google Scholar] [CrossRef]
- Shaaban, K.; Abdelwarith, K. Understanding the association between cell phone use while driving and seat belt noncompliance in Qatar using logit models. J. Transp. Saf. Secur. 2018, 1–17. [Google Scholar] [CrossRef]
- Clark, B.; Chatterjee, K.; Davis, A. How and why commuting influences life satisfaction: A path analysis. In Transportation Research Board Annual Meeting. Compendium of Papers; Transportation Research Board: Washington, DC, USA, 2017. [Google Scholar]
- Cools, M.; Rongy, C.; Limbourg, S. Can Autonomous Vehicles Reduce Car Mobility? Evidence from a Stated Adaptation Experiment in Belgium. In Transportation Research Board Annual Meeting. Compendium of Papers; Transportation Research Board: Washington, DC, USA, 2017. [Google Scholar]
- Dawes, J. Do data characteristics change according to the number of scale points used? An experiment using 5-point, 7-point and 10-point scales. Int. J. Mark. Res. 2008, 50, 61–104. [Google Scholar] [CrossRef]
- Carifio, J.; Perla, R.J. Ten common misunderstandings, misconceptions, persistent myths and urban legends about Likert scales and Likert response formats and their antidotes. J. Soc. Sci. 2007, 3, 106–116. [Google Scholar] [CrossRef]
- Xiong, J.; Liu, J.; Guan, J.; Sun, J.; Liu, X.; Wen, H. The minimum sample size determination of floating car in Beijing expressway. J. Transp. Syst. Eng. Inf. Technol. 2010, 10, 38–43. [Google Scholar]
- Ferman, M.A.; Blumenfeld, D.E.; Dai, X. A simple analytical model of a probe-based traffic information system. In Proceedings of the 2003 IEEE International Conference on Intelligent Transportation Systems, Shanghai, China, 12–15 October 2003; Volume 1, pp. 263–268. [Google Scholar]
- Parma, K.D.; Koprowski, Y.; Zhang, W. Origin-Destination and Travel Time Measurement Using Bluetooth Technology: Results and Lessons Learned. In ITE Technical Conference and ExhibitInstitute for Transportation Engineers; Institute of Transportation Engineers: Boston, MA, USA, 2013. [Google Scholar]
- Maddock, J.E.; Ramirez, V.; Zhang, M.; Brunner, I.M.; Heinrich, K.M. A statewide observational assessment of the pedestrian and bicycling environment in Hawaii 2010. Prev. Chronic Dis. 2012, 9, e14. [Google Scholar] [CrossRef]
- McMillan, T.E.; Cubbin, C.; Parmenter, B.; Medina, A.V.; Lee, R.E. Neighborhood sampling: How many streets must an auditor walk? Int. J. Behav. Nutr. Phys. Act. 2010, 7, 20. [Google Scholar] [CrossRef] [PubMed]
- Agrawal, A.W.; Schlossberg, M.; Irvin, K. How far, by which route and why? A spatial analysis of pedestrian preference. J. Urban Des. 2008, 13, 81–98. [Google Scholar] [CrossRef]
- Pikora, T.J.; Bull, F.C.; Jamrozik, K.; Knuiman, M.; Giles-Corti, B.; Donovan, R.J. Developing a reliable audit instrument to measure the physical environment for physical activity. Am. J. Prev. Med. 2002, 23, 187–194. [Google Scholar] [CrossRef]
- Tageldin, A.; Sayed, T.; Shaaban, K. Comparison of Time-Proximity and Evasive Action Conflict Measures: Case Studies from Five Cities. Transp. Res. Rec. J. Transp. Res. Board 2017, 2661, 19–29. [Google Scholar] [CrossRef]
Figure 1.
Sample of sidewalk problems. Source: Author.

Figure 2.
Location map of the selected neighborhoods. Source: Google Earth (edited by the author).


Table 1.
Factors considered in previous studies.
| Factors Considered | Study |
|---|---|
| Comfort, convenience, continuity, safety, security, attractiveness, and system coherence. | Khisty [37] |
| Buffer zone, traffic volume, speed of the vehicle, driveway access frequency, and volume. | Landis et al. [38] |
| Sidewalk width, buffer zone, pedestrian volume, flow rate, and bicycle events. | Muraleetharan et al. [39] |
| Buffer zone, shade trees, physical condition, transparency, enclosure, complexity of path, building articulation, complexity of spaces, and overhang components/condition. | Jaskiewicz [40] |
| Sidewalk width, walking environment, pedestrian volume, parked vehicle, bicycle track width, buffer zones, and landscape. | Jensen [41] |
| Pedestrian crossings, buffer zones, sidewalk condition, sidewalk facilities, street scale and enclosure, and nearby buildings and properties. | Kelly et al. [36] |
| Sidewalk condition, curb-to-curb roadways, pedestrian crossings, buffer zones, sidewalk facilities, street scale and enclosure, and nearby buildings and properties. | Park and Kang [42] |
| Sidewalk width, sidewalk surface, curb ramps, tactile pavements, utilities, and landscape. | Aghaabbasi et al. [43] |
Table 2.
List of sidewalk indicators.
| Sidewalk Indicator | Description |
|---|---|
| Obstructions | Obstructions are defined as any permanent objects that obstruct the pedestrian path and reduce the width of the sidewalk below the allowed minimum. Sidewalk obstructions are usually caused by utility poles, tree trunks, signposts, fire hydrant, etc., which obstruct pedestrians on the sidewalk. |
| Continuity | The continuity of the sidewalk is important for pedestrians, especially disabled or elderly pedestrians. Continuous sidewalks are those sidewalks that do not have any up and downs. The continuous ups and downs make the sidewalk uncomfortable to use by pedestrians. |
| Physical Condition | The sidewalk physical condition affects the walking environment of pedestrians. This condition determines how difficult an area is to negotiate. A sidewalk surface should be firm, stable, slip-resistant, and free from cracks, bumps, and vertical faults for comfortable walking. |
| Encroachments | Encroachments are any temporary objects caused by commercial or any other activities that obstruct the sidewalk and reduce its width below the allowed minimum. Encroachments can be a garbage bin, plants, bushes, hoardings, cones, advertising signs, restaurant tables, vehicles parked on the street, etc. |
| Cleanliness | The walking environment should be a pleasant experience. The environment is governed by the surroundings of the facility. The sidewalk should be clean and free of litter, broken glass, etc. |
| Width | The width of the sidewalk affects pedestrian serviceability. Sidewalks should be sufficiently wide so that pedestrians can walk and separate themselves from road traffic and avoid street furniture, obstructions, and other pedestrians. The width of the sidewalk available to the pedestrian was measured. |
| Slope | A steep slope of a sidewalk can make pedestrians in wheelchairs or any other mobility devices uncomfortable. |
| Shade Trees | The presence of trees along the sidewalk increases the comfort level of pedestrians, especially during hot weather. Shade trees can keep pedestrians cool, protect them from the sun, and add a nice aesthetic element. |
| Buffer Zone | A buffer zone between the street and pedestrians greatly increases the comfort and safety of pedestrians and reduces the chance of a crash. |
Table 3.
Levels of sidewalk indicators.
| Indicator * | Level | |||
|---|---|---|---|---|
| Obstructions | (1) >5 obstructions | (2) 5–4 obstructions | (3) 3–2 obstructions | (4) 1–0 obstruction |
| Continuity | (1) No sidewalk along the segment | (2) Missing some sections | (3) Missing few sections | (4) Continuous |
| Physical Condition | (1) Many cracks/breaks | (2) Some cracks/breaks | (3) Few cracks/breaks | (4) No cracks/breaks |
| Encroachments | (1) Many encroachments | (2) Some encroachments | (3) No encroachments | |
| Cleanliness | (1) Large amount of litter | (2) Some litter | (3) Small amount of litter | (4) No litter |
| Width | (1) <5 ft | (2) 5–10 ft | (3) >10 ft | |
| Slope | (1) Cannot be used by a wheelchair | (2) Steep/uncomfortable | (3) Few steep sections | (4) Comfortable |
| Shade Trees | (1) No trees | (2) Some trees | (3) Many trees | |
| Buffer Zone | (1) <3 ft | (2) 3–6 ft | (3) >6 ft | |
* Indicator collected for segments every 200 feet.
Table 4.
List of corridor indicators.
| Crossing Facilities | |
|---|---|
| Crossing Availability | Pedestrian crossing facilities are needed to protect the pedestrians from the danger of conflicting with vehicles. Providing safe crossing facilities along a corridor can be in the form of intersections, mid-block crossings, pedestrian bridges, underpasses, etc. |
| Crossing Sight Distance | If the pedestrian crossing points are blocked in a way that limits the view of traffic by parked vehicles, trees, or plants, this makes entry onto or across a street difficult or dangerous. |
| Pedestrian Signal Availability | Pedestrian signals provide safe conditions for pedestrians to cross during pedestrian crossing phases. Pedestrian signals and the associated pedestrian pushbuttons were checked for availability and functionality. |
| Curb Ramp Availability | Curb ramps are necessary for pedestrians who use mobility devices and for blind and low-vision users to have a convenient transition between the sidewalk and the street. To be compliant, a curb ramp must have a proper running slope and a detectable warning surface. |
| Sidewalk Facilities | |
| Seats and Benches | The sidewalk facilities were measured using five variables as indicated below. Provision of chairs and benches for pedestrians to stop and rest, particularly for older people and young children, is another factor that adds to the comfort of pedestrians. |
| Shelters from Rain or Sun | Pedestrians need places to shelter from the severe weather conditions, such as intense sun and heavy rain. Examples include transit stops, trees, etc. |
| Security and Safety | Pedestrians should feel safe while using a sidewalk. The availability of police patrolling, security guards, and/or sufficient activities on the surrounding areas is necessary to ensure safety. |
| Transit Stops | The presence of transit stops is one of the key elements that attracts pedestrian activities. |
| Street Lighting | Providing lighting along the street greatly increases the comfort and safety of pedestrians and makes pedestrians visible for drivers, reducing the chance of being involved in a crash. |
| Driver Behavior | |
| Drivers Yield to Pedestrians | One of the main reasons for pedestrian crashes is drivers failing to yield to pedestrians. The driver behavior for 10 vehicles was observed at crosswalks, stop signs, and traffic signals and the number of drivers who did not yield to pedestrians was recorded. |
| Drivers Obey Stop/Yield Signs | The diver behavior for 10 vehicles was observed at stop/yield sign controlled intersections and the number of drivers who did comply with the stop/yield signs was recorded. |
| Drivers Obey Traffic Signals | The diver behavior for 10 vehicles was observed at signalized intersections and the number of drivers who did comply with the traffic signal was recorded. |
| Drivers Speeding | Vehicle speeds along a specific corridor affect the perceived safety of pedestrians. The diver behavior for 10 vehicles was observed and the number of drivers who were observed speeding was recorded. |
| Drivers Obey Crosswalks | Pedestrians have the right to clear crosswalks while crossing. The diver behavior for 10 vehicles was observed at all crosswalks and the number of drivers who stopped beyond the crosswalks was recorded. |
| Traffic Volume | The presence of vehicles is one of the main influential factors on walkability. In general, having fewer vehicles, not too many trucks, less exhaust fumes, and less noise encourages pedestrians to walk. |
| Traffic-Calming Measures | The availability of traffic-calming devices along a street, such as speed humps, roundabouts, and splitter islands, can reduce the speed of the drivers and increase the perceived safety of the pedestrians. |
Table 5.
Levels of Corridor Indicators.
| Indicator | Level | |||
|---|---|---|---|---|
| Crossing Availability | (1) No suitable crossings points | (2) Low number of suitable crossings points | (3) Moderate number of suitable crossings points | (4) High number of suitable crossing points |
| Crossing Sight Distance | (1) Most crossing points are blocked | (2) Some crossing points are blocked | (3) Most crossing points are not blocked | |
| Pedestrian Signal Availability | (1) Not available | (2) Available but not up to standard | (3) Available and up to standard | |
| Curb Ramp Availability | (1) Not available | (2) Available but not up to standard | (3) Available and up to standard but need maintenance | (4) Available and up to standard |
| Seats and Benches | (1) Not available | (2) Some available | (3) Many available | |
| Shelters from Rain or Sun | (1) Not available | (2) Some available | (3) Many available | |
| Security and Safety | (1) Not available | (2) Police patrolling, security guards, or sufficient activities available | (3) Multiple activities available | |
| Transit Stops | (1) Not available | (2) Limited number of transit stops available | (3) Multiple transit stops available | |
| Street Lighting | (1) Not available | (2) Some lighting due to businesses, houses, some scattered poles, etc. | (3) Light poles available along the street | |
| Drivers Yield to Pedestrians * | (1) >5 | (2) 2–5 | (3) <2 | |
| Drivers Obey Stop/Yield Signs * | (1) >5 | (2) 2–5 | (3) <2 | |
| Driver Obey Traffic Signals * | (1) >5 | (2) 2–5 | (3) <2 | |
| Drivers Speeding * | (1) >5 | (2) 2–5 | (3) <2 | |
| Driver Obey Crosswalks * | (1) >5 | (2) 2–5 | (3) <2 | |
| Traffic Volume | (1) Heavy traffic with trucks | (2) Heavy traffic/not many trucks | (3) Light traffic with trucks | (4) Light traffic/not many trucks |
| Traffic-Calming Measures | (1) Not available | (2) Some measures available | (3) Multiple measures available | |
* Measured as the average of 10 vehicles per location.
Table 6.
Details of the selected neighborhoods and streets.
| Neighborhood | Area (km2) | Population | Street Name | Number of Segments (200 ft/61 m Each) | |
|---|---|---|---|---|---|
| Side 1 | Side 2 | ||||
| Fereej Abdul Aziz | 0.5 | 10,808 | Al Farabi Street | 11 | 11 |
| Al Dafna | 1.1 | 2801 | Al Corniche Street | 19 | 19 |
| Al Doha Al Jadeeda | 0.5 | 13,059 | Al Doha Al Jadeeda Street | 9 | 9 |
| Al Hilal | 1.8 | 16,861 | Hassan Bin Thabit Street | 13 | 10 |
| Al Sadd | 3.5 | 14,113 | Al Difaaf Street | 11 | 11 |
| Fereej Al Soudan | 18.1 | 23,591 | Al Waab Street | 13 | 13 |
| Leqtaifiya | 25.4 | 22,168 | Onaiza Street | 21 | 21 |
| Nuaija | 1.2 | 13,357 | Ahmad bin Zaidon Street | 12 | 12 |
| Old Airport | 4.7 | 44,275 | Al Matar Al Qadeem Street | 32 | 32 |
| The Pearl | Not Available * | Pearl Boulevard | 24 | 24 | |
* New neighborhood under construction.
Table 7.
Scores of the sidewalk indicators.
| Indicator | Side of the Road | Obstructions ^ | Continuity ^ | Physical Condition ^ | Encroachments # | Cleanliness ^ | Width # | Slope ^ | Shade Trees # | Buffer Zone # | Average Score |
|---|---|---|---|---|---|---|---|---|---|---|---|
| Fereej Abdul Aziz | Side 1 | 1.64 | 1.36 | 1.36 | 1.36 | 2.09 | 1.09 | 1.00 | 1.00 | 1.00 | 1.32 |
| Side 2 | 1.00 | 1.18 | 1.55 | 1.00 | 2.45 | 1.00 | 1.00 | 1.18 | 1.00 | 1.26 | |
| Overall | 1.32 | 1.27 | 1.46 | 1.18 | 2.27 | 1.05 | 1.00 | 1.09 | 1.00 | 1.29 | |
| Al Dafna | Side 1 | 3.32 | 3.79 | 2.89 | 2.84 | 3.21 | 1.74 | 3.16 | 1.21 | 1.58 | 2.64 |
| Side 2 | 3.42 | 3.79 | 3.79 | 2.95 | 3.89 | 2.37 | 3.32 | 1.11 | 2.68 | 3.04 | |
| Overall | 3.37 | 3.79 | 3.34 | 2.90 | 3.55 | 2.06 | 3.24 | 1.16 | 2.13 | 2.84 | |
| Al Doha Al Jadeeda | Side 1 | 2.22 | 1.67 | 1.78 | 1.00 | 2.00 | 1.00 | 1.00 | 1.00 | 1.00 | 1.41 |
| Side 2 | 2.78 | 3.33 | 2.22 | 1.67 | 2.00 | 1.11 | 1.33 | 1.22 | 1.22 | 1.88 | |
| Overall | 2.50 | 2.50 | 2.00 | 1.34 | 2.00 | 1.06 | 1.17 | 1.11 | 1.11 | 1.64 | |
| Al Hilal | Side 1 | 3.92 | 2.92 | 2.62 | 2.46 | 3.54 | 2.08 | 3.08 | 1.31 | 2.54 | 2.72 |
| Side 2 | 3.60 | 2.80 | 2.80 | 1.90 | 3.70 | 2.30 | 2.80 | 2.10 | 2.10 | 2.68 | |
| Overall | 3.76 | 2.86 | 2.71 | 2.18 | 3.62 | 2.19 | 2.94 | 1.71 | 2.32 | 2.70 | |
| Al Sadd | Side 1 | 2.82 | 3.09 | 2.82 | 2.00 | 2.55 | 0.91 | 1.09 | 1.09 | 1.00 | 1.93 |
| Side 2 | 2.82 | 3.00 | 3.00 | 2.09 | 3.36 | 1.91 | 2.45 | 1.00 | 1.45 | 2.34 | |
| Overall | 2.82 | 3.05 | 2.91 | 2.05 | 2.96 | 1.41 | 1.77 | 1.05 | 1.23 | 2.14 | |
| Fereej Al Soudan | Side 1 | 1.23 | 1.92 | 1.23 | 1.85 | 1.31 | 1.38 | 1.08 | 1.38 | 1.38 | 1.42 |
| Side 2 | 1.00 | 1.31 | 1.77 | 1.69 | 1.23 | 1.31 | 1.54 | 1.54 | 1.31 | 1.41 | |
| Overall | 1.12 | 1.62 | 1.50 | 1.77 | 1.27 | 1.35 | 1.31 | 1.46 | 1.35 | 1.41 | |
| Leqtaifiya | Side 1 | 1.81 | 1.90 | 2.57 | 1.33 | 2.81 | 1.48 | 1.57 | 1.95 | 1.48 | 1.88 |
| Side 2 | 2.38 | 2.00 | 2.62 | 1.67 | 2.81 | 1.52 | 1.67 | 1.71 | 1.52 | 1.99 | |
| Overall | 2.10 | 1.95 | 2.60 | 1.50 | 2.81 | 1.50 | 1.62 | 1.83 | 1.50 | 1.93 | |
| Nuaija | Side 1 | 4.00 | 1.33 | 2.27 | 3.00 | 2.92 | 1.25 | 1.42 | 1.00 | 1.00 | 2.02 |
| Side 2 | 4.00 | 2.00 | 1.92 | 1.83 | 2.08 | 1.67 | 1.00 | 1.33 | 1.00 | 1.87 | |
| Overall | 4.00 | 1.67 | 2.10 | 2.42 | 2.50 | 1.46 | 1.21 | 1.17 | 1.00 | 1.95 | |
| Old Airport | Side 1 | 3.78 | 3.59 | 3.38 | 2.28 | 3.97 | 1.00 | 3.53 | 1.09 | 1.84 | 2.72 |
| Side 2 | 3.97 | 3.69 | 3.56 | 2.66 | 3.91 | 1.00 | 3.56 | 1.03 | 1.00 | 2.71 | |
| Overall | 3.88 | 3.64 | 3.47 | 2.47 | 3.94 | 1.00 | 3.55 | 1.06 | 1.42 | 2.71 | |
| The Pearl | Side 1 | 4.00 | 4.00 | 4.00 | 2.71 | 4.00 | 1.83 | 4.00 | 1.79 | 2.46 | 3.20 |
| Side 2 | 4.00 | 4.00 | 4.00 | 2.83 | 3.92 | 2.38 | 4.00 | 1.96 | 2.92 | 3.33 | |
| Overall | 4.00 | 4.00 | 4.00 | 2.77 | 3.96 | 2.11 | 4.00 | 1.88 | 2.69 | 3.27 |
# Measured on a three-point scale; ^ measured on a four-point scale.
Table 8.
Scores of the corridor indicators.
| Neighborhood | Side | Land Use * | Crossing Facilities | Sidewalk Facilities | Driver Behavior | ||||||||||||||
|---|---|---|---|---|---|---|---|---|---|---|---|---|---|---|---|---|---|---|---|
| Crossing Availability | Crossing Sight Distance | Pedestrian Signal Availability | Curb Ramp Availability | Seats and Benches | Shelters from Rain and Sun | Security and Safety | Transit Stops | Street Lighting | Drivers Yield to Pedestrians | Drivers Obey Stop/Yield Signs | Drivers Obey Traffic Signals | Drivers Speeding | Drivers Obey Crosswalks | Traffic Volume | Traffic-Calming Measures | Average Score | |||
| Fereej Abdul Aziz | Side 1 | C | 1 | 1 | 1 | 1 | 1 | 1 | 1 | 1 | 2 | 3 | 3 | 3 | 3 | 3 | 1 | 1 | 1.69 |
| Side 2 | C | 1 | 1 | 1 | 1 | 1 | 1 | 1 | 1 | 2 | 3 | 3 | 3 | 3 | 3 | 1 | 1 | 1.69 | |
| Overall | C | 1 | 1 | 1 | 1 | 1 | 1 | 1 | 1 | 2 | 3 | 3 | 3 | 3 | 3 | 1 | 1 | 1.69 | |
| Al Dafna | Side 1 | C | 4 | 3 | 3 | 3 | 1 | 1 | 2 | 2 | 3 | 1 | 2 | 1 | 3 | 1 | 2 | 1 | 2.06 |
| Side 2 | C | 4 | 3 | 3 | 3 | 1 | 2 | 2 | 2 | 3 | 2 | 3 | 1 | 2 | 1 | 2 | 1 | 2.19 | |
| Overall | C | 4 | 3 | 3 | 3 | 1 | 1.5 | 2 | 2 | 3 | 1.5 | 2.5 | 1 | 2.5 | 1 | 2 | 1 | 2.13 | |
| Al Doha Al Jadeeda | Side 1 | R/C | 1 | 2 | 1 | 1 | 1 | 1 | 1 | 1 | 2 | 3 | 3 | 3 | 3 | 3 | 2 | 1 | 1.81 |
| Side 2 | R/C | 1 | 2 | 1 | 1 | 1 | 1 | 1 | 1 | 2 | 3 | 3 | 3 | 3 | 3 | 2 | 1 | 1.81 | |
| Overall | R/C | 1 | 2 | 1 | 1 | 1 | 1 | 1 | 1 | 2 | 3 | 3 | 3 | 3 | 3 | 2 | 1 | 1.81 | |
| Al Hilal | Side 1 | R/C | 1 | 2 | 1 | 3 | 1 | 1 | 1 | 1 | 3 | 1 | 1 | 1 | 2 | 1 | 4 | 3 | 1.69 |
| Side 2 | R/C | 2 | 2 | 1 | 3 | 1 | 1 | 1 | 1 | 3 | 1 | 1 | 1 | 1 | 1 | 4 | 2 | 1.63 | |
| Overall | R/C | 1.5 | 2 | 1 | 3 | 1 | 1 | 1 | 1 | 3 | 1 | 1 | 1 | 1.5 | 1 | 4 | 2.5 | 1.66 | |
| Al Sadd | Side 1 | C | 2 | 1 | 1 | 1 | 1 | 1 | 1 | 1 | 2 | 3 | 3 | 1 | 1 | 2 | 2 | 3 | 1.63 |
| Side 2 | C | 1 | 2 | 1 | 3 | 1 | 2 | 1 | 1 | 2 | 3 | 3 | 2 | 1 | 1 | 2 | 2 | 1.75 | |
| Overall | C | 1.5 | 1.5 | 1 | 2 | 1 | 1.5 | 1 | 1 | 2 | 3 | 3 | 1.5 | 1 | 1.5 | 2 | 2.5 | 1.69 | |
| Fereej Al Soudan | Side 1 | R | 1 | 3 | 1 | 1 | 1 | 1 | 1 | 1 | 1 | 1 | 1 | 1 | 1 | 1 | 4 | 3 | 1.44 |
| Side 2 | R | 2 | 3 | 1 | 3 | 1 | 1 | 1 | 1 | 3 | 2 | 1 | 1 | 1 | 1 | 4 | 2 | 1.75 | |
| Overall | R | 1.5 | 3 | 1 | 2 | 1 | 1 | 1 | 1 | 2 | 1.5 | 1 | 1 | 1 | 1 | 4 | 2.5 | 1.59 | |
| Leqtaifiya | Side 1 | R/C | 1 | 3 | 3 | 1 | 1 | 1 | 1 | 1 | 3 | 2 | 1 | 2 | 2 | 3 | 4 | 1 | 1.88 |
| Side 2 | R/C | 2 | 3 | 3 | 3 | 1 | 1 | 1 | 1 | 3 | 2 | 3 | 1 | 1 | 1 | 3 | 1 | 1.88 | |
| Overall | R/C | 1.5 | 3 | 3 | 2 | 1 | 1 | 1 | 1 | 3 | 2 | 2 | 1.5 | 1.5 | 2 | 3.5 | 1 | 1.88 | |
| Nuaija | Side 1 | R/C | 1 | 3 | 1 | 1 | 1 | 1 | 2 | 2 | 3 | 1 | 1 | 1 | 2 | 1 | 4 | 2 | 1.69 |
| Side 2 | R | 2 | 3 | 1 | 3 | 1 | 1 | 2 | 1 | 2 | 1 | 1 | 1 | 1 | 1 | 4 | 2 | 1.69 | |
| Overall | R/C | 1.5 | 3 | 1 | 2 | 1 | 1 | 2 | 1.5 | 2.5 | 1 | 1 | 1 | 1.5 | 1 | 4 | 2 | 1.69 | |
| Old Airport | Side 1 | C | 1 | 2 | 1 | 2 | 1 | 1 | 2 | 3 | 2 | 2 | 2 | 1 | 1 | 2 | 3 | 3 | 1.81 |
| Side 2 | C | 3 | 2 | 1 | 2 | 1 | 1 | 2 | 3 | 2 | 2 | 2 | 2 | 3 | 1 | 3 | 3 | 2.06 | |
| Overall | C | 2 | 2 | 1 | 2 | 1 | 1 | 2 | 3 | 2 | 2 | 2 | 1.5 | 2 | 1.5 | 3 | 3 | 1.94 | |
| The Pearl | Side 1 | R | 1 | 2 | 1 | 1 | 1 | 1 | 2 | 1 | 3 | 1 | 1 | 1 | 2 | 3 | 3 | 1 | 1.56 |
| Side 2 | R | 2 | 3 | 1 | 1 | 1 | 1 | 2 | 1 | 3 | 1 | 1 | 1 | 1 | 1 | 4 | 1 | 1.56 | |
| Overall | R | 1.5 | 2.5 | 1 | 1 | 1 | 1 | 2 | 1 | 3 | 1 | 1 | 1 | 1.5 | 2 | 3.5 | 1 | 1.56 | |
* C denotes commercial land use; R denotes residential land use.
© 2019 by the author. Licensee MDPI, Basel, Switzerland. This article is an open access article distributed under the terms and conditions of the Creative Commons Attribution (CC BY) license (http://creativecommons.org/licenses/by/4.0/).
Share and Cite
MDPI and ACS Style
Shaaban, K. Assessing Sidewalk and Corridor Walkability in Developing Countries. Sustainability 2019, 11, 3865. https://doi.org/10.3390/su11143865
AMA Style
Shaaban K. Assessing Sidewalk and Corridor Walkability in Developing Countries. Sustainability. 2019; 11(14):3865. https://doi.org/10.3390/su11143865
Chicago/Turabian StyleShaaban, Khaled. 2019. "Assessing Sidewalk and Corridor Walkability in Developing Countries" Sustainability 11, no. 14: 3865. https://doi.org/10.3390/su11143865
Note that from the first issue of 2016, this journal uses article numbers instead of page numbers. See further details here.