Optimization of Just-In-Sequence Supply: A Flower Pollination Algorithm-Based Approach


1
Institute of Logistics, University of Miskolc, 3515 Miskolc, Hungary
2
Zalaegerszeg Faculty of Business Administration, Budapest Business School, 8900 Zalaegerszeg, Hungary
3
Department of Business Information Technology, Budapest Business School, 1149 Budapest, Hungary
4
Fraunhofer Institute for Factory Operation and Automation, 39106 Magdeburg, Germany
*
Author to whom correspondence should be addressed.
Sustainability 2019, 11(14), 3850; https://doi.org/10.3390/su11143850
Submission received: 17 June 2019
/
Revised: 2 July 2019
/
Accepted: 11 July 2019
/
Published: 15 July 2019
(This article belongs to the Special Issue Sustainable and Intelligent Transportation Systems)
Abstract
:The just-in-sequence inventory strategy, as an important part of the supply chain solutions in the automotive industry, is based on feedback information from the manufacturer. The performance, reliability, availability and cost efficiency are based on the parameters of the members of the supply chain process. To increase the return on assets (ROA) of the manufacturer, the optimization of the supply process is unavoidable. Within the frame of this paper, the authors describe a flower pollination algorithm-based heuristic optimization model of just-in-sequence supply focusing on sustainability aspects, including fuel consumption and emission. After a systematic literature review, this paper introduces a mathematical model of just-in-sequence supply, including assignment and scheduling problems. The objective of the model is to determine the optimal assignment and schedule for each sequence to minimize the total purchasing cost, which allows improving cost efficiency while sustainability aspects are taken into consideration. Next, a flower pollination algorithm-based heuristic is described, whose performance is validated with different benchmark functions. The scenario analysis validates the model and evaluates its performance to increase cost-efficiency in just-in-sequence solutions.
1. Introduction
The optimal design and control of logistics systems and supply chain solutions is one of the most important tasks of the global economy since production and service companies can reduce their costs substantially by reducing logistics-related expenditures including the costs of transportation, warehousing and materials handling [1]. The logistics systems, as an integrator of the closed loop economy, coordinate and operate the supply chain from the purchasing of raw materials required for the final products to the recycling/reuse of used products covering the four functional parts of logistics: purchasing, production, distribution, and recycling as inverse processes [2]. The increase of performance can be achieved by the aid of fulfilling logistics strategies, such as capacity utilization, reducing inventories, increasing flexibility, improving the direct response to customer needs, reducing lead times, and increasing transparency of systems and processes [3]. Probably one of the most popular tools is the just-in-time (JIT) supply strategy [4] and the newer, so-called just-in-sequence (JIS) supply strategy [5]. The extension of the JIT concept, known as JIS, has attracted broader attention, especially in the automotive industry [6]. According to the literature, the just-in-sequence supply strategy is based on just-in-time philosophy [5], except that the goal is not only to fulfil the 7R rule (right product, right place, right time, right quantity, right condition, right customer, right cost) but also to ensure the requested sequence of products. The motivation of this paper is that supply chain solutions must be not only be cost efficient and reliable but also sustainable and, therefore, new optimization models and methods can be developed and applied. We can take important steps towards sustainability in the fields of supply chain management by improvement of processes. These steps are important for companies because they have a significant effect on competitiveness [7]. This paper is organized, as follows. Section 2 presents a systematic literature review to summarize the research background. Section 3 presents the model framework and mathematical model of JIS supply in the case of interconnected logistics systems. Section 4 presents an enhanced version of harmony search (HS) heuristics. This section describes new operators for the heuristics and their increased performance is validated using benchmarking functions. Section 5 presents the numerical analysis of case studies. Conclusions and future research directions are discussed in the last section.
2. Literature Review
2.1. Conceptual Framework and Review Methodology
Our used methodology of systematic literature review includes the following aspects: (i) definition of research questions; (ii) select sources to the literature, like Scopus, Science Direct, Web of Science ResearchGate, or Google Scholar; (iii) reduce the number of articles by reading them and identify the main topic; (iv) define a methodology to analyze the chosen articles; (v) describe the main scientific results and (vi) identify the scientific gaps and bottlenecks [8].
Firstly, the relevant terms were defined. It is a crucial phase of the review because there are excellent review articles in the field of supply chain management and we did not want to produce an almost similar review. We used the following keywords to search among article titles, abstracts and keywords in the Scopus database: “just in time” AND “supply” AND “network”. Initially, 149 articles were identified. This list was reduced to 79 articles selecting journal articles only. Our search was conducted in July 2018; therefore, new articles may have been published since then.
2.2. Descriptive Analysis
The reduced articles can be classified depending on the subject area. Figure 1 shows the classification of these 79 articles considering 10 subject areas. This classification shows the majority of engineering, business and management, decision and computer sciences.
As Figure 2 demonstrates, the networking aspect of just-in-time supply has been researched in the past 20 years. One of the first articles in this field was published in 1996 in the field of quantifying the relative improvements of redesign strategies in supply chain solutions [9] and it was focusing on dynamic implications of various supply chain redesign strategies.
The distribution of the most frequently used keywords is depicted in Figure 3. As the keywords show, the design of complex just-in-time supply solutions is based on optimization methods while the focus is on inventory control, scheduling and sales. Networked just-in-time supply has a great impact on the whole value chain. Therefore enterprise resource planning solutions are important tools for the design and control of JIT/JIS supply.
Articles were analyzed from a scientific impact point of view. The most usual form to evaluate articles from the scientific impact point of view is the citation. Figure 4 shows the 10 most cited articles with their number of citations [10,11,12,13,14,15,16,17,18,19].
In the following step, the 79 articles were reduced after reading them. We excluded articles whose topic did not match our interest and cannot be addressed to the energy efficiency of supply chain solutions. After this reduction, we obtained 55 articles.
2.3. Content Analysis
The literature introduces a wide range of methods used to solve problems of just-in-time supply domain, like continuous approximation approach, design structure matrix simulation, the combination of mixed integer programming and metaheuristics, simulation, genetic algorithm, particle swarm optimization, integrated ant colony optimization and local search, fuzzy modelling, statistical tools, decision support systems and analytical target cascading. A continuous approximation model with non-linear programming techniques was used to model closed-loop supply chain network designs considering RFID adoption [20]. A design structure matrix simulation approach analysis was adopted to propose an optimal enterprise SCM-networked value-adding, customized master data-management platform for efficient SCM network information exchange and an effective supply-chain (SC) network systems–design teams’ structure [21]. In the case of deterministic demand, a combinatorial optimization approach was used combining mixed integer programming and metaheuristics [22]. Simulation makes it possible to analyze large-scale, robust supply chain solutions. A discrete event simulation model has been developed to improve the cross-docking operations of a large grocery retailer [23], and simulation experiments were used to analyze asynchronous shipment and creation of containers within an interconnected network of services [24]. The impact of just-in-time supply on job-shop scheduling was studied using a genetic algorithm (GA) [25]. GA is a robust heuristic algorithm, and it is suitable for the development of combined metaheuristic solutions. GA was combined with particle swarm optimization (PSO) for optimizing a mathematical model with a JIT system for a defective goods supply chain network [26]. Researchers proposed GA for optimizing a novel mathematical model of the defective goods supply chain network [27]. The dynamic vehicle routing problem (DVRP) and stochastic dynamic travelling salesman problem with hard time window (SDTSPTW) [11] is a core optimization task of just-in-time supply solutions. A hybrid metaheuristic was supposed including artificial ant colony (AACO) and local search to solve the DVRP [28]. A fuzzy bi-objective mixed integer linear programming formulation and solution methodology was proposed for a multi-echelon, multi-product and multi-period supply chain planning, where the fuzzy chance-constrained programming was applied to transform the fuzzy model into an auxiliary crisp model [29]. Statistical tools can support the analysis of JIT/JIS solutions; the use of statistics in the hybrid framework of thesupply chain including suppliers, inputs, processes, outputs and customers (SIPOC) provided better insight into the process performance, and process control, while define, measure, analyze, improve and control (DMAIC) were taken into consideration [30]. Decision support models and systems allow decision makers to perform what-if analyses to evaluate different scenarios in JIT/JIS supply chain [31]. Studies validate the usability of the analytical target cascading method to improve supply chain configuration for product families [32]. The analytical hierarchy process (AHP) is used for analyzing the customer-specific requirements for logistics service and for evaluating the alternative warehouse operators [12].
The objective functions and indicators of the design of JIT/JIS supply chains can include a wide range of aspects, like inventory, risk, costs, transportation performance, vendor management inventory, CO2 emission, location adjustment, service level, policies and contracts. Inventory planning and the optimization of the inventory level is an especially complex problem in the case of equipment-intensive service industries involving repair and maintenance operations. In this context, tactical inventory planning is based on demand forecasts and in the face of conflicting business objectives is a crucial problem [22]. The vendor managed inventory (VMI) becomes increasingly important in JIT/JIS supply. Researches results suggest that VMI and just-in-time production are substituted in improving the performance of supply chain solutions, especially in the case of a networking environment [33]. Manufacturing companies adopt a lean paradigm, in particular, JIT/JIS supply. A quantitative risk analysis examines the project’s systems engineering management plan to analyze the impact of project’s lifecycle [34]. The operation cost is the objective function in the supply planning models under a just-in-time manufacturing environment with reverse logistics in several articles [35]. The horizontal and vertical cooperation among supply chain members makes the processes more and more complex, where the analysis of cost and inventory benefits is a core research topic, especially in the case of multi-period and multi-product supply chain solutions [36]. Scheduling models were used to validate the idea that timely distribution can be viewed as a hybrid combination of planning, scheduling and routing problems; this problem can be described as a trade-off between risks and profits [18]. The scheduling and production planning aspect is especially important in the case of agile production planning system, where JIT/JIS supply is unavoidable. J2EE/Web service technology can support the efficient production data transfer and sharing among the members of the supply chain, including agile manufacturing companies, suppliers and logistics service providers [37]. In the automotive industry, JIT/JIS delivery has become increasingly commonplace; fast and reliable delivery needs the precious design of transportation tasks, especially in the case of increased complexity of processes and systems [16]. JIT/JIS supply and locational adjustment in the global automotive industry is important from the different inventory and supply-chain management approaches point of view because the immigration of integrated supply-chain networks have major technical, technological, economic and social impacts [38]. Another important aspect of design of JIT/JIS supply systems is the service level. Research shows the impact of the supply process on the operation costs and service level for distribution in a supply chain [19]. In the field of supply chain, the policy [39] and contracting [40] aspect also have more and more research results. Examples show that in order to increase the efficiency of supply chain solutions, especially in the case of JIT/JIS supply, the focus should be shifted to the integrated approach, where the analysis of complete supply chain solutions includes purchasing, in-plant supply, distribution, and inverse processes [41,42]. Another possibility for the integrated approach is the integration of production planning, project management and logistics systems for supply chain management [43].
The research of JIT/JIS supply includes a wide range of aspects. Up-to-date IT and automation solutions have a great impact on the performance of complex purchasing and distribution processes. RFID investments can help to minimize the total network costs of interconnected logistics systems; therefore, companies must carefully consider the opportunities and challenges posed by RFID and other identification technologies to ensure that such an investment is worthwhile [20]. These solutions belong to Internet of Things (IoT) innovations. IoT innovations have a great impact not only on large-scale industrial and service systems but also on the private environment, like Smart Home as a Service (SHaaS) [44]. Process improvement is a key problem of networking supply chain solutions, but it must be taken into consideration that process improvement is less than lead thinking. Empirically, comparisons between operational resilience and a lean paradigm with reference to changes in operations performance upon disruption show that companies need not abandon their lean implementation [45]. Research demonstrates the use of the lean approach (six sigma) in designing synchronized supply chains with high levels of delivery performance [46]. JIT/JIS supply chain can be solved in different ways: centralized [47], decentralized [48] or within the frame of virtual enterprises [49]. The different solutions have different performance indicators depending on their centralized or decentralized forms. In decentralized supply chains, lack of visibility, long delivery delays and complex transportation networks make it difficult to integrate inventory control with other logistics activities. However, research was focusing on networking options of supply chain solutions 20 years ago [15], but the structure of supply chain solutions is going through revolutionary changes today, which is based on the Industry 4.0 paradigm focusing on interconnectivity [24]. This interconnectivity is especially important in the case of multi-period multi-product supply [50,51] with more buyers [33], where sophisticated supplier selection has a great impact on the performance of JIT/JIS purchasing, production and distribution environments [13]. Cross-docking facilities play an important role in JIT/JIS trans-shipment processes, where inventory backups and delays must be avoided. Lot sizing is an important research field related to the topic of our research work; the most relevant publications are focusing on a flow shop scheduling algorithm for warehouse activities [52], inventory control optimization in the case of flexible demand [53] and optimization of just-in-time logistics network problems under uncertainties [54]. Researchers showed that trans-shipment with supplier and customer time windows where flow is constrained by transportation schedules and warehouse capacities can be optimized with the objective to minimize costs, including inventory costs [55]. There are other aspects of JIT/JIS related research, like human resource allocation [56], proactive selling possibilities [57] or performance measurement [17].
The design of JIT/JIS supply chain solutions covers a wide range of production and service processes as described in numerous case studies: global food supply [58], retail distribution and cross-docking [23], closed-loop economy and reverse/inverse logistics [35], automotive industry [38,59,60], market-driven operational optimization of industrial gas supply chains [61], electricity supply communities and green electricity related supply chain solutions [62], supply of mega-urban regions [10], retail grocery logistics [63], national [64,65] and international case studies [14].
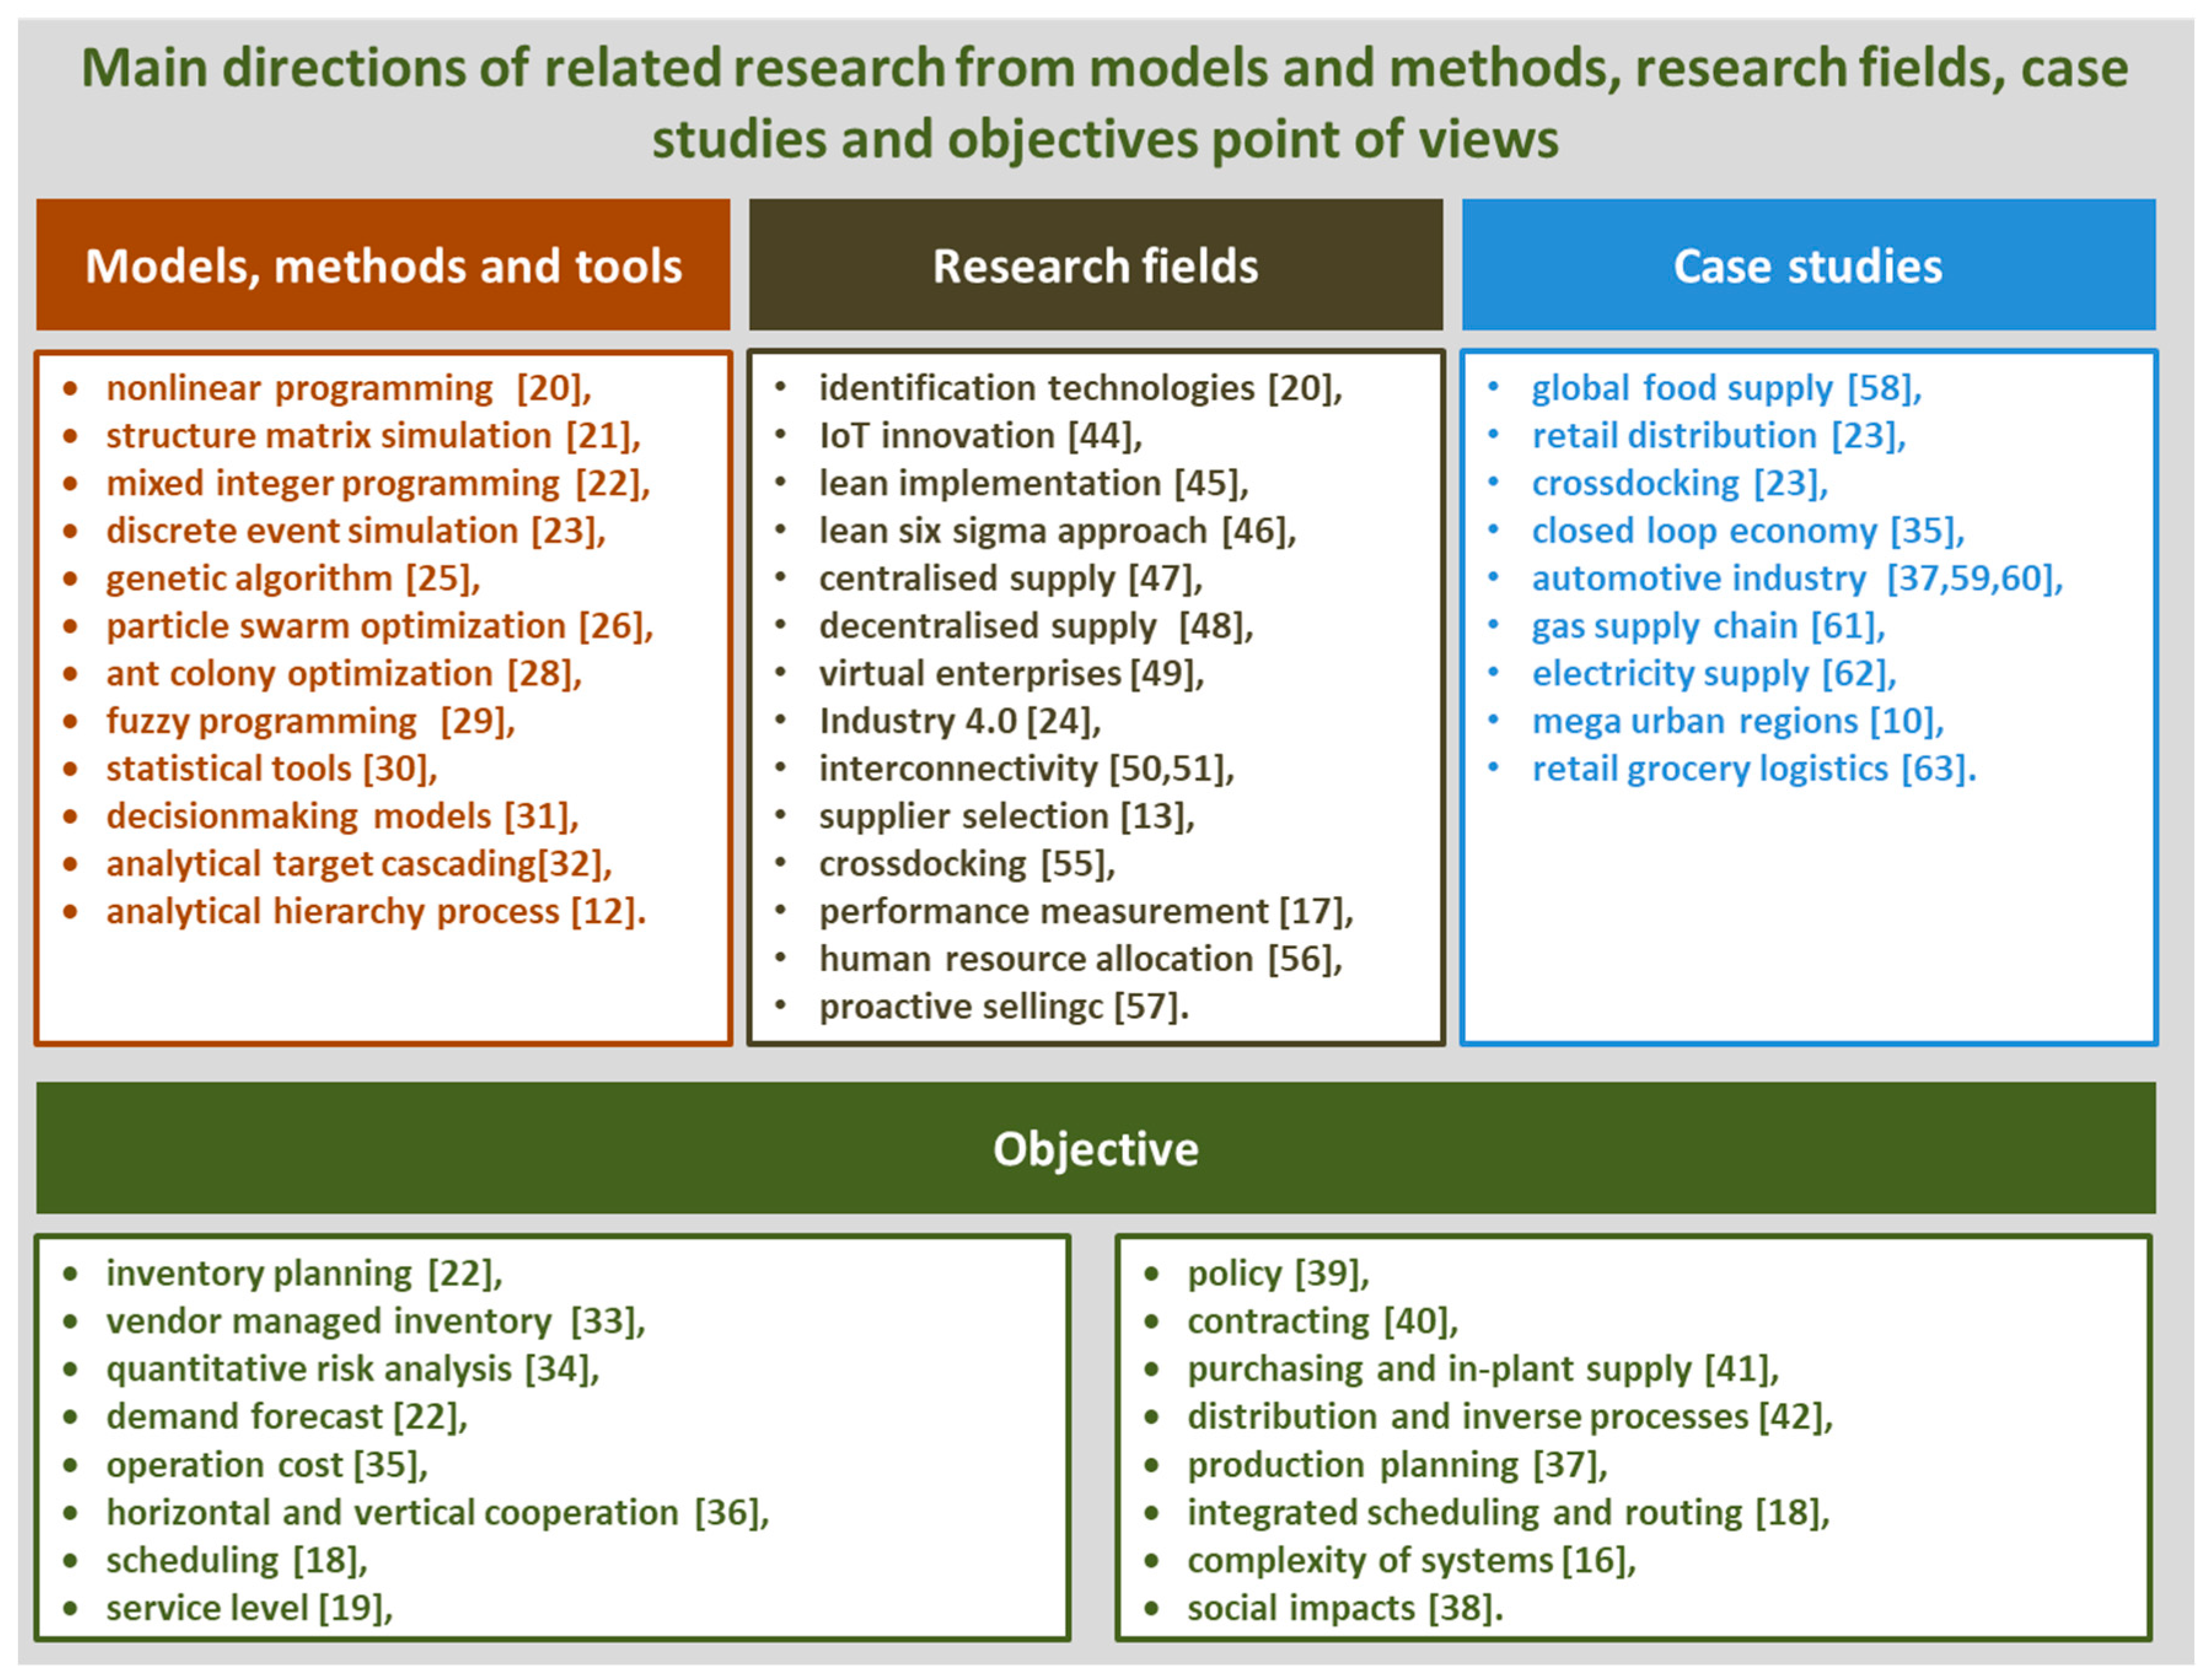
More than 50% of the articles were published in the last few years. This result indicates the scientific potential of research on just-in-sequence supply from a sustainability point of view. The articles that addressed the optimization of just-in-time and just-in-sequence supply are focusing on conventional supply chain solutions and objective functions, but few of the articles have aimed to research the design and operation of these solutions from a sustainability point of view including energy efficiency or use of environmentally-friendly energy sources. The main directions of related research from models and methods, research fields, case studies and objectives point of views are shown in Figure 5.
Therefore, sustainable just-in-sequence supply design still needs more attention and research. It was found that heuristic and metaheuristic algorithms are important tools for the design and operation of complex, interconnected logistic systems, especially in an Industry 4.0 environment since a wide range of models determines an NP-hard optimization problem. According to that, the main focus of this research is the modelling and optimization just-in-sequence supply in Industry 4.0 environment from a sustainability (energy efficiency) point of view, also taking into account costs and logistics performance parameters either as part of the objective function or as constraints.
The main contribution of this article includes: (1) the model of just-in-sequence supply in the Industry 4.0 environment that include scheduling and assignment problems; (2) a harmony search-based heuristic algorithm to solve the optimization problem of just-in-sequence supply in the case of interconnected logistics systems; (3) analysis of new operators for standard harmony search optimization to increase the performance of the algorithm from speed of convergence point of view; and (4) computational results of the just-in-sequence supply models with different datasets.
3. Model Framework
Just-in-sequence supply is typical for engineer-to-order type products, where the product specifications require unique engineering design or significant customization [66]. Each customer order requires cost estimation and special pricing. These orders are results of a unique set of components and customized production routings. In this model, the customer pulls his needs. In traditional just-in-sequence supply solutions, one sequence is supplied by one supplier. Within the frame of this model, not only the single-supplier just-in-sequence supply but also the multi-supplier just-in-sequence supply is described. The model framework of just-in-sequence supply makes it possible to analyze the logistics performance of the systems in order to increase the efficiency of transportation and other material handling operations. As Figure 6 shows, the typical supply chain process of manufacturing of engineer-to-order type products is based on just-in-sequence supply and it is a typical closed loop from manufacturing through customers and engineering processes back to manufacturing.
Traditional economic efficiency indices focus on allocative, productive, dynamic, social and cross efficiency, but in this model we are focusing on sustainability-related efficiency, like energy consumption of transportation and material handling operations. The model shown in Figure 6 includes six different types of members of the value chain (supply chain): customers, customer service, engineering, manufacturing, just-in-sequence supply of components and distribution of final products.
The decision variables of this model are the following: assignment of potential suppliers to order of sequences and scheduling of transportation of assigned orders to the manufacturer. These decision variables include an integrated optimization problem: the scheduling and assignment problem.
The demand of the manufacturing process can be described as the result of the engineering process of the customized orders. With this in mind, we define the following parameters describing the supply chain process for just-in-sequence supply of required components from suppliers to manufacturers:
- let the number of sequences, where ,
- let the number of orders within sequence i, where ,
- let the number of potential products to order from the potential just-in-sequence suppliers, where ,
- defines the set of products involved in the sequence i,
- let the type of order j in sequence i,
- let the quantity of order j in sequence i,
- let supplier , where ,
- let the lower limit of the quantity of product k at supplier to be supplied to the manufacturer,
- let the available quantity of product k at supplier ,
- defines the set of potential suppliers of product k, where the assignment of suppliers to the potential suppliers of an order can be defined as follows:
- defines the set of potential suppliers of sequence i, where the assignment of suppliers to the potential suppliers of a sequence can be defined as follows:
- let the supply cost of product k from supplier ,
- let the specific energy consumption of supply of product k from supplier ,
If the suppliers are chosen from the set , then the just-in-sequence supply is a multi-supplier supply. If the suppliers are chosen from the set , then the just-in-sequence supply is a single supplier supply.
In the case of a single supplier supply, the objective function of the problem describes the minimization of energy consumption and supply costs:
where and are the weight parameters of both parts of the objective function and is the decision variable defining that supplier supplies order j in sequence i.
In the case of a multi-supplier solution, the objective function of the problem can be extended with the additional sequencing costs:
where is the additional sequencing cost caused by the fact that more suppliers supply part-sequences and additional sequencing operations are required to organize the part sequencing into a sequence. The additional sequencing cost depends on the number of part-sequences assigned to a sequence.
Constraints 1: The number of suppliers can be limited.
where is the upper limit of the number of suppliers assigned to one sequence. In the case of a single supplier solution = 1, while in the case of a multi-supplier solution .
Constraints 2: We can define a timeframe for each sequence to be supplied from suppliers with just-in-sequence strategy and it is not allowed to exceed the upper and lower limit of this timeframe.
where
- and define the lower and upper limit of delivery time of sequenced demand i to the manufacturer;
- and defines the lower and upper limit of delivery time of sequence i from supplier This lower limit includes all parts of the total order lead time, which means the lead time from customer order received to customer order delivered and includes the following operations: incoming order, manufacturing of ordered components, shipment preparation, check-out, physical delivery, unloading, check-in.
- and are the lower and upper limit of delivery time of components j of sequence i from supplier to the manufacturer;
- is the scheduled transportation time of order j of sequence i from supplier .
Constraints 3: The capacity of transportation trucks is limited, so it is not allowed to exceed its loading capacity within one sequence.
where is the weight of the products assigned to the order j of sequence i depending on the type and quantity of order and is the loading capacity of trucks of supplier .
Constraints 4: The available quantity of product k at supplier must be higher than the amount of assigned product k to supplier .
The first decision variable of this optimization problem is the assignment matrix, which defines the assignment of potential suppliers to sequences and orders. The decision variables can only assume binary values.
In the case of a single supplier solution the assignment matrix can be written as follows:
The second decision variable of this optimization problem is the scheduling matrix , which defines the optimal scheduling of transportation of sequences from suppliers to manufacturers. If a sequence is supplied by more than one supplier, than the additional sequencing time must be taken into consideration. In this case, the lower and upper limit of delivery time of sequenced demand i to the manufacturer must be decreased with the required additional sequencing time (Figure 7).
4. Flower Pollination Algorithm-Based Optimization and Its Validation with Test Functions
The aforementioned just-in-sequence supply design problem is a noncontinuous, nonlinear, multivariate and nonconvex NP-hard optimization problem, so its solution must be based on heuristic and metaheuristic algorithm instead of conventional optimization methods. The heuristic optimization plays a very important role in the design of complex, interconnected systems. One of the most significant heuristic optimization algorithms are swarm intelligence algorithms, which includes the following swarming based solutions: ant colony optimization (ACO) [67], firefly algorithm (FFA) [68], black hole optimization (BHO) [69], bee colony algorithm (BCA) [70], bacteria algorithm (BA) [71], krill herd algorithm (KHA) [72], bat algorithm (BAT-A) [73], wasp swarm algorithm (WSA) [74], adaptive culture model (ACM) [75] and flower pollination algorithm (FPA) [76].
FPA takes its metaphor from nature, from the pollination process of plants. Pollination is the transfer of pollen grains from the stamens to the ovule-bearing. Pollen grains are transported by external agents, like insects, wind, birds, mammals, and water. FPA is based on this natural phenomenon and its operation can be summarized into the following important rules [77]:
- the candidate solutions of the optimization problem are represented by pollen grains;
- the global search in the search space is modelled through the biotic pollination via Lévy flight;
- the local search in the search space is modelled by abiotic pollination and self-pollination;
- the global and local search is controlled through a switching probability between biotic, abiotic and self-pollution;
Flower pollination algorithm is used in many fields of science. Table 1 shows the most significant application fields of this swarming based optimization technique.
The first phase of the optimization algorithm is the initialization of parameters. There are two different types of parameters. the first set of parameters are problem-specific (size and dimension of search space, constraints-defined parameters), while the second set includes the parameters of the algorithms (switch parameter between local and global search, distribution function parameters for Lévy flight, termination criteria, number of pollen grains).
The second phase of the optimization algorithm is the calculation of initial solutions with the following initial formula:
where is variable i,
and is the lower and upper limit of the search space in the dimension i and is a random number between 0 and 1.
The third phase of the optimization algorithm is the iteration phase. We generate a random number to switch between global and local search option. If then a global pollination (biotic pollination) takes place. The biotic pollination operator is based on Lévy flight and can be defined as follows:
where is the value of variable i at iteration step t, is the value of variable i at iteration step t in the case of the global best solution and is the Levy distribution, which can be calculated as follows [94]:
where is the standard gamma function, and is the Levy parameter, which can be described as a function of a normal distribution and a standard normal distribution [95]:
and the variance of the normal distribution can be calculated as follows [95]
If then a local pollination (abiotic pollination) takes place. In the case of local pollination, pollen grains are spread to a local neighbor as:
where and are randomly selected pollen grains about the neighborhood of the currently processed pollen grain and is a random number.
It is possible to apply the fitness proportionate selection of both pollen grains in (19) using the following equation to select from local neighbors:
where is the fitness of pollen grain in iteration step t. The fourth phase of the algorithm is checking the termination criteria. As termination criteria we can define the following:
- predefined computational time is reached ();
- number of predefined iteration steps is reached ();
- the predefined value of the best solution is reached ();
- the predefined “lower limit of convergence speed” of the algorithm is reached ().
The phases of the applied flower pollination algorithm are shown in Figure 8.
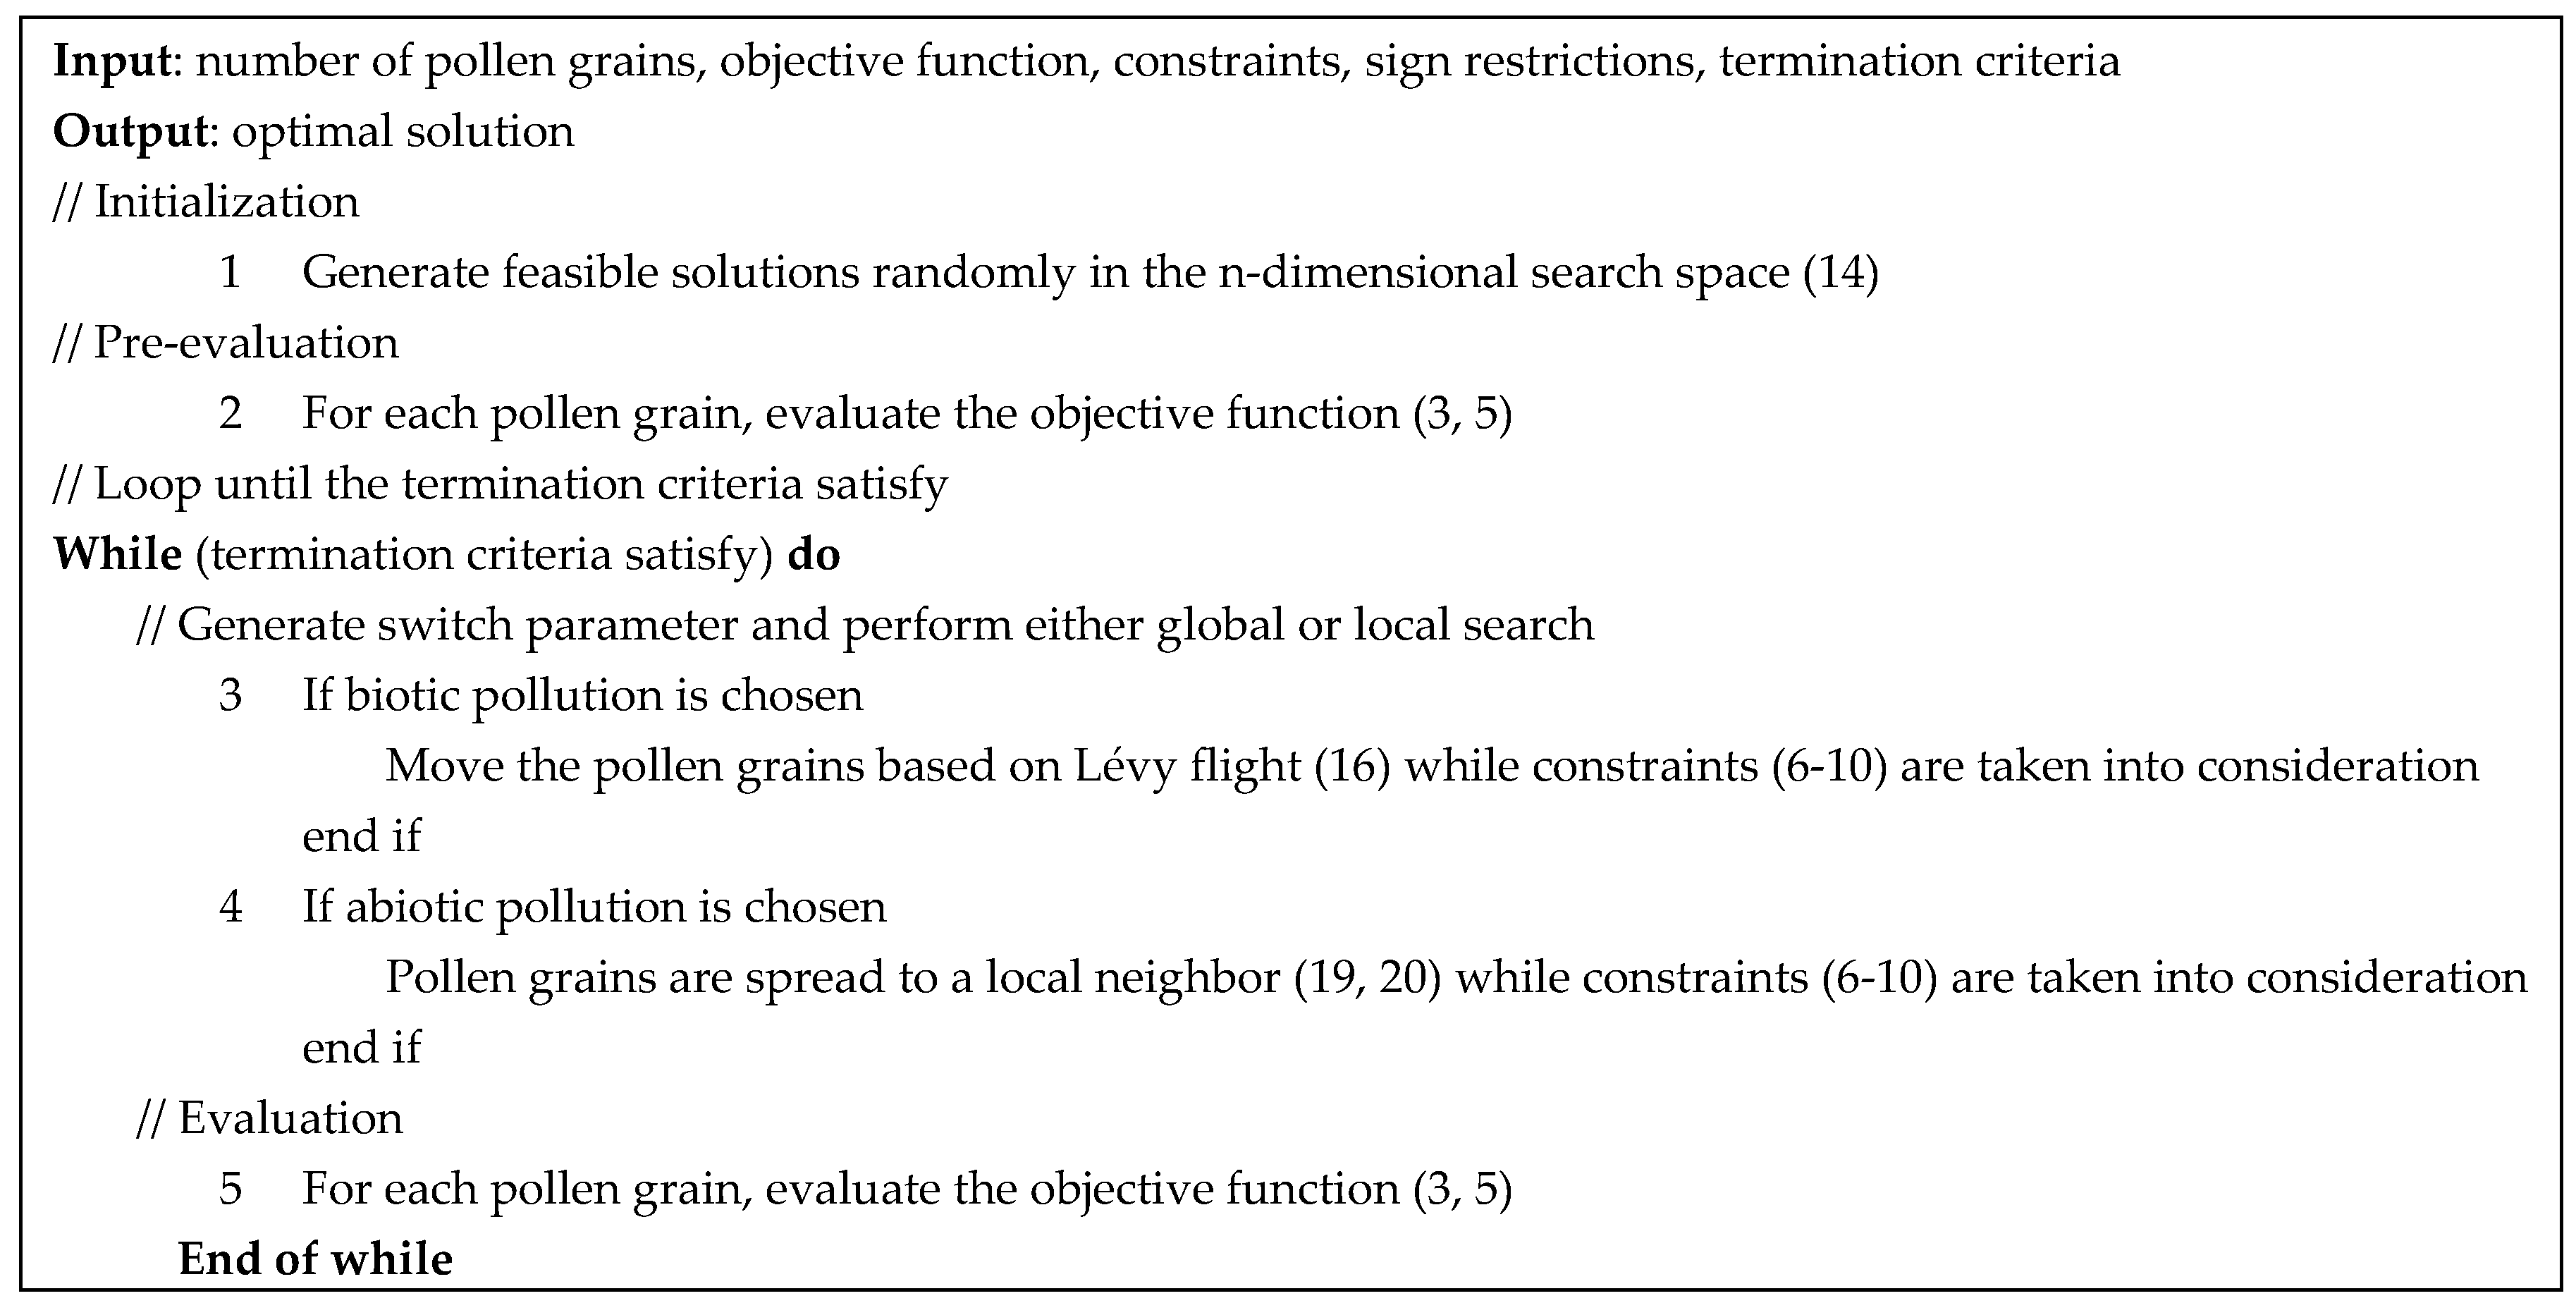
The key functionality of the algorithm has been explained. Figure 9 demonstrates the pseudocode of the algorithm because the details of software engineering part would be interesting for anyone aiming to replicate the implementation.
Heuristics are experience-based techniques that help in problem-solving in the case of NP-hard optimization problems. Heuristic and metaheuristic algorithms are mostly used to come to a solution that is hoped to be close to the best solution of the problem. In this point of view heuristic algorithms must be tested from convergence speed or error value [96] point of view (see Table 2). These tests are based on benchmark functions [97,98,99,100].
As Table 2 demonstrates, the flower pollination algorithm showed smaller error value than other algorithms in 4 of 6 test functions after 200 iteration steps. The standard flower pollination algorithm enhanced with fitness proportionate selection in abiotic pollinations shows a decreased error value. In order to demonstrate how flower pollination algorithm implementation performs when the problem size increases, we tested the algorithm with the same test functions.
As Table 3 shows, the increased size of the problem led to the increase of the required iteration steps to reach the predefined error value that is based on the performance of the algorithm in the case of a 10-dimensional search space (Table 3). The computational results of SFPA and FPAwFPS show that FPAwFPS has an increased convergence speed of averagely 25%. Based on these test results FPAwFPS is used in the next chapter for the optimization of the just-in-sequence supply in interconnected logistics systems.
5. Numerical Analysis of Just-In-Sequence Supply in Interconnected Logistics Systems
Within the frame of this chapter, the performance of the abovementioned flower pollination algorithm-based heuristics is validated through the optimization of just-in-sequence supply in interconnected logistics systems. The model has four suppliers, which are able to supply six types of components. The manufacturing company needs 6 different types of components in two sequenced orders within the time frame of the analysis. The sequences must be scheduled; it is not allowed to exceed the upper limit of scheduled arrival time. The basic parameters of the required sequences at the manufacturer are shown in Table 4.
Suppliers have limited transportation capacity and stock of components. The availability of the different types of components is time-dependent, and the specific prize of each component is also given. The basic parameters of the suppliers are shown in Table 5.
The specific purchasing costs of each component shown in Table 6 do not depend on the lot size of each order. The specific purchasing cost includes all cost related to manufacturing and logistics operations.
5.1. Scenario 1: Just-In-Sequence Supply without Time Frame and without Transportation Capacity Limit
Within the frame of this scenario, the availability of components at the suppliers is not restricted in time and the available transportation capacity of trucks from suppliers to the manufacturing plant is not limited. The flower pollination algorithm performs in this scenario the optimization of an assignment problem, where the available components of suppliers are assigned without time frame to the required sequences of the manufacturer. In this scenario, input parameters shown in Table 4 and Table 5 are used (without time frame). The optimal assignment of suppliers to the required sequences are shown in Table 7.
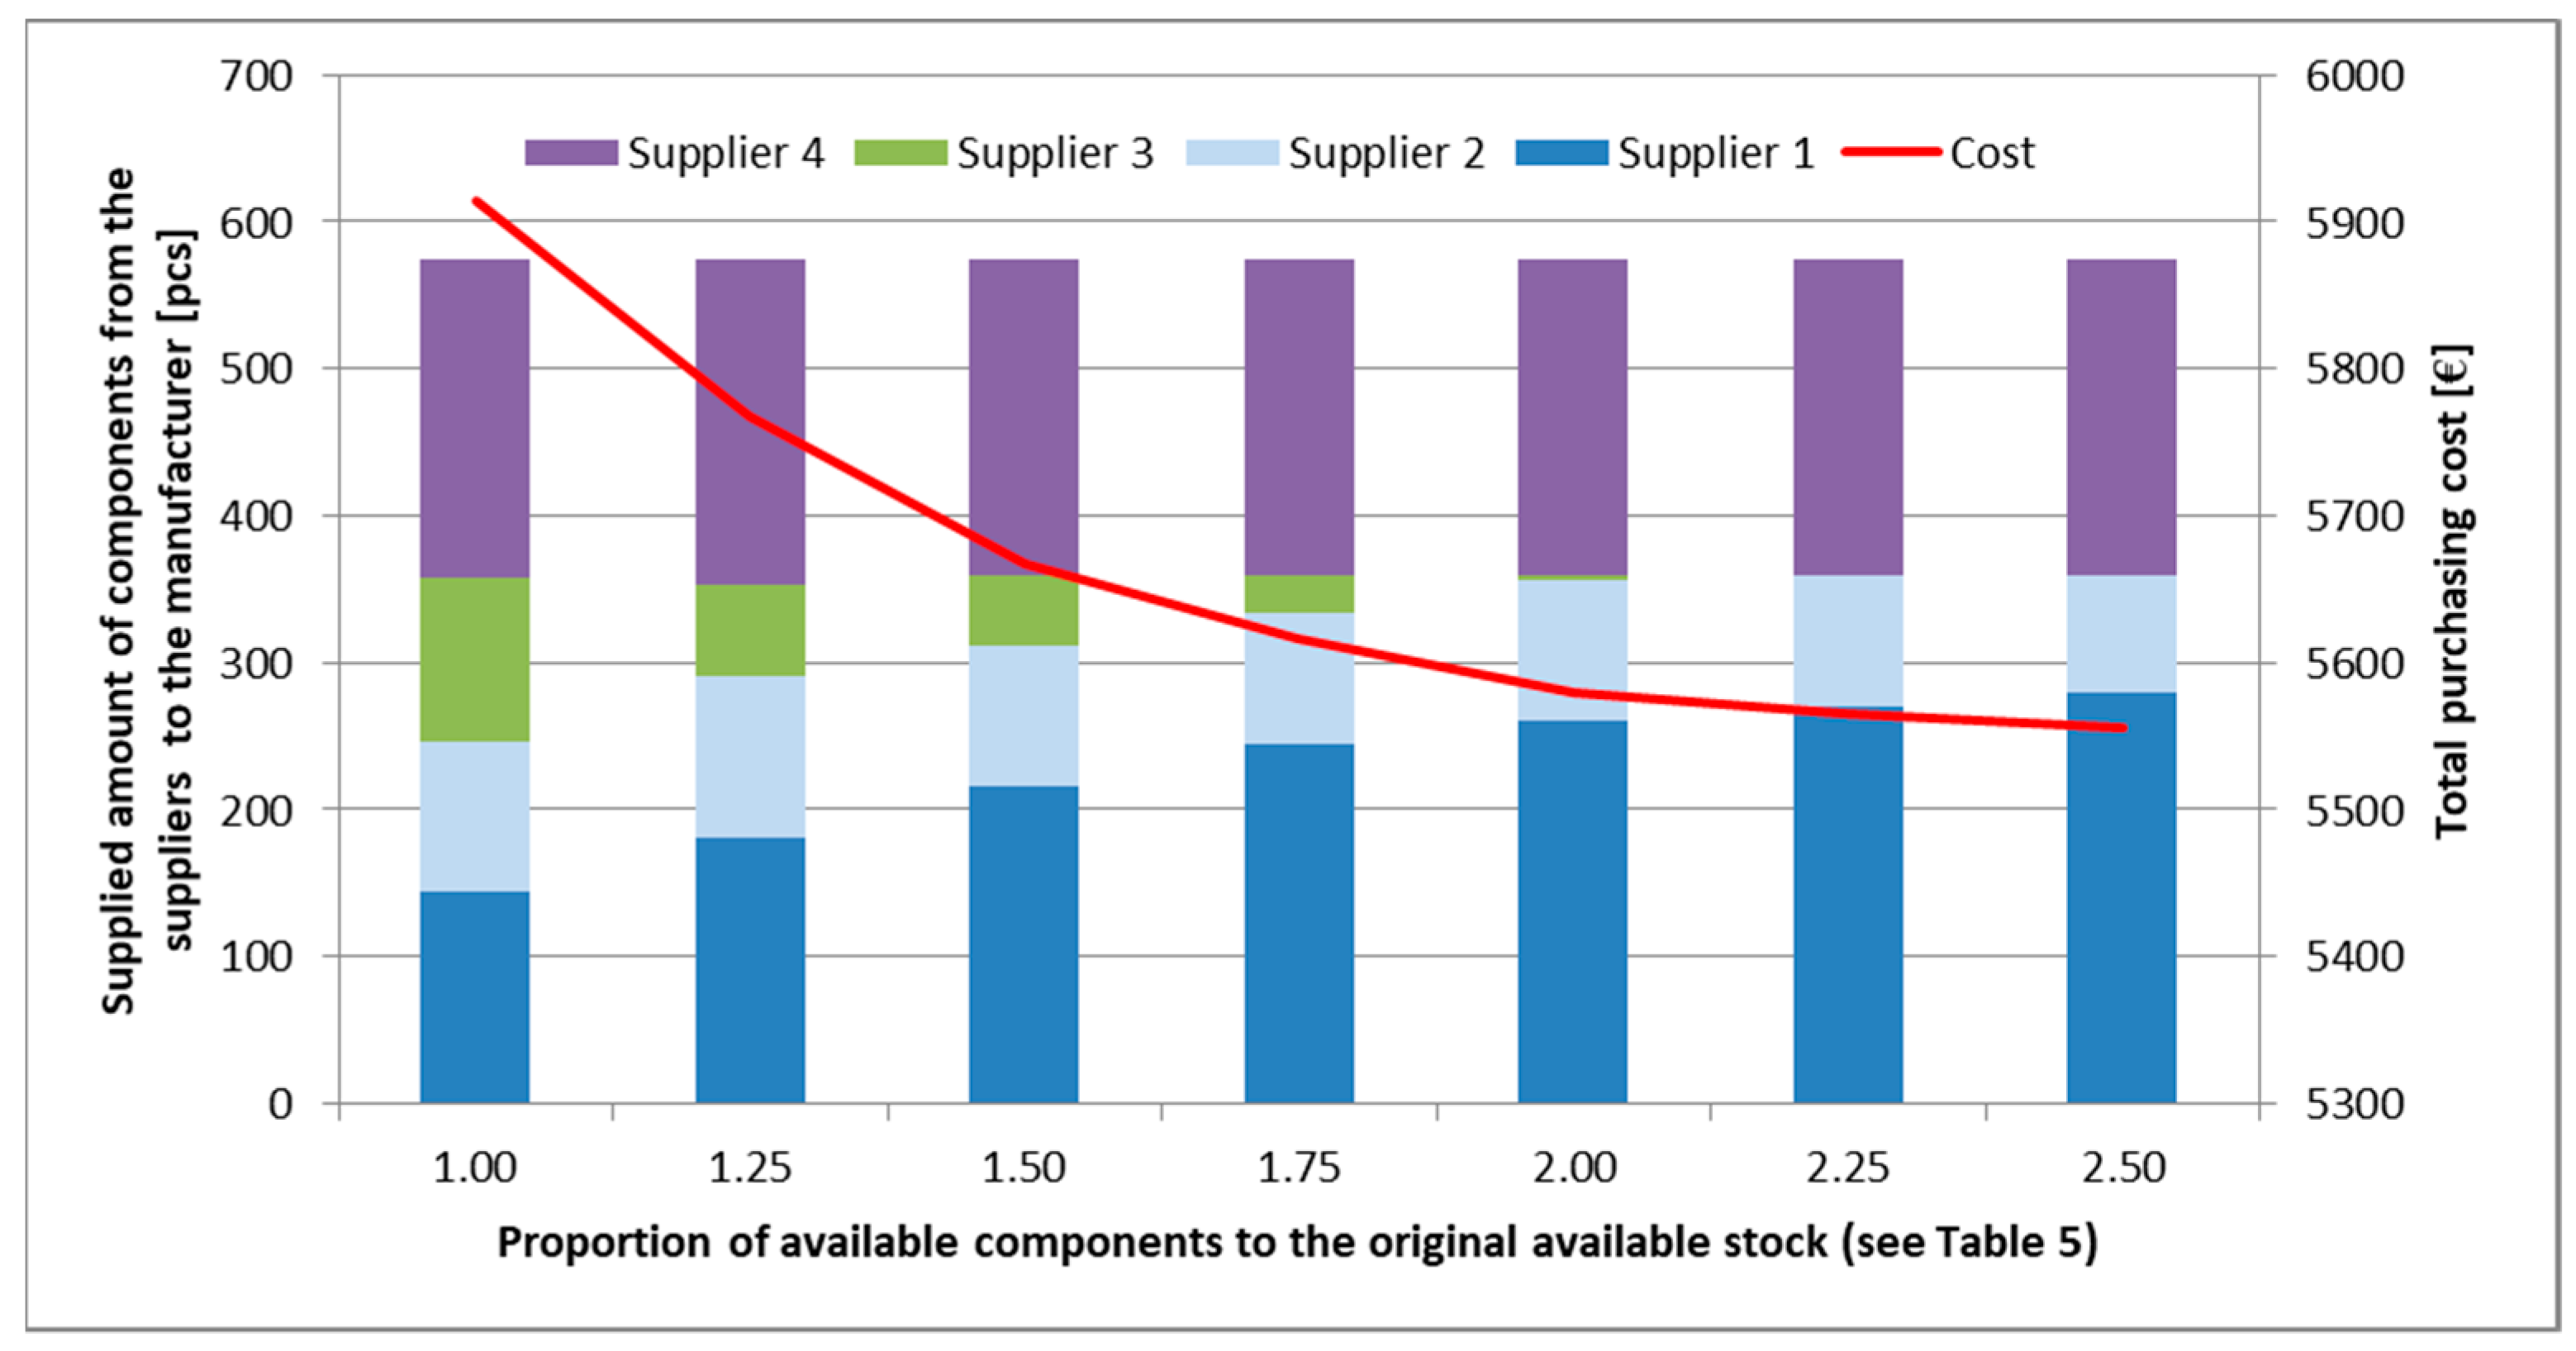
As Figure 10 shows, increasing the proportion of available components at the suppliers to the original available amount led to the restructuring of the amount of supplied components. This analysis shows that in this just-in-sequence supply scenario the most expensive supplier is supplier 3 because it is decreasingly involved in the supply process of both required sequences if the available amount of components at other suppliers is increasing. As Figure 10 shows, the available amount of components has a great impact on the total purchasing cost. The increased availability made it possible to involve cheaper suppliers in the supply process of the required sequences.
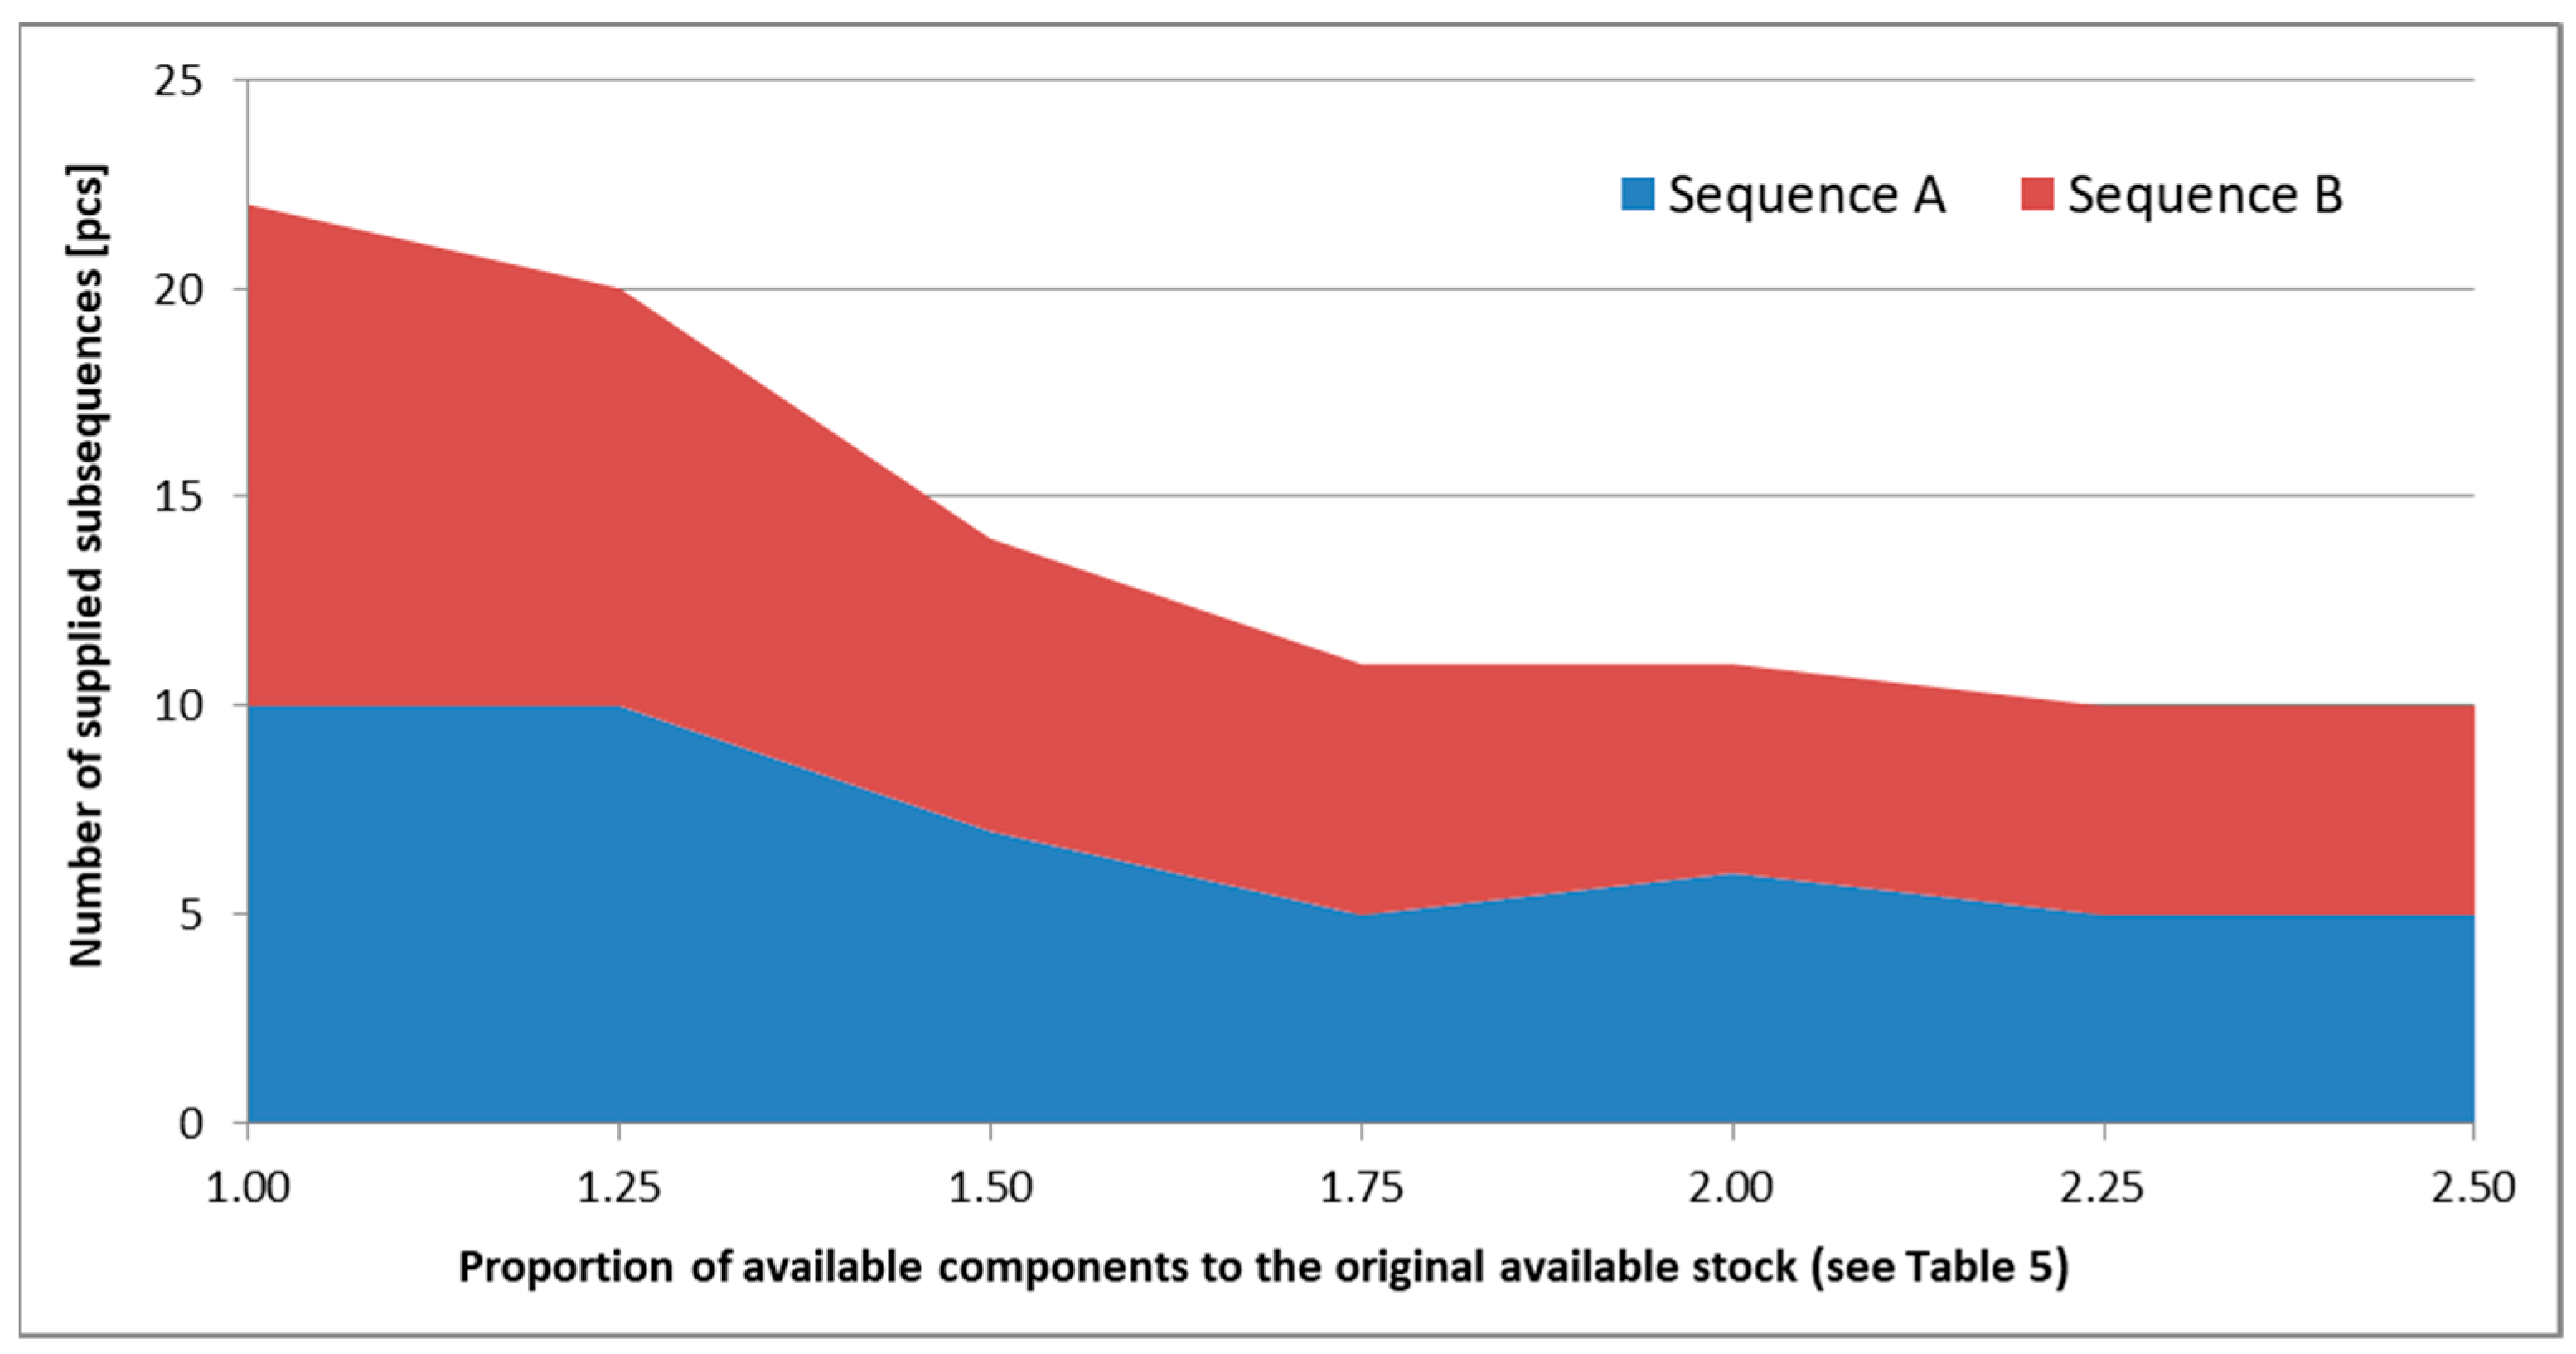
As Figure 11 shows, the increased availability of components led to a decreased number of supplied subsequences. This phenomenon is especially important if the composition of subsequences into sequences causes additional sequencing costs because in this case, the number of subsequences must be taken into consideration in the objective function of the optimization problem.
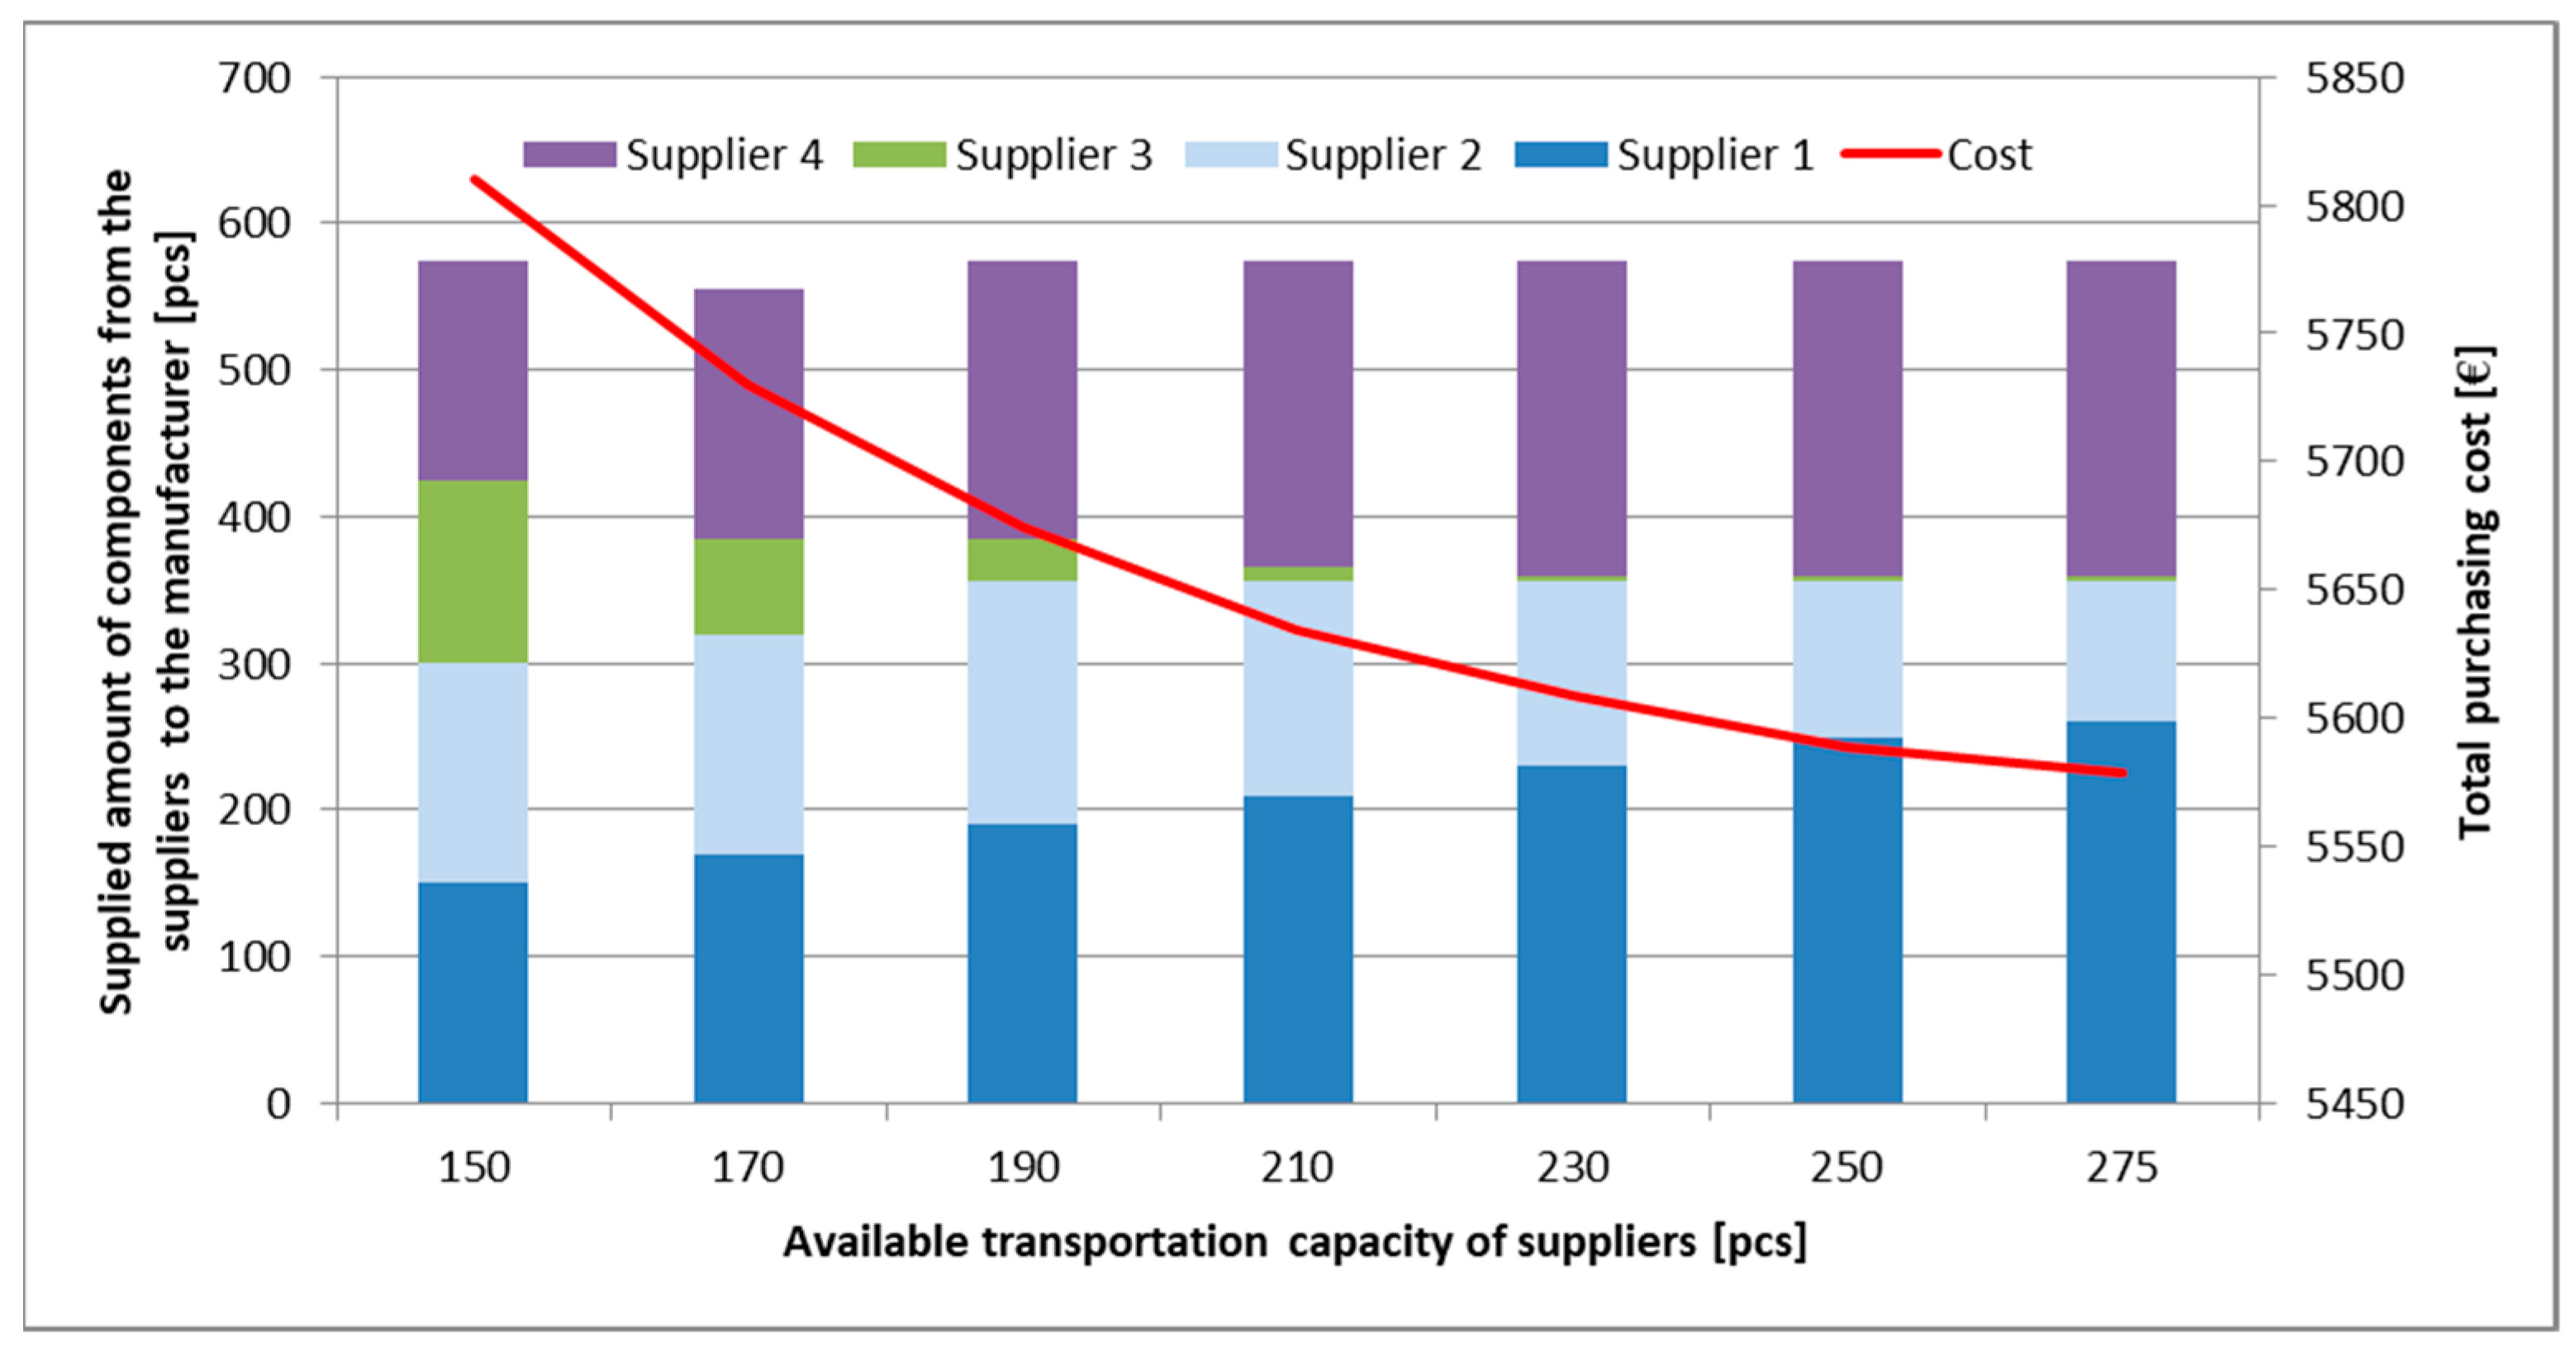
5.2. Scenario 2: Just-In-Sequence Supply without Time Frame and with Transportation Capacity Limit
Within the frame of this scenario, the availability of components at the suppliers is not restricted in time but the available transportation capacity of trucks from suppliers to the manufacturing plant is limited. The flower pollination algorithm performs in this scenario the optimization of the same assignment problem as in Scenario 1, but the available transportation capacities as constraints are taken into consideration. In this scenario, the available components (shown in Table 4) are calculated with a multiplier.
As Figure 12 shows, increasing the available transport capacity from suppliers to the manufacturing plant led to the restructuring of the amount of supplied components. This analysis shows that increased transportation capacity decreased the importance of supplier 3. As Figure 12 shows, the available transportation capacity influences the total purchasing cost. The increased available transportation capacity made it possible to neglect more expensive suppliers, so the total purchasing cost can be decreased.
As Figure 13 shows, the increased transportation capacity led to a decreased number of supplied subsequences, as seen in the case of Scenario 1. The costs of composing sequences from these subsequences are not taken into account in this scenario.
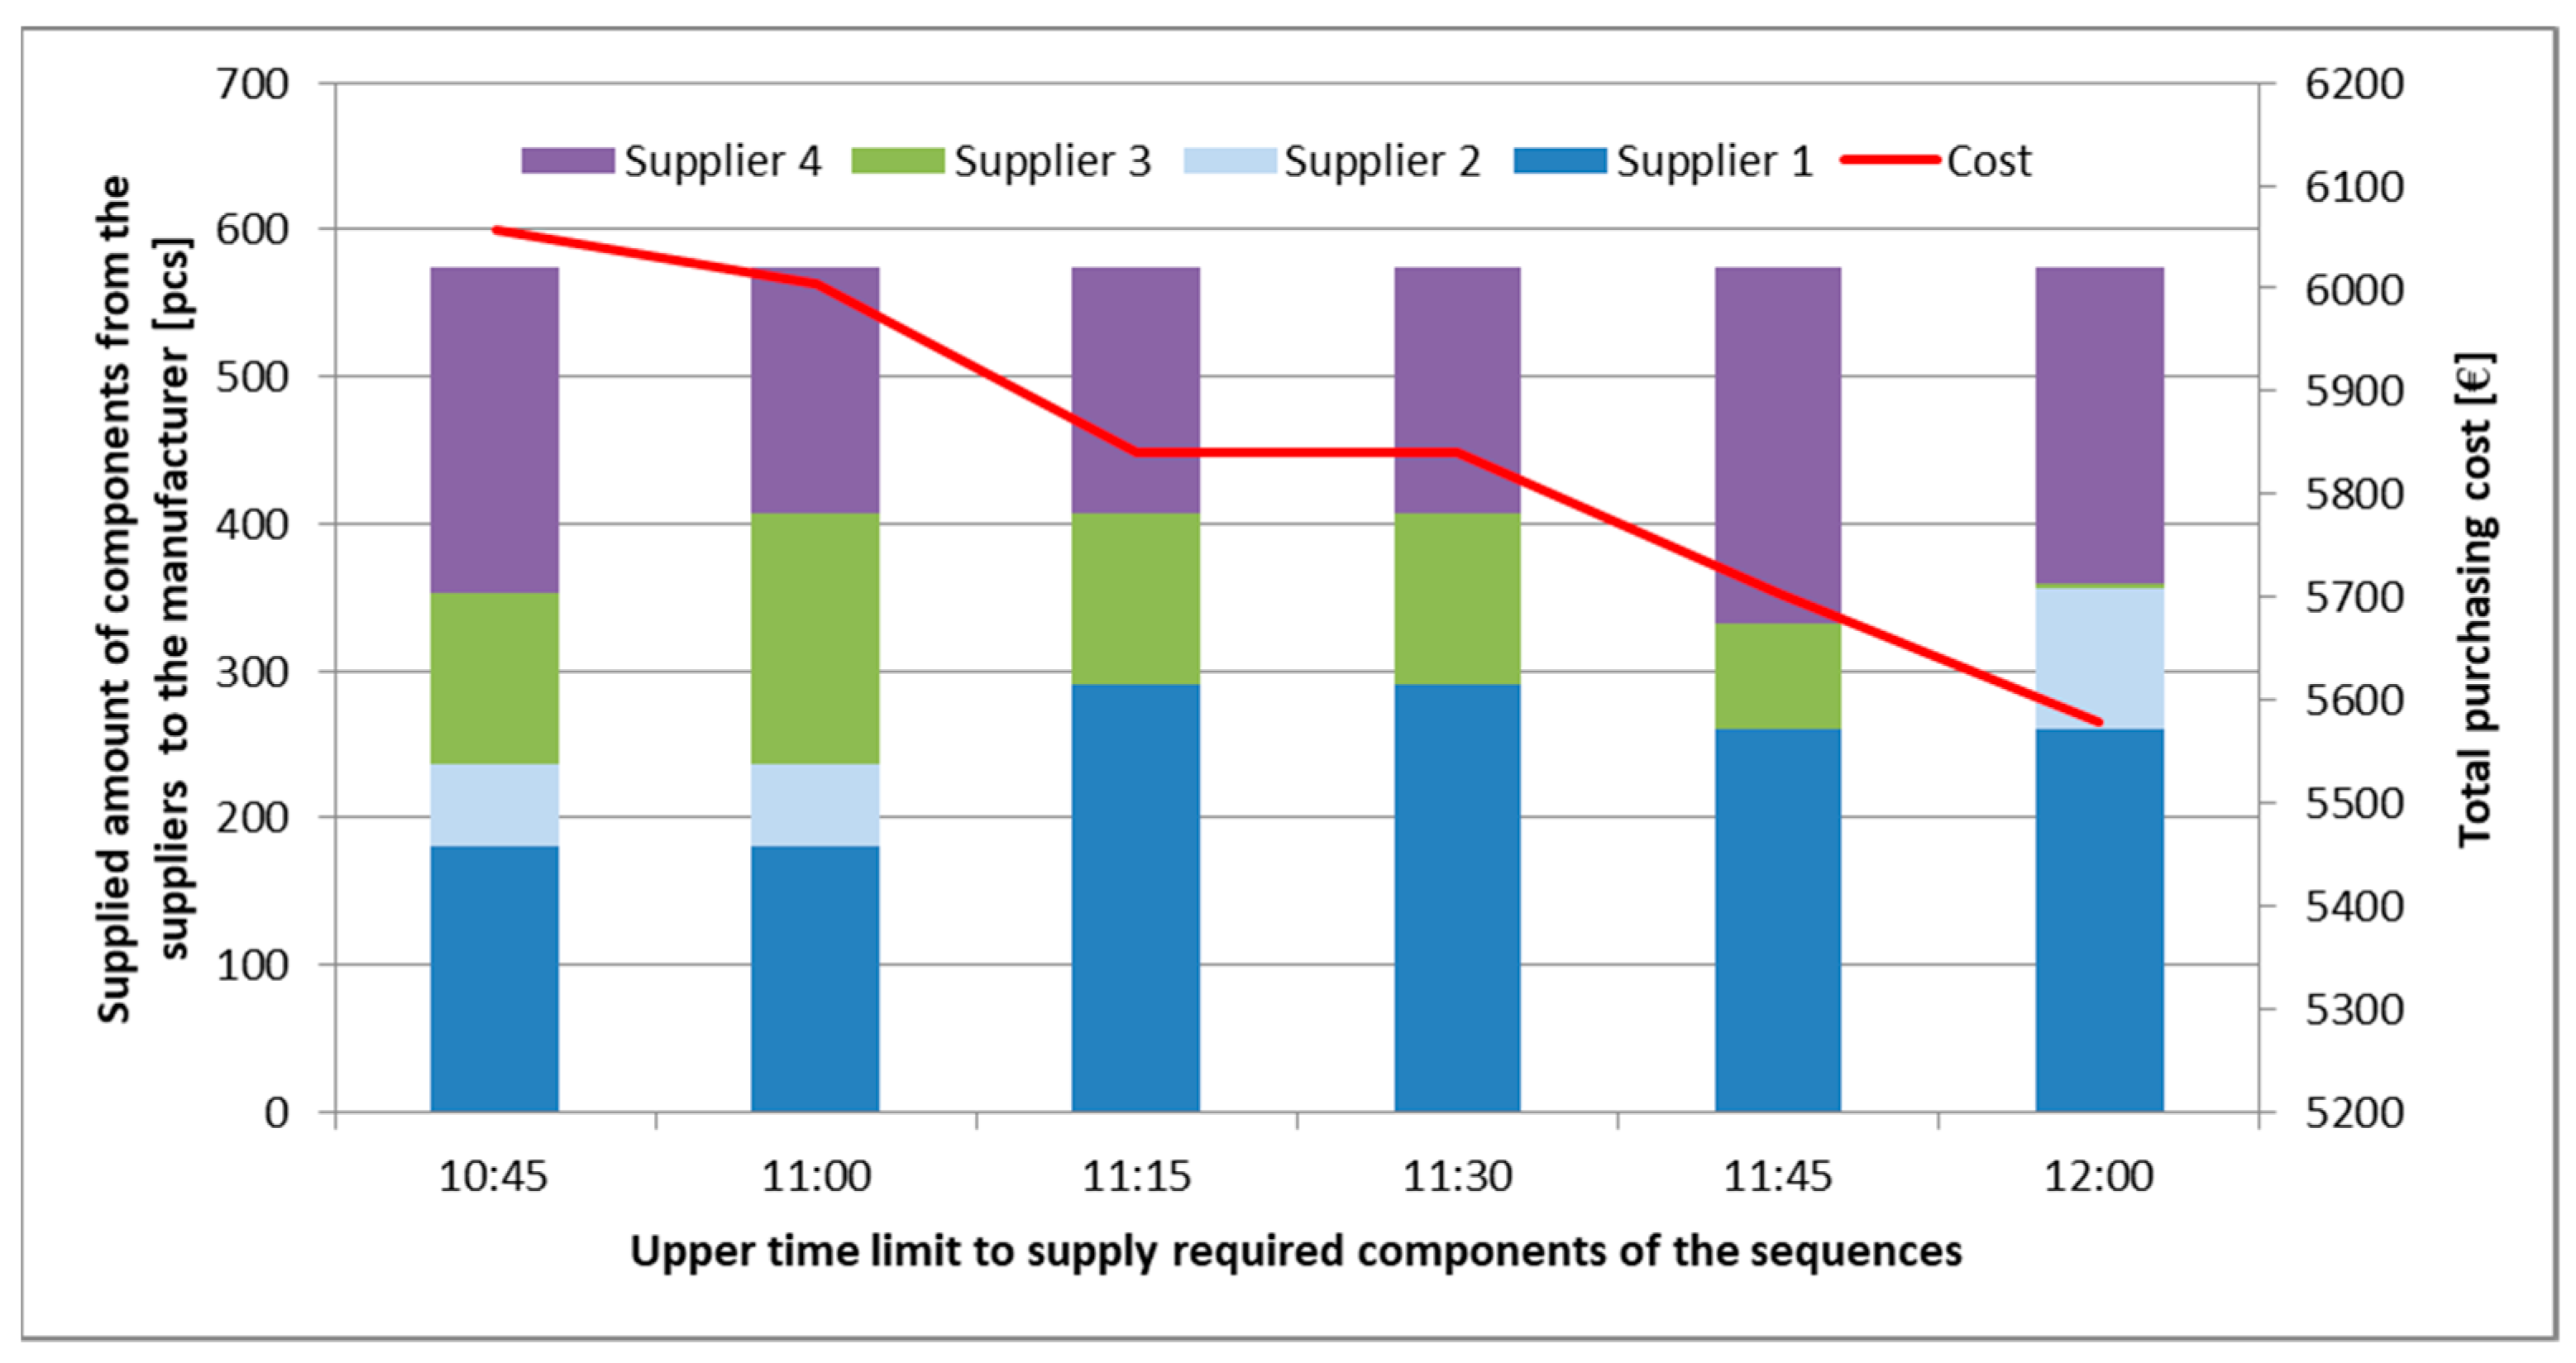
5.3. Scenario 3: Just-In-Sequence Supply with Time Frame and Transportation Capacity Limit
Within the frame of this scenario, both the availability of components at the suppliers and the availability of transportation capacity of trucks from suppliers to the manufacturing plant is limited. The flower pollination algorithm performs in this scenario the optimization of an integrated optimization problem, where the objective function describes both an assignment and a scheduling problem. In this scenario, the available components (shown in Table 4) are calculated with a multiplier.
As Figure 14 shows, increasing the upper limit of the latest arrival time of components led to the restructuring of the amount of supplied components. This analysis shows that the increased time limit decreased the importance of supplier 3. As Figure 14 shows, the time-related constraints of the supplies influence the total purchasing cost. The increased arrival time made it possible to neglect more expensive suppliers, so the total purchasing cost can be decreased.
As Figure 15 shows, the time restrictions and the limitation of available transportation capacities have a significant impact on the total purchasing cost.
As Figure 16 shows, the time restrictions and the limitation of available transportation capacities also have a significant impact on the total number of supplied subsequences. The supplied subsequences correlate with both mentioned variables (time restrictions and transportation capacities) but the correlation cannot be described analytically because of the complexity of the search space in the n-dimensional heuristic optimization problem.
As the three scenarios described above show, the process parameters of a supply chain solution have a great impact on the performance of just-in-sequence supply. However, the coordination of the supply process is based on feedback information from the manufacturer, but the time- and capacity-related constraints results a process optimization problem with high complexity. Table 8 shows the correlation between optimized transportation routes and emission of CO2, SO2, CO, HC, NOx and PM. It means that the above-described model and optimization method makes it possible to improve the sustainability of just-in-sequence supply solutions through the minimization of emission and fuel consumption.
To summarize, the proposed flower pollination-based algorithm makes it possible to analyze the impact of time- and capacity-related constraints on the performance, availability and cost efficiency of just-sequence supply. As the findings of the literature review show, the articles that addressed the analysis of just-in-sequence supply are focusing on conventional optimization models, where one objective function is used to measure the performance of the supply chain, but none of the articles aimed to identify the optimization aspects of integrated assignment and scheduling problems with time- and capacity-related constraints. The comparison of our results with those from other studies shows that the optimization of just-in-sequence problems still needs more attention and research. The reason for this is that, in the automotive industry, where the dynamic of customers’ demands influences the required components for final products, the time- and capacity-related constraints must be taken into consideration.
In spite of the small size of the demonstrated scheduling and assignment problems, these results show that the proposed method using flower pollination-based optimization performs better than the traditional formal models to evaluate just-in-sequence supply problems. Traditional formal models are generally focusing on a special field of just-in-sequence supply:
Optimization of just-in-sequence supply when facing variability in safety stocks that operate under assumptions such as fixed costs and high inventory turnover [103] or definition of decision strategies for switching from just-in-time to just-in-sequence supply from purchasing cost point of view, while our proposed optimization and evaluation model makes it possible to apply an integrated optimization including assignment and scheduling problems [104]. However, unreliable deliveries risk the whole manufacturing process [105], but in today’s economy, the application of Industry 4.0 technologies (lean tools, up-to-date identification solutions) offer suitable solutions [106,107] to skip this risk through increased availability of deliveries. The controlling of just-in-sequence flow production involves more and more new solutions to optimize the complex, hyperconnected logistic systems [108].
As the flower pollination-based mathematical model (see Equations (1)–(13)) shows, the consequences of the three analyzed optimization scenarios can be summarized as follows: (1) the available amount of components at the suppliers has a great impact on the total purchasing cost. The increased availability made it possible to involve cheaper suppliers. (2) The increased availability of components led to a decreased number of supplied subsequences. (3) The increased transportation capacity decreased the importance of expensive suppliers. (4) The upper limit of the latest arrival time of components led to the restructuring of the amount of supplied components. (5) The increased arrival time made it possible to neglect more expensive suppliers, so the total purchasing cost can be decreased. (6) The time restrictions and the limitation of available transportation capacities have a significant impact on the total number of supplied subsequences.
6. Conclusions
Within the frame of this research work, the authors developed a flower pollination algorithm-based optimization method, which makes it possible to optimize and analyze just-in-sequence supply solutions. More generally, this paper focused on the mathematical description of the framework of supply chain process of required sequences of the manufacturer from various suppliers including time- and capacity-related constraints showing their impact on the planned supply chain solution. However, the application of Industry 4.0 technologies will lead to the appearance of new manufacturing technologies and logistic solutions (like matrix manufacturing), but traditional just-in-time and just-in-sequence solutions will not be changed at a wide range of manufacturers. Sustainability of processes has a great impact on the image of the company and a good image increases the number of sold products. It means that sustainability has a measurable impact on profit.
Manufacturing companies in the automotive industry are faced with increased competition. The automotive industry is the most globalized sector of industry. Manufacturers have hundreds of suppliers, therefore it is important to optimize the supply of components to the manufacturing plant to reduce costs and improve efficiency. The model of just-in-sequence supply described above makes it possible to optimize the just-in-sequence supply process in order to reduce the costs and environmental impact of supply while manufacturing performance is assured. Just-in-sequence supply is mentioned as a reinterpretation of just-in-time principles in automotive industry. The link of our research work with practice is justified by the fact, that JIS supply integrates the advantages of the supplier processes and the classic auditing [109], and has a great impact on the improvement of efficiency and availability of logistics processes and services:
- JIS/JIT solutions are supporting suppliers to focus on their core business.
- The JIS supply philosophy is a core part of lean thinking.
- The aims of the Toyota production system (TPS) are to serve world quality products, reduce operation costs [110], and satisfy customer needs.
- There are several advantages such as controlling costs, reducing risk of supply chain and supporting third-party logistics (3PL).
The added value of the paper is the description of the flower pollination-based model of just-in-sequence supply process, which makes it possible to describe the impact of the characteristics of suppliers and service providers. We have chosen the flower pollination-based algorithm because performance analysis based on CEC benchmarking functions shows the suitability to solve NP-hard optimization problems. Our research focuses on the sustainability aspect, including energy consumption and emission reduction. The scientific contribution of this paper for researchers in this field is the mathematical modelling of just-in-sequence supply processes based on a special type of swarming optimization method. The results can be generalized, because the model can be applied for manufacturers from small and middle-sized companies to multinational production companies, especially in the automotive industry. The described method makes it possible to support managerial decisions; the purchasing strategy can be influenced by the results of the contribution described above. The described optimization algorithm makes it possible to support managerial decisions in the field of purchasing and warehousing, while policy making can also be supported by the described analysis.
However, there are also limitations of the study and the described model which shows directions for further research. Within the frame of this model, the stochastic parameters of the environment and other uncertainties are not taken into consideration. In further studies, the model can be extended to a more complex model, including a description of uncertain parameters with fuzzy models. The application of fuzzy colored Petri net simulation is also a suitable way to enhance our model for an uncertain environment [111,112]. Another research direction is to improve the performance of the discrete heuristic algorithms [113,114]. Within the frame of this flower pollination-based model, the sequencing costs of subsequences are not taken into consideration. The model makes it possible to analyze different supply strategies depending on time- and capacity constraints. In further studies, the model can be extended to a more complex model, including optimization methods to find the optimal supply chain strategy in a stochastic environment.
Author Contributions
Conceptualization, T.B. and Á.B.; methodology, T.B.; software, T.B. and M.G.; validation, T.B., Á.B.; M.G. and F.S.; formal analysis, T.B. and Á.G.; investigation, T.B. and Á.B.; writing—original draft preparation, T.B and Á.B.; writing—review and editing, F.S. and Á.G.; visualization, T.B.; supervision, T.B.; project administration, B.I.; funding acquisition, B.I.
Funding
This research received no external funding.
Conflicts of Interest
The authors declare no conflict of interest. The funders had no role in the design of the study; in the collection, analyses, or interpretation of data; in the writing of the manuscript; or in the decision to publish the results.
References
- Bányai, T. Build to sequence supply. Adv. Log. Syst. 2013, 7, 35–40. [Google Scholar]
- Abedi, A.; Zhu, W.H. An optimisation model for purchase, production and distribution in fish supply chain—A case study. Int. J. Prod. Res. 2017, 55, 3451–3464. [Google Scholar] [CrossRef]
- Tamás, P. Decision Support Simulation Method for Process Improvement of Intermittent Production Systems. Appl. Sci. 2017, 7, 950. [Google Scholar]
- Bamana, F.; Lehoux, N.; Cloutier, C. Simulation of a Construction Project: Assessing Impact of Just-in-Time and Lean Principles. J. Constr. Eng. Manag. 2019, 145, 05019005. [Google Scholar] [CrossRef]
- Werner, S.; Kellner, M.; Schenk, E.; Weigert, G. Just-in-sequence material supply—A simulation based solution in electronics production. Robot. Comput. Manuf. 2003, 19, 107–111. [Google Scholar] [CrossRef]
- Plöger, M.; Haasis, H.-D. Equitably taken just-in-sequence supply in production networks. Z. Wirtsch. Fabrikbetrieb 2008, 103, 613–615. [Google Scholar] [CrossRef]
- Tamás, P. Innovative Business Model for Realization of Sustainable Supply Chain at the Outsourcing Examination of Logistics Services. Sustainability 2018, 10, 210. [Google Scholar]
- Lage, M.; Filho, G. Variations of the Kanban system: Literature review and classification. Int. J. Prod. Econ. 2010, 125, 13–21. [Google Scholar] [CrossRef]
- Berry, D.; Naim, M. Quantifying the relative improvements of redesign strategies in a P.C. supply chain. Int. J. Prod. Econ. 1996, 46, 181–196. [Google Scholar] [CrossRef]
- Rodrigue, J.-P.; Rodrigue, J. Freight, Gateways and Mega-Urban Regions: The Logistical Integration of The Bostwash Corridor1. Tijdschr. Econ. Soc. Geogr. 2004, 95, 147–161. [Google Scholar] [CrossRef]
- Chang, T.-S.; Wan, Y.-W.; Ooi, W.T. A stochastic dynamic traveling salesman problem with hard time windows. Eur. J. Oper. Res. 2009, 198, 748–759. [Google Scholar] [CrossRef]
- Korpela, J.; Lehmusvaara, A. A customer oriented approach to warehouse network evaluation and design. Int. J. Prod. Econ. 1999, 59, 135–146. [Google Scholar] [CrossRef]
- Aksoy, A.; Öztürk, N.; Aksoy, A. Supplier selection and performance evaluation in just-in-time production environments. Expert Syst. Appl. 2011, 38, 6351–6359. [Google Scholar] [CrossRef]
- Milgate, M. Supply chain complexity and delivery performance: An international exploratory study. Supply Chain Manag. Int. J. 2001, 6, 106–118. [Google Scholar] [CrossRef]
- D’Amours, S.; Montreuil, B.; Lefrançois, P.; Soumis, F. Networked manufacturing: The impact of information sharing. Int. J. Prod. Econ. 1999, 58, 63–79. [Google Scholar] [CrossRef]
- Vachon, S.; Klassen, R. An exploratory investigation of the effects of supply chain complexity on delivery performance. IEEE Trans. Eng. Manag. 2002, 49, 218–230. [Google Scholar] [CrossRef]
- Chan, F.T.; Qi, H. Feasibility of performance measurement system for supply chain: A process-based approach and measures. Integr. Manuf. Syst. 2003, 14, 179–190. [Google Scholar] [CrossRef]
- Naso, D.; Surico, M.; Turchiano, B.; Kaymak, U. Genetic algorithms for supply-chain scheduling: A case study in the distribution of ready-mixed concrete. Eur. J. Oper. Res. 2007, 177, 2069–2099. [Google Scholar] [CrossRef]
- Farahani, R.Z.; Elahipanah, M. A genetic algorithm to optimize the total cost and service level for just-in-time distribution in a supply chain. Int. J. Prod. Econ. 2008, 111, 229–243. [Google Scholar] [CrossRef]
- Tsao, Y.-C.; Linh, V.-T.; Lu, J.-C. Closed-loop supply chain network designs considering RFID adoption. Comput. Ind. Eng. 2017, 113, 716–726. [Google Scholar] [CrossRef]
- Addo-Tenkorang, R.; Helo, P.T.; Kantola, J. Concurrent enterprise: A conceptual framework for enterprise supply-chain network activities. Enterp. Inf. Syst. 2017, 11, 474–511. [Google Scholar] [CrossRef]
- Desport, P.; Lardeux, F.; Lesaint, D.; Di Cairano-Gilfedder, C.; Liret, A.; Owusu, G. A combinatorial optimisation approach for closed-loop supply chain inventory planning with deterministic demand. Eur. J. Ind. Eng. 2017, 11, 303. [Google Scholar] [CrossRef] [Green Version]
- Buijs, P.; Danhof, H.W.; Wortmann, J.C. Just-in-Time Retail Distribution: A Systems Perspective on Cross-Docking. J. Bus. Logist. 2016, 37, 213–230. [Google Scholar] [CrossRef] [Green Version]
- Sarraj, R.; Ballot, E.; Pan, S.; Hakimi, D.; Montreuil, B. Interconnected logistic networks and protocols: Simulation-based efficiency assessment. Int. J. Prod. Res. 2014, 52, 3185–3208. [Google Scholar] [CrossRef]
- Sigari, S. Simulating operations process to achieve a hybrid optimal operational performance in supply chain scheduling: A case study. Int. J. Ind. Syst. Eng. 2016, 23, 254. [Google Scholar] [CrossRef]
- Srinivasan, S.; Sharma, A.K.; Khan, S.H. Modelling and optimization of defective goods supply chain network with heuristics. Int. J. Oper. Quant. Manag. 2016, 22, 177–187. [Google Scholar]
- Ghasimi, S.A.; Ramli, R.; Saibani, N. A genetic algorithm for optimizing defective goods supply chain costs using JIT logistics and each-cycle lengths. Appl. Math. Model. 2014, 38, 1534–1547. [Google Scholar] [CrossRef]
- Euchi, J.; Yassine, A.; Chabchoub, H. The dynamic vehicle routing problem: Solution with hybrid metaheuristic approach. Swarm Evol. Comput. 2015, 21, 41–53. [Google Scholar] [CrossRef]
- Ahmadizar, F.; Zeynivand, M. Bi-objective supply chain planning in a fuzzy environment. J. Intell. Fuzzy Syst. 2014, 26, 153–164. [Google Scholar] [CrossRef]
- Mishra, P.; Sharma, R.K. A hybrid framework based on SIPOC and Six Sigma DMAIC for improving process dimensions in supply chain network. Int. J. Qual. Reliab. Manag. 2014, 31, 522–546. [Google Scholar] [CrossRef]
- Beheshti, H.M. A decision support system for improving performance of inventory management in a supply chain network. Int. J. Prod. Perform. Manag. 2010, 59, 452–467. [Google Scholar] [CrossRef]
- Qu, T.; Huang, G.Q.; Chen, X.; Chen, H.P. Extending analytical target cascading for optimal supply chain network configuration of a product family. Int. J. Comput. Integr. Manuf. 2009, 22, 1012–1023. [Google Scholar] [CrossRef]
- Li, Y.; Huang, X. A One-Vendor Multiple-Buyer Production-Distribution System: The Value of Vendor Managed Inventory. INFOR: Inf. Syst. Oper. Res. 2015, 53, 13–25. [Google Scholar] [CrossRef]
- Mo, H.; Liu, L.; Xu, L. A power spectrum optimization algorithm inspired by magnetotactic bacteria. Neural Comput. Appl. 2014, 25, 1823–1844. [Google Scholar] [CrossRef]
- Jung, K.S.; Dawande, M.; Geismar, H.N.; Guide, V.D.R., Jr.; Sriskandarajah, C. Supply planning models for a remanufacturer under just-in-time manufacturing environment with reverse logistics. Ann. Oper. Res. 2016, 240, 533–581. [Google Scholar] [CrossRef]
- Sepehri, M. Cost and inventory benefits of cooperation in multi-period and multi-product supply. Sci. Iran. 2011, 18, 731–741. [Google Scholar] [CrossRef] [Green Version]
- Zhang, G.-Y.; He, Y.-W.; Chen, Z.-X. Production planning model and its implementation technology based on J2EE/Web services. Jisuanji Jicheng Zhizao Xitong Comput. Integr. Manuf. Syst. 2006, 12, 357–363. [Google Scholar]
- Kim, H.Y.; McCann, P. Supply chains and locational adjustment in the global automotive industry. Policy Stud. 2008, 29, 255–266. [Google Scholar] [CrossRef]
- Diponegoro, A.; Sarker, B.R. Operations policy for a supply chain system with fixed-interval delivery and linear demand. J. Oper. Res. Soc. 2007, 58, 901–910. [Google Scholar] [CrossRef]
- Schneeweiss, C.; Zimmer, K.; Zimmermann, M. The design of contracts to coordinate operational interdependencies within the supply chain. Int. J. Prod. Econ. 2004, 92, 43–59. [Google Scholar] [CrossRef]
- Samaranayake, P.; Toncich, D. Integration of production planning, project management and logistics systems for supply chain management. Int. J. Prod. Res. 2007, 45, 5417–5447. [Google Scholar] [CrossRef]
- Munson, C.L.; Rosenblatt, M.J.; Rosenblatt, Z. Use and abuse of power in supply chains. IEEE Eng. Rev. 2000, 28, 81–91. [Google Scholar] [CrossRef]
- Sweeting, R.C.; Spring, M. Empowering customers: Portals, supply networks and assemblers. Int. J. Technol. Manag. 2002, 23, 113. [Google Scholar]
- Links, C. Evolution of the IoT as a service. Microw. J. 2017, 60, 52–60. [Google Scholar]
- Birkie, S.E. Operational resilience and lean: In search of synergies and trade-offs. J. Manuf. Technol. Manag. 2016, 27, 185–207. [Google Scholar] [CrossRef]
- Narahari, Y.; Viswanadham, N.; Bhattacharya, R. Design of synchronized supply chains: A six sigma tolerancing approach. IEEE Int. Conf. Robot. Autom. 2000, 2, 1151–1156. [Google Scholar] [CrossRef]
- Phelps, N. Collaborative buyer-supplier relation and the formation of centralised networks. Geoforum 1996, 27, 393–407. [Google Scholar] [CrossRef]
- Viau, M.A.; Trepanier, M.; Baptiste, P. Integration of inventory and transportation decisions in decentralised supply chains. Int. J. Logist. Syst. Manag. 2009, 5, 249. [Google Scholar] [CrossRef]
- Varela, M.L.R.; Putnik, G.D.; Cruz-Cunha, M.M.; Cruz-Cunha, A.M.M. Web-based Technologies Integration for Distributed Manufacturing Scheduling in a Virtual Enterprise. Int. J. Web Portals 2012, 4, 19–34. [Google Scholar] [CrossRef] [Green Version]
- Sepehri, M.; Fayazbakhsh, K. A multi-period and multi-product optimizer for cooperative supply chains. S. Afr. J. Bus. Manag. 2012, 43, 77–92. [Google Scholar] [CrossRef] [Green Version]
- Wangphanich, P.; Kara, S.; Kayis, B. Analysis of the bullwhip effect in multi-product, multi-stage supply chain systems–A simulation approach. Int. J. Prod. Res. 2010, 48, 4501–4517. [Google Scholar] [CrossRef]
- Centobelli, P.; Converso, G.; Murino, T.; Santillo, L. Flow shop scheduling algorithm to optimize warehouse activities. Int. J. Ind. Eng. Comput. 2016, 7, 49–66. [Google Scholar] [CrossRef]
- Petering, M.E.; Chen, X.; Hsieh, W.-H. Inventory control with flexible demand: Cyclic case with multiple batch supply and demand processes. Int. J. Prod. Econ. 2019, 212, 60–77. [Google Scholar] [CrossRef]
- Memari, A.; Ahmad, R.; Rahim, A.R.A.; Hassan, A. Optimizing a Just-In-Time logistics network problem under fuzzy supply and demand: Two parameter-tuned metaheuristics algorithms. Neural Comput. Appl. 2017, 30, 3221–3233. [Google Scholar] [CrossRef]
- Lim, A.; Miao, Z.; Rodrigues, B.; Xu, Z. Transshipment Through Crossdocks with Inventory and Time Windows. Lect. Notes Comput. Sci. 2004, 3106, 122–131. [Google Scholar]
- Afrazeh, A.; Zarinozv, I. A conceptual framework for presenting and promoting human resource knowledge sharing in the supply chain as a social network. Int. J. Serv. Econ. Manag. 2010, 2, 227. [Google Scholar] [CrossRef]
- Thomas, A. Globalisation presents threats & opportunities. Labels Label. 2003, 4, 81–88. [Google Scholar]
- Wellesley, L.; Preston, F.; Lehne, J.; Bailey, R. Chokepoints in global food trade: Assessing the risk. Res. Transp. Bus. Manag. 2017, 25, 15–28. [Google Scholar] [CrossRef]
- Dinsdale, E.J.; Bennett, D. Benefits; drawbacks and boundaries to deliver JIT: Re-thinking the UK automotive industry operations supply strategy. Benchmarking 2015, 22, 1081–1095. [Google Scholar] [CrossRef]
- Perez, M.P.; Sanchez, A.M. Learning and technological cooperation: The case of the Opel-GM related supply base. Int. J. Automot. Technol. Manag. 2002, 2, 305. [Google Scholar] [CrossRef]
- Manenti, F.; Rovaglio, M. Market-driven operational optimization of industrial gas supply chains. Comput. Chem. Eng. 2013, 56, 128–141. [Google Scholar] [CrossRef]
- Tsigkas, A. Open lean electricity supply communities: A paradigm shift for mass customizing electricity markets. Energy Syst. 2011, 2, 407–422. [Google Scholar] [CrossRef]
- Fernie, J.; Pfab, F.; Marchant, C. Retail Grocery Logistics in the UK. Int. J. Logist. Manag. 2000, 11, 83–90. [Google Scholar] [CrossRef]
- Kisperska-Moroñ, D. Warehousing conditions for holding inventory in Polish supply chains. Int. J. Prod. Econ. 1999, 59, 123–128. [Google Scholar] [CrossRef]
- Hancké, B. Trust or Hierarchy? Changing Relationships Between Large and Small Firms in France. Small Bus. Econ. 1998, 11, 237–252. [Google Scholar] [CrossRef]
- Adrodegari, F.; Bacchetti, A.; Pinto, R.; Pirola, F.; Zanardini, M. Engineer-to-order (ETO) production planning and control: An empirical framework for machinery-building companies. Prod. Plan. Control. 2015, 26, 910–932. [Google Scholar] [CrossRef]
- Rouky, N.; Abourraja, M.N.; Boukachour, J.; Boudebous, D.; Alaoui, A.E.H.; El Khoukhi, F. Simulation optimization based ant colony algorithm for the uncertain quay crane scheduling problem. Int. J. Ind. Eng. Comput. 2019, 10, 111–132. [Google Scholar] [CrossRef]
- Yang, X.-S. Firefly Algorithms for Multimodal Optimization. Lect. Notes Comput. Sci. 2009, 5792, 169–178. [Google Scholar]
- Hatamlou, A. Solving travelling salesman problem using black hole algorithm. Soft Comput. 2018, 22, 8167–8175. [Google Scholar] [CrossRef]
- Banharnsakun, A. Artificial Bee Colony Algorithm for Solving the Knight’s Tour Problem. Adv. Intell. Syst. 2019, 866, 129–138. [Google Scholar] [CrossRef]
- Mo, J.P.; Cook, M. Quantitative lifecycle risk analysis of the development of a just-in-time transportation network system. Adv. Eng. Inform. 2018, 36, 76–85. [Google Scholar] [CrossRef]
- Kowalski, P.A.; Łukasik, S.; Charytanowicz, M.; Kulczycki, P. Nature inspired clustering—Use cases of krill herd algorithm and flower pollination algorithm. Stud. Comp. Intell. 2019, 794, 83–98. [Google Scholar] [CrossRef]
- Yang, X.-S. A New Metaheuristic Bat-Inspired Algorithm. Inform. Fokus 2010, 284, 65–74. [Google Scholar]
- Pinto, P.C.; Runkler, T.A.; Sousa, J.M.C. Wasp Swarm Algorithm for Dynamic MAX-SAT Problems. Lect. Notes Comput. Sci. 2007, 4431, 350–357. [Google Scholar]
- Kennedy, J. Thinking is Social—Experiments with the Adaptive Culture Model. J. Conflict Resolut. 1998, 42, 56–76. [Google Scholar] [CrossRef]
- Nasser, A.B.; Zamli, K.Z. Self-adaptive population size strategy based on flower pollination algorithm for T-way test suite generation. Adv. Intell. Syst. 2019, 843, 240–248. [Google Scholar] [CrossRef]
- Abdel-Basset, M.; Shawky, L.A. Flower pollination algorithm: A comprehensive review. Artif. Intell. Rev. 2018. [Google Scholar] [CrossRef]
- Binh, H.T.T.; Hanh, N.T.; Van Quan, L.; Dey, N. Improved Cuckoo Search and Chaotic Flower Pollination optimization algorithm for maximizing area coverage in Wireless Sensor Networks. Neural Comput. Appl. 2018, 30, 2305–2317. [Google Scholar] [CrossRef]
- Kabir, M.N.; Ali, J.; Alsewari, A.A.; Zamli, K.Z. An adaptive flower pollination algorithm for software test suite minimization. In Proceedings of the 3rd International Conference on Electrical Information and Communication Technology, Khulna, Bangladesh, 7–9 December 2017; Volume 134453, pp. 1–5. [Google Scholar]
- Bekdaş, G.; Nigdeli, S.M.; Yang, X.-S. Sizing optimization of truss structures using flower pollination algorithm. Appl. Soft Comput. 2015, 37, 322–331. [Google Scholar] [CrossRef]
- MiarNaeimi, F.; Azizyan, G.; Rashki, M. Multi-level cross entropy optimizer (MCEO): An evolutionary optimization algorithm for engineering problems. Eng. Comput. 2018, 34, 719–739. [Google Scholar] [CrossRef]
- Platt, G. Application of the flower pollination algorithm in nonlinear algebraic systems with multiple solutions. In Engineering Optimization 2014; Informa UK Limited: London, UK, 2014; Volume 115689, pp. 117–121. [Google Scholar]
- Basset, M.A.; Zhou, Y. An elite opposition-flower pollination algorithm for a 0-1 knapsack problem. Int. J. Bio-Inspired Comput. 2018, 11, 46. [Google Scholar] [CrossRef]
- Dubey, H.M.; Pandit, M.; Panigrahi, B.K. A Biologically Inspired Modified Flower Pollination Algorithm for Solving Economic Dispatch Problems in Modern Power Systems. Cogn. Comput. 2015, 7, 594–608. [Google Scholar] [CrossRef]
- Kumar, G.V.N.; Suryakalavathi, M. Optimal power flow with static VAR compensator based on flower pollination algorithm to minimize real power losses. In Proceedings of the Conference on Power, Control, Communication and Computational Technologies for Sustainable Growth, Kurnool, India, 11–12 December 2015; Volume 7503934, pp. 112–116. [Google Scholar] [CrossRef]
- Diab, A.A.Z.; Tolba, M.A.; Tulsky, V.N. A new hybrid PSOGSA algorithm for optimal allocation and sizing of capacitor banks in RDS. In Proceedings of the 2017 IEEE Russia Section Young Researchers in Electrical and Electronic Engineering Conference, Moscow, Russia, 1–3 February 2017; Volume 7910857, pp. 1496–1501. [Google Scholar] [CrossRef]
- Chattopadhyay, S.; Banerjee, S. Optimum power allocation of parallel concatenated convolution turbo code using flower pollination algorithm. In Proceedings of the 2nd International Conference on Control, Instrumentation, Energy and Communication, Kolkata, India, 28–30 January 2016; Volume 7513808, pp. 516–520. [Google Scholar] [CrossRef]
- Rao, M.S.; Babu, A.V.N.; Venkaiah, N. Modified Flower Pollination Algorithm to Optimize WEDM parameters while Machining Inconel-690 alloy. Mater. Today Proc. 2018, 5, 7864–7872. [Google Scholar]
- Zainudin, A.; Sia, C.K.; Ong, P.; Narong, O.L.C.; Nor, N.H.M. Taguchi design and flower pollination algorithm application to optimize the shrinkage of triaxial porcelain containing palm oil fuel ash. IOP Conf. Ser. Mater. Sci. Eng. 2017, 165, 12036. [Google Scholar] [CrossRef] [Green Version]
- Abdel-Basset, M.; El-Shahat, D.; El-Henawy, I.; Sangaiah, A.K. A modified flower pollination algorithm for the multidimensional knapsack problem: Human-centric decision making. Soft Comput. 2018, 22, 4221–4239. [Google Scholar] [CrossRef]
- Rajamohana, S.P.; Umamaheswari, K.; Abirami, B. Adaptive binary flower pollination algorithm for feature selection in review spam detection. In Proceedings of the IEEE International Conference on Innovations in Green Energy and Healthcare Technologies, Coimbatore, India, 16–18 March 2017; Volume 8094094. [Google Scholar] [CrossRef]
- Wang, C.; Sun, H.X.; Yang, J.S.; Zhang, H.; Zong, Y.; Liang, H.P. Calculation of maximum permitted capacity of photovoltaic based on flower pollination algorithm combined with genetic algorithm (GA-FPA) in distribution network. IOP Conf. Ser. Earth Environ. Sci. 2018, 188, 012081. [Google Scholar] [CrossRef]
- Peesapati, R.; Yadav, V.K.; Kumar, N. Flower pollination algorithm based multi-objective congestion management considering optimal capacities of distributed generations. Energy 2018, 147, 980–994. [Google Scholar] [CrossRef]
- Alyasseri, Z.A.A.; Khader, A.T.; Al-Betar, M.A.; Awadallah, M.; Yang, X.-S. Variants of the Flower Pollination Algorithm: A Review. Stud. Comput. Intell. 2018, 744, 91–118. [Google Scholar] [CrossRef]
- Cui, W.; He, Y. Biological Flower Pollination Algorithm with Orthogonal Learning Strategy and Catfish Effect Mechanism for Global Optimization Problems. Math. Probl. Eng. 2018, 2018, 6906295. [Google Scholar] [CrossRef]
- Digalakis, J.G.; Margaritis, K.G. On benchmarking functions for genetic algorithms. Int. J. Comp. Math. 2007, 77, 481–506. [Google Scholar] [CrossRef]
- Garg, V.; Deep, K. Performance of Laplacian Biogeography-Based Optimization Algorithm on CEC 2014 continuous optimization benchmarks and camera calibration problem. Swarm Evol. Comput. 2016, 27, 132–144. [Google Scholar] [CrossRef]
- Zhou, X.J.; Gao, D.Y.; Yang, C.H. Global solutions to a class of CEC benchmark constrained optimization problems. Optim. Lett. 2016, 10, 457–472. [Google Scholar] [CrossRef]
- Liao, T.; Molina, D.; De Oca, M.A.M.; Stützle, T. A Note on Bound Constraints Handling for the IEEE CEC’05 Benchmark Function Suite. Evol. Comput. 2014, 22, 351–359. [Google Scholar] [CrossRef] [PubMed]
- Liao, T.J.; de Oca, M.A.M.; Stutzle, T. Computational results for an automatically tuned CMA-ES with increasing population size on the CEC’05 benchmark set. Soft Comput. 2013, 17, 1031–1046. [Google Scholar] [CrossRef]
- Bányai, T.; Tamás, P.; Illés, B.; Stankevičiūtė, Ž.; Bányai, Á. Optimization of Municipal Waste Collection Routing: Impact of Industry 4.0 Technologies on Environmental Awareness and Sustainability. Int. J. Environ. Res. Public Heal. 2019, 16, 634. [Google Scholar] [Green Version]
- Larsen, A.W.; Vrgoc, M.; Christensen, T.H.; Lieberknecht, P. Diesel consumption in waste collection and transport and its environmental significance. Waste Manag. Res. 2009, 27, 652–659. [Google Scholar] [CrossRef] [PubMed]
- Cedillo-Campos, M.G.; Ruelas, D.M.; Lizarraga-Lizarraga, G.; Gonzalez-Feliu, J.; Garza-Reyes, J.A. Decision policy scenarios for just-in-sequence (JIS) deliveries. J. Ind. Eng. Manag. 2017, 10, 581. [Google Scholar] [CrossRef]
- Wagner, S.M.; Silveira-Camargos, V. Decision model for the application of just-in-sequence. Int. J. Prod. Res. 2011, 49, 5713–5736. [Google Scholar] [CrossRef]
- Heinecke, G.; Lamparter, S.; Lepratti, R.; Kunz, A. Advanced supply chain information for rule-based sequence adaptions on a mixed-model assembly line with unreliable just-in-sequence deliveries. IFAC Proc. 2013, 46, 1902–1907. [Google Scholar] [CrossRef]
- Hüttmeir, A.; De Treville, S.; Van Ackere, A.; Monnier, L.; Prenninger, J. Trading off between heijunka and just-in-sequence. Int. J. Prod. Econ. 2009, 118, 501–507. [Google Scholar] [CrossRef]
- Gottsauner, B. RFID systems in just-in-sequence production. AutoTechnology 2007, 7, 48–51. [Google Scholar]
- Meissner, S. Controlling just-in-sequence flow-production. Logist. Res. 2010, 2, 45–53. [Google Scholar] [CrossRef]
- Wildemann, H.; Faust, P. Just-in-sequence audits towards partnership-based optimization of processes in the automotive industry. Z. Wirtsch. Fabr. 2004, 99, 157–161. [Google Scholar] [CrossRef]
- Wagner, S.M.; Silveira-Camargos, V. Managing Risks in Just-In-Sequence Supply Networks: Exploratory Evidence from Automakers. IEEE Trans. Eng. Manag. 2012, 59, 52–64. [Google Scholar] [CrossRef]
- Yang, B.; Li, H. A novel dynamic timed fuzzy Petri nets modeling method with applications to industrial processes. Expert Syst. Appl. 2018, 97, 276–289. [Google Scholar] [CrossRef]
- Deng, Z.; Zhang, J.; He, T. Automatic Combination Technology of Fuzzy CPN for OWL-S Web Services in Supercomputing Cloud Platform. Int. J. Pattern Recognit. Artif. Intell. 2017, 31, 1759010. [Google Scholar] [CrossRef]
- Kota, L. Optimization of the supplier selection problem using discrete firefly algorithm. Adv. Logist. Syst. 2012, 6, 10–20. [Google Scholar]
- Kota, L. Optimisation of Large Scale Maintenance Networks with Evolutionary Programming. In DAAAM International Scientific Book 2011; DAAAM International: Vienna, Austria, 2011; Volume 11, pp. 495–512. [Google Scholar]
Figure 1.
Classification of articles considering subject areas based on search in Scopus database using “just in time” AND “supply” AND “network” keywords.
Figure 1.
Classification of articles considering subject areas based on search in Scopus database using “just in time” AND “supply” AND “network” keywords.

Figure 2.
Classification of articles by year of publication.

Figure 3.
Classification of articles considering the used keywords.

Figure 4.
The 10 most cited articles based on search in Scopus database [10,11,12,13,14,15,16,17,18,19].

Figure 5.
The main directions of related research from models and methods, research fields, case studies and objectives point of views [10,11,12,13,14,15,16,17,18,19,20,21,22,23,24,25,26,27,28,29,30,31,32,33,34,35,36,37,38,39,40,41,42,43,44,45,46,47,48,49,50,51,52,53,54,55,56,57,58,59,60,61,62,63].

Figure 6.
Supply chain process of engineer-to-order type products including just-in-sequence supply.
Figure 6.
Supply chain process of engineer-to-order type products including just-in-sequence supply.

Figure 7.
The model of a single source solution (one sequence is supplied by one supplier).

Figure 8.
Flowchart with the main phases of the flower pollination algorithm.

Figure 9.
Pseudocode of the implementation of flower pollination algorithm.

Figure 10.
Impact of the available amount of components on the optimal structure of suppliers and total purchasing cost.
Figure 10.
Impact of the available amount of components on the optimal structure of suppliers and total purchasing cost.

Figure 11.
Impact of the available amount of components on supplied subsequences.

Figure 12.
Impact of the available transportation capacity on the optimal structure of suppliers and total purchasing cost.
Figure 12.
Impact of the available transportation capacity on the optimal structure of suppliers and total purchasing cost.

Figure 13.
Impact of the available transportation capacity on supplied subsequences.

Figure 14.
Impact of time restrictions at the suppliers on the optimal structure of suppliers and the total purchasing cost.
Figure 14.
Impact of time restrictions at the suppliers on the optimal structure of suppliers and the total purchasing cost.

Figure 15.
Impact of time restrictions and transportation capacities on the total purchasing cost.

Figure 16.
Impact of time restrictions and transportation capacities on the total number of supplied subsequences.
Figure 16.
Impact of time restrictions and transportation capacities on the total number of supplied subsequences.


Table 1.
Significant application fields of flower pollination algorithm.
| Scientific Field | Application Examples |
|---|---|
| Computer Science | |
| Engineering | |
| Mathematics | |
| Energy | |
| Physics and Astronomy | |
| Materials Science | |
| Decision Science | |
| Environmental Science |
Table 2.
Performance evaluation of flower pollination algorithm based on error value after 200 iteration steps.
Table 2.
Performance evaluation of flower pollination algorithm based on error value after 200 iteration steps.
| Benchmarking Function | BHA | BHA/DSR 1 | SFPA 2 | FPAwFPS 3 |
|---|---|---|---|---|
| 4.24 × 10⁻⁴ | 1.48 × 10⁻⁵ | 3.12 × 10⁻⁵ | 2.49 × 10⁻⁵ | |
| 3.24 × 10⁻² | 3.24 × 10⁻² | 2.01 × 10⁻³ | 1.41 × 10⁻³ | |
| 3.56 × 10⁻⁹ | 3.56 × 10⁻³ | 5.61 × 10⁻⁴ | 2.90 × 10⁻⁶ | |
| 8.96 × 10⁻⁹ | 7.01 × 10⁻⁹ | 5.50 × 10⁻⁹ | 3.58 × 10⁻⁹ | |
| 2.45 × 10⁻⁶ | 2.32 × 10⁻⁶ | 7.44 × 10⁻⁷ | 8.61 × 10⁻⁷ | |
| 5.50 × 10⁻⁶ | 5.44 × 10⁻⁶ | 9.72 × 10⁻⁷ | 9.65 × 10⁻⁷ |
1 Black hole algorithm with decreased Schwarzschild radius, 2 Standard flower pollination algorithm, 3 Flower pollination algorithm with fitness proportionate selection.
Table 3.
Number of required iteration steps to reach the predefined error value (PEV).
| Benchmarking Function | Problem Size | ||
|---|---|---|---|
| 5 | 10 | 20 | |
| 69% | 100% | 218% | |
| 72% | 100% | 186% | |
| 54% | 100% | 266% | |
| 44% | 100% | 327% | |
Table 4.
Input parameters of the scenarios: the required sequences of the manufacturer.
| Sequence Order | |||||||||
|---|---|---|---|---|---|---|---|---|---|
| 1 | 2 | 3 | 4 | 5 | 6 | 7 | 8 | ||
| Sequence A1 | ToC3 | 1 | 6 | 1 | 4 | 3 | 6 | 1 | 4 |
| RA4 | 10 | 20 | 25 | 25 | 40 | 55 | 75 | 30 | |
| Sequence B2 | ToC | 1 | 2 | 2 | 4 | 5 | 2 | 1 | 3 |
| RA | 30 | 40 | 15 | 60 | 25 | 55 | 40 | 30 | |
1 The upper limit of the supply of sequence A is 12:00. 2 The upper limit of the supply of sequence B is 11:45. 3 ToC: types of components. 4 RA: required amount in pcs.
Table 5.
Input parameters of the scenarios: the suppliers and availability of components required by the manufacturer for sequence A and B.
Table 5.
Input parameters of the scenarios: the suppliers and availability of components required by the manufacturer for sequence A and B.
| Supplier 1 | Supplier 2 | Supplier 3 | Supplier 4 | |||||
|---|---|---|---|---|---|---|---|---|
| AA1 | EAT2 | AA | EAT | AA | EAT | AA | EAT | |
| Component 1 | 40 | 9:00 | 48 | 11:50 | 36 | 8:40 | 60 | 10:35 |
| Component 2 | 60 | 11:50 | 28 | 9:10 | 40 | 10:50 | 48 | 10:20 |
| Component 3 | 44 | 9:10 | 48 | 10:50 | 52 | 9:20 | 20 | 11:55 |
| Component 4 | 24 | 9:25 | 28 | 10:40 | 36 | 11:20 | 80 | 10:25 |
| Component 5 | 48 | 11:40 | 24 | 10:10 | 48 | 10:50 | 24 | 9:40 |
| Component 6 | 20 | 9:55 | 52 | 12:20 | 22 | 9:50 | 58 | 11:40 |
1 AA: available amount. 2 AT: earliest availability time. The upper limit of transportation capacities of suppliers are the followings: 250 pcs for supplier 1, 300 pcs for supplier 2, 250 pcs for supplier 3, 180 pcs for supplier 4.
Table 6.
Input parameters of the scenarios: the specific purchasing cost of components 1.
| Supplier 1 | Supplier 2 | Supplier 3 | Supplier 4 | |
|---|---|---|---|---|
| Component 1 | 1 | 2 | 3 | 4 |
| Component 2 | 9 | 10 | 11 | 12 |
| Component 3 | 17 | 18 | 19 | 20 |
| Component 4 | 24 | 23 | 22 | 21 |
| Component 5 | 16 | 15 | 14 | 13 |
| Component 6 | 8 | 7 | 6 | 5 |
1 The specific purchasing cost is given in €/pcs.
Table 7.
Results of the flower pollination based optimization in the case of the assignment of suppliers to the required sequences 1.
Table 7.
Results of the flower pollination based optimization in the case of the assignment of suppliers to the required sequences 1.
| Supplier 1 | Supplier 2 | Supplier 3 | Supplier 4 | ||
|---|---|---|---|---|---|
| Sequence A | Component 1 | 40 | 26 | 18 | 26 |
| Component 2 | 0 | 0 | 0 | 0 | |
| Component 3 | 22 | 18 | 0 | 0 | |
| Component 4 | 0 | 0 | 18 | 37 | |
| Component 5 | 0 | 0 | 0 | 0 | |
| Component 6 | 0 | 0 | 17 | 58 | |
| Sequence B | Component 1 | 0 | 22 | 18 | 30 |
| Component 2 | 60 | 28 | 22 | 0 | |
| Component 3 | 22 | 8 | 0 | 0 | |
| Component 4 | 0 | 0 | 17 | 43 | |
| Component 5 | 0 | 0 | 1 | 24 | |
| Component 6 | 0 | 0 | 0 | 0 | |
1 In this case the total supply cost is 5920 €.
Table 8.
Calculated emission of collection routes [101].
Table 8.
Calculated emission of collection routes [101].
| Routes | Route Length | Emission | |||||
|---|---|---|---|---|---|---|---|
| CO2 | SO2 | CO | HC | NOX | PM | ||
| Specific emissions in g/liter fuel consumption [102] | - | 2629 | 0.08 | 2.2 | 1.2 | 11.9 | 0.1 |
| Route 1 | 103.056 | 86,698 | 2.63 | 72.56 | 39.58 | 392.44 | 3.29 |
| Route 2 | 118.420 | 99,633 | 3.02 | 83.38 | 45.48 | 450.99 | 3.78 |
| Additional routes | 15.360 | 12,935 | 0.39 | 10.82 | 5.90 | 58.55 | 0.49 |
1 The generated waste volume is given in volume units (VU). 2 HH = Households.
© 2019 by the authors. Licensee MDPI, Basel, Switzerland. This article is an open access article distributed under the terms and conditions of the Creative Commons Attribution (CC BY) license (http://creativecommons.org/licenses/by/4.0/).
Share and Cite
MDPI and ACS Style
Bányai, T.; Illés, B.; Gubán, M.; Gubán, Á.; Schenk, F.; Bányai, Á. Optimization of Just-In-Sequence Supply: A Flower Pollination Algorithm-Based Approach. Sustainability 2019, 11, 3850. https://doi.org/10.3390/su11143850
AMA Style
Bányai T, Illés B, Gubán M, Gubán Á, Schenk F, Bányai Á. Optimization of Just-In-Sequence Supply: A Flower Pollination Algorithm-Based Approach. Sustainability. 2019; 11(14):3850. https://doi.org/10.3390/su11143850
Chicago/Turabian StyleBányai, Tamás, Béla Illés, Miklós Gubán, Ákos Gubán, Fabian Schenk, and Ágota Bányai. 2019. "Optimization of Just-In-Sequence Supply: A Flower Pollination Algorithm-Based Approach" Sustainability 11, no. 14: 3850. https://doi.org/10.3390/su11143850
Note that from the first issue of 2016, this journal uses article numbers instead of page numbers. See further details here.