Efficiency Evaluation of Urban Road Transport and Land Use in Hunan Province of China Based on Hybrid Data Envelopment Analysis (DEA) Models


Abstract
:1. Introduction
2. Related Work
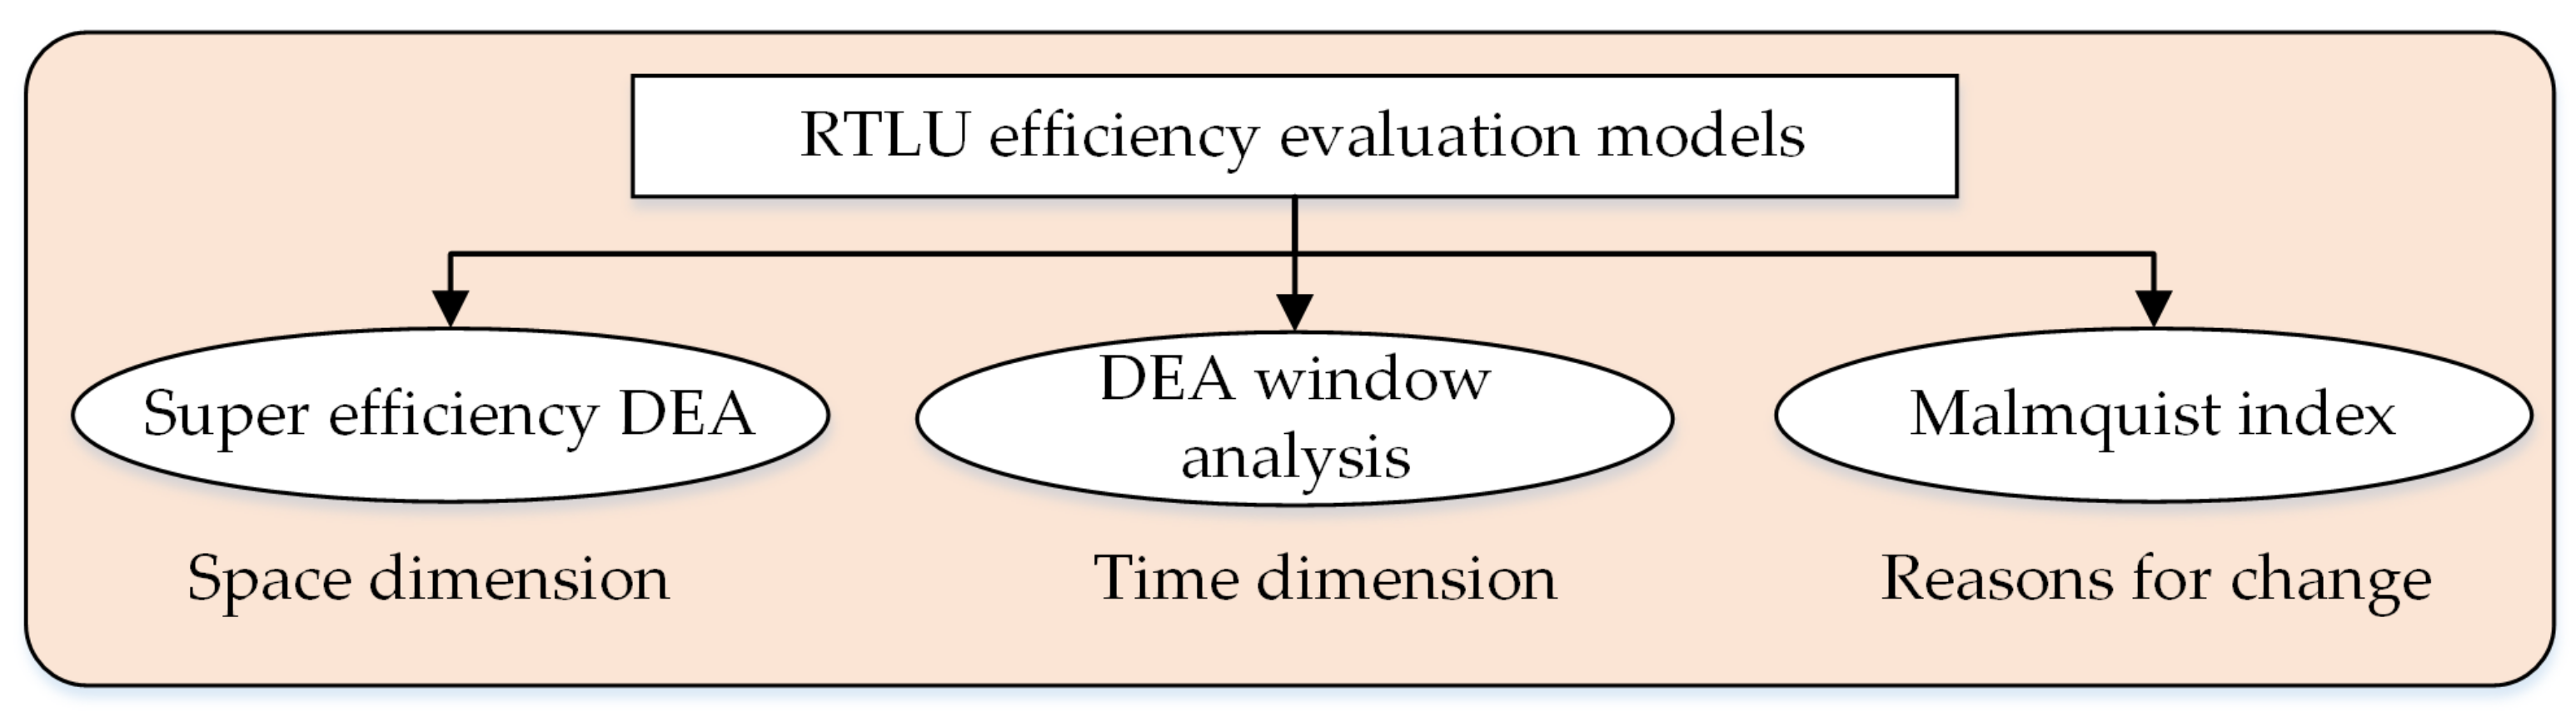
3. Methodology
3.1. Super Efficiency DEA Model
3.2. Window Analysis
3.3. Malmquist Index Analysis
4. Data and Indicators
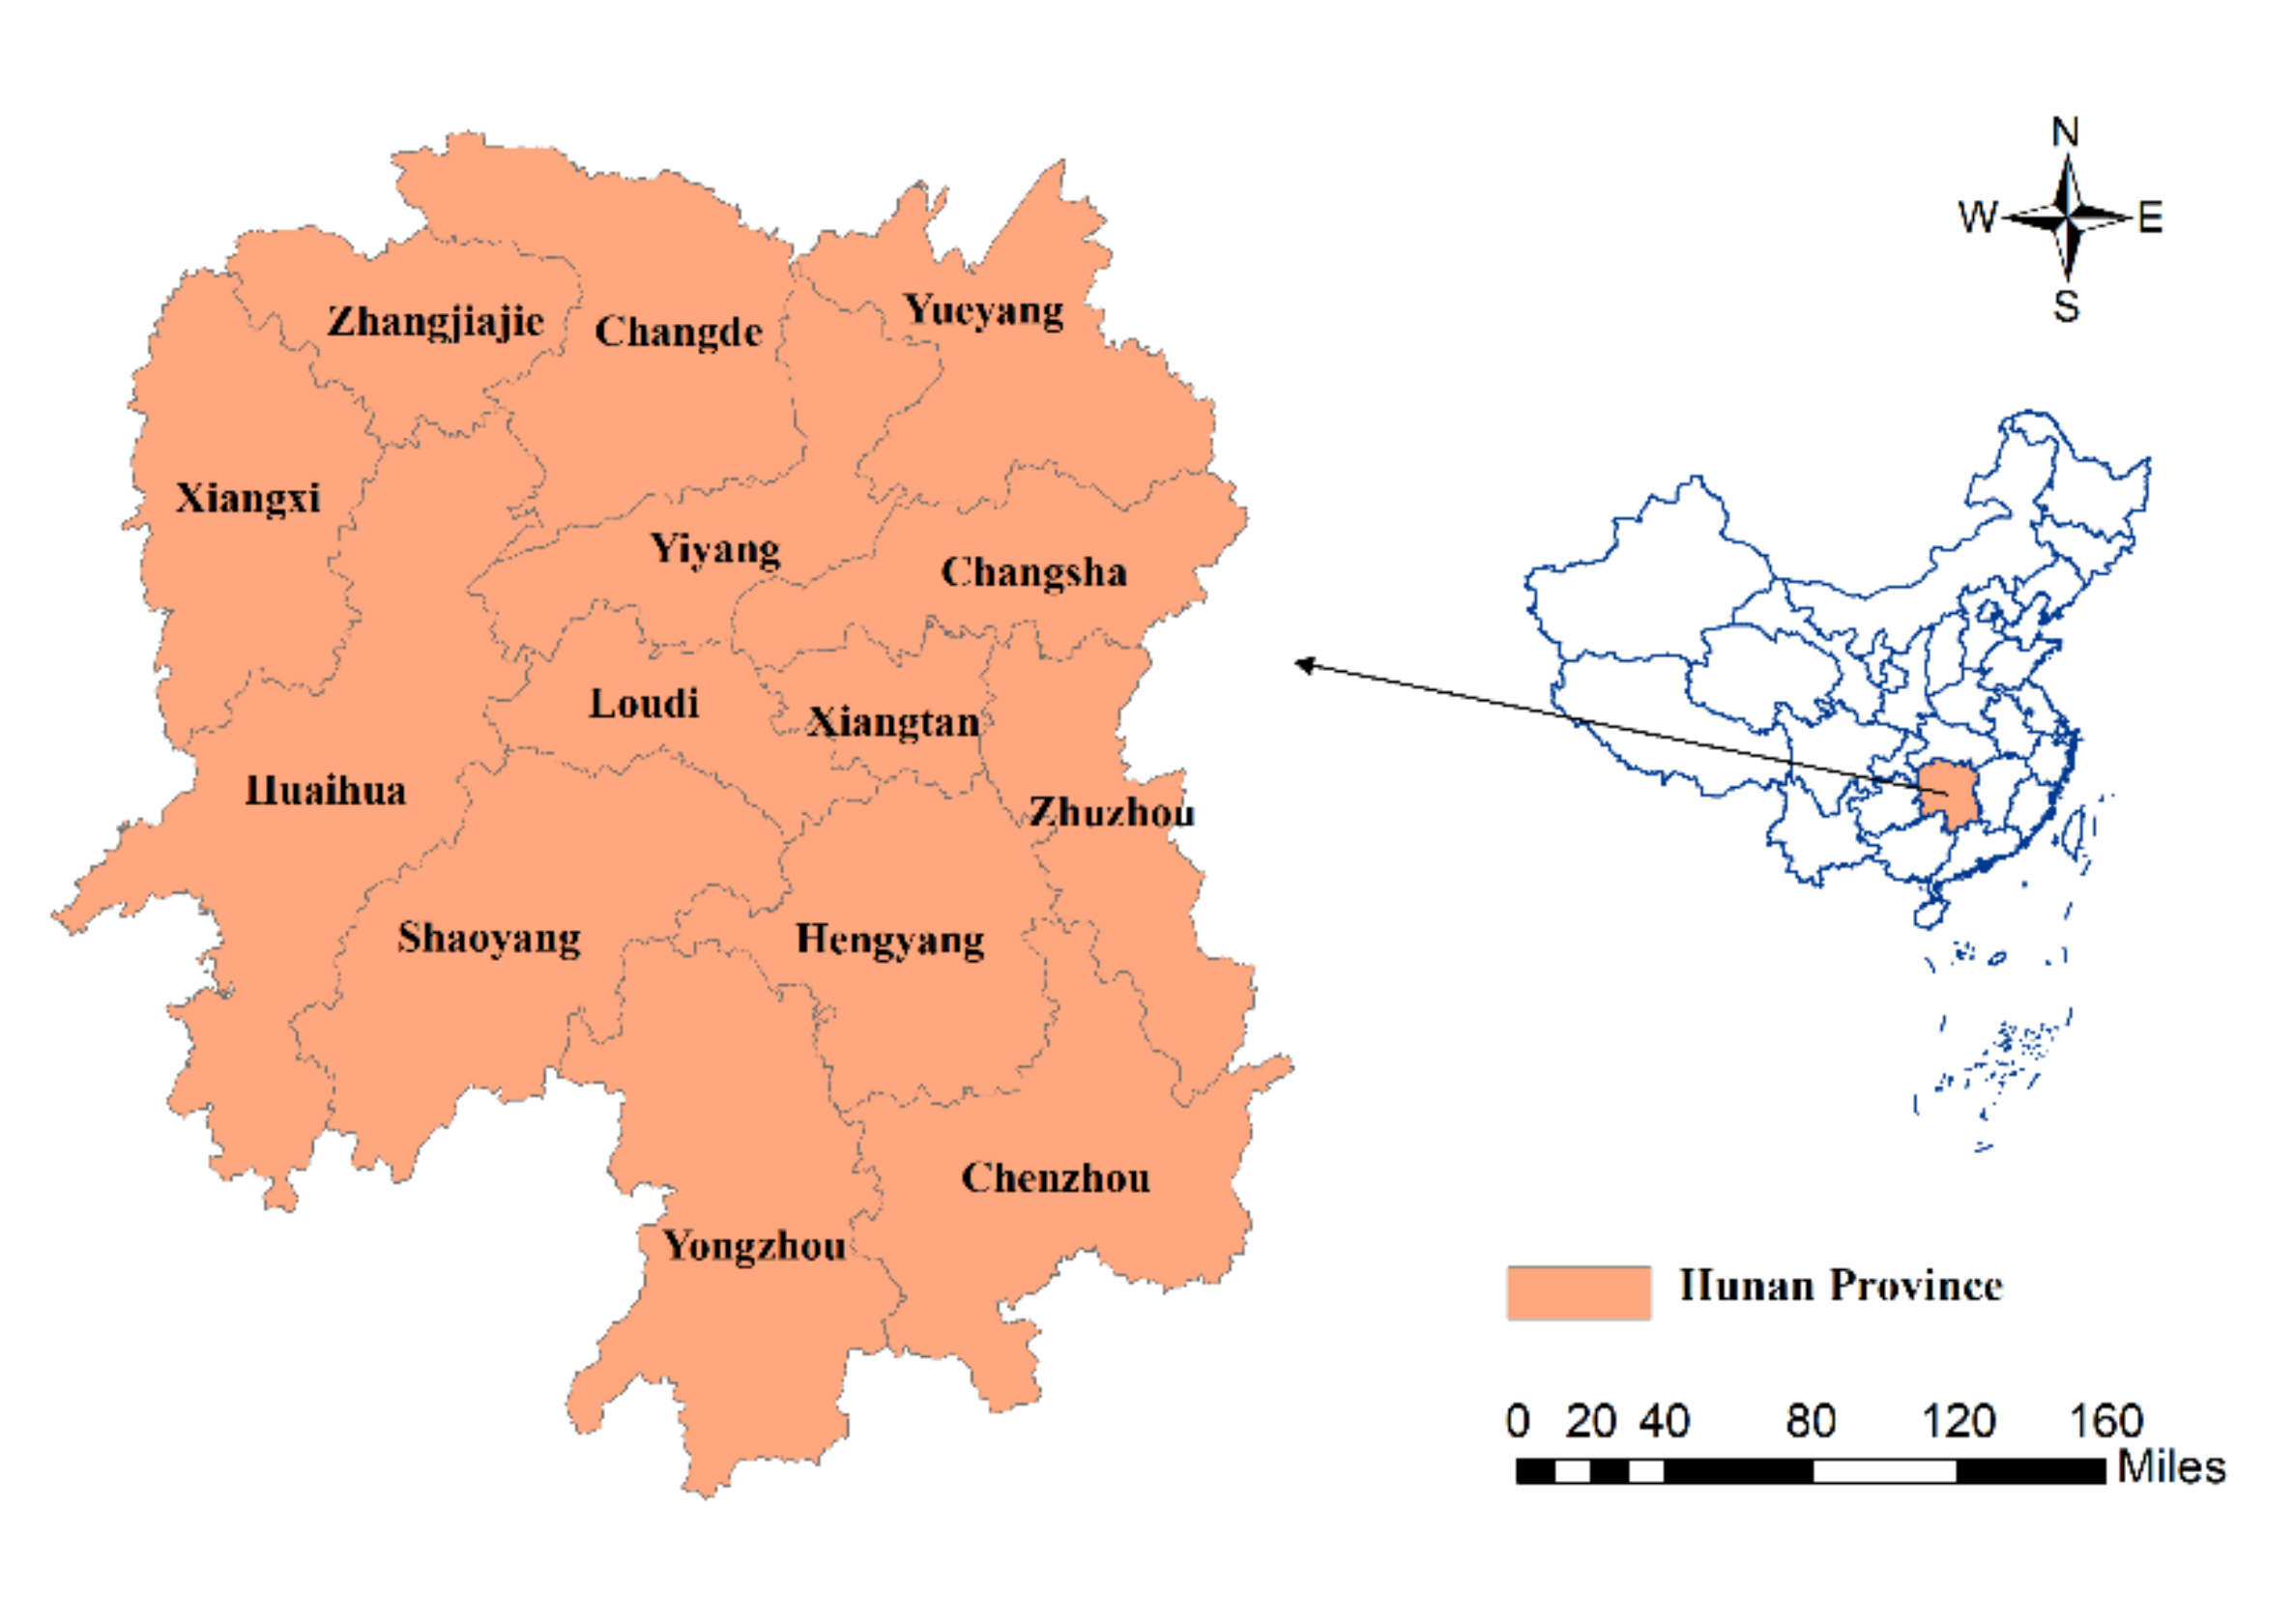
4.1. Study Area and Data
4.2. Indicator System and Data
5. A Case Study of Cities in Hunan Province from 2012 to 2016
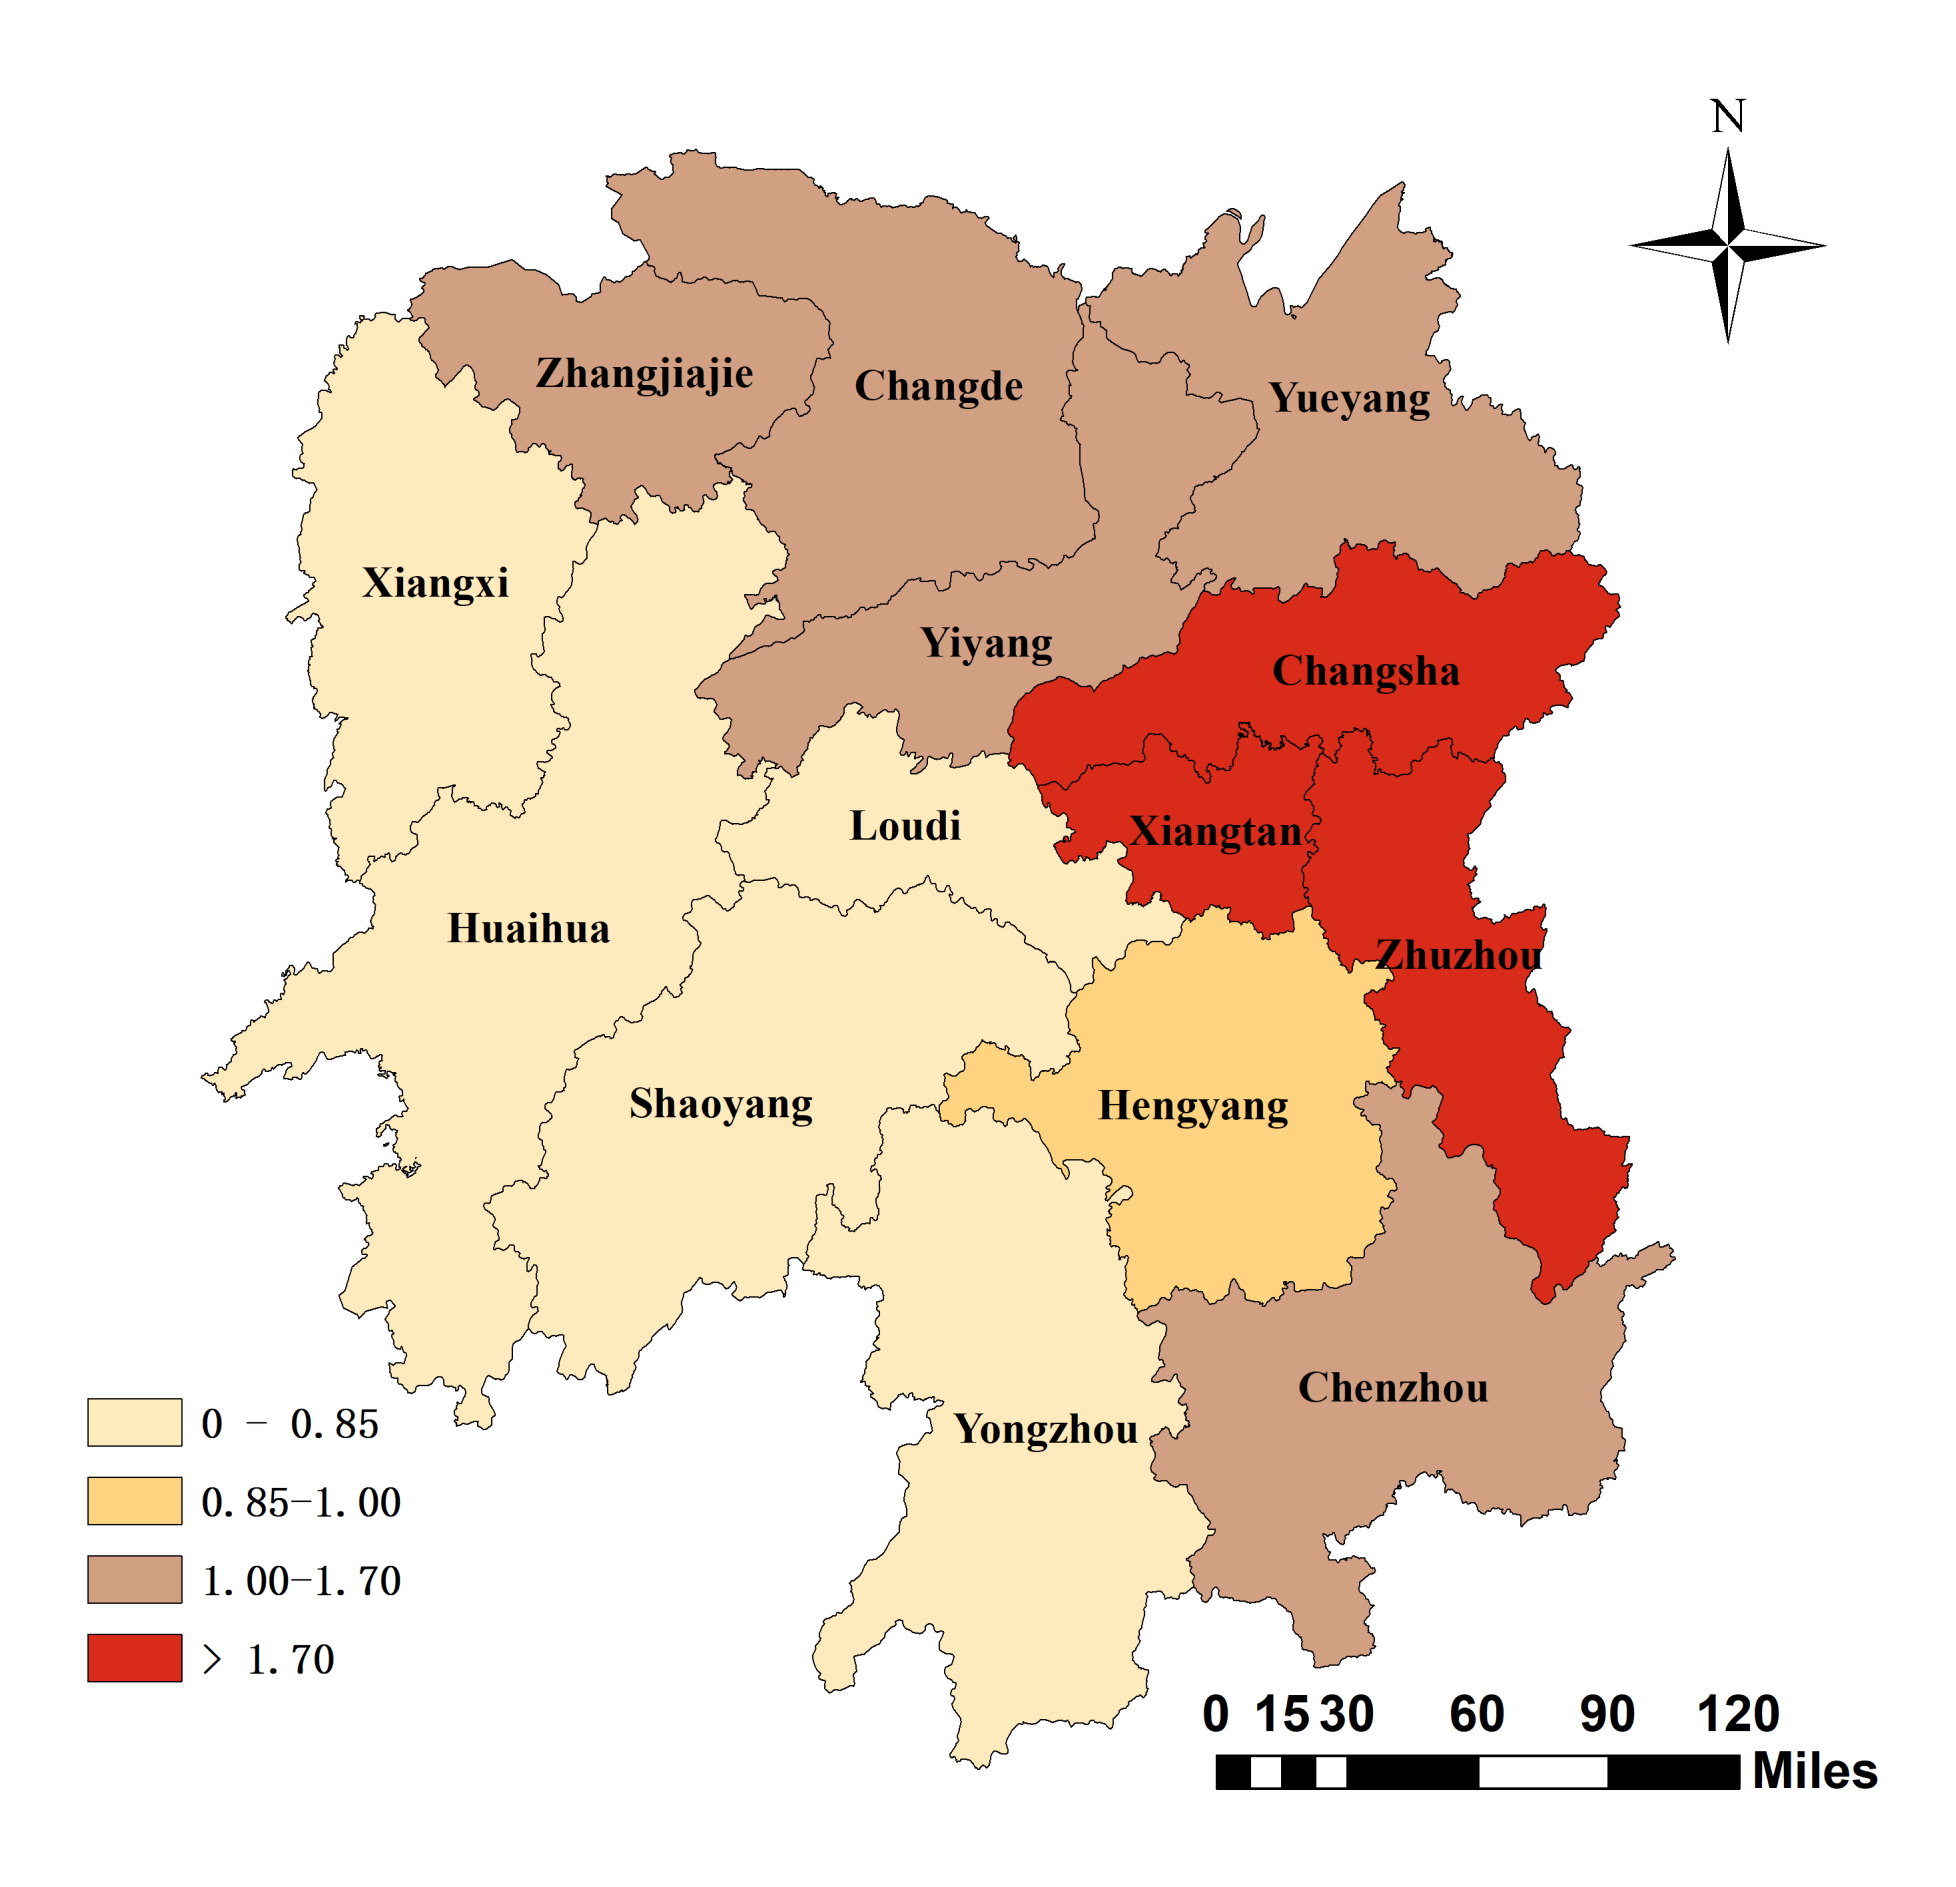
5.1. Efficiency Performance of Different Areas Based on SEDEA
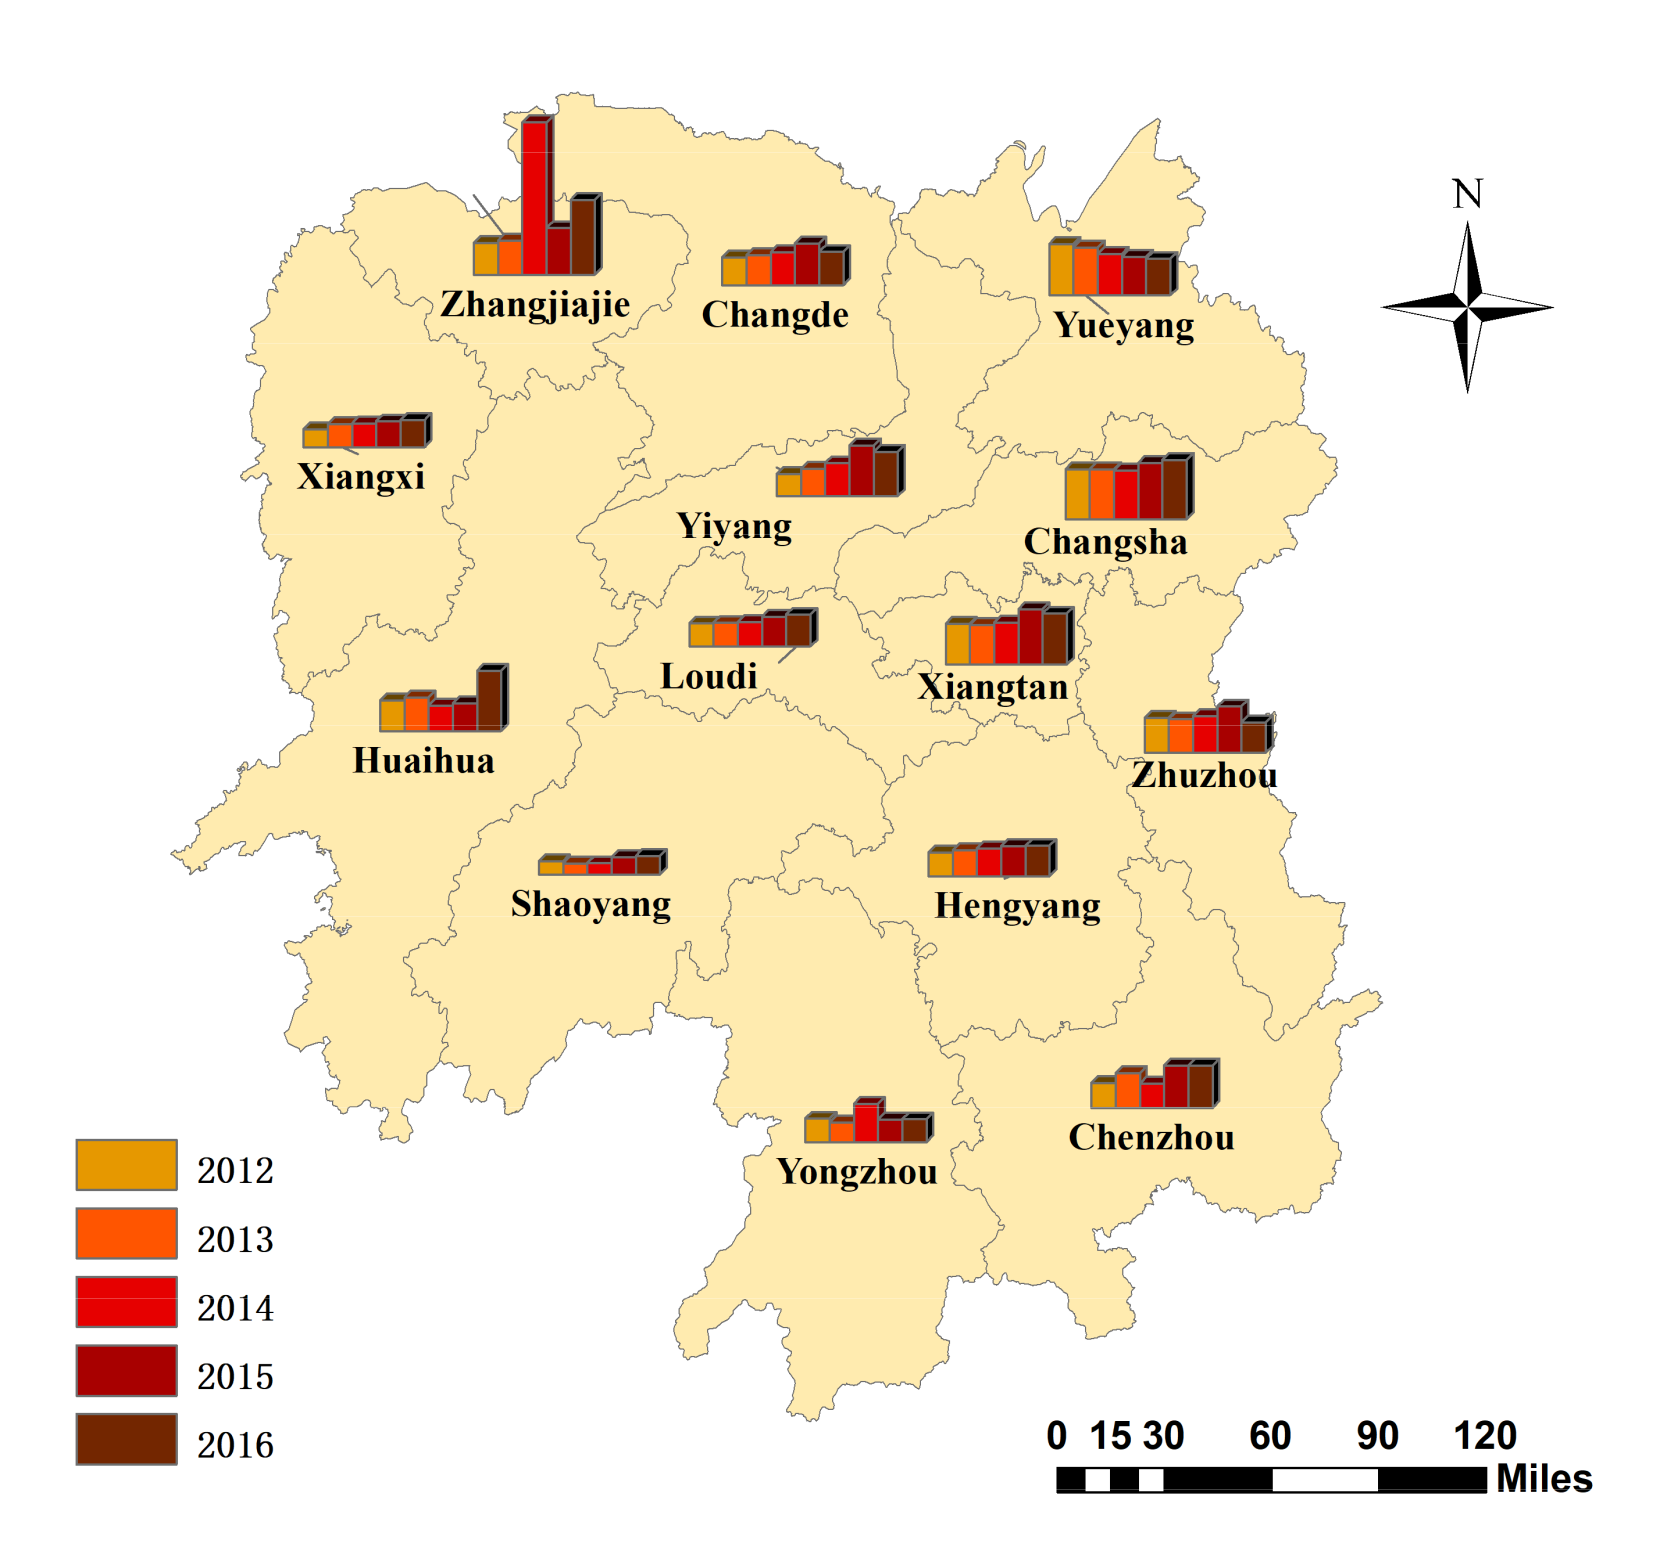
5.2. Dynamic Efficiency Performance Based on Window Analysis
5.3. Efficiency Change Decomposition Based on the Malmquist Index
6. Conclusions
- (1)
- The cities with high RTLU efficiency should continue to rely on their own local road transport and land use resource advantages to create economic benefits.
- (2)
- The western cities with low RTLU efficiency still have great potential for efficiency gains by exploiting their unique natural resources to help with economic growth.
- (3)
- Excessive investment can cause a decline in efficiency, but scientific allocation of resources and improved resource utilization can help sustainable development.
- (4)
- In addition to resource inputs, improvements in management sufficiency and scale utilization are an intangible measure to boost efficiency growth.
Author Contributions
Funding
Acknowledgments
Conflicts of Interest
Appendix A

| Cities | Window | 2012 | 2013 | 2014 | 2015 | 2016 |
|---|---|---|---|---|---|---|
| Changsha | 1 | 1.269 | 1.266 | 1.116 | ||
| 2 | 1.278 | 1.088 | 1.803 | |||
| 3 | 1.527 | 1.047 | 1.502 | |||
| Zhuzhou | 1 | 0.894 | 0.855 | 0.900 | ||
| 2 | 0.851 | 0.906 | 1.239 | |||
| 3 | 0.996 | 1.117 | 0.779 | |||
| Xiangtan | 1 | 1.034 | 1.006 | 1.179 | ||
| 2 | 1.007 | 1.029 | 1.821 | |||
| 3 | 1.005 | 0.992 | 1.299 | |||
| Hengyang | 1 | 0.600 | 0.668 | 0.787 | ||
| 2 | 0.656 | 0.701 | 0.858 | |||
| 3 | 0.629 | 0.665 | 0.773 | |||
| Shaoyang | 1 | 0.339 | 0.277 | 0.286 | ||
| 2 | 0.281 | 0.287 | 0.494 | |||
| 3 | 0.304 | 0.407 | 0.472 | |||
| Yueyang | 1 | 1.307 | 1.212 | 1.092 | ||
| 2 | 1.229 | 1.084 | 1.025 | |||
| 3 | 0.994 | 0.939 | 0.929 | |||
| Changde | 1 | 0.710 | 0.810 | 0.920 | ||
| 2 | 0.733 | 0.853 | 1.181 | |||
| 3 | 0.743 | 0.947 | 0.848 | |||
| Zhangjiajie | 1 | 0.813 | 0.874 | 4.512 | ||
| 2 | 0.871 | 4.512 | 1.379 | |||
| 3 | 2.592 | 1.004 | 1.913 | |||
| Yiyang | 1 | 0.575 | 0.694 | 0.751 | ||
| 2 | 0.713 | 0.863 | 1.270 | |||
| 3 | 0.915 | 1.315 | 1.132 | |||
| Chenzhou | 1 | 0.636 | 0.979 | 0.659 | ||
| 2 | 0.794 | 0.621 | 1.130 | |||
| 3 | 0.588 | 1.034 | 1.078 | |||
| Yongzhou | 1 | 0.595 | 0.515 | 1.493 | ||
| 2 | 0.488 | 0.753 | 0.635 | |||
| 3 | 0.684 | 0.510 | 0.582 | |||
| Huaihua | 1 | 0.779 | 0.792 | 0.646 | ||
| 2 | 0.923 | 0.629 | 0.800 | |||
| 3 | 0.656 | 0.612 | 1.528 | |||
| Loudi | 1 | 0.590 | 0.612 | 0.656 | ||
| 2 | 0.599 | 0.629 | 0.788 | |||
| 3 | 0.608 | 0.731 | 0.812 | |||
| Xiangxi | 1 | 0.463 | 0.557 | 0.599 | ||
| 2 | 0.629 | 0.596 | 0.697 | |||
| 3 | 0.630 | 0.629 | 0.702 |
References
- Hoover, E.M.; Giarratani, F. An Introduction to Regional Economics; Knopf: New York, NY, USA, 1971. [Google Scholar]
- Du, J.; Zhang, Y. Does one belt one road initiative promote Chinese overseas direct investment? China Econ. Rev. 2018, 47, 189–205. [Google Scholar] [CrossRef]
- Dur, F.; Yigitcanlar, T. Assessing land-use and transport integration via a spatial composite indexing model. Int. J. Environ. Sci. Technol. (Tehran) 2015, 12, 803–816. [Google Scholar] [CrossRef]
- Hrelja, R. Integrating transport and land-use planning? How steering cultures in local authorities affect implementation of integrated public transport and land-use planning. Transport. Res. A Policy 2015, 74, 1–13. [Google Scholar] [CrossRef] [Green Version]
- Fan, G.; Zhong, D.; Yan, F.; Yue, P. A hybrid fuzzy evaluation method for curtain grouting efficiency assessment based on an AHP method extended by D numbers. Expert Syst. Appl. 2016, 44, 289–303. [Google Scholar] [CrossRef]
- Barros, C.P.; Wanke, P. An analysis of African airlines efficiency with two-stage TOPSIS and neural networks. J. Air Transp. Manag. 2015, 44, 90–102. [Google Scholar] [CrossRef]
- Kiadaliri, A.A.; Jafari, M.; Gerdtham, U.-G. Frontier-based techniques in measuring hospital efficiency in Iran: A systematic review and meta-regression analysis. BMC Health Serv. Res. 2013, 13, 312. [Google Scholar] [CrossRef]
- Charnes, A.; Cooper, W.W.; Rhodes, E. Measuring the efficiency of decision making units. Eur. J. Oper. Res. 1978, 2, 429–444. [Google Scholar] [CrossRef]
- Ohe, Y. Assessing Managerial Efficiency of Educational Tourism in Agriculture: Case of Dairy Farms in Japan. Sustainability 2017, 9, 1931. [Google Scholar] [CrossRef]
- Mardani, A.; Zavadskas, E.K.; Streimikiene, D.; Jusoh, A.; Khoshnoudi, M. A comprehensive review of data envelopment analysis (DEA) approach in energy efficiency. Renew. Sustain. Energy. Rev. 2017, 70, 1298–1322. [Google Scholar] [CrossRef]
- Marchetti, D.; Wanke, P. Brazil’s rail freight transport: Efficiency analysis using two-stage DEA and cluster-driven public policies. Socio-Econ. Plan. Sci. 2017, 59, 26–42. [Google Scholar] [CrossRef]
- Wolszczak-Derlacz, J. An evaluation and explanation of (in) efficiency in higher education institutions in Europe and the US with the application of two-stage semi-parametric DEA. Res. Policy 2017, 46, 1595–1605. [Google Scholar] [CrossRef]
- Cook, W.D.; Seiford, L.M. Data envelopment analysis (DEA)–Thirty years on. Eur. J. Oper. Res. 2009, 192, 1–17. [Google Scholar] [CrossRef]
- Andersen, P.; Petersen, N.C. A procedure for ranking efficient units in data envelopment analysis. Manage. Sci. 1993, 39, 1261–1264. [Google Scholar] [CrossRef]
- Yang, L.; Ouyang, H.; Fang, K.; Ye, L.; Zhang, J. Evaluation of regional environmental efficiencies in China based on super-efficiency-DEA. Ecol. Indic. 2015, 51, 13–19. [Google Scholar] [CrossRef]
- Mousavi, M.M.; Ouenniche, J.; Xu, B. Performance evaluation of bankruptcy prediction models: An orientation-free super-efficiency DEA-based framework. Int. Rev. Financ. Anal. 2015, 42, 64–75. [Google Scholar] [CrossRef] [Green Version]
- Ab Rahim, R. Ranking of Malaysian commercial banks: super-efficiency data envelopment analysis (DEA) approach. AAMJAF 2015, 11, 123–143. [Google Scholar]
- Qiu, Y.; Sheng, J.; He, X. Evaluation Model of Urban Land Use Efficiency Based on Super-Efficiency-DEA. In Proceedings of the 2016 4th International Conference on Sensors, Mechatronics and Automation (ICSMA 2016), Harbin, China, 7–10 August 2016. [Google Scholar]
- Charnes, A.; Clark, C.T.; Cooper, W.W.; Golany, B. A developmental study of data envelopment analysis in measuring the efficiency of maintenance units in the US air forces. Ann. Oper. Res. 1984, 2, 95–112. [Google Scholar] [CrossRef]
- Asmild, M.; Paradi, J.C.; Aggarwall, V.; Schaffnit, C. Combining DEA window analysis with the Malmquist index approach in a study of the Canadian banking industry. J. Prod. Anal. 2004, 21, 67–89. [Google Scholar] [CrossRef]
- Wang, K.; Yu, S.; Zhang, W. China’s regional energy and environmental efficiency: A DEA window analysis based dynamic evaluation. Math. Comput. Modell. 2013, 58, 1117–1127. [Google Scholar] [CrossRef]
- Cuccia, T.; Guccio, C.; Rizzo, I. UNESCO sites and performance trend of Italian regional tourism destinations: A two-stage DEA window analysis with spatial interaction. Tour. Econ. 2017, 23, 316–342. [Google Scholar] [CrossRef]
- Al-Refaie, A.; Hammad, M.; Li, M.-H. DEA window analysis and Malmquist index to assess energy efficiency and productivity in Jordanian industrial sector. Energy Effic. 2016, 9, 1299–1313. [Google Scholar] [CrossRef]
- Gamassa, P.K.P.O.; Chen, Y. Comparison of port efficiency between Eastern and Western African ports using DEA Window Analysis. In Proceedings of the 2017 International Conference on Service Systems and Service Management, Dalian, China, 16–18 June 2017. [Google Scholar]
- Malmquist, S. Index numbers and indifference surfaces. Trab. Estad. 1953, 4, 209–242. [Google Scholar] [CrossRef]
- Caves, D.W.; Christensen, L.R.; Diewert, W.E. The economic theory of index numbers and the measurement of input, output, and productivity. Econometrica 1982, 50, 1393–1414. [Google Scholar] [CrossRef]
- Fare, R.; Färe, R.; Fèare, R.; Grosskopf, S.; Lovell, C.K. Production Frontiers; Cambridge University Press: Cambridge, UK, 1994. [Google Scholar]
- Färe, R.; Grosskopf, S.; Lindgren, B.; Roos, P. Productivity changes in Swedish pharamacies 1980–1989: A non-parametric Malmquist approach. J. Prod. Anal. 1992, 3, 85–101. [Google Scholar] [CrossRef]
- Mahmoudi, R.; Emrouznejad, A.; Shetab-Boushehri, S.-N.; Hejazi, S.R. The origins, development and future directions of Data Envelopment Analysis approach in transportation systems. Socio-Econ. Plan. Sci. 2018. [Google Scholar] [CrossRef]
- Russo, F.; Rindone, C. Container maritime transport on an international scale: Data envelopment analysis for transhipment port. WIT Trans. Ecology Environ. 2011, 150, 831–843. [Google Scholar] [CrossRef]
- Wey, W.-M.; Huang, J.-Y. The Application of Data Envelopment Analysis for Transportation Planning based on the Viewpoint of Economic Efficiency. JABE 2018, 20. [Google Scholar] [CrossRef]
- Liu, Q.; Wang, S.; Zhang, W.; Li, J.; Zhao, Y.; Li, W. China’s municipal public infrastructure: Estimating construction levels and investment efficiency using the entropy method and a DEA model. Habitat Int. 2017, 64, 59–70. [Google Scholar] [CrossRef]
- Egilmez, G.; McAvoy, D. Benchmarking road safety of US states: A DEA-based Malmquist productivity index approach. Accid. Anal. Prev. 2013, 53, 55–64. [Google Scholar] [CrossRef] [PubMed]
- Fancello, G.; Uccheddu, B.; Fadda, P. Data Envelopment Analysis (DEA) for urban road system performance assessment. Procedia Soc. Behav. Sci. 2014, 111, 780–789. [Google Scholar] [CrossRef]
- Liang, L.T.; Zhao, Q.L.; Chen, C. Analysis on the characters of spatial disparity of urban land use efficiency and its optimization in China. China Land 2013, 27, 48–54. [Google Scholar] [CrossRef]
- Chen, Y.; Chen, Z.; Xu, G.; Tian, Z. Built-up land efficiency in urban China: Insights from the General Land Use Plan (2006–2020). Habitat Int. 2016, 51, 31–38. [Google Scholar] [CrossRef]
- Yang, X.; Wu, Y.; Dang, H. Urban land use efficiency and coordination in China. Sustainability 2017, 9, 410. [Google Scholar] [CrossRef]
- Soria-Lara, J.A.; Aguilera-Benavente, F.; Arranz-López, A. Integrating land use and transport practice through spatial metrics. Transport. Res. A Policy 2016, 91, 330–345. [Google Scholar] [CrossRef]
- Szeto, W.; Jiang, Y.; Wang, D.; Sumalee, A. A sustainable road network design problem with land use transportation interaction over time. Netw. Spat. Econ. 2015, 15, 791–822. [Google Scholar] [CrossRef]
- Acheampong, R.A.; Silva, E. Land use–transport interaction modeling: A review of the literature and future research directions. J. Transp. Land Use 2015, 8, 11–38. [Google Scholar] [CrossRef]
- Zondag, B. Joint Modeling of Land-Use, Transport and Economy. Ph.D. Thesis, Delft University, Delft, The Netherlands, 2007. [Google Scholar]
- Xie, L.; Chen, C.; Yu, Y. Dynamic Assessment of Environmental Efficiency in Chinese Industry: A Multiple DEA Model with a Gini Criterion Approach. Sustainability 2019, 11, 2294. [Google Scholar] [CrossRef]
- Chen, X.; Gao, Y.; An, Q.; Wang, Z.; Neralić, L. Energy efficiency measurement of Chinese Yangtze River Delta’s cities transportation: A DEA window analysis approach. Energy Effic. 2018, 11, 1941–1953. [Google Scholar] [CrossRef]
- Charnes, A.; Cooper, W.W.; Lewin, A.Y.; Seiford, L.M. Data Envelopment Analysis: Theory, Methodology, and Applications; Springer: Berlin, Germany, 1994. [Google Scholar]
- Färe, R.; Grosskopf, S. Malmquist productivity indexes and Fisher ideal indexes. Econ. J. 1992, 102, 158–160. [Google Scholar] [CrossRef]
- Banker, R.D.; Charnes, A.; Cooper, W.W. Some models for estimating technical and scale inefficiencies in data envelopment analysis. Manage. Sci. 1984, 30, 1078–1092. [Google Scholar] [CrossRef]
- Chen, N.; Xu, L.; Chen, Z. Environmental efficiency analysis of the Yangtze River Economic Zone using super efficiency data envelopment analysis (SEDEA) and tobit models. Energy (Oxf.) 2017, 134, 659–671. [Google Scholar] [CrossRef]
- Sueyoshi, T.; Yuan, Y.; Li, A.; Wang, D. Social sustainability of provinces in China: A data envelopment analysis (DEA) window analysis under the concepts of natural and managerial disposability. Sustainability 2017, 9, 2078. [Google Scholar] [CrossRef]
- Zhang, A.; Li, A.; Gao, Y. Social sustainability assessment across provinces in China: An analysis of combining intermediate approach with Data Envelopment Analysis (DEA) window analysis. Sustainability 2018, 10, 732. [Google Scholar] [CrossRef]
- Hunan Provincial Bureau of Statistics. Hunan Statistical Yearbook 2012–2016; China Statistics Press: Beijing, China, 2012–2016. Available online: http://tjj.hunan.gov.cn/tjsj/tjnj/ (accessed on 5 April 2017).
- Hunan Provincial Department of Transportation. Hunan Transportation and Communications Yearbook 2012–2016; Hunan People’s Publishing House: Changsha, China, 2012–2016. [Google Scholar]
- Li, X.; Sun, B. Regional Integration of the Yangtze River Middle Reaches Urban Agglomerations: Measuring and Comparison. Resour. Environ. Yangtze. Basin. 2013, 22, 996–1003. [Google Scholar]
- Musolino, G.; Rindone, C.; Vitetta, A. Evaluation in Transport Planning: A Comparison between Data Envelopment Analysis and Multi Criteria Decision Making Methods. In Proceedings of the 31st Annual European Simulation and Modelling Conference 2017 (ESM 2017), Lisbon, Portugal, 25–27 October 2017; pp. 238–243. [Google Scholar]

| 2012 | 2013 | 2014 | 2015 | 2016 | |
|---|---|---|---|---|---|
| Window 1 | E11 | E12 | E13 | ||
| Window 2 | E21 | E22 | E23 | ||
| Window 3 | E31 | E32 | E33 |
| Types | First Level | Second Level | Third Level |
|---|---|---|---|
| Input Indicators | Road Transport | Capital | Investment in road (X1) |
| Road | Length of road network (X2) | ||
| Labor | Number of transportation employees (X3) | ||
| Land use | Capital | Investment in urban land use (X4) | |
| Land | Expanded built-up area of each city (X5) | ||
| Labor | Total number of employees for land (X6) | ||
| Output indicators | Economy | Urban economy | Second GDP (Y1) |
| Third GDP (Y2) |
| Year | Variable | Road Transport Inputs | Land Use Inputs | Economic Outputs | |||||
|---|---|---|---|---|---|---|---|---|---|
| Capital | Road | Labor | Capital | Land | Labor | Second GDP | Third GDP | ||
| billion RMB | km | 10 k people | billion RMB | km2 | 10 k people | billion RMB | billion RMB | ||
| 2012 | Mean | 15.051 | 16,718.000 | 5.896 | 86.381 | 4.076 | 82.471 | 856.556 | 596.394 |
| Std. dev. | 5.273 | 4899.969 | 3.716 | 59.355 | 2.964 | 49.365 | 859.807 | 584.224 | |
| Max | 26.330 | 22,960.000 | 16.395 | 193.970 | 11.000 | 204.820 | 3592.520 | 2535.080 | |
| Min | 6.880 | 7799.000 | 1.617 | 6.770 | 0.770 | 16.770 | 85.430 | 180.030 | |
| 2013 | Mean | 16.243 | 16,814.000 | 6.088 | 111.078 | 3.062 | 87.009 | 938.913 | 683.459 |
| Std. dev. | 5.044 | 4902.650 | 3.985 | 78.415 | 2.234 | 50.550 | 946.316 | 671.808 | |
| Max | 26.180 | 22,967.000 | 17.541 | 282.550 | 9.650 | 214.910 | 3946.970 | 2911.610 | |
| Min | 8.140 | 7788.000 | 1.619 | 6.700 | 1.080 | 17.620 | 92.890 | 207.140 | |
| 2014 | Mean | 19.929 | 16,874.429 | 6.180 | 139.641 | 3.619 | 89.913 | 1012.802 | 777.581 |
| Std. dev. | 5.576 | 4917.560 | 4.107 | 91.427 | 3.263 | 52.542 | 1017.240 | 755.012 | |
| Max | 28.610 | 23,022.000 | 18.060 | 341.320 | 12.450 | 221.090 | 4241.250 | 3271.660 | |
| Min | 6.880 | 7844.000 | 1.645 | 5.810 | 0.100 | 14.610 | 99.680 | 231.760 | |
| 2015 | Mean | 23.600 | 16,920.286 | 6.079 | 183.819 | 3.860 | 40.176 | 1042.105 | 896.440 |
| Std. dev. | 6.972 | 4926.752 | 4.109 | 127.809 | 5.021 | 28.824 | 1038.181 | 888.753 | |
| Max | 35.090 | 23,053.000 | 18.045 | 437.550 | 20.110 | 130.460 | 4333.580 | 3834.770 | |
| Min | 10.190 | 7844.000 | 1.640 | 18.270 | 0.320 | 8.670 | 101.890 | 262.870 | |
| 2016 | Mean | 30.737 | 17,019.500 | 5.882 | 181.334 | 3.936 | 39.430 | 1070.540 | 1049.474 |
| Std. dev. | 9.309 | 4934.720 | 3.588 | 125.574 | 3.540 | 26.429 | 1078.202 | 1038.844 | |
| Max | 52.390 | 23,166.000 | 16.094 | 457.520 | 11.530 | 120.930 | 4513.280 | 4472.680 | |
| Min | 16.020 | 7892.000 | 1.901 | 18.920 | 0.030 | 8.640 | 104.760 | 284.420 | |
| Cities | 2012 | 2013 | 2014 | 2015 | 2016 | |||||
|---|---|---|---|---|---|---|---|---|---|---|
| Score | Rank | Score | Rank | Score | Rank | Score | Rank | Score | Rank | |
| Changsha | 3.694 | 1 | 3.927 | 1 | 3.405 | 2 | 3.445 | 1 | 3.075 | 1 |
| Zhuzhou | 0.894 | 8 | 0.890 | 8 | 1.028 | 7 | 1.723 | 3 | 0.779 | 10 |
| Xiangtan | 1.373 | 4 | 1.242 | 4 | 1.228 | 4 | 1.904 | 2 | 1.790 | 3 |
| Hengyang | 0.688 | 11 | 0.731 | 10 | 0.787 | 9 | 0.878 | 9 | 0.773 | 11 |
| Shaoyang | 0.587 | 13 | 0.351 | 14 | 0.304 | 14 | 0.494 | 14 | 0.472 | 14 |
| Yueyang | 1.307 | 5 | 1.230 | 5 | 1.102 | 5 | 1.027 | 8 | 0.929 | 7 |
| Changde | 0.972 | 7 | 0.900 | 7 | 0.920 | 8 | 1.181 | 7 | 0.848 | 9 |
| Zhangjiajie | 2.135 | 2 | 2.372 | 2 | 4.996 | 1 | 1.691 | 4 | 2.054 | 2 |
| Yiyang | 0.610 | 12 | 0.794 | 9 | 1.082 | 6 | 1.640 | 5 | 1.490 | 5 |
| Chenzhou | 0.983 | 6 | 1.033 | 6 | 0.659 | 11 | 1.285 | 6 | 1.080 | 6 |
| Yongzhou | 2.096 | 3 | 0.635 | 13 | 1.577 | 3 | 0.635 | 13 | 0.582 | 13 |
| Huaihua | 0.844 | 9 | 1.251 | 3 | 0.709 | 10 | 0.800 | 11 | 1.528 | 4 |
| Loudi | 0.791 | 10 | 0.637 | 12 | 0.656 | 12 | 0.812 | 10 | 0.870 | 8 |
| Xiangxi | 0.515 | 14 | 0.702 | 11 | 0.642 | 13 | 0.697 | 12 | 0.736 | 12 |
| Mean 1 | 1.249 | 1.192 | 1.364 | 1.301 | 1.215 | |||||
| < Mean | 9 | 9 | 11 | 9 | 9 | |||||
| > 1 | 5 | 6 | 7 | 8 | 6 | |||||
| Category | Cities | 2012 | 2013 | 2014 | 2015 | 2016 | Average |
|---|---|---|---|---|---|---|---|
| Group 1 | Changsha | 1.270 | 1.272 | 1.244 | 1.425 | 1.502 | 1.343 |
| Xiangtan | 1.034 | 1.007 | 1.071 | 1.406 | 1.299 | 1.163 | |
| Yueyang | 1.307 | 1.221 | 1.056 | 0.982 | 0.929 | 1.099 | |
| Zhangjiajie | 0.813 | 0.872 | 3.872 | 1.192 | 1.913 | 1.733 | |
| Group 2 | Zhuzhou | 0.894 | 0.853 | 0.934 | 1.178 | 0.779 | 0.927 |
| Hengyang | 0.600 | 0.662 | 0.706 | 0.762 | 0.773 | 0.700 | |
| Shaoyang | 0.339 | 0.279 | 0.292 | 0.450 | 0.472 | 0.366 | |
| Changde | 0.710 | 0.771 | 0.839 | 1.064 | 0.848 | 0.847 | |
| Yiyang | 0.575 | 0.703 | 0.843 | 1.293 | 1.132 | 0.909 | |
| Huaihua | 0.779 | 0.857 | 0.644 | 0.706 | 1.528 | 0.903 | |
| Yongzhou | 0.595 | 0.501 | 0.977 | 0.573 | 0.582 | 0.646 | |
| Huaihua | 0.779 | 0.857 | 0.644 | 0.706 | 1.528 | 0.903 | |
| Loudi | 0.590 | 0.606 | 0.631 | 0.759 | 0.812 | 0.679 | |
| Xiangxi | 0.463 | 0.593 | 0.608 | 0.663 | 0.702 | 0.606 |
| Cities | MI | TEC | TC | PEC | SEC |
|---|---|---|---|---|---|
| Changsha | 1.110 | 1.000 | 1.110 | 1.000 | 1.000 |
| Zhuzhou | 0.967 | 0.966 | 1.002 | 0.971 | 0.995 |
| Xiangtan | 1.225 | 1.000 | 1.225 | 1.000 | 1.000 |
| Hengyang | 1.235 | 1.029 | 1.199 | 1.040 | 0.990 |
| Shaoyang | 1.160 | 0.947 | 1.226 | 0.964 | 0.983 |
| Yueyang | 1.075 | 0.982 | 1.095 | 0.984 | 0.998 |
| Changde | 1.140 | 0.967 | 1.180 | 0.984 | 0.983 |
| Zhangjiajie | 1.278 | 1.000 | 1.278 | 1.000 | 1.000 |
| Yiyang | 1.204 | 1.132 | 1.064 | 1.039 | 1.089 |
| Chenzhou | 1.269 | 1.004 | 1.264 | 1.000 | 1.004 |
| Yongzhou | 1.215 | 0.874 | 1.390 | 0.924 | 0.946 |
| Huaihua | 1.281 | 1.043 | 1.228 | 1.031 | 1.012 |
| Loudi | 1.115 | 1.024 | 1.088 | 1.000 | 1.024 |
| Xiangxi | 1.141 | 1.094 | 1.043 | 1.079 | 1.014 |
| mean | 1.169 | 1.003 | 1.166 | 1.000 | 1.002 |
| Year | MI | TEC | TC | PEC | SEC |
|---|---|---|---|---|---|
| 2012–2013 | 1.123 | 0.969 | 1.159 | 1.025 | 0.945 |
| 2013–2014 | 1.117 | 0.995 | 1.123 | 0.906 | 1.099 |
| 2014–2015 | 1.226 | 1.078 | 1.137 | 1.058 | 1.019 |
| 2015–2016 | 1.215 | 0.972 | 1.25 | 1.019 | 0.953 |
| mean | 1.169 | 1.003 | 1.166 | 1 | 1.002 |
© 2019 by the authors. Licensee MDPI, Basel, Switzerland. This article is an open access article distributed under the terms and conditions of the Creative Commons Attribution (CC BY) license (http://creativecommons.org/licenses/by/4.0/).
Share and Cite
Yang, T.; Guan, X.; Qian, Y.; Xing, W.; Wu, H. Efficiency Evaluation of Urban Road Transport and Land Use in Hunan Province of China Based on Hybrid Data Envelopment Analysis (DEA) Models. Sustainability 2019, 11, 3826. https://doi.org/10.3390/su11143826
Yang T, Guan X, Qian Y, Xing W, Wu H. Efficiency Evaluation of Urban Road Transport and Land Use in Hunan Province of China Based on Hybrid Data Envelopment Analysis (DEA) Models. Sustainability. 2019; 11(14):3826. https://doi.org/10.3390/su11143826
Chicago/Turabian StyleYang, Tingting, Xuefeng Guan, Yuehui Qian, Weiran Xing, and Huayi Wu. 2019. "Efficiency Evaluation of Urban Road Transport and Land Use in Hunan Province of China Based on Hybrid Data Envelopment Analysis (DEA) Models" Sustainability 11, no. 14: 3826. https://doi.org/10.3390/su11143826